mani report 1
DESCRIPTION
project reprt on thermal power plantTRANSCRIPT
PREFACE
A thermal power station is a power plant in which the prime mover is steam driven. Water is heated, turns into steam and spins a steam turbine which either drives an electrical generator or does some other work, like ship propulsion. After it passes through the turbine, the steam is condensed in a condenser and recycled to where it was heated; this is known as a Rankine cycle.
Almost all coal, nuclear, geothermal, solar thermal electric, and waste incineration plants, as well as many natural gas power plants are thermal. Natural gas is frequently combusted in gas turbines as well as boilers.Commercial electric utility power stations are most usually constructed on a very large scale and designed for continuous operation. Electric power plants typically use three-phase or individual-phase electrical generators to produce alternating current (AC) electric power at a frequency of 50 Hz or 60 Hz (hertz, which is an AC sine wave per second) depending on its location in the world.
CONTENTS
1. Introduction¦¦¦¦¦¦¦¦¦¦¦¦¦.022. Need For thermal power generation¦¦..043. Classification¦¦¦¦¦¦¦¦¦¦¦¦..054. Basic definitions¦¦¦¦¦¦¦¦¦¦¦.075. Functioning of thermal power plant¦¦...116. ADVANTAGES¦¦¦¦¦¦¦¦¦¦¦...177. DISADVANTAGES¦¦¦¦¦¦¦¦¦¦188. Future Prospects¦¦¦¦¦¦¦¦¦¦¦199. BIBLIOGRAPHY¦¦¦¦¦¦¦¦¦¦¦21
CHAPTER 1INTRODUCTION
Almost all coal, nuclear, geothermal, solar thermal electric, and waste incineration plants, as well as many natural gas power plants are thermal. Natural gas is frequently combusted in gas turbines as well as boilers. The waste heat from a gas turbine can be used to raise steam, in a combined cycleplant that improves overall efficiency. Power plants burning coal, oil, or natural gas are often referred to collectively as fossil-fuel power plants. Some biomass-fueled thermal power plants have appeared also. Non-nuclear thermal power plants, particularly fossil-fueled plants, which do not usecogeneration, are sometimes referred to as conventional power plants.In thermal power stations, mechanical power is produced by a heat engine that transforms thermal

energy, often from combustion of a fuel, into rotational energy. Most thermal power stations produce steam, and these are sometimes called steam power stations. Not all thermal energy can be transformed into mechanical power, according to the second law of thermodynamics. Therefore, there is always heat lost to the environment. If this loss is employed as useful heat, for industrial processes or district heating, the power plant is referred to as a cogeneration power plant or CHP (combined heat-and-power) plant. In countries where district heating is common, there are dedicated heat plants called heat-only boiler stations. An important class of power stations in the Middle East uses by-product heat for the desalination of water.
Commercial electric utility power stations are most usually constructed on a very large scale and designed for continuous operation. Electric power plants typically use three-phase or individual-phase electrical generators to produce alternating current (AC) electric power at a frequency of 50 Hz or 60 Hz (hertz, which is an AC sine wave per second) depending on its location in the world. Other large companies or institutions may have their own usually smaller power plants to supply heating or electricity to their facilities, especially if heat or steam is created anyway for other purposes. Shipboard steam-driven power plants have been used in various large ships in the past, but these days are used most often in large naval ships. Such shipboard power plants are general lower power capacity than full-size electric company plants, but otherwise have many similarities except that typically the main steam turbines mechanically turn the propulsion propellers, either through reduction gears or directly by the same shaft. The steam power plants in such ships also provide steam to separate smaller turbines driving electric generators to supply electricity in the ship. Shipboard steam power plants can be either conventional or nuclear; the shipboard nuclear plants are mostly in the navy. There have been perhaps about a dozen turbo-electric ships in which a steam-driven turbine drives an electric generator which powers an electric motor for propulsion.Thermal power station is a power plant in which the prime mover is steam driven. Water is heated, turns into steam and spins a steam turbine which either drives an electrical generator or does some other work, like ship propulsion. After it passes through the turbine, the steam is condensed in a condenser and recycled to where it was heated; this is known as a Rankine cycle. The greatest variation in the design of thermal power stations is due to the different fuel sources. Some prefer to use the term energy center because such facilities convert forms of heat energy into electrical energy.HistoryReciprocating steam engines have been used for mechanical power sources since the 18th Century, with notable improvements being made by James Watt. The

very first commercial central electrical generating stations in New York and London, in 1882, also used reciprocating steam engines. As generator sizes increased, eventually turbines took over they encres the hose power.
CHAPTER 2NEED FOR THERMAL POWER GENERATION
Scarcity of water resources: Water resources are not abundantly available and are geographically unevenly distributed. Thus hydel power plants cannot be installed with ease and are limited to certain locations.Widely available alternate flues: Many alternate fuels such as coal, diesel, nuclear fuels, geo-thermal energy sources, solar-energy, biomass fuels can be used to generate power using steam cycles.Maintenance and lubrication cost is lower: Once installed, these require less maintenance costs and on repairs. Lubrication is not a major problem compared to hydel power plant. Coal is abundant: Coal is available in excess quantities in India and is rich form of energy available at relatively lower cost.Working fluid remains within the system, and need not be replaced every time thus simplifies the process.
CHAPTER 3CLASSIFICATION
Thermal power plants are classified by the type of fuel and the type of prime mover Installed.
By fuelNuclear power plants use a nuclear reactor's heat to operate a steam turbine generator. Fossil fuelled power plants may also use a steam turbine generator or in the case of natural gas fired plants may use a combustion turbine. A coal-fired power station produces electricity by burning coal to generate steam, and has the side-effect of producing a large amount of carbon dioxide, which is released from burning coal and contributes to global warmingGeothermal power plants use steam extracted from hot underground rocks. Biomass Fuelled Power Plants may be fuelled by waste from sugar cane, municipal solid waste, landfill methane, or other forms of biomass.Solar thermal electric plants use sunlight to boil water,

which turns the generator.
By prime moverSteam turbine plants use the dynamic pressure generated by expanding steam to turn the blades of a turbineGas turbine plants use the dynamic pressure from flowing gases (air and combustion products) to directly operate the turbine. Combined cycle plants have both a gas turbine fired by natural gas, and a steam boiler and steam turbine which use the hot exhaust gas from the gas turbine to produce electricityReciprocating engines are used to provide power for isolated communities and are frequently used for small cogeneration plants. Hospitals, office buildings, industrial plants, and other critical facilities also use them to provide backup power in case of a power outageMicroturbines, Stirling engine and internal combustion reciprocating engines are low-cost solutions for using opportunity fuels, such as landfill gas, digester gas from water treatment plants and waste gas from oil production
EfficiencyPower is energy per unit time. The power output or capacity of an electric plant can be expressed in units of megawatts electric (MWe). The electric efficiency of a conventional thermal power station, considered as saleable energy (in MWe) produced at the plant busbars as a percent of the heating value of the fuel consumed, is typically 33% to 48% efficient. This efficiency is limited as all heat engines are governed by the laws of thermodynamics (See: Carnot cycle). The rest of the energy must leave the plant in the form of heat. This waste heat can go through a condenser and be disposed of with cooling water or in cooling towers. If the waste heat is instead utilized for district heating, it is called cogeneration. An important class of thermal power station is associated with desalination facilities; these are typically found in desert countries with large supplies of natural gas and in these plants, freshwater production and electricity are equally important co-products.Since the efficiency of the plant is fundamentally limited by the ratio of the absolute temperatures of the steam at turbine input and output, efficiency improvements require use of higher temperature, and therefore higher pressure, steam. Historically, other working fluids such as mercury have been experimentally used in a mercury vapor turbine power plant, since these can attain higher temperatures than water at lower working pressures. However, the obvious hazards of toxicity, and poor heat transfer properties, have ruled out mercury as a working fluid.

CHAPTER 4BASIC DEFINITIONSSteam is vaporized water and can be produced at 100â„¢C at standard atmosphere. In common speech, steam most often refers to the visible white mist that condenses above boiling water as the hot vapor mixes with the cooler air.Turbine A turbine is a rotary engine that extracts energy from a fluid or air flow and converts it into useful work.The simplest turbines have one moving part, a rotor assembly, which is a shaft or drum, with blades attached. Moving fluid acts on the blades, or the blades react to the flow, so that they move and impart rotational energy to the rotor. Early turbine exare windmills and waterwheels.
Fig Typical turbine
Electric generator An electric generator is a device that converts mechanical energy to electrical energy. A generator forces electrons in the windings to flow through the external electrical circuit. It is somewhat analogous to a water pump, which creates a flow of water but does not create the water inside.
Fig Typical Generator
A boiler or steam generator is a device used to create steam by applyingheat energy to water. Although the definitions are somewhat flexible, it can be said that older steam generators were commonly termed boilers and worked at low to medium pressure(1“300 psi/0.069“20.684 bar; 6.895“2,068.427 kPa), but at pressures above this it is more usual to speak of a steam generator.
A boiler or steam generator is used wherever a source of steam is required. The form and size depends on the application: mobile steam engines such as steam locomotives, portable engines and steam-powered road vehicles typically use a smaller boiler that forms an integral part of the vehicle;
Second law of thermodynamics The second law of thermodynamics is an expression of the universal principle of entropy, stating that the entropy of
anisolated system which is not in equilibrium will tend to increase over time, approaching a maximum value at equilibrium; and that the entropy change dSof a system undergoing any infinitesimal reversible process is given by dq / T, where dq is the heat supplied to the system and T is the absolute temperature of the system.
CHAPTER 5FUNCTIONING OF THERMAL POWER PLANT:
In a thermal power plant, one of coal, oil or natural gas is used to heat the boiler to convert the water into steam. The steam is used to turn a turbine, which is connected to a generator. When the turbine turns, electricity is generated and given as output by the generator, which is then supplied to the consumers through high-voltage power lines.
Fig steam power generation “
Typical diagram of a coal-fired thermal power station1. Cooling tower10. Steam Control valve19. Superheater
2. Cooling water pump11. High pressure steam turbine20.Forced draught (draft) fan
3. transmission line (3-phase)12. Deaerator21. Reheater4. Step-up transformer (3-phase)13. Feed water heater22. Combustion air intake
5. Electrical generator (3-phase)14. Coal conveyor23. Economiser
6.Low pressure steam turbine15. Coal hopper24. Air preheater
7. Condensate pump16. Coal pulverizer25. Precipitator
8. Surface condenser17. Boiler steam drum26.Induced draught (draft) fan
9.Intermediate pressure steam turbine18. Bottom ash hopper27. Flue gas stack

Detailed process of power generation in a thermal power plant:Water intake: Firstly, water is taken into the boiler through a water source. If water is available in a plenty in the region, then the source is an open pond or river. If water is scarce, then it is recycled and the same water is used over and over again.Boiler heating: The boiler is heated with the help of oil, coal or natural gas. A furnace is used to heat the fuel and supply the heat produced to the boiler. The increase in temperature helps in the transformation of water into steam.Steam Turbine: The steam generated in the boiler is sent through a steam turbine. The turbine has blades that rotate when high velocity steam flows across them. This rotation of turbine blades is used to generate electricity.Generator: A generator is connected to the steam turbine. When the turbine rotates, the generator produces electricity which is then passed on to the power distribution systems.Special mountings: There is some other equipment like the economizer and air pre-heater. An economizer uses the heat from the exhaust gases to heat the feed water. An air pre-heater heats the air sent into the combustion chamber to improve the efficiency of the combustion process.Ash collection system: There is a separate residue and ash collection system in place to collect all the waste materials from the combustion process and to prevent them from escaping into the atmosphere.Apart from this, there are various other monitoring systems and instruments in place to keep track of the functioning of all the devices. This prevents any hazards from taking place in the plant.
A Rankine cycle with a two-stage steam turbine and a single feedwater heater.
The second law of thermodynamics states that any closed-loop cycle can only convert a fraction of the heat produced during combustion into mechanical work. The rest of the heat, called waste heat, must be released into a cooler environment during the return portion of the cycle. The fraction of heat released into a cooler medium must be equal or larger than the ratio ofabsolute temperatures of the cooling system (environment) and the heat source (combustion furnace). Raising the furnace temperature improves the efficiency but also increases the steam pressure, complicates the design and makes the furnace more expensive. The waste heat cannot be converted into mechanical energy without an even cooler cooling system. However, it may be used in cogeneration plants

to heat buildings, produce hot water, or to heat materials on an industrial scale, such as in some oil refineries, cement plants, and chemical synthesis plants.Typical thermal efficiency for electrical generators in the electricity industry is around 33% for coal and oil-fired plants, and up to 50% for combined-cycle gas-fired plants
CHAPTER 6ADVANTAGESThe fuel used is quite cheap.Less initial cost as compared to other generating plants.It can be installed at any place irrespective of the existence of coal. The coal can be transported to the site of the plant by rail or road.It requires less space as compared to Hydro power plants.Cost of generation is less than that of diesel power plants.This plants can be quickly installed and commissioned and can be loaded when compare to hydel power plantIt can meet sudden changes in the load without much difficulty controlling operation to increase steam generationCoal is less costlier than dieselMaintenance and lubrication cost is lower
CHAPTER 7DISADVANTAGESIt pollutes the atmosphere due to production of large amount of smoke and fumes.It is costlier in running cost as compared to Hydro electric plants.well, stations always take up room for the environment which could be cultivated for the use of growing food etc. which is a great disadvantage is our day and age, as food is necessary to live.However, this could create more jobs for a lot of people thus increasing in a good way our current economic

situation which by is failing miserably.Over all capital investment is very high on account of turbines, condensers, boilers reheaters etc .maintenance cost is also high on lubrication, fuel handling, fuel processing. It requires comparatively more space and more skilled operating staff as the operations are complex and required precise executionA large number of circuits makes the design complexStarting of a thermal power plant takes fairly long time as the boiler operation and steam generation process are not rapid and instantaneous
CHAPTER 8FUTURE PROSPECTS
Effective Use of Fossil Fuels and Reduction in CO2 Emissions by Improving the Efficiency of Thermal Power GenerationAt present, thermal power generation accounts for approximately 70% of the total amount of electricity produced around the world. However, thermal power generation, which uses fossil fuels, causes more CO2 emissions than other power generation methods. In order to reduce CO2emissions per unit power produced, Toshiba Group is developing next-generation thermal power technologies aimed at improving plant efficiency and commercializing the CCS*1 (CO2 capture and storage) system.
To improve the efficiency of thermal power generation, it is of vital importance that the temperature of the steam or gas used to rotate the turbines is raised. Toshiba Group is working on the development of ultra-high-temperature materials and cooling technologies in order to commercialize an A-USC*2 system (Advanced Ultra-Super Critical steam turbine system) more efficient than previous models, which is designed to increase steam temperature from 600°C to above the 700°C mark. In the area of combined cycle power generation using a combination of gas and steam turbines, we are also engaged in jointly developing a power generation system designed to increase gas temperature to the level of 1,500°C with the U.S. Company General Electric, which is starting commercial operation in July 2008 in Japan.
Accelerating the Development of CO2 Capture and Storage Technology

The Key to Realizing Next-generation Power Generation SystemToshiba Group is engaged in the development of CO2 capture and storage (CCS) technology designed to separate and capture CO2 emitted from thermal power plants and other such facilities and then store it underground. More specifically, this development is aimed at commercializing CCS technology. In order to commercialize this technology, it is essential that we develop a system that makes it possible to separate and capture CO2 without reducing the economic performance of a power plant. In the course of its basic research, Toshiba Group has developed a high-performance absorbent that minimizes the energy consumption required for the CO2 capture process. Experiments conducted using small-scale test equipment have confirmed that its level of performance is the best in the industry.
Preventive Maintenance Technologies That Support the Long-term, Stable Operation of Facilities and Extension of the Service Life of High-temperature Gas Turbine PartsThe use of combined cycle power generation facilities using gas turbines is increasing year by year for the purpose of achieving the reduction in CO2 emissions required to create a low-carbon society, increasing energy use efficiency and improving economic performance. Toshiba Group is developing various technologies that support the long-term, stable operation of facilities.In order to analyze and assess high-temperature gas turbine parts, which are used in harsh environments and to determine their remaining service lives based on the level of degradation, we developed a technology for making highly accurate diagnoses by combining a number of methods, including the finite element method (FEM) and methods for testing cleavage strength, tensile strength, durability and fatigue strength. We are also working to commercialize service life extension and repair technologies aimed at recycling gas turbine rotor/stator blades and extending their service lives. Based on the BLE (Blade Life Extension„¢) concept unique to our company group, we repeatedly reuse old rotor blades that meet our repair standards instead of simply discarding them. The repair and recycling of these parts not only reduces running costs and improves economic performance, but also effectively minimize the environmental impact.
Fig- Concept of the BLE Process

BIBLIOGRAPHY
1. British Electricity International (1991).Modern Power Station Practice: incorporating modern power system practice (3rd Edition (12 volume set) ed.). Pergamon. ISBN 0-08-040510-X.2. Babcock & Wilcox Co. (2005).Steam: Its Generation and Use (41st edition ed.). ISBN 0-9634570-0-4.3. Thomas C. Elliott, Kao Chen, Robert Swanekamp (coauthors) (1997).Standard Handbook of Powerplant Engineering (2nd edition ed.). McGraw-Hill Professional.ISBN 0-07-019435-1.
Reference:http://seminarprojects.com/Thread-thermal-power-generation-full-report#ixzz3qDVaL7KN
SUMMER INTERNSHIP REPORT PROJECT APPRAISIAL AND FINANCIAL MODELLING OF A THERMAL POWER PLANT UNDER THE GUIDANCE OF Mrs Indu Maheshwari, Dy Director, CAMPS, NPTI & Mrs. Priya Kumar, Senior Manager, Project Division, Power Finance Corporation Limited At Power Finance Corporation, New Delhi Submitted By Ankit Doveriyal Roll No. 15 MBA (POWER MANAGEMENT) (Under ministry of Power, Govt. of India) Affiliated to MAHARSHI DAYANAND UNIVERSITY, ROHTAK AUGUST 2013 i DECLARATION I, Ankit Doveriyal, Roll No 15, student of MBA-Power Management (2012-14) at National Power Training Institute, Faridabad hereby declare that the Summer Training Report entitled “PROJECT APPRAISIAL AND FINANCIAL MODELLING OF A THERMAL POWER PLANT” is an original work and the same has not been submitted to any other Institute for the award of any other degree. A Seminar presentation of the Training Report was made on ________________________ and the suggestions as approved by the faculty were duly incorporated. Presentation In-Charge Signature of the Candidate (Faculty) Countersigned Director/Principal of the Institute ii ACKNOWLEDGEMENT It is often said that life is a mixture of achievements, failures, experiences, exposures and efforts to make your dream come true. There are people around you who help you realize your dream. I acquire this opportunity with much pleasure to acknowledge the invaluable assistance of Power Finance Corporation and all the people who have helped me through the course of my journey in successful completion of this project. I wish to express my sincere gratitude to my Company Guide, Mrs. Priya Kumar (Senior Manager, Project Appraisal Division, PFC) for her guidance, help and motivation. Apart from the subject of my study, I learnt a lot from her, which I am sure, will be useful in different stages of my life. I would like to thank Mrs. Shweta Vithal (Dy

Manager, Project Appraisal Division) for her help in understanding and formulating the model design and methodology as well as help me in acquitting to the Power Sector and clearing my concepts and Mr. Natesh Sarma (Officer, Project Appraisal Division) for his review and helpful comments. I would like to thank Mr. Rakesh Mohan, Senior Manager (HR) for providing me with this wonderful opportunity to work at Power Finance Corporation. I express my thanks to Mrs. Indu Maheshwari, Dy. Director, Faculty guide, NPTI for her kind cooperation during the period of my summer internship. I feel deep sense of gratitude towards Mr S.K.Chaudhary, Principal Director, CAMPS(NPTI), NPTI and Mrs. Manju Mam, Director, Mrs. Indu Maheshwari, Dy. Director, NPTI for arranging my internship at Power Finance Corporation and being a constant source of motivation and guidance throughout the course of my internship. I am grateful to my friends who gave me the moral support in my times of difficulties. Last but not the least I would like to express my special thanks to my family for their continuous motivation and support. Regards, Ankit Doveriyal Class of 2012- 2014 (NPTI) iii EXECUTIVE SUMMARY Rapid economic growth has increased the burden of India’s infrastructure, one of the country’s week spots. An infrastructure deficit is widely considered to be one of the factors that could severely affect the economic growth of the country. In the past few years, policy makers have recognized the importance of infrastructure in economic growth and have made concrete efforts to accelerate infrastructure development. Power Sector continues to lag behind despite the introduction of progressive measures. Power shortages, increased tariffs, shortage of coal and dependence on imported fuel are on rise, while the poor health of the distribution continues to inhibit the inflows of investments which have possessed growth risk for the Indian Electricity Sector. India's demand for electricity is likely to cross 300 GW, in few years earlier than most estimates. Meeting this demand will require a fivefold to tenfold increase in the pace of capacity addition. With the growing demand of power, there is huge potential of investment in power sector of India. The power sector which is in the concurrent list of the Indian Constitution is under the purview of both the central government and the state government. The power sector which was earlier dominated by public sector undertaking is now seeing effective participation of the private sector which is now accountable for 28% of power generation in the country. Power Finance Corporation Ltd. (PFC) a public financial institution established In 1986 by the Ministry Of Power as a Financial Institution (FI) to provide financing solution to large capital intensive power project across India including generation, transmission, distribution and RM&U projects. My Summer Internship Project is “Project & Entity Appraisal of Thermal Power Plant”. It resolves around the appraisal of the power project promoted by the company ABC Power Limited, which has come for financial assistance of its Capital Expenditure and Working Capital Requirements. The project is being appraised after evaluating it on the various parameters set by Central Electricity Regulatory Commission (CERC) and the set parameters at PFC. My work also include appraisal of Promoters of the project which is based on set parameters at PFC .The aim of the appraisal is to finally arrive at the decision: whether PFC should finance the project or not. As per the guidelines of PFC the project is evaluated into two parts: Project Appraisal and Entity Appraisal. The format of the project report will be in the form of Agenda Note as per PFC norms. “Project Appraisal” is carried out by “Project Appraisal Department” which evaluate the financial and technical viability of the project. iv “Entity Appraisal” is carried out by “Entity Appraisal Department” and involves evaluation of the promoter of the company on its financial flexibility and stability, the analysis of their business operations and the competence of the management. In the end the project involves the subjective analysis on both Project & Entity fronts and come up with the risk involved. The project reports ends with the Recommendations on whether to finance the project or not. v LIST OF ABBREVIATIONS BTG Boiler,

Turbine & Generator BU Billion Units CEA Central Electricity Authority CERC Central Electricity Regulatory Commission COD Commercial Operation Date DPR Detailed Project Report EPC Engineering, procurement & construction Contract FSA Fuel Supply arrangement/agreement FTA Fuel Transport Agreement GCV Gross Calorific Value GoI Government of India IPP Independent Power Producer IDC Interest During Construction Kcal Kilo Calories KV Kilo Volts KWh Kilo Watt Hour MoP Ministry of Power MoEF Ministry of Environment & Forest NOC No Objection Certificate O&M Operations & Maintenance PFC Power Finance Corporation Ltd. PGCIL Power Grid Corporation of India Limited PLF Plant Load Factor PPA Power Purchase Agreement REC Rural Electrification Corporation vi LIST OF FIGURES Figure 1: Power Sector Structure……………………………………………………...4 Figure 2: Energy Production in Billion kWh (2010)…………………………………..5 Figure 3: All India Generation capacity……………………………………………….7 Figure 4: Business Strategy of PFC………………………………………………….13 Figure 5: Project Finance Structure…………………………………………………..19 Figure 6: Actual power supply position in Tamil Nadu……………………………...40 vii LIST OF TABLES Table 1: All India Region wise generation capacity…………………………………..6 Table 2: Different Rating by major rating agencies………………………………….11 Table 3: Sanctions & Disbursements for the respective financial years……………..14 Table 4: Major Projects Funded by PFC……………………………………………..14 Table 5: Financial Highlights for the year 2011-12………………………………….14 Table 6: Approvals and Agreement Status…………………………………………...22 Table 7: Preliminary appraisal…………………………………………………….…24 Table 8: Detailed Appraisal…………………………………………………………..26 Table 9: Approval and Agreement Status………………………………………........38 Table 10: Project Cost Details…………………………………………………….….39 Table 11: Power requirement and availability for Tamil Nadu………………………40 Table 12: Project details……………………………………………………..……….41 Table 13: Snapshot of project financial projections………………………………….45 Table 14: Sensitivity analysis sheet………………………………………………….46 viii TABLE OF CONTENTS DECLARATION………………………………………………………………………i ACKNOWLEDGEMENT…………………………………………………………… ii EXECUTIVE SUMMARY…………………………………………………………. iii LIST OF ABBREVIATIONS………….…………………………………………….. v LIST OF FIGURES…….…………………………………………………………… vi LIST OF TABLES…………….……………………………………………………. vii CHAPTER 1: INTRODUCTION…….……………………………………………..1 1.1 INDIAN POWER SECTOR………………………………..……………..1 1.2 POWER SECTOR REFORMS……………………………………………2 1.3 INTRODUCTION TO INDIAN POWER SECTOR……………………...5 1.4 POWER SECTOR: DEVELOPMENTS & CURRENT STATUS………..7 1.5 MAJOR ISSUES…………………………………………………………..8 1.6 INITIATIVES…………………………..…………………………………8 1.7 OPPORTUNITIES………………………………………………………...9 CHAPTER 2: COMPANY PROFILE………………………………………..…...10 2.1 BACKGROUND...………………...……………………………………..10 2.2 MISSION……….……………….………………………………………..10 2.3 CREDIT RATINGS………………………………...……………………10 2.4 OBJECTIVE OF PFC………………………………………..…………...11 2.5 CLIENTS OF PFC…………………………...…………………………..12 2.6 RANGE OF SERVICES…………………………………………………12 2.7 REFORMS……………………………………….………………………13 2.8 SWOT ANALYSIS………………………………………….…………...15 CHAPTER 3: OBJECTIVE AND SCOPE………………………………………..16 3.1 OBJECTIVE OF THE PROJECT………………………………………..16 3.2 SCOPE……………………………………………………........…………16 ix CHAPTER 4: LITERATURE REVIEW AND RESEARCH METHODOLOGY………………………………………………...17 4.1 LITERATURE REVIEW…...

……………………………………………17 4.2 PROJECT FINANCE…………………………………………………….18 4.3 PROJECT APPRAISAL…………………………………………………19 4.4 CALCULATION OF TARIFF…………………………………………...20 4.5 RESEARCH METHODOLOGY………………………………………...21 CHAPTER 5: PROJECT APPRAISAL & FINANCIAL MODELLING……....22 5.1 GUIDING PRINCIPAL FOR PROJECT APPRAISAL…………………22 5.2 PROJECT & ENTITY APPRAISAL…………………………………….23 5.3 FINANCIAL MODELLING……………………….…………………….28 CHAPTER 6: CASE STUDY………………………………………………………29 6.1 PROJECT PURPOSE & SCOPE………………………………………...29 6.2 PROJECT DETAILS………………….………………………………….29 6.3 PROJECT COST…………………………………………………...…….38 CHAPTER 7: RISK ANALYSIS & SWOT ANALYSIS………………………...47 7.1 RISK ANALYSIS………………………………………………………..47 7.2 SWOT ANALYSIS………………………………………………………49 7.3 LIMITATIONS…………………………………………………………..50 CHAPTER 8: CONCLUSION, RECOMMENDATION & LEARNING………52 8.1 CONCLUSION…………………………………………………………..52 8.2 RECOMMENDATIONS………………………………………………...53 8.3 LEARNING…………………………………….………………………...53 BIBILIOGRAPHY……………..…………………………………………………...54 ANNEXURE…………………………………………………………………...……55 1 | Page Project Appraisal & Financial Modeling CHAPTER 1: INTRODUCTION 1.1. INDIAN POWER SECTOR Electricity is one of the most vital infrastructure inputs for economic development of a country. The demand of electricity in India is enormous and is growing steadily. The vast Indian electricity market, today offers one of the highest growth opportunities for private developers. At the time of independence in 1947, the country had a power generating capacity of 1,362 MW. Prior to independence the power sector was regulated by “The Indian Electricity Act, 1910” which was the first basic legal framework for the electricity sector in the country. “Supply of energy” was the main concept around which various provisions were woven. The act talked about the Licence for generating and supplying electricity, Competition in generation and supply areas, Framework of wires and works, Licensee and Consumer relationship, Safety Measures and Theft of electricity in the power sector. Post independence our priorities changed, the supply of electricity which was limited to cities and towns was to be spread across the country, especially in rural areas. This was seen as a social responsibility of the Government to provide electricity to all. Thus “The Electricity Supply Act, 1948” was passed in the Central legislature to facilitate the establishment of regional co-ordination in the development of electricity which envisaged formation of State Electricity Boards (SEB) as an arm of State Government to discharge their responsibility of providing electricity to all. The act mandated that every State shall constitute a SEB. SEB’s were entrusted with the task of developing power generation, transmission as well as distribution facilities. The Act also called for formation of Central Electricity Authority (CEA), which was envisaged as the main technical arm of the Central Government. It also had to perform the role of technical advisor to the State Government, SEB, Generation Company or any other agency and form regulations on certain aspects of which the most important was the technoeconomic clearance of generation projects. However, in 1970s SEBs started making losses largely on account of political interference, mismanagement and inefficiencies in operations. Flat rate tariff (near zero usage charge) were introduced for the agricultural connections and high tariff was imposed on industrial & commercial users, such cross-subsidy led to increase in theft and the losses increased. As the boards were not able to make money, they became increasingly dependent on the government for funding. Because of the shortage of funds, SEB’s were unable to increase generation capacity and were not maintaining their assets. Therefore, SEB’s went into a vicious cycle that led to further drop in the performance of their operations and subsequently

increased their losses. In 1980s, the SEBs were able to show about 3% of statutory returns with the help of flawed accounting system but in practice the accruals were not sufficient for growth and the boards sought assistance from state governments. In this situation, the government decided to create central generating utilities i.e. National thermal power corporation (NTPC) & National Hydro Power Corporation (NHPC) to improve the condition of power sector. The government also tried to connect the generating entities scattered all over the country non-uniformly 2 | Page Project Appraisal & Financial Modeling by forming “The National Grid” and thus trying to overcome generation demand supply gap prevalent in different states. In response to the balance-of-payment crisis in 1991, the government of India decided to open up various sectors in the economy including power sector. The power generation sector was de-licensed and the private parties were allowed to setup generating facilities. The change in notification gave numerous incentives to private sector such as 16% return on equity for plants that operated at plant load factor (PLF) of 68.5%, five year tax holiday, two part tariff, equity requirements as low as 20% of project cost and selective guarantees from central government for payment default by SEBs. This liberal set of policies initially created excitement among the private investors to setup plants. However, the excitement soon subsided because of the large political risks and payment capacity of the already bleeding SEBs. The state board’s losses were increasing mainly due to theft and had to increasingly depend upon government subsidy. Less than 17,000 MW were added vis-à-vis a planned addition 40,000 MW in the period 1971-1992. Further, such generous incentives given by the government to the foreign investors wherein almost all the risks were borne by the state board drew lot of criticism. SEBs were earning 12.2% internal rate of return on their own plants and therefore paying 16% return to IPPs which did not make sense. Under the 1910 and 1948 Acts, powers of regulation including tariff regulations were vested on the Government. This concentration of power in the Government and Government organizations resulted in inefficiencies of various sorts, the most prominent manifestation was being lack of rational and professional approach to tariff fixation. As part of reforms strategy, it was, therefore, considered necessary to distance the sensitive aspect of tariff regulation from the political executives on the independent Regulatory Commissions. Thus, Government brought in “The Electricity Regulatory Commissions (ERC) act, 1998” which was the first step taken by the government to move itself away from the regulatory aspect of the power sector and fixation of tariff for the energy being used by the consumer. By this act the various losses occurring at the SEBs level and the bottleneck caused due to bureaucracy prevalent in the government organizations and political interference were tried to minimize by formation of Central Electricity Regulatory Commissions (CERC) at central level and State Electricity Regulatory Commissions (SERC) at every state. The CERC and SERC had main responsibility of tariff determination for Central Government and State Government owned generating stations respectively. Bullish economic growth story of any country depends on a robust power generation & delivery model. 1.2. POWER SECTOR REFORMS 1.2.1. THE ELECTRICITY ACT 2003: A REVOLUTION Competition with regulatory oversight is the framework around which the Electricity Act, 2003 is woven - competition to encourage efficiency in performance and regulatory oversight, to safeguard consumer’s interest and at the same time ensure recovery of costs for the investors. The journey of distancing of Government from regulations that started in 1998 has culminated in The Electricity Act of 2003. According to the new law The 3 | Page Project Appraisal & Financial Modeling Government is distanced from all forms of regulation, viz., licensing, control over generation, captive generation, tariff fixation etc. Now the Government remains there only as a facilitator. The Act talks about the need and ways of implementing Competition in the power sector while considering the
concerns associated with it, about the electrification of rural areas and about liberalization of power sector. While Liberalization is the mantra, the Electricity Act does not encourage an unbridled growth for the sector. The regulatory Commission have been envisaged as the watchdogs which have a responsibility to put a check on the cost of generation through powers to regulate tariffs for supply of electricity from a generating company to the distribution licensees on long term power purchase agreements, as also with power to look into the costs of generation. The act also provides the bases for formation of National Electricity Policy (NEP), National Tariff Policy (NTP), Rural Electrification, Open access in transmission, phased open access in distribution, Mandatory SERCs, licence free generation and distribution, power trading, mandatory metering and stringent penalties for theft. SERCs provide Regulatory guidelines on quality of service standards that are to be achieved and maintained by the utility and ensure their compliance by providing for Complaint Redressal Mechanism & Appointment of Ombudsman. SERCs mentions about the consequences that are to be followed by the utility for non-compliance of the guidelines. 1.2.2. NATIONAL ELECTRICITY POLICY In pursuance of the provisions of the Electricity Act, 2003 the Central Government came out with National Electricity Policy on 6th February 2005. The policy prescribes the following objectives: Providing universal access in next five years for which significant capacity addition and expansion would be required. Meeting the demand fully by 2012 and to have spinning reserves after meeting peak requirements. Bringing about improvements in quality of supply at reasonable rates. Increasing per capita availability to over 1000 kWh per year by 2012. Ensuring a minimum lifeline consumption of 365 kWh per year per household as a merit good by 2012. Financial turnaround and attainment of commercial viability of all entities in the sector. Protection of consumers’ interest. 1.2.3. NATIONAL TARIFF POLICY In pursuance with section 3 of the Electricity Act 2003, the Central Government notified the Tariff Policy on 6th January 2006. According to the Act, the CERC and SERCs are to be guided by the Tariff Policy in framing its regulations. It lays out the following objectives: Ensuring availability of electricity to consumers at reasonable and competitive rates; Project Appraisa 1.2.4. R Electri econom develo August rural a input govern Vidhyu 1. 2. 3. Subsid which electrif @ 150 is unde scheme connec 1.2.5. I Sour al & Financia Ensuring f Promoting across juri Promoting supply. RURAL EL icity has be mic growth pment espe t 2006, with areas so as for produc nment has l utikaran Yo Rural Ele substation Village E transforme Stand alon dy towards is a noda fied Below 00/- per con ertaken thro e. RGGVY ctions in rur INDIAN PO rce: powerm al Modeling financial via g transparen sdictions an g competitio LECTRIFI een recogni h, generatio ecially in ru h the object to ensure r ctive uses i aunched in ojana (RGG ctricity Dis ; Electrificatio er in a villag ne grids with capital exp al agency f Poverty Lin nnection in a ough franch Y has thus ral India. OWER SE min.gov.in ability of the ncy, consiste nd minimizi on, efficien ICATION P ized as a b on of emp ural areas. T tive of impr rapid econo in agricultu April, 200 VY) aimed stribution B on Infrastru ge or hamle h generation penditure to for implem ne (BPL) h all rural hab isees. A thr s resulted CTOR STR Figure 1: P e sector and ency and p ing percepti ncy in opera POLICY basic human ployment, The Rural roving acce omic develo ure, rural 05 an ambit d to establish Backbone ucture (VE et; n where grid o the tune o mentation of households i bitations. Th ree-tier qual in huge i RUCTURE Power Secto d attracting redictability ion of regul ations and i n need. It elimination Electrificati ess and qual opment by p industries tious schem h (REDB) w EI) with a d supply is of 90% is c f the schem is financed he Managem lity monitor investments E or Structure investments y in regulat latory risks; improvemen is the key n of povert ion Policy lity of elect providing e etc. For th me ‘Rajiv G with at leas at least on not feasible channelized me. Electrif with 100% ment of Ru ring has bee s in provid 4 | P a s; tory approa ; nt in qualit to accelera rty and hu was notifie tricity suppl
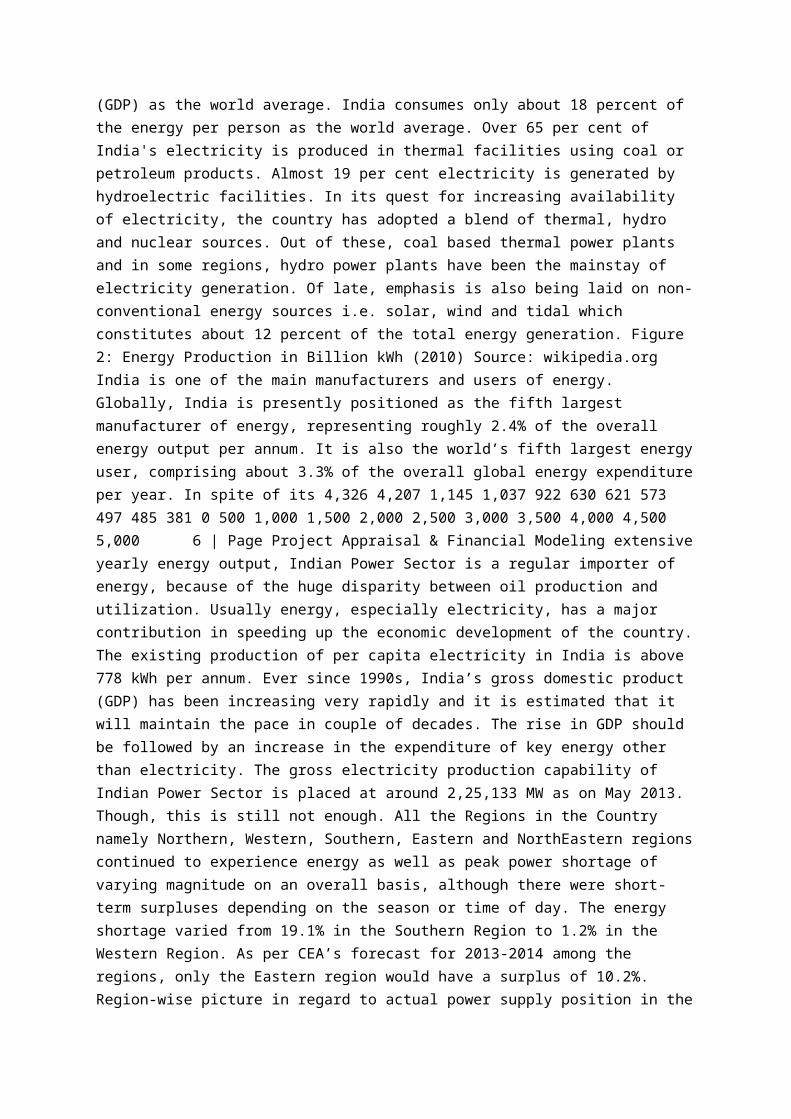
electricity a his the Cen Gandhi Gram st a 33/11 ne Distribu e. d through R fication of capital sub ural Distribu en built into ding electr a g e aches ty of ating uman ed in ly in as an ntral meen KV ution REC, f unbsidy ution o the ricity 5 | Page Project Appraisal & Financial Modeling 1.3 INTRODUCTION TO INDIAN POWER SECTOR Electricity is one of the most vital infrastructure inputs for economic development of a country. The demand of electricity in India is enormous and is growing steadily. The vast Indian electricity market, today offers one of the highest growth opportunities for private developers. Since independence, the Indian electricity sector has grown many folds in size and capacity. The generating capacity has increased from a meagre 1,362 MW in 1947 to more than 225,113 MW by May 2013, a gain of almost 200 times in capacity addition. India's per capita energy consumption is 778kWh in 2011 -- a rise of almost 400 percent since 1980. Although, India's energy consumption per unit of output is still rising, but it is expected to level off and to decline in the future. India consumes two-thirds more energy per dollar of gross domestic product (GDP) as the world average. India consumes only about 18 percent of the energy per person as the world average. Over 65 per cent of India's electricity is produced in thermal facilities using coal or petroleum products. Almost 19 per cent electricity is generated by hydroelectric facilities. In its quest for increasing availability of electricity, the country has adopted a blend of thermal, hydro and nuclear sources. Out of these, coal based thermal power plants and in some regions, hydro power plants have been the mainstay of electricity generation. Of late, emphasis is also being laid on non-conventional energy sources i.e. solar, wind and tidal which constitutes about 12 percent of the total energy generation. Figure 2: Energy Production in Billion kWh (2010) Source: wikipedia.org India is one of the main manufacturers and users of energy. Globally, India is presently positioned as the fifth largest manufacturer of energy, representing roughly 2.4% of the overall energy output per annum. It is also the world’s fifth largest energy user, comprising about 3.3% of the overall global energy expenditure per year. In spite of its 4,326 4,207 1,145 1,037 922 630 621 573 497 485 381 0 500 1,000 1,500 2,000 2,500 3,000 3,500 4,000 4,500 5,000 6 | Page Project Appraisal & Financial Modeling extensive yearly energy output, Indian Power Sector is a regular importer of energy, because of the huge disparity between oil production and utilization. Usually energy, especially electricity, has a major contribution in speeding up the economic development of the country. The existing production of per capita electricity in India is above 778 kWh per annum. Ever since 1990s, India’s gross domestic product (GDP) has been increasing very rapidly and it is estimated that it will maintain the pace in couple of decades. The rise in GDP should be followed by an increase in the expenditure of key energy other than electricity. The gross electricity production capability of Indian Power Sector is placed at around 2,25,133 MW as on May 2013. Though, this is still not enough. All the Regions in the Country namely Northern, Western, Southern, Eastern and NorthEastern regions continued to experience energy as well as peak power shortage of varying magnitude on an overall basis, although there were short-term surpluses depending on the season or time of day. The energy shortage varied from 19.1% in the Southern Region to 1.2% in the Western Region. As per CEA’s forecast for 2013-2014 among the regions, only the Eastern region would have a surplus of 10.2%. Region-wise picture in regard to actual power supply position in the country during the year 2013 -14 is given below: Table 1: All India Region wise generation capacity Sl No. Region Coal Gas DSL Total Nuclear Hydro R.E.S Total 1 Northern 33073.50 5031.26 12.99 38117.75 1620.00 15467.75 5589.25 60794.75 2 Western 49584.51 8988.31 17.48 58590.30 1840.00 7447.50 8986.93 76864.73 3 Southern 25182.50 4962.78 939.32 31084.60 1320.00 11353.03 12251.85 56009.48 4 Eastern 23727.88 190.00 17.20 23935.08 0.00 4113.12 454.91 28503.11 5 N. Eastern 60.00 1187.50 142.74 1390.24 0.00 1242.00 252.68 2884.92 6 Islands 0.00 0.00 70.02 70.02 0.00 0.00 6.10 76.12 7 All India

131628.39 20359.85 1199.75 153187.99 4780.00 39623.40 27541.71 225133.10 Source: Power ministry as on 31-5-2013 In the past, the power sector growth has not kept pace with the economic expansion and this has resulted in India experiencing a 13 per cent shortage in peak capacity and 8 per cent in energy terms, on an overall basis. Driven by the requirement to enhance the budgetary allocations to social sectors to meet the emerging requirements of sustainable growth, the Government has envisaged a manifold increase in the role of the private sector in the financing and operations of the power sector. Significant structural and regulatory reforms have paved the way for increased private sector participation in all aspects of the sector. Many of the legal and regulatory requirements to enable this are in place, while the operational provisions are in different stages of implementation in different states. As per CEA’s forecast for 2013-14 18,432 MW of capacity is expected to be added, comprising 15,234 MW of thermal power, 1,198 MW of hydropower and 2000 MW of nuclear power. Capacity addition during 2012-13 stood at 20,502 MW. 7 | Page Project Appraisal & Financial Modeling 1.4 POWER SECTOR: KEY DEVELOPMENTS AND CURRENT STATUS Indian government forecasted the economic growth to be 6.1% - 6.7% for the year 2013- 2014 and to sustain this growth it is imperative for the power sector to grow with the same pace. Therefore, it becomes essential to assess the power sector by analysing its current status, the key challenges faced by it, and its future growth drivers. Power is considered to be a core industry as it facilitates development across various sectors of the Indian economy, such as manufacturing, agriculture, commercial enterprises and railways. Though India currently has the fifth largest electricity generation capacity in the world pegged at 2,25,133 MW, the growth of the economy is expected to boost electricity demand in coming years. Figure 3: All India Generation Capacity Source: powermin.gov.in India saw a total capacity addition of approximately 54,000 MW during the 11th Five Year plan, of which approximately 47 per cent was contributed by the central government, 34 per cent from the state government, and a little over 19 per cent from the private sector. As per the Planning Commission report capacity addition of 88000MW is estimated in 12th five year plan. Some examples of top public sector companies include National Thermal Power Corporation (NTPC), Damodar Valley Corporation (DVC) and National Hydroelectric Power Corporation (NHPC). Some key companies in the private sector include Tata Power and Reliance Energy Limited. In India, power is primarily generated from thermal and nuclear fuels, hydro energy and renewable sources. India’s power generation capacity has significantly increased since 2008, and is also expected to show a strong growth in the future. However, India faced a power deficit of approximately 8.5 per cent and a peak demand deficit of over 10 per cent in FY11 primarily due to fuel shortage. This shortage can be attributed to aggregate technical and commercial (AT&C) losses, which is about 30 per cent with a high variance across various utilities. Therefore, it is essential for the government to work proactively to increase the sector’s generation capacity in a sustainable manner by addressing key 153188 4780 39623 27542 225133.1 34444.12 0 50000 100000 150000 200000 250000 Thermal Nuclear Hydro RES Total Captive 8 | Page Project Appraisal & Financial Modeling challenges, such as supply shortage and distribution losses without damaging the environment, to attain a high growth rate during the 12th Five Year Plan. To cope with the demand deficit, the Indian government has implemented various progressive measures to maximise the country’s power generation capacity and improve distribution. Some examples of such measures include rural electrification programmes and ultra mega power projects. In particular, the inflow of foreign direct investments is expected to step up capacity addition significantly. The government has allowed FDI of up to 100 per cent through the automatic route in all segments of the power sector except for nuclear energy. Consequently, the sector has drawn about US$ 4.6 billion investment over the past decade, of which

US$ 1.6 billion came in FY12 alone. Hence, we can comfortably say that the Indian power sector has strong future growth prospects. Consequently, we need to assess the various policy initiatives that have had a positive impact on the sector, and capitalise upon them further to ensure a strong future growth. 1.5 MAJOR ISSUES The most important sector in infrastructure is the power sector. There is about 90 GW of capacity under various stages of construction and attending to the outstanding issues facing these projects must be given a high priority. However, given the time lag involved in implementing power projects, it is necessary to ensure that projects which will be commissioned only in the Thirteenth Plan can also move ahead satisfactorily. Almost half the capacity in the Twelfth Plan is projected to come from the private sector and the position is likely to be the same in the Thirteenth Plan. Private sector investors in power generation have faced many problems in recent times. They include (i) Inadequate supply of domestic coal and unanticipated increase in prices of imported coal. (ii) Difficulties with clearances for captive mines, as well as for generating stations. (iii) Land availability (iv) Poor financial health of some state electricity distribution companies which are the main customers and which suffer from insufficient tariff adjustment plus inefficiencies in collection. (v) Inadequate availability of domestic natural gas. (vi) Inadequate fuel supply agreements for coal. (vii) More recently, difficulties in obtaining finance from both external and domestic sources. 1.6 INITIATIVES PPP IN POWER To attract private sector participation, government has permitted the private sector to set up coal, gas or liquid-based thermal, hydel, wind or solar projects with foreign equity participation up to 100 per cent under the automatic route. The government has also launched Ultra Mega Power Projects (UMPPs) with an initial capacity of 4,000 MW to attract 160–200 billion of private investment. Out of the total nine UMPPs, four UMPPs at Mundra (Gujarat), Sasan (Madhya Pradesh), Krishnapatnam (Andhra Pradesh) and Tilaiya Dam (Jharkhand) have already been awarded. The remaining five UMPPs, 9 | Page Project Appraisal & Financial Modeling namely in Sundergarh District (Orissa), Cheyyur (Tamil Nadu), Girye (Maharashtra), Tadri (Karnataka) and Akaltara (Chattisgarh) are yet to be awarded. To create Transmission Super Highways, the government has allowed private sector participation in the transmission sector. A PPP project at Jhajjar in Haryana for transmission of electricity was awarded under the PPP mode. Further, to enable private participation in distribution of electricity, especially by way of PPP, a model framework is being developed by the Planning Commission. ADVANCED TECHNOLOGIES It has already been announced that 50 per cent of the Twelfth Plan target and the coalbased capacity addition in the Thirteenth Plan would be through super-critical units, which reduce the use of coal per unit of electricity produced. Supercritical (SC) power plants, which operate at steam conditions 560o C/250 bars, can achieve a heat rate of 2,235 kCal/kWh as against a heat rate of 2,450 kCal/kWh for sub-critical power plants. The specific CO2 emission for super-critical plants is 0.83 kg/ kWh as against 0.93 kg/kWh for sub-critical plants. Super-critical technology is now mature and is only marginally more expensive than sub-critical power plants. Determined efforts are needed to achieve these results, and prioritisation of coal linkages will be necessary to incentivise adoption of super-critical technology. ULTRA SUPER CRITICAL An Ultra Super Critical (USC) coal-based power plant has an efficiency of 46 per cent compared with 34 per cent for a sub critical plant and 40 per cent for a Super Critical (SC) plant. Thus, with an USC or SC plant, the savings in coal consumption and reduction in CO2 emission can be substantial. A 10,000 MW power plant will generate 60 billion units of electricity per year at around 70 per cent load factor. It has a specific heat of 1,870 kcal/kwh compared to 2,530 kcal/kwh for a sub-critical plant. Thus, every unit generated with USC will save 0.165 kg [(2,530-1,870)/4,000] coal of 4,000 kcal/kg; and 60 billion units will save 9.9 million tonnes of coal per year. 1.7 OPPORTUNITIES 1. Long-term health of power

sector seriously undermined (losses Rs 70,000 crore per year). However, aggregate technical and commercial (AT&C) losses are slowly coming down. State Governments must push distribution reform. 2. Hydropower development seriously hindered by forest and environment clearance procedures. Need to look at special dispensation for these States, especially Arunachal Pradesh. 3. A time-bound plan to operationalize development and evacuation of hydropower from NER required. Road connectivity is an issue for expeditious project completion. 4. Given limited connectivity of NER with other parts of the country (through Siliguri corridor), access through Bangladesh needs to be explored. 5. Electricity tariffs not being revised to reflect rising costs. Regulators are being held back from allowing justified tariff increases. 10 | Page Project Appraisal & Financial Modeling CHAPTER 2: COMPANY PROFILE 2.1 BACKGROUND PFC was established in July 1986 as a Development Public Financial Institution (PFI) under Section 4A of the Companies Act, 1956. It is dedicated to the Power Sector. It is a wholly owned by Government of India. A Nav-Ratna public Sector Undertaking. It has highest safety ratings from domestic and international credit rating agencies and also ISO 9001-2000 Certification for the Project Appraisal System. PFC provides financial assistance to all types of power projects like Generation, R&M, Transmission, Distribution, system improvement, etc. PFC encourages optimal growth and balance development of all segments of power sector through assigning priorities for financing different categories of projects. The state sector utilities are the main beneficiary of PFC’s financial assistance. PFC has also been funding private sector projects for last 5-6 years. 2.2 MISSION PFC's mission is to excel as a pivotal developmental financial institution in the power sector committed to the integrated development of the power and associated sectors by channelling the resources and providing financial, technological and managerial services for ensuring the development of economic, reliable and efficient systems and institutions. * Consistently rated ‘Excellent’ for its overall performance against the targets set in Memorandum of Understanding (MoU) by the Government of India (GoI) since 1993-94. * Nav-Ratna Public Sector Undertaking. * Ranked among the top 10 PSUs for the last four years. 2.3 CREDIT RATINGS Placed at Sovereign Rating by International Rating Agencies - Moody’s and Standard & Poor’s for long term foreign currency debt. Placed at the highest safety ratings by accredited rating agencies in India - CRISIL and ICRA Domestic borrowings include term loans and bonds; External borrowings take the form of Syndicated Loans, Fixed & Floating Notes. Consistently rated ‘Excellent’ by the Government of India (GOI) for overall performance against the targets set in Memorandum of Understanding (MoU) between GOI and PFC. Project Appraisa DOM CRISIL ICRA Interna Moody Finch Standa Source 2.4 O PFC in al & Financia MESTIC RA L ational Ratin y’s ard & Poor’s e: PFC webs BJECTIV n its present To rise the rates and t the power To act as improvem To assist s sector duri al Modeling Table 2: D ATING AG ng Agency s site VE OF PF t role has the e resources terms and co projects in catalyst to ent in the fu state power ing transitio Different Ra GENCY FC e following from intern onditions an India. o bring inst unctioning o sector in ca onal period o ating by maj Long A LA B BB BB g main objec national and nd on-ward titutional, m of the state arrying out r of reforms jor rating a RUPEE BO g Term AAA AAA aa3 BBBBctives: - d domestic lend these managerial, power utilit reforms and agencies ORROWING Sho At p “sovere sources at t funds on op operationa ties d to support 11 | P a G ort Term P1+ A1+ par with eign” Rating the compet ptimum bas al and finan the state po a g e g titive sis to ncial ower Project Appraisa 2.5 CL 2.6 RA Fu al & Financia LIENTS State Elect State Powe State Elect Other Sta Departmen the power Central Po Joint Sec operative S Municipal Private Sec ANGE O nd Based Rupee Ter Foreign Cu Buyer’s Li Working C Loan to Eq Debt Restr Take out F Bridge Lo Lease Fina Bill Discou al Modeling OF PFC tricity Boar er Utilities tricity/Powe ate Departm nt) engaged project ower Utilitie ctor Power Societies Bodies ctor

Power F SERVI rm Loan urrency Ter ine of Credi Capital Loan quipment m ructuring/ R Financing an ancing unting ds er Departme ments (like d in the deve es r Utilities Utilities ICES rm Loan it n manufacturer Refinancing ents e irrigation elopment o and Co rs n f - 12 | P a g e Project Appraisa No 2.7 RE PFC ha power initiativ al & Financia on-Fund Ba Guarantee Exchange EFORMS as been acti sector in ves have be PFC is pr lending cri PFC has d Utilities fo Reform G Utilities to al Modeling ased s Risk Manag S & REST ively persua order to m een taken:- roviding fin iteria/expos decided to p or structural Group consti o formulate F gement TRUCTU ading State make them nancial assi sure limit no rovide tech l reforms of ituted in PF suitable res Figure 4: Bu Sourc URING IN Govt. to ini commercia istance to orms. hnical/financ f the State P FC to advic structuring p usiness Stra ce: PFC We NITIATIV itiate reform ally viable. reform-min cial assistan Power Secto ce and assis programmes ategy of PF Website VES m and restru In this re nded States nce to State or. sts the State s. C 13 | P a ucturing of t egard follow s under rela Govts. / Po te Govt. /Po a g e their wing axed ower ower 14 | Page Project Appraisal & Financial Modeling Table 3: Sanctions & Disbursements for the respective financial years Particulars Financial Year 2007-08 2008-09 2009-10 2010-11 2011-12 Sanctions 69498 57030 65466 75197 69024 Disbursement 16211 21054 25808 34121 41418 Source: PFC website Table 4: Major Projects Funded by PFC Name of the Project Capacity (MW) Cost (Crs) Amount funded Malwa TPS 2x500 4054 2730 Khaperkheda TPS Extn. 1x500 2191 1753 Kameng HEP 4x150 2485 1740 Koradi TPS 3x660 10019 6250 Mejia Extn. Unit 2x250 2800 1456 Sagardighi TPS PH1 2x300 2754 1925 Chandrapura Extn. Unit 7&8 2x250 2053 1435 Panipat TPS Stage V 2x250 1785 1428 Source: PFC website Table 5: Financial Highlights for the year 2011-12 Profit after Tax Rs 3032 Crore Loans and Grants Sanctioned Rs 69024 Crore Loans and Grants Disbursed Rs 41418 Crore Net Worth Rs 19493 Crore Reserves and Surplus Rs 19388 Crore No. of Employees 379 Source: PFC website 15 | Page Project Appraisal & Financial Modeling 2.8 SWOT Analysis Strengths Govt. of India’s undertaking. Good quality management Well established, long standing relations in the power industry Implementing agency for Mop’s schemes including AG &SP and APDRP Highest credit rating (due to government ownership) Weaknesses Poor asset quality with most of the lending to SEBs, whose loan repayment capabilities in the long run is doubtful. Concentration risk attributed to lending in single sector. Opportunities Power sector presents significant investment opportunities. Providing investment gateways & consultancy for domestic and external financial agencies. Having new business opportunities to cover the entire range of activities in the Power sector. Threats PFC has significant exposures entities which are loss making, financially weak an dare defaulting to most of their creditors. Delinquencies by these entities to PFC could impair the currently sound Balance Sheet of PFC. With increasing exposure to SEB’s, their weak balance sheet may affect PFC’s creditworthiness. 16 | Page Project Appraisal & Financial Modeling CHAPTER 3: OBJECTIVE AND SCOPE 3.1 OBJECTIVE OF THE PROJECT The objective of the Project Report is: 1. Finding out the factors affecting a project’s capital and operational expenditure which in turn have an impact on the cash outlay and revenue flow of the project and their study. Thus, performing Project Appraisal of a 660 MW Coal Based Supercritical Thermal Power Project. 2. A financial model of a 660 MW Coal Based Super-critical Thermal Power Project so as to study the effect of above factors on tariff and revenue flows. 3. To find out probable values of IRR, DSCR among other ratios using the financial model to study the feasibility and attractiveness of a 660 MW Coal Based Supercritical Thermal Project. 3.2 SCOPE Scope of project covers installation, commissioning, operation and maintenance of 660 MW coal fired Thermal Power Plant and associated systems. Indian power sector wants to ramp up the installed capacity to meet the growing demand. Large Power Projects enjoy economics of scale and help in lowering the tariff of

supply. This project helps to find out the factors that will affect the project cost and thus have an impact on total investment and operational expenses of the project. The assessment and analysis of these factors will help in determining the project cost, the associated risks and ultimately the tariff for supply from the project and thus the revenue and cash flows. Such information is vital in making financial decisions and project appraisal. The study may also help in understanding of ways to mitigate the risks. 17 | Page Project Appraisal & Financial Modeling CHAPTER 4: LITERATURE REVIEW AND RESEARCH METHODOLOGY 4.1. LITERATURE REVIEW The literature survey was carried out by reviewing various journals on project appraisal and financial model of a power plant. Few journals reviewed are: P.L.Kingston [1973] in IBM System Journals suggested, The use of computers in financial planning has become an area of increasing interest to financial management and data processing users. Computing systems facilitate the use of financial models in that they allow for the storage and retrieval of a representation of a financial plan and also for the evaluation of the consequences of “what if” conditions. Thus a financial model is a tool that can assist in the entire business planning process whether it be forecasting, cash management, or projection of profits. This paper presents introductory concepts that provide a basis for systems design and implementation of financial models. Described are the terminology, the basic components of financial models, and two general approaches to the construction of these models. W Wetekamp [2011] suggests how Net Present Value (NPV) can be used as a proper tool to ensure effective project management. The author proves that investment project's appraisal methods, such as e.g. NPV, can and should be used as an ongoing monitor of project health. What is more, even in case of project turbulences Net Present Value can be used as a key instrument for finding the most appropriate solutions. Robert Lundmark et al [2012] analyzed how market and policy uncertainties affect the general profitability of new investments in the power sector, and investigate the associated investment timing and technology choices. They developed an economic model for new investments in three competing energy technologies in the Swedish electric power sector. The model takes into account the policy impacts of the EU ETS and the Swedish green certificate scheme. By simulating and modeling policy effects through stochastic prices the results suggest that bio-fuelled power is the most profitable technology choice in the presence of existing policy instruments and under our assumptions. The likelihood of choosing gas power increases over time at the expense of wind power due to the relative capital requirement per unit of output for these technologies. Overall the results indicate that the economic incentives to postpone investments into the future are significant. Reports of similar projects for thermal power plants were also reviewed. The reports of previous batches on similar topic and the referenced data were helpful in determining data for this project. The literature available within the company helped a lot in understanding Project Finance and factors of project cost which are summarized as: 18 | Page Project Appraisal & Financial Modeling 4.2 PROJECT FINANCE Project financing is an innovative and timely financing technique that has been used on many high profile corporate projects, including infrastructural and power. Employing a carefully engineered financing mix, it has long been used to fund large scale natural resource projects, from pipelines and refineries to electric-generating facilities and hydroelectric projects. Increasingly, project financing is emerging as the preferred alternative to conventional methods of financing infrastructure and other large-scale projects worldwide. Project financing discipline includes understanding the rationale for project financing, how to prepare the financial plan, assess the risks, design the financing mix, and raise the funds. In addition, one must understand the cogent analyses of why some project financing plans have succeeded while others have failed. A knowledge base is required regarding the design of contractual arrangements to support project financing; issues for

the host government legislative provisions, public/private infrastructure partnerships, public/private financing structures; credit requirements of lenders, and how to determine the project's borrowing capacity; how to analyze cash flow projections and use them to measure expected rates of return; tax and accounting considerations; and analytical techniques to validate the project's feasibility. Project finance is different from traditional forms of finance because the credit risk associated with the borrower is not as important as in an ordinary loan transaction rather the identification, analysis, allocation and management of every risk associated with the project is given more importance. Project finance is the financing of long term infrastructure and industrial projects based upon a complex financial structure where project debt and equity are used to finance the project. Usually, a project financing scheme involves a number of equity investors, known as sponsors. As well as a syndicate of banks which provide loans to the operations. The loans are most commonly non-recourse loans, which are secured by the project itself and paid entirely from its cash flow, rather than from the general assets or creditworthiness of the project sponsors. The financing is typically secured by all of the project assets, including the revenue-producing contracts. Project lenders are given a lien on all of these assets, and are able to assume control of a project if the project company has difficulties complying with the loan terms. Generally, a special purpose entity is created for each project, thereby shielding other assets owned by a project sponsor from the detrimental effects of a project failure. As a special purpose entity, the project company has no assets other than the project. Capital contribution commitments by the owners of the project company are sometimes necessary to ensure that the project is financially sound. Project finance is often more complicated than alternative financing methods. It is most commonly used in the mining, transportation, telecommunication and public utility industries. 19 | Page Project Appraisal & Financial Modeling Figure 5: Project Finance Structure Source: PFC Library Risk identification and allocation is a key component of project finance. A project may be subject to a number of technical, environmental, economic and political risks, particularly in developing countries and emerging markets. Financial institutions and project sponsors may conclude that the risks inherent in project development and operation are unacceptable (unfinanced able). To cope with these risks, project sponsors in these industries (such as power plants or railway lines) are generally completed by a number of specialist companies operating in a contractual network with each other that allocates risk in a way that allows financing to take place. The various patterns of implementation are sometimes referred to as "project delivery methods." The financing of these projects must also be distributed among multiple parties, so as to distribute the risk associated with the project while simultaneously ensuring profits for each party involved. 4.3 PROJECT APPRAISAL It is an assessment of a project in terms of its economic, social and financial viability. A lending financial institution makes an independent and objective assessment of various aspects of an investment proposition. It is defined as taking a second look critically and carefully at a project by a person who is in no way involved or connected with its preparation. He is able to take independent, dispassionate and objective view of the project in totality, along with its various components. There are some steps for Project appraisal. Management Appraisal: Management appraisal is related to the technical and managerial competence, integrity, knowledge of the project, managerial competence of the promoters etc. The promoters should have the knowledge and ability to plan, implement and operate the entire project effectively. The past record of the promoters is to be appraised to clarify their ability in handling the projects. Construction Contracts O&M Support Licenses Certification Zoning Local Permits Tariff for such electricity Obligation to buy electricity Electricity Deliveries Electricity Payments Debt Debt Service Dividend Sponser(s) Lenders Project Company Equipment Provider Connections Civil Works
Regulatory Authorities Power Purchaser Equity 20 | Page Project Appraisal & Financial Modeling Technical Feasibility: Technical feasibility analysis is the systematic gathering and analysis of the data pertaining to the technical inputs required and formation of conclusion there from. The availability of the raw materials, power, sanitary and sewerage services, transportation facility, skilled man power, engineering facilities, maintenance, local people etc are coming under technical analysis. This feasibility analysis is very important since its significance lies in planning the exercises, documentation process, and risk minimization process and to get approval. Financial feasibility: One of the very important factors that a project team should meticulously prepare is the financial viability of the entire project. This involves the preparation of cost estimates, means of financing, financial institutions, financial projections, break-even point, ratio analysis etc. The cost of project includes the land and sight development, building, plant and machinery, technical know-how fees, preoperative expenses, contingency expenses etc. The means of finance includes the share capital, term loan, special capital assistance, investment subsidy, margin money loan etc. The financial projections include the profitability estimates, cash flow and projected balance sheet. The ratio analysis will be made on debt equity ratio and current ratio. Commercial Appraisal: In the commercial appraisal many factors are coming. The scope of the project in market or the beneficiaries, customer friendly process and preferences, future demand of the supply, effectiveness of the selling arrangement, latest information availability an all areas, government control measures, etc. The appraisal involves the assessment of the current market scenario, which enables the project to get adequate demand. Estimation, distribution and advertisement scenario also to be here considered into. Economic Appraisal: How far the project contributes to the development of the sector; industrial development, social development, maximizing the growth of employment, etc. are kept in view while evaluating the economic feasibility of the project. Environmental Analysis: Environmental appraisal concerns with the impact of environment on the project. The factors include the water, air, land, sound, geographical location etc. 4.4 CALCULATION OF TARIFF BASED ON CERC REGULATIONS The tariff for supply of electricity from a thermal generating station shall comprise two parts, namely, capacity charge (for recovery of annual fixed cost consisting of the components) and energy charge (for recovery of primary fuel cost and limestone cost where applicable). Annual Fixed Cost: The annual fixed cost (AFC) of a generating station or a transmission system shall consist of the following components Return on equity: 15.5% tax free return on total equity. Only 30% of the project cost can be treated as equity. 21 | Page Project Appraisal & Financial Modeling Interest on loan capital: Year to year loan interest is calculated on full debt amount by weightage average rate of interest. Depreciation: Depreciation up to 90% of the capital cost of asset is allowed. Depreciation shall be calculated annually based on Straight Line Method and rate defined in CERC guidelines. Interest on working capital: Working capital shall include Cost of coal or lignite and limestone, if applicable, for 1½ months for pit-head generating stations and two months for non-pit-head generating stations. Cost of secondary fuel oil for two months. Operation and maintenance expenses for one month. Maintenance spares @ 20% of operation and maintenance expenses. Receivables equivalent to two months of capacity charges and energy charges for sale of electricity. Energy Cost: It is also calculated on norms of CERC, the yearly consumption of primary fuel and secondary fuel is taken for the calculation. DPR (Detailed Project Report) of various projects of similar kinds helped in understanding the project technically. Reports and notifications available on various websites listed in bibliography also helped in adding value to the project. The data mainly obtained by interviews with experts and experience of plant operations and form the basis of assumptions taken for modelling. The data thus analysed was processed in

model for finding out the required ratios and check the project feasibility. 4.5 RESEARCH METHODOLOGY Methodology used for the project: Project Appraisal: To evaluate the project rating and conducting the feasibility report of a project based on the DPR/information memorandum/application form and other related materials submitted by the borrower. Assesses the capital needs of the business project and how these needs will be met. Calculating the cost of generation and relevance Calculation of DSCR, IRR and sensitivity analysis. Entity Appraisal: To assess the financial health of organizations that approach PFC for credit for power projects. This would entail undertaking of the following procedures: Analysis of past and present financial statements Examination of Profitability statements 22 | Page Project Appraisal & Financial Modeling CHAPTER 5: OVERVIEW OF PROJECT APPRAISAL & FINANCIAL MODELLING 5.1. GUIDING PRINCIPAL FOR PROJECT APPRAISAL AT PFC “Offering credit is an operation fraught with risk. Before offering credit to an organization, its financial health must be analysed. Credit should be disbursed only after ascertaining satisfactory financial performance. Based on the financial health of an organization, PFC assigns integrated ratings. These credit ratings are used to fix the interest rate, exposure limit and security criteria.” 5.1.1. ENTITY ELIGIBILITY CRITERIA: While considering the eligibility of an entity, last two year Auditor’s report and notes to annual accounts along with Income tax assessment order for last three years be also examined. Type of securities and mode of repayments is also to be suggested by the help of entity rating. 5.1.2. STATUTORY CLEARANCES: All statutory clearances requires at Central/State level for the implementation of the project are to be ensured. Depending on the cost of project, techno economic clearances of CEA/SEB may be asked. Clearances/Agreements required for implementation of project: 1. Land Acquisition 2. Water Availability 3. Stack Height: Airport Authority of India 4. Forest Clearance: Such that no sanctuary, reserve, national park within the project 5. No defence establishment 6. Ministry of environment and Forest 7. Fuel Supply Arrangement/Agreement through various coal linkages 8. Fuel Transportation Arrangement 9. PPA for selling Electricity 10. Transmission agreement with Transmission agency 11. Pollution Control Board Table 6: Approvals and Agreement Status Major Clearances/ Agreements S No Requirement Agency Status 1 Consent to establish / NoC Tuticorin Airport Certified 2 Environment Clearance MoEF The Company has applied for the clearance. 3 Forest clearance MoEF The Company has applied for the clearance 4 Water Drawl SG Agreement made 23 | Page Project Appraisal & Financial Modeling 5 Stack height Clearance Airport Authority of India (AAI) Approved 6 Pollution control board NOC for power plant Tamil Nadu Pollution control board (TNPCB) All the required standards of Pollution control board are met 7 Land Availability State Government 600 acres has been acquired 8 Primary Fuel Coal India Limited Long term agreement made on 15 April 2010 9 Transportation of Fuel Aspinwall Co Ltd Fuel Transport Agreement made 10 Transmission Line PGCIL Open Access and Transmission Agreement made 11 EPC / package contract Consolidated Construction Consortium Ltd. Agreement made on 18 June 2010 5.1.3. COST ESTIMATE: The base date for estimation of cost shall not be more than six month old at the time of talking up the project for appraisal. Physical contingencies and the price contingencies shall be made depending on the project completion period of 1,2,3,4 and 5 years as per PFC guidelines. Also IDC, to be considered to arrive at project cost. 5.1.4. PROJECT COST-BENEFIT ANALYSIS: Calculate Financial Internal rate of return (FIRR). Techno-economically sound with Financial IRR not less than the minimum required rate. Sensitivity analysis is also done. 5.1.5. PROJECT ANALYSIS: The project is evaluated on various parameters and then ranked according to the PFC guidelines. The method is explained later on. 5.2. PROJECT & ENTITY APPRAISAL The Project Analysis is intended for arriving at a relative measure of merit for the project. This model involves: 1. Entity rating 2. Project rating

5.2.1. ENTITY APPRAISAL METHODOLOGY Analysis and critical comments on the strength and weakness of organization, management, its working result, financial position etc. are made on the basis of organization set up, capital/financial structure, operating/working results, credit worthiness, financial result, entity related risks and mitigation measures proposed. Power Sector entities are evaluated with reference to a set of qualitative and quantitative factors to arrive at the Aggregate Entity Score. In addition to the performance parameters, milestones giving weightage to core reform activities have also been included in the overall grading mechanism. Both the public and private entities are evaluated separately on set of measures. 24 | Page Project Appraisal & Financial Modeling It is a two-stage process i.e. preliminary evaluation and detailed evaluation in which all the promoters are evaluated for their ability to contribute equity, carry the project to completion and operate the project as per the contracts. PRELIMINARY APPRAISAL In this, the scrutiny is based on the analysis of quantitative parameters, so as to access the financial strength of the promoters, track record of the project implementation and the credit worthiness. The scoring of all the factors is on a six- point scale, with 6 being the best and 1 being the worst. It involves analysis under two categories for Preliminary Evaluation: Business analysis Financial flexibility I. BUSINESS ANALYSIS Business analysis evaluates the performance of the present business of the promoters. The analysis involves evaluation of the market position and financial position of the company along with a view on management expertise and integrity of the promoters. The parameters and factors used in business analysis have been enumerated below: a) Market Position Here relative market share of the company is determined. It is calculated as the ratio of the turnover of the promoting company divided by the turnover of the market leader in the business. In case of diversified companies the same process is repeated for each division. b) Financial Risk It evaluates the past financial performance of the promoting companies. Performance of at least the last three years is evaluated. Financial risk parameter is represented by 5 ratios, which cover various aspects of company’s financial performance: Table 7: Preliminary appraisal Ratios Meaning of Scoring Attribute Return on Capital Employed (ROCE) Quantitative Return on Investment Operating Margin Quantitative Profitability of the Business Debt Service Coverage Ratio (DSCR) Quantitative Coverage Ratio Total Debt to Net Worth Quantitative Gearing Cash Flow From Operation to Total Debt Quantitative Cash Flow Source: PFC Library Return on Capital Employed (ROCE) ROCE = PBIT/ Opening capital employed 25 | Page Project Appraisal & Financial Modeling Here, Capital Employed = (Capital + Reserves + Short term debt + Long term debt evaluation reserves –Capital work in progress)ROCE is scored as a simple average of the last three years but if the latest ROCE is lower than one for the preceding year then the latest ROCE should be used for calculation instead of the average. Operating Margin OM = Operating Profit before Depreciation, Interest and Taxes/ Income from operations Debt Service Coverage Ratio (DSCR) DSCR = (PBIT – Taxes)/ (Repayment due to Long term Loan + Interest on long term and Short term loans) Total Debt/Total Net Worth Total debt/ total net worth = (Long term loans + Short term loans + Working Capital loans)/(Capital + Reserves – Revaluation reserve – Loss brought forward – Intangible Assets) Cash Flow from Operation / Total Debt Cash flow from operations/ Total debt = Cash flow from Operations/ (Long term loans + Short term loans + Working Capital Loans from Banks) II. FINANCIAL FLEXIBILITY It is used to judge the ability of promoters to financially manage the project. Thus, key points evaluated are: Ability to contribute equity to the project Ability to bring the project to financial closure Ability to fund temporarily funding mismatches Ratios Meaning Attribute being Evaluated Equity Funding Potential Quantitative Equity Raising Potential Bridge Finance Ability Quantitative Quarterly cash surplus from operations Track Record of Fund raised Quantitative Funds raised in last 10 years Aggregate Project
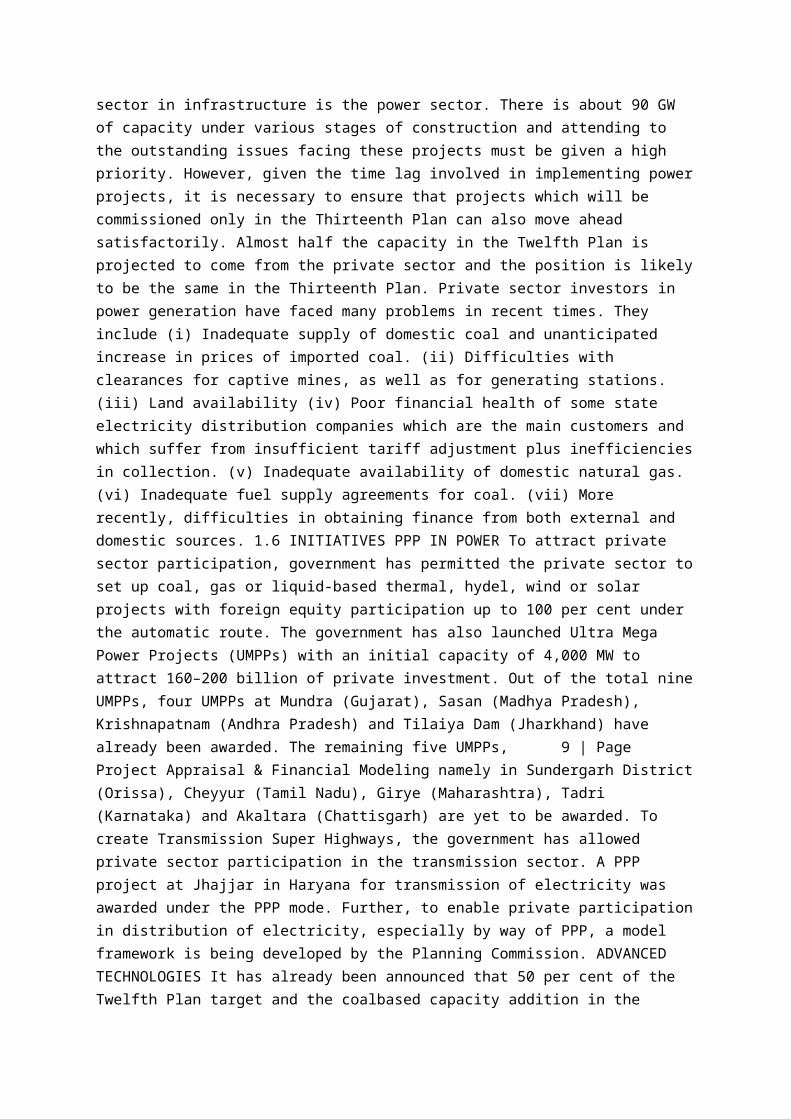
cost Handled Quantitative Projects established in last 10 years Source: PFC Library Equity Funding Potential: A Promoting company can contribute equity to the project by raising debt on its books or raising equity or through cash surpluses in the books. Bridge Financing Ability: This parameter basically judges the ability of company to fund short term cash flow imbalances in the project. This attribute is useful to prevent delay in project implementation due to small disbursals from the institutions. 26 | Page Project Appraisal & Financial Modeling Track Record of Fund Raised: This technique is basically used to judge the promoter’s ability to achieve financial closure and tie up funds for the project. This factor is scored by comparing the aggregate fund raised in the last ten years as a proportion of the project cost with the benchmark, to arrive at a score. Aggregate Project Cost: This factor evaluates the ability of the promoters to manage new project. Scoring is done by comparing the aggregate cost of the project implemented by the promoting group in the last years as a proportion of the cost of the present projects with the benchmark, to arrive at a score. DETAILED APPRAISAL It involves Qualitative Analysis of Promoter Company. The scoring of all the factors is on a four-point scale. The factors are judgmental and the model provides broad guidelines for the evaluation for the same. It involves analysis under two categories parameters for Detailed Evaluation: Management risk Management past experience I. MANAGEMENT RISK It evaluates two factors: Table 8: Detailed Appraisal Ratios Meaning Attribute being Evaluated Managerial Competency Quantitative Competency in running the business Business and Financial Policy Quantitative Risk Propensity Source: PFC Library II. MANAGEMENT EXPERIENCE Ratios Meaning Attribute being Evaluated Experience in Power Sector Quantitative Power Sector Experience Experience in Setting the Project Size Quantitative Project Management Capability Experience in India Quantitative Experience in dealing with Developed Economies Project Preparedness Quantitative Preparedness of the group to Execute the Project Source: PFC Library 27 | Page Project Appraisal & Financial Modeling 5.2.2. PROJECT RATING The project is rated against a set of qualitative and quantitative parameters. The qualitative parameters being Cost/MW, first full year of generation, levellised cost of generation and DSCR. The qualitative parameters are type of implementation structure, security of fuel, power sale agreement and satisfactory operation and maintenance. The weightage of parameter in calculating the score of qualitative and quantitative parameters is assigned on the company norms and policies. The upper and lower limits of qualitative and quantitative parameters are fixed and then on basis of pro-rata basis, assigning of rank is done. The parameter’s point and their allocation are also discussed on the set of standards. Quantitative Parameters First full year cost of generation w/o RoE. Levellised tariff/ cost of generation with RoE and tax Average DSCR Qualitative Parameters Power off take Fuel supply o Long term agreement o Short term agreement o Captive Coal mine o Transportation facility Construction Contract o Warranty o Market standard o Performance Type of contract and bidding Experience of the EPC contractor Commercial terms of Contract O&M o Past Experience o Management Team and efforts The criteria of two parameters are evaluated, assessed and quantified on the above factors, there is a set of scoring range and on the basis of that model project is ranked. 28 | Page Project Appraisal & Financial Modeling 5.3. FINANCIAL MODELING: A TOOL FOR PROJECT APPRAISAL In every project finance deal, where everyone’s financial security rests on the future performance of a new undertaking, a thorough analysis of the project’s finances under a arrange of assumptions is prerequisite for arranging debt and equity funding, financial model play a crucial role in decision-making. 5.3.1. STEPS TAKEN FOR DESIGNING A MODEL The essential steps to be taken for designing a financial model for any infrastructure project financing through private participation are as follow: Determining the scope of the project and the related EPC cost. Determining other

expenditure such as Development expense, Preliminary & Preoperative expenses, financial costs, etc. Determine the total Cost of the project with interest during construction. Assessment of tariff in order to determine revenue potential for the project. Determine O&M cost through the concession period. Calculating the fixed and variable cost relating to the project. Financial analysis to determine the most efficient means of financing. 5.3.2. PURPOSE AND USES OF FINANCIAL MODEL The financial model provide a basic analysis, usually based on relatively raw, preliminary data and simplified financing assumptions, to establish weather a given project is worth pursuing further. The required output may be: Basic Project IRR Debt service Coverage Ratios and other debt ratios. Establishing a financial structure that is sustainable by the project. An indication of tariff levels required for achieving appropriate returns. Preparation of sensitivity analysis. 29 | Page Project Appraisal & Financial Modeling CHAPTER 6: CASE STUDY 6.1 PROJECT PURPOSE AND SCOPE PURPOSE To bridge the nation’s energy deficit, both average and peak load, by capacity addition of 660 MW by setting-up Coal fired Thermal Power Project based on super critical technology at Tamil Nadu, India. SCOPE Scope of this project covers installation, commissioning, operation and maintenance of 660 MW with Super critical & Pulverised Coal fired boiler and associated systems. The Scope shall broadly cover: 660 MW power plant and associated systems. ‐ ‐Construction and commissioning of the Balance of Plants (BoP) required for efficient reliable and safe operation of the plant. Installation of BTG, their auxiliaries and commissioning. Construction ‐ ‐of water intake system for the project site. Transportation Arrangement for Coal to the Project site.‐ Power evacuation system including transmission lines. Construction of facilitation infrastructure ‐ ‐
such as administration building. 6.2 PROJECT DETAILS 6.2.1 LOCATION The location of the proposed plant is in Tamil Nadu. The project site is located at a distance of about 14 kms from the National High way and 15 kms from Trichendur town. The site elevation is +12 m above mean sea level. The site terrain is generally plain requiring minimum efforts to grade them suitable for construction of the project. The site was selected considering the followings: SNo Geographic Items Details 1 Location Tamil Nadu State 2 Nearest Railway Station Thoothukkudi 3 Road Approach Madurai –Tiruchendur- Manapad 4 Altitude +12 m above MSL 5 Nearest Airport Thoothukkudi 30 | Page Project Appraisal & Financial Modeling 6 Nearest Port Thoothukkudi 7 Rainfall (Annual) 600 mm 8 Climatic Conditions Tropical Climate 9 Latitude / Longitude 8o48’N / 78o10’E 10 Soil bearing capacity 25 T/M² There is no cultivation in the project site and rehabilitation of resident population from the project site does not arise. Around the project site there is no reserve forest within 15 Km radius. 6.2.2 LAND The project is being implemented in Tamil Nadu. The company has already acquired 600 acres of land and site development works will commence shortly. The land is currently not in use and there are no inhabitants requiring rehabilitation or resettlement. Specifications Land area(Acres) Plant area 260 Ash disposal 130 Colony 10 Green belt others 100 Others 100 Total 600 The site identified for the Project is generally plain requiring minimum efforts to grade them suitable for construction of the project. . Around the project site there is no reserve forest within 15 Km radius. The Company has paid Rs. 50 Crore towards allotment of land and development works. The Company proposes to use the allotted land for setting up Main Power Plant, colony and Ash Dyke requiring about 400 acres. The remaining allotted land, about 100 acres, would be used for Green Belt development. The balance land of about 100 acres would be acquired by the Company in due course. The site development for the Proposed Project site, covering levelling, boundary wall, internal and approach roads and other miscellaneous requirements, is estimated to cost about Rs. 20 Crore. 6.2.3 WATER The requirement of water for the plant will be for meeting the requirement of make up for the water system, dust suppression system in coal handling plants, ash disposal 31

| Page Project Appraisal & Financial Modeling system and the D.M. water plant which will be supplying the power cycle make up requirements. In addition the water requirements will be for drinking and service purposes. The total requirement of water for the plant will be around 150 m³/hr for the project. Water requirement for the plant Sl No. Item Quantity (m³/hr) 1 ACW System make up 80 2 Power Cycle make up 45 3 Service Water Requirement 15 4 Portable Water Requirement 10 Total 150 ABC Ltd. has made an agreement of minimum SG portable water supply of 4000m3 /day of SG portable water by SG. A raw water reservoir of 25200m3 capacity to hold 7 days requirement for plant requirement of water will be constructed at the plant site. Air cooled condenser for turbine is proposed. Water drawl approval has been obtained by the company. The basic features of the sweet water system and auxiliary cooling water for the proposed station will be proposed to buy from prospective water suppliers. Air cooled condenser is proposed for condensing steam. At the Plant, a water reservoir will be installed to meet 7 days requirement of the plant. The overall cost of water arrangement as estimated by the Company is about Rs. 90 Crore and has been considered in the Project cost. 6.2.4 SUPER CRITICAL TECHNOLOGY The Proposed Project is based on Super Critical Boiler Technology instead of more prevalent Sub-Critical Boiler Technology in India. The basic difference between the two technologies is the steam pressure at which the boiler is operated. In case of Sub Critical Technology the operating pressure in boiler is less than 19 MPa as against 24 MPa in typical subcritical power plant. The supercritical power plant can achieve considerably higher cycle efficiencies with resulting savings in fuel costs and reductions in CO2 and other emissions. Plant costs are comparable for both the technologies. However, overall economics for super critical technology are more favorable because of the increase in cycle efficiency. Economic performance is also influenced by other factors, including plant availability, flexibility of operation and auxiliary power consumption. The once-through boiler design used in super critical technology based plants is inherently more flexible than drum designs used in subcritical technology based plant, due to fewer thick section components allowing increased load change rates. Typical average availability of super 32 | Page Project Appraisal & Financial Modeling critical technology based power plants is about 85%. However, with appropriate design and materials, a plant availability of >90% is achievable. Efficiencies of supercritical power generation are also less affected by part load operation, with efficiency reductions less than half those experienced in subcritical plant. The major environmental benefit of supercritical power generation is from reduced coal consumption per unit of electricity generated, leading to lower CO2 and other emissions. CO2 emissions for supercritical plant would be 17% lower than for a typical subcritical plant. Similarly, all other emissions e.g. NOx and SOx, would also be reduced pro-rata with the reduction in coal consumption. However, for optimum environmental performance, supercritical power generation technology can benefit from advanced emissions-control technologies to minimize harmful emissions. These include flue gas desulphurization (FGD), low-NOx combustion, selective catalytic reduction (SCR), selective non-catalytic reduction (SNCR), air staging and reburn technologies. The lower CO2 emissions from super critical plants are quantifiable and the project can be registered as a CDM project for accruing CERs which can be traded with international markets. This can potentially work as an additional revenue stream for the project. 6.2.5 TECHNOLOGY Thermodynamic cycle Thermodynamic reheat cycle. The thermodynamic reheat cycle consists of steam generator, steam turbine generator with condenser, the Condensate extraction and boiler feed pumps along with H.P & L.P feed water heaters & deaerator. Technical and performance parameters This project is based on supercritical technology. The critical pressure point of water and steam is 22.1 MPa, below this pressure it is called sub-critical pressure and above this pressure it is called as supercritical pressure. In the supercritical region, co-

existence of water and steam is not present, therefore in the absence of steam/water mixture, the recalculating boiler technology adopted for subcritical pressure could not be used. This was the key to the advancement of cycle efficiency through the adoption of economic and reliable once-through supercritical boilers. The drive for enhancing the efficiency of generating plants in and environmentally friendly manner has been realized mainly through advancing the steam conditions, i.e. increasing pressure and temperature. This led to the development of some new power generation technologies like integrated gasification combined cycle (IGCC) and pressurized fluidized bed boilers (PFB). Boiler Feed Pump Three nos., horizontal, multistage, centrifugal type boiler feed pumps will be provided. Two nos. pumps will be turbine driven with steam extracted from turbine & one no pump will be motor driven as standby. Each boiler feed pump will have one matching capacity single stage booster pump. The booster pump will take suction from feed water storage tank and discharge into the suction of corresponding main boiler feed pump 33 | Page Project Appraisal & Financial Modeling which in turn, will supply feed water to boiler through the high pressure heaters and feed control station. Condensate extraction pumps The condensate extraction pumps will be vertical, multi stage enclosed canister type with flanged connection driven by electric motor. Two nos. condensate extraction pumps are used in this system. Supercritical Boilers Different boiler technology is used which is the critical requirement in the adoption of supercritical pressure and temperature. With supercritical pressure boiler need to increase the wall thickness of the pressure components and also use advanced materials for its effective working. Super critical steam turbine Steam turbine is of 3000rpm and is designed for main steam parameters of 247kg/cm2 & 540°C before emergency stop. High pressure steam turbines must be designed to withstand the higher pressure and temperature. Typical feedwater temperatures are around 275°C to 290°C compared to around 235°C to 250°C for sub-critical plants. With supercritical pressures, because of the greater steam pressure range in the turbine from inlet through to the condenser, there is greater scope for including an extra stage or stages of feedwater heating. This will further increase the cycle efficiency. 6.2.6 PRIMARY FUEL The primary fuel for the Proposed Project would be domestic coal. The Company proposes to use coal available from CIL mines. Coal India Limited has made a LoA with the company for use of coal in the Proposed Project. The Company has approved the agreement. The average calorific value of the coal is expected to be about 3400 kcal/kg. Considering this Gross Calorific Value and PLF of 85% the coal requirement of the Project works out to be about 3771700 TPA. The Company has estimated the capital investment of Rs. 900 per tonne at an escalation of 5% p.a and the same has been incorporated in the overall Project Cost. 6.2.7 SECONDARY FUEL HFO, which is the secondary fuel for pulverized coal, will be used for flame stabilisation at low loads and for supporting purposes. Heavy fuel oil will be supplied from oil depot by means of truck. Two HFO storage tanks each of capacity 1000m³ with necessary heating arrangement within the tank will be provided. The estimated maximum annual requirement of HFO is 4914 KL. Capital investment of Rs 50 per kg at an escalation of 4% p.a has been estimated. LDO system will be designed for 7.5 % of BMCR, which will be considered sufficient to introduce heavier grade fuel. The light diesel oil will have provision for supply to the steam generator for startup purpose. The estimated maximum annual requirement of LDO is 1000 KL. 34 | Page Project Appraisal & Financial Modeling 6.2.8 TRANSPORTATION Coal will be transported from the Indian Coal fields to the Paradeep Port by Rail and from the port to the Manappadu Port located near to the project site by ship. Coal unloaded from ship will be stored in a separate coal yard to be set up by prospective Coal sellers at Manappadu port and coal will be supplied at the plant boundary by conveyors. Calorific value of Indian F grade coal will be in the range of 3400 kcal/kg. Rail route already exists upto Tiruchendur.

About 12 km of rail route from Tiruchendur to project site is under approval. For transportation of coal, the Company would enter into Coal Transportation Arrangement (CTA) with the Indian Railways. Due to the availability of port facilities for transportation of coal from the mines, it is convenient and economical to unload and transport the coal to the plant. Coal will be also be transported from the port to the Manappadu Port located near to the project site by ship. Alternatively trucks will also be used for coal transfer from port to plant. Company has made a logistic agreement with Aspinwall Co Ltd for transportation of coal from port and railway station to the plant. 6.2.9 EPC CONTRACT Under an EPC contract, the contractor designs the installation, procures the necessary materials and builds the project, either directly or by subcontracting part of the work. EPC contract for this project is been given to Consolidated Construction Consortium Ltd. It is proposed to entrust the entire work of project execution covering all civil works, electrical and mechanical systems to a single EPC (Engineering, Procurement and Construction) Contractor who will take overall responsibility for timely project execution and plant performance and provide guarantees for the same. SCOPE The EPC Contractor’s scope of work includes design, engineering, manufacture, supply, erection, testing and commissioning within the Power Plant site. The EPC Contractor would be responsible for all basic and conceptual engineering, detailed system engineering, design & drawings for all mechanical and electrical systems, detailed designs and construction drawings for all civil works, manufacture of equipment as applicable, procurement of sub-contracted equipment and materials, review of sub-contractor’s design and engineering, inspection and expediting of sub- contracted equipment, transport of equipment and materials to site, stores management at site, overall site management covering construction, erection and commissioning activities and performance testing for the complete Power Plant. The contractor agrees to provide all civil and structural works including supplies of cement, reinforcement steel and structural steel etc. The lump sum amount of Rs 524 crore represents the lump sum fixed price towards the services to be provided by the contractor, pursuant to the scope of work under this Agreement. The contractor shall complete all the works as per project schedule approved by owner, pursuant to various conditions of this agreement, within 30 months from the start of project commencement date. 35 | Page Project Appraisal & Financial Modeling 6.2.10 OPERATION AND MAINTENANCE In order to ensure a high level of performance of the power station, it is proposed to entrust the operation and maintenance of the power station to an experienced O&M Contractor. In order to ensure that the design and construction of the power station incorporates all necessary features required for easy and efficient operation and maintenance of the proposed power plant, the proposed O&M Contractor will also be consulted during the review of EPC contract documents, plant design features, operational and maintenance features of plant systems and equipment. O&M Contractor’s general manager would have primary responsibility for the operation & maintenance of the power station. O&M Contractor’s site organisation is expected to comprise four broad functional areas viz. operations, maintenance, engineering and administration. Operation of Power Plant, coal and ash handling systems, water systems including water treatment system, switchyard and other auxiliary plant. Operations manager would be overall in charge of operations, all other operation personnel would work on three - shift basis. Shift personnel manpower planning for key areas has been generally done on (3+1) concept to take into account leave taken by shift personnel. Maintenance of all mechanical and electrical plant, control systems, buildings, roads, drainage and sewage systems, etc., operation of the plant workshop, planning for scheduled maintenance works and deciding requirement of spare parts. The O&M team of the power station would be headed by a Senior Vice President, under whom separate groups viz. Operation, Mechanical, Electrical, Civil and
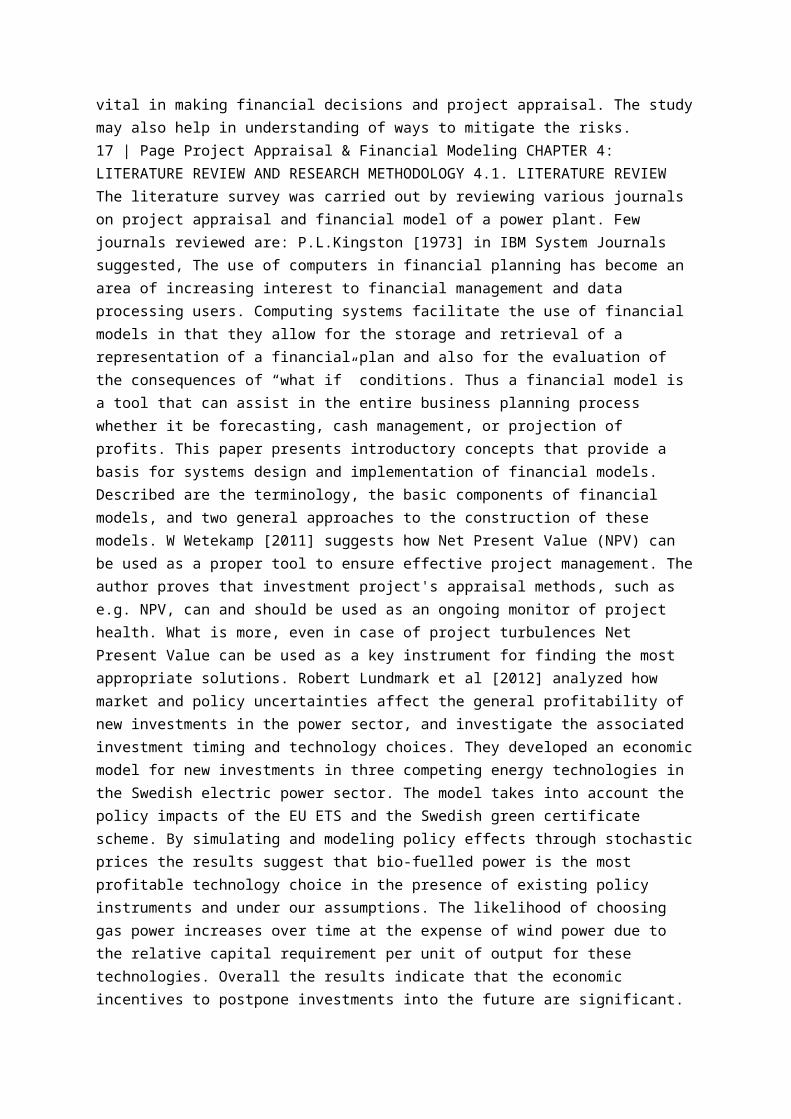
C&I maintenance would operate. In addition to these groups, operation and efficiency improvement group and maintenance planning group would monitor the efficiency in operations and maintenance management respectively and suggest continual improvements. 6.2.11 INFRASTRUCTURAL REQUIREMENTS Construction Power The company has received approval for drawl of construction power from nearby substation of Tamil Nadu Power Distribution Company Ltd. (TNPDCL). Construction Water The total water requirement for the project is 2000 m3 /day. This water will be sourced from nearby desalination plant. The requirement of construction water for potable and service purposes will be met by the nearby desalination plant located within the allotted land for the Project. The Company has taken over the desalination plant along with the auxiliary and paid about Rs. 50 Crore for the same. 6.2.12 EVACUATION OF POWER The power generated from the plant will be evacuated at 400 KV through PGCIL / TNEB grid lines. Three / Four 400 KV transmission line circuits are proposed from 36 | Page Project Appraisal & Financial Modeling 400KV switch yard to Udangudi STPP Substation for further connectivity to southern grid. Company’s generation project shall implement, maintain and operate dedicated transmission system for immediate evacuation of power from their generation projects. a) Company’s Power generation switchyard-tuticorin pooling station 400kV D/c quad/high capacity line. b) Two nos of 400kV bays each at Company’s switchyard & Tuticorin Pooling POWERGRID station. The cost of the transmission line is estimated by the Company is about Rs. 52 Crore. 6.2.13 ENVIRONMENTAL ASPECTS The project site is located at a distance of about 14 kms from the National High way and 15 kms from Trichendur town. There is no cultivation in the project site and rehabilitation of resident population from the project site does not arise. Around the project site there is no reserve forest within 15 Km radius. Since all necessary pollution control measures to maintain the emission levels of dust particles and sulphur dioxide within the permissible limits would be taken and necessary treatment of effluents would be carried out, there would be no adverse impact on either air or water quality in and around the power station site on account of installation of the proposed plant. Ash Handling System The fly ash generated in thermal power stations has commercial value because of its usage in cement and construction industries in various forms. Fly ash generated from the proposed power plant would be commercially utilized in one or more of the following industries, to the extent possible a. Manufacture of fly ash bricks b. Manufacture of aerated wall blocks and panels c. Fly ash Aggregate d. Land reclamation e. Ready Mixed Fly Ash Concrete f. Utilisation in Roads/Paving g. Use in cement manufacturing using fly ash in combination h. Manufacture of fly ash bricks i. Export of Fly ash to countries like Bangladesh and Middle East. Water Handling System Hydrochloric acid and caustic soda would be used as reagents in the proposed water treatment plant. The acid and alkali effluents generated during the regeneration process of the ion exchangers would be drained into an underground neutralising pit. The effluent would be neutralised by the addition of either acid or alkali to achieve the required pH. 37 | Page Project Appraisal & Financial Modeling Waste water from the Coal yard suppression system and leaching water is collected in the settling tank. The clear water will be disposed to the nallah through CEMS. The Sludge will be dried in a Drying Pond and then Reused. Sewage water from power plant and canteen will be collected in the Anaerobic treatment pond and from there it will be sent to the clarifier. The treated water will be used for horticulture purpose. The oily waste water will be treated in an Oily Water Separator. The clear water is disposed through CEMS and the Oily Sludge is disposed offsite. Air Handling System The height of the stack which disperses the pollutants have been fixed based on the above guidelines of the Indian Emission Regulations. The electrostatic precipitators which remove most of the fly ash from the flue gas, thereby limiting the quantity of fly ash emitted to atmosphere. By selecting a

suitable furnace and burner for the steam Generator, NOx formation has been avoided and no additional equipment for NOx control is required. Although there is no statutory stipulation for regulation of NOx emission, the boiler will be designed for maximum of 750 mg/Nm3 with provision of low NO burners. Dust nuisance due to Coal handling would be minimised by providing suitable dust suppression/extraction systems at crusher house, junction towers etc. For the coal stockyard, dust suppression system would be provided. Boiler bunkers would be provided with ventilation system with bag filters to trap the dust in the bunkers. Noise Handling System As per State Pollution Control Board, Ambient noise level for Industrial area will be Sl. No Time dB (A) 1. Day Time 6 AM to 9 PM 75 2. Night Time 9 PM to 6 AM 70 The above noise level at plant boundary during normal operation is ensured by proper selection of the system. Controlled noise level from originating equipment and green belts around the plant area. Project clearances received from statutory authorities, Tamil Nadu State Pollution Control Board (TNPCB) and the concerned agencies of the Government of Tamil Nadu and India. Statutory Clearances All statutory clearances requires at Central/State level for the implementation of the project are to be ensured. Depending on the cost of project, techno economic clearances of CEA/SEB may be asked. Clearances/Agreements required for implementation of project: 1. Land Acquisition 2. Water Availability 3. Stack Height: Airport Authority of India 4. Forest Clearance: Such that no sanctuary, reserve, national park within the project 5. No defense establishment 38 | Page Project Appraisal & Financial Modeling 6. Ministry of environment and Forest 7. Fuel Supply Arrangement/Agreement through various coal linkages 8. Fuel Transportation Arrangement 9. PPA for selling Electricity 10. Transmission agreement with Transmission agency 11. Pollution Control Board Table 9: Approval and Agreement Status Major Clearances/ Agreements S No Requirement Agency Status 1 Consent to establish / NoC Tuticorin Airport Certified 2 Environment Clearance MoEF The Company has applied for the clearance. 3 Forest clearance MoEF The Company has applied for the clearance 4 Water Drawl SG Agreement made 5 Stack height Clearance Airport Authority of India (AAI) Approved 6 Pollution control board NOC for power plant Tamil Nadu Pollution control board (TNPCB) All the required standards of Pollution control board are met 7 Land Availability State Government 600 acres has been acquired 8 Primary Fuel Coal India Limited Long term agreement made on 15 April 2010 9 Transportation of Fuel Aspinwall Co Ltd Fuel Transport Agreement made 10 Transmission Line PGCIL Open Access and Transmission Agreement made 11 EPC / package contract Consolidated Construction Consortium Ltd. Agreement made on 18 June 2010 6.3 PROJECT COST 6.3.1 COMPONENTS OF PROJECT COST The Project is estimated to be set up at an aggregate cost of Rs. 4251 Crore comprising of expenditure towards Land, EPC Cost, Transmission Line, Coal Transportation Arrangement, Water Arrangement, Preliminary & Preoperative Expenditure, Contingencies, Interest During Construction Period and Margin Money for Working Capital. A summary of the components of Project cost is presented below: 39 | Page Project Appraisal & Financial Modeling Table 10: Project Cost Details Sl No. Particulars Total Cost 1 Land & Site Development 50 2 Total Plant & Equipment 2038.48 3 Civil Works 545 4 Electric Works 135 5 Miscellaneous 146.5 Total Hard Cost 2914.98 6 Overhead & Pre-Op. Expenses 114.59 7 Interest During Construction 656.20 8 Working Capital Margin 565.43 Total Soft Cost 1336.22 (in crore) Total Project Cost 4251 6.3.2 FINANCING PLAN The tentative financial plan for the proposed project is as follows: Particulars Percentage Cost (Rs Crore) Debt Equity Ratio 3.00 Equity 25% 1062.80 Debt 75% 3188.40 Upfront Equity 51.5% 547.342 Total 100% 4251 6.3.3 DEMAND AND SUPPLY Inspite of 18,382 MW of installed capacity the state of Tamil Nadu is struggling to fulfil its electricity demand. The electricity demand in the State had increased but the capacity of the generating facilities had dropped due to inefficiencies resulting in shortfall. Most of

the districts in Tamil Nadu face power cuts lasting over six hours. Between April 2012 and February 2013, the energy and peak shortage of power in Tamil Nadu were 17.4 % and 12.3 % respectively of the demand. 40 | Page Project Appraisal & Financial Modeling Electricity deficit in the state has increased from 1% in 2005-06 to 11% in 2011- 12. Between 2005-06 and 2011-12, electricity requirement grew at CAGR of 9%, while availability only grew at around 7% leading to increasing electricity deficits. Source: CEA website Table 11: Power requirement and availability for year 2012-2013 for Tamil Nadu Period Peak Demand (MW) Peak Availabilit y (MW) Peak Deficit/Surp lus (MW) Energy Requiremen t (MU) Energy Availabilit y (MU) Energy Deficit/S urplus (MW Apr 12 12499 9841 -2658 7583 5817 -1766 May 12 11967 10182 -1785 6796 5840 -956 June 12 12296 11053 -1243 7868 6834 -1034 July 12 12269 10877 -1392 8043 7333 -710 Aug 12 12004 10566 -1438 7840 6763 -1077 Sep 12 12606 10348 -2258 7990 6606 -1384 Oct 12 12538 10269 -2269 8233 6574 -1659 Nov 12 11755 8306 -3449 7110 5254 -1856 Dec 12 12323 9409 -2914 7450 5831 -1619 Jan 13 12038 9698 -2340 7859 6668 -1191 47872 54194 61499 65780 69668 76293 80314 85685 47570 53853 60445 63954 64208 71568 75101 76705 1% 1% 2% 3% 8% 6% 7% 11% 0% 2% 4% 6% 8% 10% 12% 0 10000 20000 30000 40000 50000 60000 70000 80000 90000 FY 2005 FY 2006 FY 2007 FY 2008 FY 2009 FY 2010 FY 2011 FY 2012 MU Figure 6: Actual power supply position in Tamil Nadu Requirement Availability % deficit 41 | Page Project Appraisal & Financial Modeling Feb 13 11803 10021 -1782 7288 5998 -1290 Mar 13 12736 10556 -2180 8242 6643 -1599 TOTAL 134565 121126 -13439 92302 76161 -16141 Source: CEA, Load Generation Balance Report (2012-2013) 6.3.4 COST BENEFIT ANALYSIS Table 12: Project details sheet No. of units 1 Capacity per unit 660 MW Total project capacity 660 MW Without IDC 3595 Rs Crore IDC 656 Rs Crore With IDC 4251 Rs Crore Equity (25%) 1062.80 Rs Crore Debt (75%) 3188.40 Rs Crore Upfront Equity (51.5%) 547.34 Rs Crore Interest Rate pre COD 13.25% p.a. Interest rate post COD 13.25% p.a. Working Capital 13% p.a. Repayment Period 12 Years Moratorium Period 6 Months Principle Repayment Start Date 01-Jul-14 Date Principle Repayment End Date 01-Jan-26 Date Interest Repayment Start Date 01-Jan-14 Date Interest Repayment End Date 01-Jan-26 Date MOU with PTC (including all units) % of total capacity 70% PPA Tariff As per CERC based tariff Rs/unit No. of years 25 years Selling through Merchant Basis (including all units) % of total capacity 30% PPA Tariff 3.5 Rs/unit No. of years 25 years Escalation per year 5% Corporate Tax 33.99% MAT 20.96% 42 | Page Project Appraisal & Financial Modeling GSHR 2392 kCal/kwh Auxiliary Consumption 7% % Plant Load Factor 85% % O&M Escalation 5.72% % O&M Expense 0.155 crore/MW Fuel Price 900 Rs/tonne Price Escalation 5% p.a. Gross Calorific Value 3400 kCal/kg Secondary Fuel Price 50 Rs/kg Gross Calorific Value 10280 kCal/kg Secondary Fuel Consumption 1 ml/kwh Specific Gravity value of Secondary Fuel 0.95 Price Escalation 4% p.a. Transportation & Handling Charges Escalation Coal Stock 2 Months Secondary Fuel 2 Months O&M Expenses 1 Month Maintenance Spares (20% of O&M Expense) 1 Year Receivables from Energy Sales 2 Months Rate For Tariff Calculation 5.28% Land 0% Civil Works & Building 3.34% Plant & Machinery 5.28% Max Depreciable Value 90% Machinery 15% Building 10% Discount Rate 13.10% % Return on Equity 15.50% % Return on Equity pre tax (first 12 years) 19.38% % Return on Equity pre tax (last 13 years) 22.95% % Project Life 25 years Total units generated 4914.36 MU 43 | Page Project Appraisal & Financial Modeling 6.3.5 FINANCIAL MODELLING AND PROJECTIONS After doing through study of the information Memorandum and all the contracts and the agreements signed by ABC Ltd. the Financial Analysis is performed. Various parameters that need to be calculated as a part of the financials of the project are: INTEREST DURING CONSTRUCTION In the Interest during construction phase is the period were the power plant is in the process of making and during this time it generates no revenues. The complete infusion of term loan and the equity by the financers and

promoters respectively is done in this phase. This period starts from the date when the sub – debt and then the upfront equity starts flowing into the project (upto 51.5 % of the total equity) by the promoters, when the Upfront Equity part finishes Upfront Debt starts flowing till the time Debt Equity ratio becomes 75:25. Once, the ratio is achieved the Matching Debt and Matching Equity flows simultaneously in the ratio of 75:25. During the construction period the project has to pay the interest on the debt fused till that month. The interest rates depends on the Pre COD Rates and sub debt rates are specified by the leading Financial Institution (FI), which is also the syndicator of the project. (IDC Sheet Attached in Annexure III) DEBT PAYMENT When the project is commissioned then the borrower company has to pay the interest on the Term Loan. The interest rate used is the weighted average of Post COD Rates and sub debt rates are specified by the leading Financial Institution (FI), which is also the syndicator of the project. The First Six months after the project commissioning is the Moratorium Period that is during this period no principle repayment will be done but the interest will be charged according to the Post COD Rates. After the Moratorium period the project has to pay both the principle repayment and interest on the term loan. (Sheet is attached in the Annexure V) FUEL REQUIREMENT The main objective of this part is to calculate the requirement of fuel for the project and thus calculate overall cost of fuel required per annum for each of the next 25 years of operation of the plant from the date of start of operations, which is assumed as the life of the Thermal Power plant. Here we first calculate the primary fuel cost and secondary fuel cost on yearly basis for 25 years depending upon the energy exported and GCV of the fuel that will be charged to the project. While calculating the fuel cost we consider the Fuel Charges Escalation (as mentioned in Power Purchase Agreement).For this we calculate the amount of units that the project will be producing every year for 25 years. This is done on the basis of installed capacity (MW) from the point the very first unit becomes operational to the point 25 years ahead of the last commissioning of last unit. Plant Load factor (PLF) is also taken into consideration. This collectively gives the amount of fuel required to generate the stipulated amount of power. After knowing the amount of fuel required and the cost for 25 years we calculate the fuel cost on yearly basis. (Fuel requirement sheet is attached in Annexure VI) 44 | Page Project Appraisal & Financial Modeling TARIFF This is among the most important parameters of the project. In this the main objective is to calculate the Variable Cost and Fixed Cost of generation of one unit of electricity. This cost is the cost to the company. This cost is compared with the Quoted Tariff, as specified in the PPA so as to figure it that whether the company is selling the electricity on profit and loss. VARIABLE TARIFF: Variable tariff only takes into account the primary fuel cost. This is obtained by using formula: Variable Cost Electricity Units sold FIXED TARIFF: As per CERC norms, the fixed cost takes the following parameters into consideration: Secondary Fuel Cost Interest on Loan Capital Return on Equity Depreciation O&M Expenses Interest on Working Capital Fixed tariff is calculated as: Fixed Cost Electricity Units sold The sum of variable cost and the fixed cost gives the total Tariff that should be charged to get the desire return on Equity. (Tariff sheets attached in Annexure VIII) DEPRECIATION Depreciation is calculated on the Machinery and Building strictly according to the CERC Guidelines. Depreciation shall be calculated on straight line method and at rates specified in the CERC guidelines for the assets of the generating station but the company files the tax according to IT ACT section 80. (Tariff sheets attached in Annexure IV) WORKING CAPITAL REQUIREMENT The working capital requirements as specified in the CERC guidelines are as follows: Working Capital Limits Primary Fuel Stock 2 Months Secondary Fuel Stock 2 Months 45 | Page Project Appraisal & Financial Modeling O&M Expense 1 Month Maintenance Spares 20% O&M Receivables from energy sales 2 Months (Detailed Working Capital requirement sheets is attached in Annexure VII) CASH

FLOW The Objective of this part is to calculate the total cash flow Inflow and Outflows, and then to calculate the excess/shortfall. (Detailed Cash flow sheets is attached in Annexure X) PROFIT AND LOSS ACCOUNT The main aim of this part is to calculate the Profit & Loss of the project for the 25 years after the commissioning of first unit. In case of PTC (long term) the levelised cost of electricity is Rs 2.475/kWh and that for short term is Rs 3.5/kWh. The sale of electricity to PTC is done at the rate of Rs 2.475/kWh for aggregate cap of 70% and rest at variable cost of Rs 0.63/kWh. (Detailed P&L is attached in Annexure IX) BALANCE SHEET This part accounts for the assets and liabilities per year for the project for 25 years from COD. (Detailed Balance sheet is attached in Annexure XI) RATIOS This part is used to calculate the relevant ratios in order to determine the financial viability of the project. The Minimum, average and maximum Debt Service Coverage Ratio is calculated along with Internal Rate of Return and Net present Value are calculated. (Detailed Ratios sheet is attached in Annexure XII) 6.3.6 SNAPSHOT OF FINANCIAL PROJECTIONS The financial projections, based on the capital/project cost as specified by the borrower, would be as below: Table 13: Snapshot of project financial projections Particular Value Value Parameters DSCR Minimum 1.403 Average 2.106 46 | Page Project Appraisal & Financial Modeling Maximum 4.212 Project IRR, 25 years 18.54% Equity IRR, 25 years 21.41% Levelised cost of generation 2.475 Rs/kwh 6.3.7 SENSITIVITY ANALYSIS A sensitivity analysis of the Company’s financial position has been carried to ascertain the robustness of its financials. Various scenarios for which the sensitivities was carried out and the results are as follows: Table 14: Sensitivity analysis sheet Scenario Min DSCR Avg DSCR Project IRR (%) Equity IRR (%) Base Case 1.403 2.106 18.54 21.41 Case 1: PLF at 65% 1.238 1.784 16.44 18.12 Case 2: Increase Fuel cost by 20% 1.371 2.043 18.20 20.81 Case 3: Increase project cost by 10% 1.332 1.974 17.70 20.35 Case 4: Decrease in calorific value of coal by 1000 kcal/kg 1.336 1.975 17.83 20.13 Case 5: Increase interest rate by 100 bps 1.373 2.068 18.73 21.25 It may be observed from above mentioned results that project financials are quite robust in various scenarios and the DSCR levels are above satisfactory. 47 | Page Project Appraisal & Financial Modeling CHAPTER 7: RISK ANALYSIS AND SWOT ANALYSIS 7.1 RISK ANALYSIS i) PRE CONSTRUCTION Sno Risk Mitigation / Allocation 1 Grant of approvals / Clearances Obtain all statutory and non statutory clearances including the MOEF clearance, Pollution Control Board NOC and agree to comply with all the conditionality of these clearances. 2 Finalization of Contracts The Company has already awarded the EPC Contract Project. The service contract has also been awarded by the Company. The EPC contract has provided for liquidated damages in case of delay in implementation and for plant’s various performance parameters below stipulated level. 3 Procurement of land Land has been already acquired which is sufficient for the main power block, Ash Dyke and Raw Water Reservoir. ii) CONSTRUCTION Sno Risk Mitigation/Allocation 1 Cost estimate Since the technology is based on super critical parameters, it is difficult to fairly compare costs and to estimate the cost precisely. 2 Cost increase and price Escalation Package contracts are expected to have suitable safeguards and will be subject to LIE review. Also, any increment in project cost would be met by the promoters without recourse to either the project or its lenders. 3 Completion delay and Equipment Supply delay The package contract is expected to have suitable provision for timely project completion. Also, LDs have been stipulated for delay in equipment supply. 48 | Page Project Appraisal & Financial Modeling 4 Equity infusion The equity in company will be infused by promoter’s Group as also by raising funds from financial/strategic investors. iii) POST CONSTRUCTION Sno Risk Mitigation/Allocation 1 Fuel supply risk The Company has made a long term fuel agreement with CIL. Hence, fuel supply risk is perceived to be moderate. 2 Fuel price risk The fuel supply agreement is yet to be signed. The fuel supply agreement shall be subject to review by Lenders / Lenders’ agencies. 3 Performance shortfall

The EPC Contract is expected to provide suitable defect liabilities / warranties. LD clauses would also be stipulated for ensuring performance. As a preventive measure, the design shall be subject to review by both the Owners Engineer and LIE. 4 Technology risk EPC contract have been awarded to a contractor having super critical technology and sufficient experience. Company is also implementing other project on the same technology, which again reduces the risk. 5 Force Majeure The risk will have to be borne by the project Company, and may prove to be damaging for the project and by extension the lenders. This may be mitigated to some extent by ensuring adequate security for the lenders. 6 Off take risk The Company would sell 70% of net power to State Discom through a long term PPA at a levelized tariff and rest at Rs 3.5 per unit on merchant basis with escalation of 3% p.a. 7 Price risk The cost of generation, is lower than the assumed average purchase price of power. The risk may be perceived to be low. 8 Payment risk Payment risk is perceived to be low as the major portion of power is being sold to State Discom under a long term take or pay PPA. 49 | Page Project Appraisal & Financial Modeling Also, LDs have been specified in the PPA for payment security. 9 Environmental Hazards Obtained MOEF Clearance and Pollution Control Board NOC. 10 Lower cost power producers With newer technology, the cost of energy generated might be significantly lower than cost of energy. Older plants, with depreciated assets would also be able to compete with company. 7.2 SWOT ANALYSIS STRENGTH The Project has long term fuel supply agreement with Coal India Limited of Coal for use in the Project. The Project is located in severe power shortage region. State itself has been facing severe power shortage and the power deficit is likely to continue in short and medium term. The Company has already acquired 600 Ha land which is adequate for the main power plant block. The work on site may start immediately without any delay. Promoting Group has demonstrated its infrastructure project development and execution skills in the port sector and is on the verge of completion of the power project. The Project is based on Super Critical Technology which is expected to provide efficiency gains to the Company resulting in lower cost of generation. Use of Super Critical Technology will reduce the pollution and the Project may be qualified to get CER under CDM. This would act as additional revenue stream for the Project and improve the financials of the Company. WEAKNESS Company shall be selling 30% of power on Merchant Basis and may get lower return than the levelised cost of generation. Environment and Forest Clearances still to be obtained. 50 | Page Project Appraisal & Financial Modeling OPPORTUNITY The Electricity Act 2003 and subsequent National Electricity Policy and Tariff Policy have opened up several opportunities for the power sector. The Act allows the IPPs and captive power producers open access to transmission system, thus allowing them to bypass the SEBs and sell power directly to bulk consumers. These provisions will give credence to the concept of merchant power. With the advent of the era of competitive bidding for tariff for procurement of power, the new capacities would not be subject to regulated tariff and regulated return of equity and thus provide investment opportunities to Developers in the power sector where returns would be market determined. There is huge power deficit in the country and the demand supply situation in the country is expected to remain favourable to power generators for the next 8/10 years at least. This presents huge opportunities in the power sector for power generators. THREATS A part of power generated will be sold on Merchant basis and may get lower return than the levelised cost of generation. Fuel supply agreement with Coal India Limited may result in delay 7.3 LIMITATIONS This analysis is limited to an examination of annualized expenses and revenue and represents a prototypical year of operations. This analysis should examine alternative pay as- you-go and debt financed scenarios, be conducted in year-of-expenditure, and address the underlying uncertainties associated with inflation, interest rates, project cost (exclusive of inflation), foreign exchange rate,
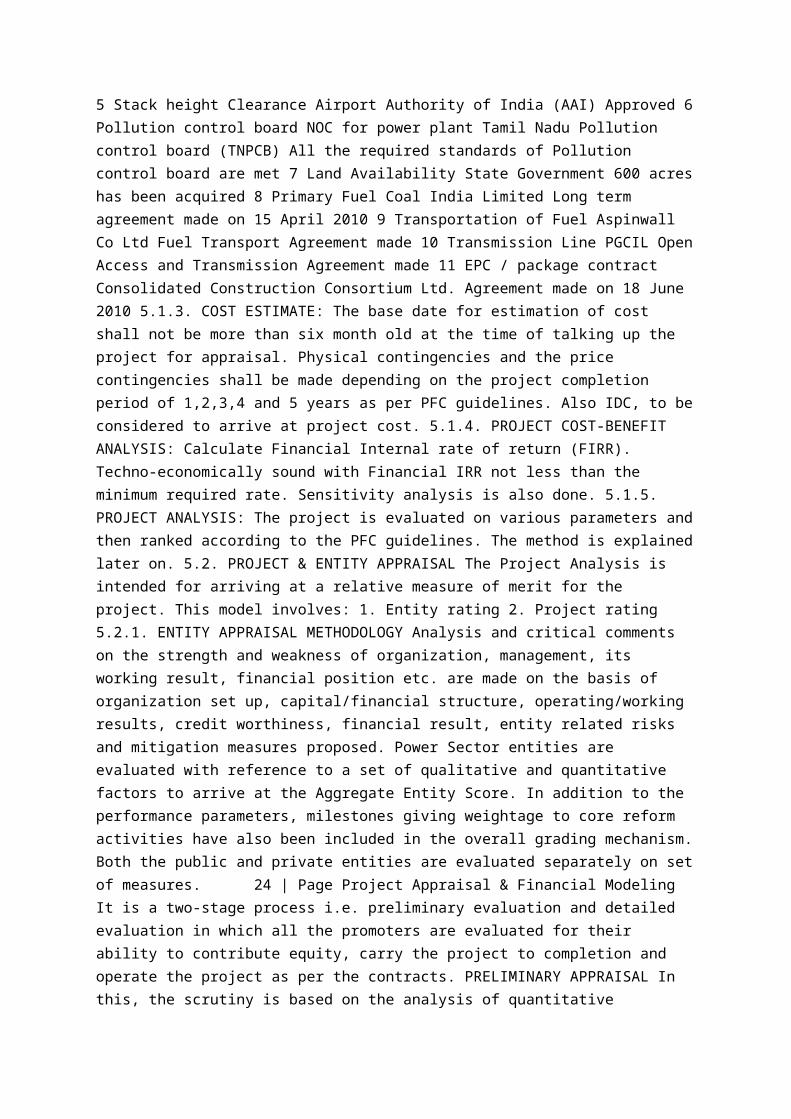
grant funding levels and rates of payment, and other factors over which the project sponsor will have no direct control. The assumptions and sources of information underlying the development of the capital and operating cost estimates are an integral part of the financial analyses documented in this report. Uncertainties associated with fluctuating economic conditions and other factors may result in the actual results of the financial program varying from the projections in the financial analyses, and the variations could be material. Some of the major limitations and issues regarding the project appraisal are as follow: The rate of escalation is taken as constant over the life of the project (about 25 years); being the life of project large it is not easy to predict the actual cost and inflationary effect on the price of fuels and other inputs with the change in market conditions. Cash flows not really known until the project is in service – no history of cash flows. 51 | Page Project Appraisal & Financial Modeling Value of debt and equity driven by cash flow. Measure the value of different securities supported by project cash flow. Risk analysis depends on contracts used to allocate risk to different parties. 52 | Page Project Appraisal & Financial Modeling CHAPTER 8: CONCLUSION, RECOMMENDATIONS AND LEARNING 8.1 CONCLUSION Company has proposed to set-up 660 MW Coal fired Thermal Power Project based on Super Critical Technology. State Government has supported this Project and has issued letter of support to provide all kind of administrative support required. The Company has already acquired the land required for the Main plant from Industrial Development Corporation and has made the requisite payments. The remaining required land has been identified and the process of acquisition is underway. The Proposed Project will be implemented by way of a turnkey Engineering, Procurement and Construction (EPC) contract to be awarded on Competitive Bidding Process. The Project requires about 3771700 TPA coal based on average GCV of 3400 kcal/kg and PLF of 85%. The company made an FSA with CIL for the Proposed Project. Appropriate arrangements are proposed to be done. The Project will require about 150 cubic meter per hour make-up water during operation. A raw water reservoir of 25200m3 capacity to hold 7 days requirement for plant requirement of water will be constructed at the plant site. Of the total 462 MW of power is proposed to be sold as PPA as per CERC tariff. Balance 198 MW will be sold on Merchant basis at Rs 3.5 per unit with an escalation of 3% p.a. Considering the cost of generation of Rs. 2.475 per unit, company does not envisage any difficulties in selling the power through merchant route. Power Evacuation will be through two double circuit 400 KV transmission lines connecting the Project to the PGCIL substation and State TRANSCO substation. The Electricity Act 2003 and subsequent National Electricity Policy and Tariff Policy have opened up several opportunities for the power sector. The Act allows the IPPs and captive power producers open access to transmission system, thus allowing them to bypass the SEBs and sell power directly to bulk consumers. Slowly open access in distribution system is also being allowed. Assessment of the financial feasibility of the Proposed Project, delivers satisfactory financial parameters as per base financial model. It has also assessed the viability of the Project under the impact of various scenarios, which could be at variance with the base case scenario assumed. Subject to the weaknesses and threats enumerated in the SWOT analysis and the impact of the various scenarios as envisaged under the sensitivity analysis, the Proposed Project is viewed as economically viable. Thus, loan amount should be granted by PFC equal to the request of the borrower. 53 | Page Project Appraisal & Financial Modeling 8.2 RECOMMENDATIONS To minimize the risk, the extent of financing to a single project should be proportionate; it will also affect the exposure limit for borrower or utilities and chance to fund in more projects rather in some. With the deficit of electricity in our country, there is need of many projects and the exposure limit should be increased to effectively assist the new projects. The exposure limit of some utility is going to reached, which
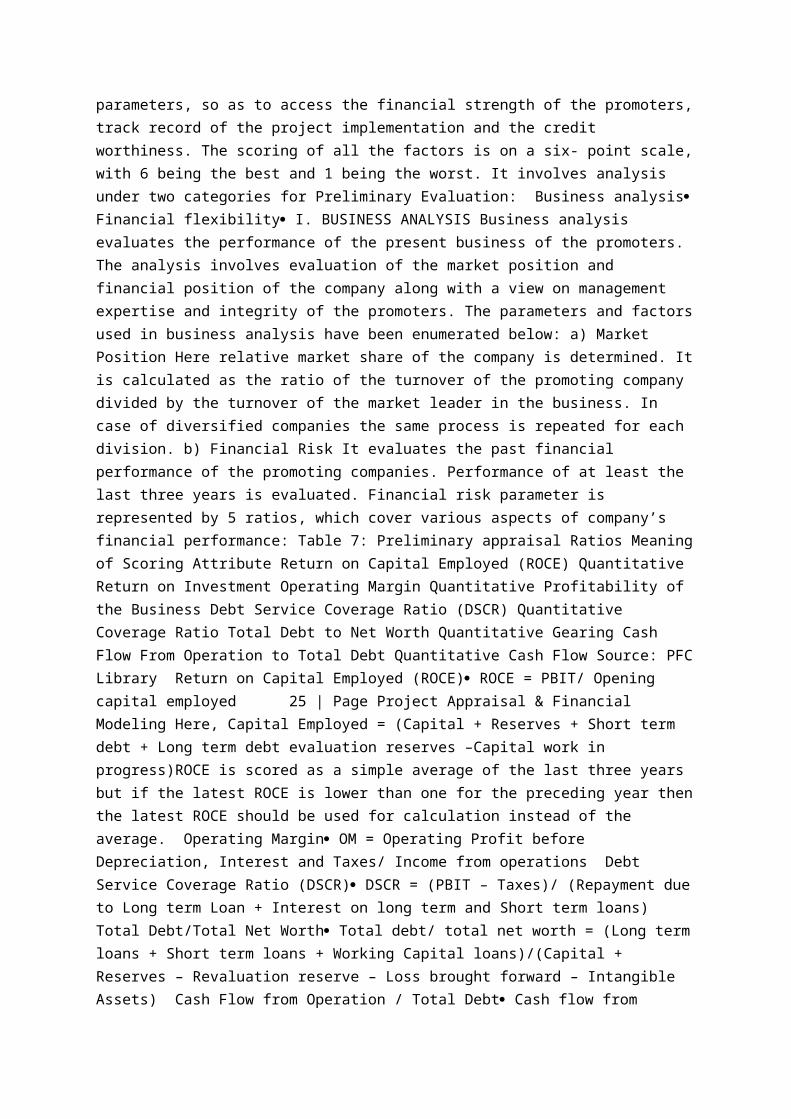
resist PFC to fund. With the increasing IPPs in power generation the exposure to them should be more and the portfolio size for IPPs should be increased. It will increase the revenue because of higher interest rate and some extra charges. Currently PFC has less % funding in renewable energy, PFC should also concentrate to increase its share in renewable energy. With the changes in project parameters, the re-rating of project should be done at an appropriate time and linkages of interest rate, exposure limit and security to the new project rating should be done. There should be more bifurcation in the linkages to integrated project rating. A detailed and comprehensive model study should be made for accordingly. 8.3 LEARNING The experience and know-how gained from this internship, has left me in more compliant form and stature in order to fare better in areas of similar interest. Now I here make it sort with few but most important points what I have learned: A practical exposure of financial world. Learnt about investment scenario in power generation. Know about various complicacies in power generation and their mitigation. Know about project implication and investment. Learnt financing aspect of various investment related parameters. Learnt the formulation and analysis of various financials sheets through model. Learnt corporate culture. 54 | Page Project Appraisal & Financial Modeling BIBILIOGRAPHY 1. Chandra Prasanna, Project Management, 4th Edition, 2005 2. I.M.Pandey, Financial Management, 9th Edition, 2010 3. PFC website: www.pfcindia.com 4. www.cerc.gov.in 5. www.powermin.nic.in 6. Operational policy statement of PFC 7. Project Appraisal Manual 8. Load Generation Balance Report for 2013-14, CEA 9. Integrated Project Rating Model Manual 10. Detailed Project Report of the Company 11. www.powergrid.com 12. Power Finance Corporation, “Project Term Loan and Short Term Loans” 55 | Page Project Appraisal & Financial Modeling ANNEXURE Project Capacity No. of units 1 Capacity per unit 660 MW Total project capacity 660 MW Project Cost Without IDC 3595 Rs Crore IDC 656 Rs Crore With IDC 4251 Rs Crore Financing Plan Equity (25%) 1062.80 Rs Crore Debt (75%) 3188.40 Rs Crore Upfront Equity (51.5%) 547.34 Rs Crore Interest Rate pre COD 13.25% p.a. Interest rate post COD 13.25% p.a. Working Capital 13% p.a. Repayment Details Repayment Period 12 Years Moratorium Period 6 Months Principle Repayment Start Date 01-Jul-14 Date Principle Repayment End Date 01-Jan-26 Date Interest Repayment Start Date 01-Jan-14 Date Interest Repayment End Date 01-Jan-26 Date PPA Details PPA with PTC (including all units) % of total capacity 70% PPA Tariff As per CERC based tariff Rs/unit No. of years 25 years Selling through Merchant Basis (including all units) % of total capacity 30% PPA Tariff 3.5 Rs/unit No. of years 25 years Escalation per year 5% Tax Rates Corporate Tax 33.99% MAT 20.96% Technical Parameters GSHR 2392 kCal/kwh Auxiliary Consumption 7% % Plant Load Factor 85% % O&M Escalation 5.72% % O&M Expense 0.155 crore/MW Fuel : Primary Fuel Fuel Price 900 Rs/tonne Price Escalation 5% p.a. Gross Calorific Value 3400 kCal/kg ANNEXURE I: ASSUMPTION SHEET Secondary Fuel Price 50 Rs/kg Gross Calorific Value 10280 kCal/kg Secondary Fuel Consumption 1 ml/kwh Specific Gravity value of Secondary Fuel 0.95 Price Escalation 4% p.a. Transportation & Handling Charges Escalation Working Capital Limits Coal Stock 2 Months Secondary Fuel 2 Months O&M Expenses 1 Month Maintenance Spares (20% of O&M Expense) 1 Year Receivables from Energy Sales 2 Months Depreciation Rate For Tariff Calculation 5.28% Land 0% Civil Works & Building 3.34% Plant & Machinery 5.28% Max Depreciable Value 90% Depreciation Rate for IT Machinery 15% Building 10% Miscellaneous Discount Rate 13.10% % Return on Equity 15.50% % Return on Equity pre tax (first 12 years) 19.61% % Return on Equity pre tax (last 13 years) 23.48% % Project Life 25 years Total units generated 4914.36 MU Sl No. Particulars Base Amount Escalation Total Cost 1 Land & Site Development 50 0% 50 2 Total Plant & Equipment 2038.48 0% 2038.48 3 Civil Works 545 0% 545 4 Electric Works 135 5 Miscellaneous 146.5 Total Hard Cost 2914.98 6 Overhead & Pre-Op. Expenses 114.59 7 Interest During Construction
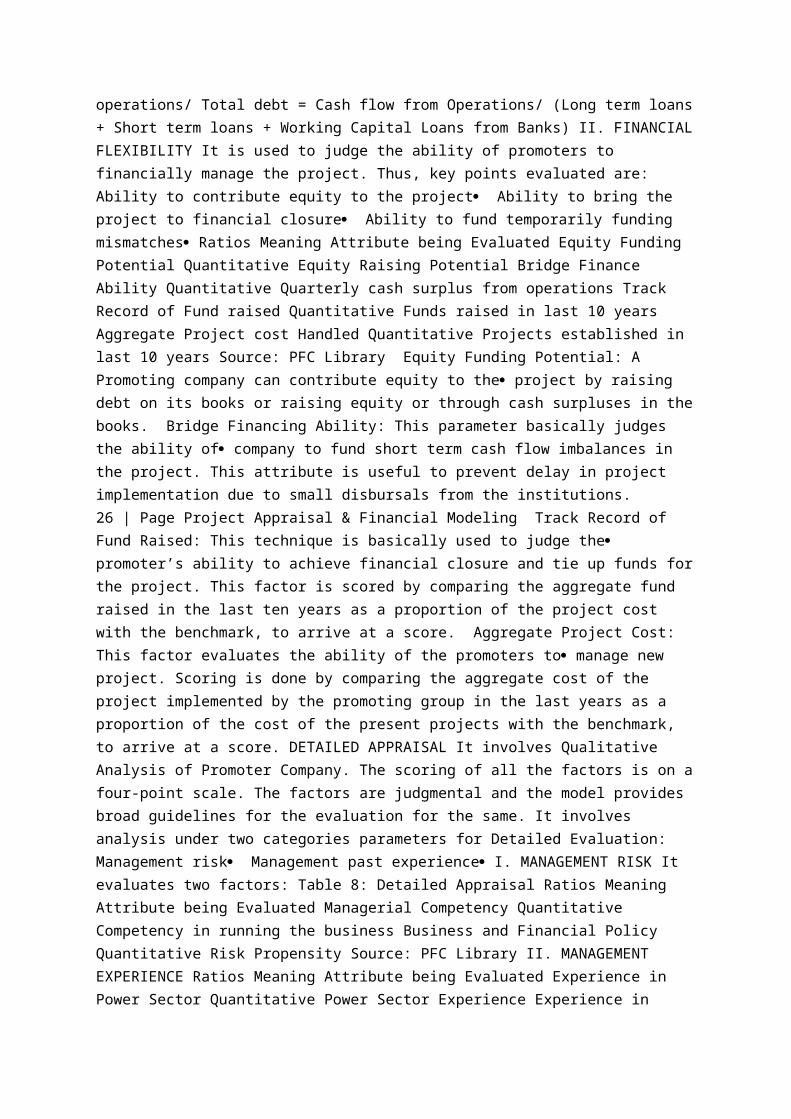
656.20 8 Working Capital Margin 565.43 Total Soft Cost 1336.22 Total Project Cost 4251 Particulars Percentage Cost (Rs Crore) Debt Equirt Ratio 3.00 Equity 25% 1062.80 Debt 75% 3188.40 Upfront Equity 51.5% 547.34 Total 100% 4251 ANNEXURE II: PROJECT COST MEANS OF FINANCE i) Land & Site Development Particulars Amount (In Crore) Land 30 Site Development 20 TOTAL 50 ii) Civil Construction Particulars Amount (In Crore) Civil & Construction Works 545 TOTAL 545 iii) Plant & Equipment Particulars Amount (In Crore) Steam generators (boilers) & Steam turbine generators with all auxiliaries 1431.5 Coal handling system 50 Ash handling plant 50 CW System 10.5 DM plant including all accessories 5.05 Air conditioning plants 2.15 Fire protection system 4.25 Miscellaneous pumps 2.5 CW treatment plant 3.3 IDCT Electro-Mechanical 6 Effluent treatment system 2.38 Chemical laboratory equipment 1.5 Cranes and hoists 2.23 Air compressors and accessories 2.05 Instrumentation and Control system 5 Computers and software 1.05 Emergency D.G. Sets 3.05 Fuel unloading, storage and forwarding system 6.2 Workshop Equipment 2.75 Cost of Mechanical Spares 4 Freight and Insurance 15.95 Excise and Central Sales tax 199.53 Erection testing and commissioning 159.15 Transmission Line 52 Service tax 16.39 TOTAL 2038.48 PROJECT COST BREAKUP iv) Particulars Amount (In Crore) Start-up fuel 14.57 Design, engineering, construction supervision, inspection and expediting and project management 56.3 Pre-operative Expenses 29.15 Insurance during construction 14.57 TOTAL 114.59 v) Electric Works Expenses Particulars Amount (In Crore) Power transformers 21 GCB 8 Other electric equipments 76.98 Cost of Electrical Spares 2.65 Miscellaneous 26.37 TOTAL 135 vi) Miscellaneous Particulars Amount (In Crore) Coal conveyor from Port 12 Railway siding 55 Water intake 29.5 Desalination plant and auxiliaries 50 TOTAL 146.5 Date of Commencement 01-Apr-10 No. of quarters of construction 15 Period of Construction 45 months End of Construction 31-Dec-13 Commercial operation period 01-Jan-14 Overheads & Preoperative Expenses Particulars Amount Total Upfront Balance Project Cost without IDC 3595 Equity 25% 1062.801 547.34 515.46 IDC 656 Debt 75% 3188.402 1642.03 1546.38 Project Cost with IDC 4251 Upfront 51.50% Interest Rate pre COD 13.25% Interest Rate post COD 13.25% Month Apr-10 May-10 Jun-10 Jul-10 Aug-10 Sep-10 Oct-10 Nov-10 Dec-10 Jan-11 Feb-11 Mar-11 Apr-11 May-11 Jun-11 Jul-11 Financial Year 2010 2010 2010 2010 2010 2010 2010 2010 2010 2011 2011 2011 2011 2011 2011 2011 1 2 3 4 5 6 7 8 9 10 11 12 13 14 15 16 Total Percentage 100% 1.50% 1.50% 1.50% 2.00% 2.00% 2.00% 2.00% 2.00% 1.00% 1.00% 2.00% 2.00% 2.00% 2.00% 2.00% 2.00% Amount 4251 63.76804 63.76804 63.76804 85.02406 85.02406 85.02406 85.02406 85.02406 42.51203 42.51203 85.02406 85.02406 85.02406 85.02406 85.02406 85.02406 Upfront Equity 547.34 63.76804 63.76804 63.76804 85.02406 85.02406 85.02406 85.02406 15.94 0.000 0.000 0.000 0.000 0.000 0.000 0.000 0.000 Upfront Debt 1642.03 0.000 0.000 0.000 0.000 0.000 0.000 0.000 69.08205 42.51203 42.51203 85.02406 85.02406 85.02406 85.02406 85.02406 85.02406 Matching Equity 515.46 0.000 0.000 0.000 0.000 0.000 0.000 0.000 0.000 0.000 0.000 0.000 0.000 0.000 0.000 0.000 0.000 Matching Debt 1546.38 0.000 0.000 0.000 0.000 0.000 0.000 0.000 0.000 0.000 0.000 0.000 0.000 0.000 0.000 0.000 0.000 Total Equity 1062.80 63.768 63.768 63.768 85.024 85.024 85.024 85.024 15.942 0.000 0.000 0.000 0.000 0.000 0.000 0.000 0.000 Total Debt 3188.40 0.000 0.000 0.000 0.000 0.000 0.000 0.000 69.08205 42.51203 42.51203 85.02406 85.02406 85.02406 85.02406 85.02406 85.02406 Total Senior Debt 3188.402 0.000 0.000 0.000 0.000 0.000 0.000 0.000 69.082 42.512 42.512 85.024 85.024 85.024 85.024 85.024 85.024 Total Sub Debt 0.000 0.000 0.000 0.000 0.000 0.000 0.000 0.000 0.000 0.000 0.000 0.000 0.000 0.000 0.000 0.000 0.000 Opening Balance 0.000 0.000 0.000 0.000 0.000 0.000 0.000 0.000 69.082 111.594 154.106 239.130 324.154 409.178 494.202 579.226 Monthly Disbursement 0.000 0.000 0.000 0.000 0.000 0.000 0.000 69.082 42.512 42.512 85.024 85.024 85.024 85.024 85.024 85.024 Closing Balance 0.000 0.000 0.000 0.000 0.000

0.000 0.000 69.082 111.594 154.106 239.130 324.154 409.178 494.202 579.226 664.250 Interest During Construction 656.203 0.000 0.000 0.000 0.000 0.000 0.000 0.000 0.381 0.997 1.467 2.171 3.110 4.049 4.987 5.926 6.865 Year Ending on 31 March 2010 2011 2012 2013 Total Expenditure 4251.2 658.9364 977.7766 1254.105 1360.385 IDC 656.203 1.379 76.982 219.945 357.897 Expenditure less IDC 3595.000 657.558 900.794 1034.160 1002.488 Total Equity 1062.801 547.342 0.000 175.362 340.096 Debt 3188.402 111.594 977.777 1078.743 1020.289 PROJECT PHASING YEARLY PHASING ANNEXURE III: INTEREST DURING CONSTRUCTION Aug-11 Sep-11 Oct-11 Nov-11 Dec-11 Jan-12 Feb-12 Mar-12 Apr-12 May-12 Jun-12 Jul-12 Aug-12 Sep-12 Oct-12 Nov-12 Dec-12 Jan-13 Feb-13 Mar-13 2011 2011 2011 2011 2011 2012 2012 2012 2012 2012 2012 2012 2012 2012 2012 2012 2012 2013 2013 2013 17 18 19 20 21 22 23 24 25 26 27 28 29 30 31 32 33 34 35 36 2.00% 2.00% 2.00% 2.00% 2.00% 2.50% 2.00% 2.50% 2.50% 2.50% 2.50% 2.50% 2.50% 2.50% 2.50% 2.50% 2.50% 3.00% 2.50% 2.50% 85.02406 85.02406 85.02406 85.02406 85.02406 106.2801 85.02406 106.2801 106.2801 106.2801 106.2801 106.2801 106.2801 106.2801 106.2801 106.2801 106.2801 127.5361 106.2801 106.2801 0.000 0.000 0.000 0.000 0.000 0.000 0.000 0.000 0.000 0.000 0.000 0.000 0.000 0.000 0.000 0.000 0.000 0.000 0.000 0.000 85.02406 85.02406 85.02406 85.02406 85.02406 106.2801 85.02406 106.2801 106.2801 106.2801 42.5120 0.000 0.000 0.000 0.000 0.000 0.000 0.000 0.000 0.000 0.000 0.000 0.000 0.000 0.000 0.000 0.000 0.000 0.000 0.000 15.942 26.570 26.570 26.570 26.570 26.570 26.570 31.884 26.570 26.570 0.000 0.000 0.000 0.000 0.000 0.000 0.000 0.000 0.000 0.000 47.826 79.710 79.710 79.710 79.710 79.710 79.710 95.652 79.710 79.710 0.000 0.000 0.000 0.000 0.000 0.000 0.000 0.000 0.000 0.000 15.942 26.570 26.570 26.570 26.570 26.570 26.570 31.884 26.570 26.570 85.02406 85.02406 85.02406 85.02406 85.02406 106.2801 85.02406 106.2801 106.2801 106.2801 90.338 79.710 79.710 79.710 79.710 79.710 79.710 95.652 79.710 79.710 85.024 85.024 85.024 85.024 85.024 106.280 85.024 106.280 106.280 106.280 90.338 79.710 79.710 79.710 79.710 79.710 79.710 95.652 79.710 79.710 0.000 0.000 0.000 0.000 0.000 0.000 0.000 0.000 0.000 0.000 0.000 0.000 0.000 0.000 0.000 0.000 0.000 0.000 0.000 0.000 664.250 749.274 834.299 919.323 1004.347 1089.371 1195.651 1280.675 1386.955 1493.235 1599.515 1689.853 1769.563 1849.273 1928.983 2008.693 2088.403 2168.113 2263.766 2343.476 85.024 85.024 85.024 85.024 85.024 106.280 85.024 106.280 106.280 106.280 90.338 79.710 79.710 79.710 79.710 79.710 79.710 95.652 79.710 79.710 749.274 834.299 919.323 1004.347 1089.371 1195.651 1280.675 1386.955 1493.235 1599.515 1689.853 1769.563 1849.273 1928.983 2008.693 2088.403 2168.113 2263.766 2343.476 2423.186 7.804 8.743 9.681 10.620 11.559 12.615 13.671 14.728 15.901 17.075 18.160 19.099 19.979 20.859 21.739 22.619 23.500 24.468 25.436 26.316 Civil Works 0 1 2 3 4 5 6 7 8 9 10 11 Opening Balance 545.00 531.38 478.24 430.41 387.37 348.64 313.77 282.39 254.16 228.74 205.87 185.28 Depreciation 13.625 53.1375 47.82375 43.04138 38.73724 34.86351 31.37716 28.23945 25.4155 22.87395 20.58656 18.5279 Closing Balance 531.38 478.24 430.41 387.37 348.64 313.77 282.39 254.16 228.74 205.87 185.28 166.75 Opening Balance 2038.48 1962.037 1667.731 1417.572 1204.936 1024.196 870.5662 739.9813 628.9841 534.6365 454.441 386.2749 Depreciation 76.443 294.3056 250.1597 212.6358 180.7404 153.6293 130.5849 110.9972 94.34762 80.19547 68.16615 57.94123 Closing Balance 1962.037 1667.731 1417.572 1204.936 1024.196 870.5662 739.9813 628.9841 534.6365 454.441 386.2749 328.3336 Total Dep as per IT 90.068 347.4431 297.9835 255.6771 219.4776 188.4929 161.9621 139.2366 119.7631 103.0694 88.75271 76.46913 Depreciation rate after taking the weighted avg. 0 1 2 3 4 5 6 7 8 9 10 11 Depreciation 31.53483 126.1393 126.1393 126.1393 126.1393 126.1393 126.1393 126.1393 126.1393 126.1393 126.1393 126.1393 Cumulative Depreciation 31.53483 157.6742 283.8135 409.9529 536.0922 662.2315 788.3709 914.5102 1040.65 1166.789 1292.928 1419.068 Plant &

Machinery Depreciation as per IT act ANNEXURE IV: DEPRECIATION 4.89% 12 13 14 15 16 17 18 19 20 21 22 23 24 25 166.75 150.08 135.07 121.56 109.41 98.46 88.62 79.76 71.78 64.60 58.14 52.33 47.10 42.39 16.67511 15.0076 13.50684 12.15616 10.94054 9.846486 8.861837 7.975654 7.178088 6.460279 5.814252 5.232826 4.709544 3.178942 150.08 135.07 121.56 109.41 98.46 88.62 79.76 71.78 64.60 58.14 52.33 47.10 42.39 39.21 328.3336 279.0836 237.2211 201.6379 171.3922 145.6834 123.8309 105.2562 89.4678 76.04763 64.64049 54.94442 46.70275 39.69734 49.25005 41.86254 35.58316 30.24568 25.70883 21.85251 18.57463 15.78844 13.42017 11.40715 9.696073 8.241662 7.005413 4.465951 279.0836 237.2211 201.6379 171.3922 145.6834 123.8309 105.2562 89.4678 76.04763 64.64049 54.94442 46.70275 39.69734 35.23139 65.92516 56.87014 49.09 42.40184 36.64937 31.69899 27.43647 23.76409 20.59826 17.86742 15.51032 13.47449 11.71496 7.644893 12 13 14 15 16 17 18 19 20 21 22 23 24 25 89.18573 89.18573 89.18573 89.18573 89.18573 89.18573 89.18573 89.18573 89.18573 89.18573 89.18573 89.18573 89.18573 66.88929 1508.253 1597.439 1686.625 1775.81 1864.996 1954.182 2043.368 2132.553 2221.739 2310.925 2400.111 2489.296 2578.482 2645.371 Plant & Machinery Depreciation as per IT act 4.89% 2014 0 Jan-Mar Apr-Jun Jul-Sept Oct-Dec Jan-Mar Apr-Jun Jul-Sept Oct-Dec Jan-Mar Apr-Jun Jul-Sept Oct-Dec 3188.40 3188.40 3188.40 3119.09 3049.78 2980.46 2911.15 2841.84 2772.52 2703.21 2633.90 2564.58 105.62 105.62 105.62 103.32 101.02 98.73 96.43 94.14 91.84 89.54 87.25 84.95 0.00 0.00 69.31 69.31 69.31 69.31 69.31 69.31 69.31 69.31 69.31 69.31 105.62 105.62 174.93 172.63 170.34 168.04 165.74 163.45 161.15 158.86 156.56 154.26 3188.40 3188.40 3119.09 3049.78 2980.46 2911.15 2841.84 2772.52 2703.21 2633.90 2564.58 2495.27 2017 3 Jan-Mar Apr-Jun Jul-Sept Oct-Dec Jan-Mar Apr-Jun Jul-Sept Oct-Dec Jan-Mar Apr-Jun Jul-Sept Oct-Dec 2495.27 2425.96 2356.65 2287.33 2218.02 2148.71 2079.39 2010.08 1940.77 1871.45 1802.14 1732.83 82.66 80.36 78.06 75.77 73.47 71.18 68.88 66.58 64.29 61.99 59.70 57.40 69.31 69.31 69.31 69.31 69.31 69.31 69.31 69.31 69.31 69.31 69.31 69.31 151.97 149.67 147.38 145.08 142.78 140.49 138.19 135.90 133.60 131.30 129.01 126.71 2425.96 2356.65 2287.33 2218.02 2148.71 2079.39 2010.08 1940.77 1871.45 1802.14 1732.83 1663.51 2020 6 Jan-Mar Apr-Jun Jul-Sept Oct-Dec Jan-Mar Apr-Jun Jul-Sept Oct-Dec Jan-Mar Apr-Jun Jul-Sept Oct-Dec 1663.51 1594.20 1524.89 1455.57 1386.26 1316.95 1247.64 1178.32 1109.01 1039.70 970.38 901.07 55.10 52.81 50.51 48.22 45.92 43.62 41.33 39.03 36.74 34.44 32.14 29.85 69.31 69.31 69.31 69.31 69.31 69.31 69.31 69.31 69.31 69.31 69.31 69.31 124.42 122.12 119.83 117.53 115.23 112.94 110.64 108.35 106.05 103.75 101.46 99.16 Outstanding Balance 1594.20 1524.89 1455.57 1386.26 1316.95 1247.64 1178.32 1109.01 1039.70 970.38 901.07 831.76 Year Quarters Loan Opening Balance Quarterly Interest Principle Amount Loan Repayments ANNEXURE V: DEBT SERVICING Outstanding Balance Year Quarters Loan Opening Balance Quarterly Interest Principle Amount Loan Repayments Quarterly Interest Principle Amount Loan Repayments Outstanding Balance Year Quarters Loan Opening Balance 4 5 6 7 8 9 2021 2022 2020 2017 1 2 3 2018 2019 2015 2016 2023 2023 9 Jan-Mar Apr-Jun Jul-Sept Oct-Dec Jan-Mar Apr-Jun Jul-Sept Oct-Dec Jan-Mar Apr-Jun Jul-Sept Oct-Dec 831.76 762.44 693.13 623.82 554.50 485.19 415.88 346.57 277.25 207.94 138.63 69.31 27.55 25.26 22.96 20.66 18.37 16.07 13.78 11.48 9.18 6.89 4.59 2.30 69.31 69.31 69.31 69.31 69.31 69.31 69.31 69.31 69.31 69.31 69.31 69.31 96.87 94.57 92.27 89.98 87.68 85.39 83.09 80.79 78.50 76.20 73.91 71.61 Outstanding Balance 762.44 693.13 623.82 554.50 485.19 415.88 346.57 277.25 207.94 138.63 69.31 0.0 Year Quarters Loan Opening Balance Quarterly Interest Principle Amount Loan Repayments 10 11 12 2024 2025 2026 2392 10280 10.28 2381.72 3400 0.7005 0.9 0.63 0.001 0.95 0.00095 50 0.0475 23.34 0.63 7% 0.59 Year 0 1 2 3 4 5 6 7 8 9 10 11 12 Total Coal cost per annum (in crs) 77.457 325.320 341.586 358.665 376.598 395.428 415.200 435.960 457.758 480.646 504.678 529.912 556.407 Total secondary fuel oil cost per annum

(in crs) 5.84 24.277 25.248 26.258 27.308 28.401 29.537 30.718 31.947 33.225 34.554 35.936 37.373 13 14 15 16 17 18 19 20 21 22 23 24 25 584.2277 613.4391 644.111 676.3166 710.1324 745.639054 782.9210065 822.0671 863.1704 906.3289 951.6454 999.2276 786.8918 38.86816 40.42289 42.0398 43.72139 45.47025 47.2890603 49.18062275 51.14785 53.19376 55.32151 57.53437 59.83575 46.67188 Variable charges for single unit (Rs/kwh) Auxiliary Consumption Rate of Energy delivered to Ex Bus Secondary Fuel Oil Consumption (L/kwh) Specific gravity of Secondary Fuel Oil Secondary Fuel Oil Consumption (kg/kwh) Secondary Fuel Oil cost (Rs/kg) Secondary Fuel Oil cost per unit of electricity (Rs/kwh) Total Fuel Oil consumption per annum (Rs Crs) PRIMARY FUEL (COAL) ANNEXURE VI: ENERGY CHARGE Gross Calorific value of Secondary Fuel oil (kCal/L) Gross station heat rate (kCal/kwh) ENERGY CHARGE Coal price to produce 1 unit of electricity (Rs/kwh) SECONDARY FUEL Heat contribution from secondary fuel oil (kCal/kwh) Heat contribution from primary fuel oil (kCal/kwh) Gross calorific value for coal (kCal/kg) Cost of Coal (Rs/kg) Coal required to produce 1 unit of electricity (kg/kwh) 2014 2015 2016 2017 2018 2019 2020 2021 2022 2023 2024 0 1 2 3 4 5 6 7 8 9 10 Primary Fuel 2 Months 12.910 54.220 56.931 59.778 62.766 65.905 69.200 72.660 76.293 80.108 84.113 Secondary Fuel 2 Months 0.973 4.046 4.208 4.376 4.551 4.733 4.923 5.120 5.324 5.537 5.759 O&M Expense 1 Month 8.498 8.984 9.498 10.042 10.616 11.223 11.865 12.544 13.261 14.020 14.822 Maintenance Spares 20% O&M 20.396 21.563 22.796 24.100 25.479 26.936 28.477 30.105 31.828 33.648 35.573 Receivables 2 Months 56.723 231.998 235.202 238.503 242.191 246.287 250.810 255.784 261.229 267.172 273.636 99.500 320.812 328.635 336.798 345.603 355.084 365.275 376.213 387.936 400.485 413.902 99.500 221.312 7.823 8.163 8.805 9.481 10.191 10.938 11.723 12.549 13.418 74.625 240.609 246.476 252.599 259.203 266.313 273.956 282.160 290.952 300.364 310.427 9.701 31.279 32.042 32.838 33.696 34.621 35.614 36.681 37.824 39.047 40.355 91.001 311.827 319.137 326.756 334.987 343.861 353.410 363.669 374.674 386.465 399.080 91.001 220.826 7.309 7.620 8.231 8.873 9.549 10.259 11.006 11.790 12.616 Total Working Capital Increase in Working Capital Total Current Assets Increase in Current Assets Interest on Working Capital Working Capital Debt CURRENT ASSETS ANNEXURE VII: WORKING CAPITAL Year WORKING CAPITAL ITEMS 2025 2026 2027 2028 2029 2030 2031 2032 2033 2034 2035 2036 2037 2038 2039 11 12 13 14 15 16 17 18 19 20 21 22 23 24 25 88.319 92.735 97.371 102.240 107.352 112.719 118.355 124.273 130.487 137.011 143.862 151.055 158.608 166.538 131.149 5.989 6.229 6.478 6.737 7.007 7.287 7.578 7.882 8.197 8.525 8.866 9.220 9.589 9.973 7.779 15.670 16.566 17.514 18.515 19.575 20.694 21.878 23.129 24.452 25.851 27.330 28.893 30.546 32.293 34.140 37.607 39.759 42.033 44.437 46.979 49.666 52.507 55.510 58.686 62.042 65.591 69.343 73.309 77.503 81.936 280.648 288.731 299.635 312.800 326.635 341.172 356.448 372.500 389.368 407.092 425.718 445.291 465.858 487.471 349.734 428.233 444.019 463.030 484.730 507.547 531.539 556.767 583.294 611.189 640.522 671.367 703.802 737.910 773.777 604.737 14.331 15.786 19.011 21.699 22.817 23.992 25.228 26.528 27.895 29.333 30.845 32.435 34.108 35.868 -169.041 321.175 333.014 347.273 363.547 380.660 398.654 417.575 437.471 458.392 480.391 503.525 527.851 553.432 580.333 453.553 41.753 43.292 45.145 47.261 49.486 51.825 54.285 56.871 59.591 62.451 65.458 68.621 71.946 75.443 58.962 412.564 427.453 445.517 466.214 487.972 510.844 534.889 560.165 586.737 614.671 644.037 674.909 707.364 741.485 570.597 13.483 14.889 18.064 20.698 21.758 22.872 24.044 25.276 26.572 27.934 29.366 30.872 32.455 34.120 -170.888 CURRENT ASSETS WORKING CAPITAL ITEMS 2014 2015 2016 2017 2018 2019 2020 2021 2022 2023 2024 2025 2026 2027 2028 2029 2030 2031 2032 2033 2034 2035 2036 2037 2038 2039 0 1 2 3 4 5 6 7 8 9 10 11 12 13 14 15 16 17 18 19 20 21 22 23 24 25 Energy Available for Sale Million Units 1228.59 4914.36 4914.36 4914.36 4914.36 4914.36 4914.36 4914.36 4914.36 4914.36 4914.36 4914.36 4914.36

4914.36 4914.36 4914.36 4914.36 4914.36 4914.36 4914.36 4914.36 4914.36 4914.36 4914.36 4914.36 3685.77 Variable Fuel Cost Rs Crore 77.46 325.32 341.59 358.67 376.60 395.43 415.20 435.96 457.76 480.65 504.68 529.91 556.41 584.23 613.44 644.11 676.32 710.13 745.64 782.92 822.07 863.17 906.33 951.65 999.23 786.89 Variable Fuel Cost per Unit Rs/kwh 0.63 0.66 0.70 0.73 0.77 0.80 0.84 0.89 0.93 0.98 1.03 1.08 1.13 1.19 1.25 1.31 1.38 1.45 1.52 1.59 1.67 1.76 1.84 1.94 2.03 2.13 Interest Rs Crore 105.62 415.58 381.14 344.40 307.66 270.93 234.19 197.46 160.72 123.98 87.25 50.51 13.78 0.00 0.00 0.00 0.00 0.00 0.00 0.00 0.00 0.00 0.00 0.00 0.00 0.00 Return on Equity Rs Crore 52.10 208.42 208.42 208.42 208.42 208.42 208.42 208.42 208.42 208.42 208.42 208.42 249.56 249.56 249.56 249.56 249.56 249.56 249.56 249.56 249.56 249.56 249.56 249.56 249.56 187.17 Depreciation Rs Crore 31.53 126.14 126.14 126.14 126.14 126.14 126.14 126.14 126.14 126.14 126.14 126.14 89.19 89.19 89.19 89.19 89.19 89.19 89.19 89.19 89.19 89.19 89.19 89.19 89.19 66.89 Cumulative Depreciation Rs Crore 31.53 157.67 283.81 409.95 536.09 662.23 788.37 914.51 1040.65 1166.79 1292.93 1419.07 1508.25 1597.44 1686.62 1775.81 1865.00 1954.18 2043.37 2132.55 2221.74 2310.92 2400.11 2489.30 2578.48 2645.37 O&M Expense Rs Crore 25.50 107.81 113.98 120.50 127.39 134.68 142.38 150.53 159.14 168.24 177.86 188.04 198.79 210.16 222.19 234.89 248.33 262.53 277.55 293.43 310.21 327.96 346.72 366.55 387.51 25.60 Interest on Working Capital Rs Crore 9.70 31.28 32.04 32.84 33.70 34.62 35.61 36.68 37.82 39.05 40.36 41.75 43.29 45.15 47.26 49.49 51.83 54.28 56.87 59.59 62.45 65.46 68.62 71.95 75.44 58.96 Fixed Cost Rs Crore 224.45 889.23 861.72 832.30 803.31 774.79 746.75 719.22 692.24 665.83 640.02 614.86 594.61 594.05 608.19 623.13 638.90 655.56 673.17 691.76 711.41 732.16 754.08 777.24 801.70 338.63 Fixed Cost per unit Rs/kwh 1.83 1.81 1.75 1.69 1.63 1.58 1.52 1.46 1.41 1.35 1.30 1.25 1.21 1.21 1.24 1.27 1.30 1.33 1.37 1.41 1.45 1.49 1.53 1.58 1.63 0.92 Total Cost per unit Rs/kwh 2.46 2.47 2.45 2.42 2.40 2.38 2.36 2.35 2.34 2.33 2.33 2.33 2.34 2.40 2.49 2.58 2.68 2.78 2.89 3.00 3.12 3.25 3.38 3.52 3.66 3.05 PV Factor 1.00 0.8842 0.7818 0.69121 0.6112 0.5404 0.4778 0.4224 0.3735 0.3302 0.292 0.2582 0.2283 0.2018 0.1785 0.1578 0.1395 0.1233 0.1091 0.0964 0.0853 0.0754 0.0667 0.0589 0.0521 0.046072 Variable Tariff Rs/kwh 0.6305 0.5853 0.5434 0.50447 0.4683 0.4348 0.4037 0.3747 0.3479 0.323 0.2999 0.2784 0.2584 0.2399 0.2228 0.2068 0.192 0.1782 0.1655 0.1536 0.1426 0.1324 0.1229 0.1141 0.1059 0.098361 Fixed Tariff Rs/kwh 1.8269 1.5999 1.3708 1.17064 0.999 0.8519 0.726 0.6182 0.5261 0.4474 0.3803 0.323 0.2762 0.244 0.2208 0.2001 0.1814 0.1645 0.1494 0.1357 0.1234 0.1123 0.1023 0.0932 0.085 0.042328 Total tariff Rs/kwh 2.4574 2.1852 1.914 1.67511 1.4673 1.2867 1.1296 0.993 0.874 0.7704 0.6801 0.6014 0.5346 0.4839 0.4436 0.4069 0.3734 0.3428 0.3149 0.2894 0.266 0.2447 0.2252 0.2073 0.191 0.140689 Levelised Tariff Rs/kwh ANNEXURE VIII: TARIFF PV Calculation Discounted Tariff 2.475 Year Fixed Tariff Variable Tariff 0 1 2 3 4 5 6 7 8 9 10 Year 2014 2015 2016 2017 2018 2019 2020 2021 2022 2023 2024 Revenue from Energy Sale to PTC 211.336 850.182 842.311 833.672 825.936 819.150 813.363 808.627 804.998 802.532 801.292 Revenue from energy sale on Merchant basis 129.002 541.8082 568.8986 597.3435 627.2107 658.5712 691.4998 726.0748 762.3785 800.4975 840.5223 Total Revenue 340.338 1391.990 1411.210 1431.016 1453.147 1477.721 1504.863 1534.702 1567.376 1603.030 1641.814 Expenses Fuel 77.457 325.320 341.586 358.665 376.598 395.428 415.200 435.960 457.758 480.646 504.678 O&M Expenses 25.495 107.813 113.980 120.500 127.393 134.679 142.383 150.527 159.138 168.240 177.864 Depreciation 31.53483 126.1393 126.1393 126.1393 126.1393 126.1393 126.1393 126.1393 126.1393 126.1393 126.1393 Interest payments 115.32 446.85 413.18 377.24 341.36 305.55 269.81 234.14 198.54 163.03 127.60 Total Expenditure 249.804 1006.127 994.883 982.542 971.490 961.795 953.528 946.763 941.578 938.056 936.284 Profit before tax, PBT 90.534 385.863 416.327 448.474 481.657 515.926 551.334 587.939 625.798 664.974 705.530 PBT+Dep on books

122.069 512.002 542.466 574.613 607.796 642.065 677.474 714.078 751.938 791.113 831.669 PBT for IT purposes 32.001 164.559 244.483 318.936 388.318 453.572 515.512 574.842 632.174 688.044 742.917 MAT 18.97593 80.87692 87.2621 94.00017 100.9552 108.138 115.5597 123.232 131.1673 139.3785 147.8791 Corporate Tax 10.87709 55.93375 83.09967 108.4064 131.9894 154.1692 175.2224 195.3887 214.8761 233.866 252.5174 Payable Tax 18.97593 80.87692 87.2621 108.4064 131.9894 154.1692 175.2224 195.3887 214.8761 233.866 252.5174 Profit after tax, PAT 71.558 304.986 329.065 340.068 349.667 361.757 376.112 392.550 410.922 431.108 453.013 ANNEXURE IX: PROFIT & LOSS 11 12 13 14 15 16 17 18 19 20 21 22 23 24 25 2025 2026 2027 2028 2029 2030 2031 2032 2033 2034 2035 2036 2037 2038 2039 801.340 805.709 824.798 855.142 887.065 920.652 955.988 993.165 1032.279 1073.433 1116.731 1162.287 1210.219 1260.651 787.862 882.5484 926.6759 973.0097 1021.66 1072.743 1126.38 1182.699 1241.834 1303.926 1369.122 1437.578 1509.457 1584.93 1664.177 1310.539 1683.889 1732.385 1797.807 1876.802 1959.809 2047.032 2138.687 2234.999 2336.205 2442.555 2554.309 2671.744 2795.149 2924.828 2098.401 529.912 556.407 584.228 613.439 644.111 676.317 710.132 745.639 782.921 822.067 863.170 906.329 951.645 999.228 786.892 188.037 198.793 210.164 222.186 234.895 248.330 262.535 277.552 293.428 310.212 327.956 346.715 366.547 387.514 25.605 126.1393 89.18573 89.18573 89.18573 89.18573 89.18573 89.18573 89.18573 89.18573 89.18573 89.18573 89.18573 89.18573 89.18573 66.88929 92.26 57.07 45.15 47.26 49.49 51.83 54.28 56.87 59.59 62.45 65.46 68.62 71.95 75.44 58.96 936.353 901.454 928.723 972.071 1017.677 1065.658 1116.138 1169.248 1225.126 1283.916 1345.771 1410.851 1479.325 1551.371 938.348 747.536 830.931 869.084 904.730 942.132 981.374 1022.549 1065.751 1111.080 1158.639 1208.539 1260.894 1315.824 1373.457 1160.053 873.675 920.117 958.270 993.916 1031.317 1070.560 1111.735 1154.937 1200.266 1247.825 1297.725 1350.079 1405.010 1462.643 1226.943 797.206 854.192 901.400 944.826 988.915 1033.911 1080.036 1127.501 1176.501 1227.227 1279.857 1334.569 1391.536 1450.928 1219.298 156.6835 174.1632 182.1601 189.6315 197.4708 205.6961 214.3264 223.3815 232.8823 242.8508 253.3097 264.2833 275.7968 287.8766 243.1472 270.9702 290.3398 306.3858 321.1463 336.1324 351.4263 367.1043 383.2375 399.8929 417.1343 435.0234 453.62 472.9829 493.1704 414.4393 270.9702 290.3398 306.3858 321.1463 336.1324 351.4263 367.1043 383.2375 399.8929 417.1343 435.0234 453.62 472.9829 493.1704 414.4393 476.565 540.591 562.698 583.584 605.999 629.948 655.445 682.514 711.187 741.505 773.515 807.274 842.841 880.287 745.614 0 1 2 3 4 5 6 7 8 9 10 11 12 Year 2014 2015 2016 2017 2018 2019 2020 2021 2022 2023 2024 2025 2026 Inflow Equity 1062.80 0 0 0 0 0 0 0 0 0 0 0 0 Debt 3271.53 166.46 6.39 6.66 7.18 7.71 8.29 8.87 9.51 10.17 10.86 11.60 12.74 Term Loan 3188.40 0 0 0 0 0 0 0 0 0 0 0 0 WC Debt 83.12 166.46 6.39 6.66 7.18 7.71 8.29 8.87 9.51 10.17 10.86 11.60 12.74 PBT 90.534 385.863 416.327 448.474 481.657 515.926 551.334 587.939 625.798 664.974 705.530 747.536 830.931 Depreciation 31.535 126.139 126.139 126.139 126.139 126.139 126.139 126.139 126.139 126.139 126.139 126.139 89.186 Total cash inflow 4456.40 678.47 548.85 581.28 614.98 649.78 685.77 722.95 761.45 801.28 842.53 885.27 932.86 Outflow Project expenditure 4251.20 0 0 0 0 0 0 0 0 0 0 0 0 Increase in WC 99.500 221.312 7.823 8.163 8.805 9.481 10.191 10.938 11.723 12.549 13.418 14.331 15.786 Tax 18.976 80.877 87.262 108.406 131.989 154.169 175.222 195.389 214.876 233.866 252.517 270.970 290.340 Loan repayments 0.000 207.939 277.252 277.252 277.252 277.252 277.252 277.252 277.252 277.252 277.252 277.252 207.939 Total cash outflow 4369.68 510.13 372.34 393.82 418.05 440.90 462.67 483.58 503.85 523.67 543.19 562.55 514.06 Excess/Shortfall 86.718 168.338 176.516 187.454 196.933 208.873 223.101 239.373 257.598 277.617 299.345 322.720 418.791 Opening Balance 0.000 86.718 255.056 431.572 619.026 815.959 1024.832 1247.934 1487.306 1744.905 2022.522 2321.867 2644.587

Closing Balance 86.718 255.056 431.572 619.026 815.959 1024.832 1247.934 1487.306 1744.905 2022.522 2321.867 2644.587 3063.378 ANNEXURE X: CASH FLOW 13 14 15 16 17 18 19 20 21 22 23 24 25 2027 2028 2029 2030 2031 2032 2033 2034 2035 2036 2037 2038 2039 0 0 0 0 0 0 0 0 0 0 0 0 0 15.20 17.28 18.16 19.11 20.11 21.15 22.24 23.40 24.61 25.89 27.24 28.64 -124.93 0 0 0 0 0 0 0 0 0 0 0 0 0 15.20 17.28 18.16 19.11 20.11 21.15 22.24 23.40 24.61 25.89 27.24 28.64 -124.93 869.084 904.730 942.132 981.374 1022.549 1065.751 1111.080 1158.639 1208.539 1260.894 1315.824 1373.457 1160.053 89.186 89.186 89.186 89.186 89.186 89.186 89.186 89.186 89.186 89.186 89.186 89.186 66.889 973.47 1011.20 1049.48 1089.67 1131.85 1176.08 1222.51 1271.22 1322.34 1375.97 1432.25 1491.28 1102.01 0 0 0 0 0 0 0 0 0 0 0 0 1 19.011 21.699 22.817 23.992 25.228 26.528 27.895 29.333 30.845 32.435 34.108 35.868 -169.041 306.386 321.146 336.132 351.426 367.104 383.237 399.893 417.134 435.023 453.620 472.983 493.170 414.439 0.000 0.000 0.000 0.000 0.000 0.000 0.000 0.000 0.000 0.000 0.000 0.000 0.000 325.40 342.85 358.95 375.42 392.33 409.77 427.79 446.47 465.87 486.06 507.09 529.04 246.40 648.071 668.355 690.531 714.256 739.514 766.318 794.719 824.757 856.470 889.911 925.160 962.246 855.614 3063.378 3711.450 4379.805 5070.335 5784.591 6524.105 7290.423 8085.142 8909.899 9766.37 10656.28 11581.44 12543.69 3711.450 4379.805 5070.335 5784.591 6524.105 7290.423 8085.142 8909.899 9766.37 10656.28 11581.44 12543.69 13399.30 0 1 2 3 4 5 6 7 8 9 10 11 Year 2014 2015 2016 2017 2018 2019 2020 2021 2022 2023 2024 2025 Liabilities Equity Capital 1062.801 1062.801 1062.801 1062.801 1062.801 1062.801 1062.801 1062.801 1062.801 1062.801 1062.801 1062.801 Reserve and Surplus 71.558 376.544 705.609 1045.677 1395.344 1757.100 2133.213 2525.763 2936.685 3367.793 3820.805 4297.371 Loan Funds 3263.027 3221.072 2949.687 2678.557 2407.908 2137.767 1868.157 1599.108 1330.648 1062.808 795.618 529.114 Term Loan 3188.402 2980.463 2703.210 2425.958 2148.706 1871.453 1594.201 1316.949 1039.696 762.444 485.192 207.939 Working Capital loan 74.625 240.609 246.476 252.599 259.203 266.313 273.956 282.160 290.952 300.364 310.427 321.175 Total Liabilities 4397.39 4660.42 4718.10 4787.03 4866.05 4957.67 5064.17 5187.67 5330.13 5493.40 5679.22 5889.29 Assets Project Asset 4219.67 4093.53 3967.39 3841.25 3715.11 3588.97 3462.83 3336.69 3210.55 3084.41 2958.27 2832.14 Depreciation 31.535 126.139 126.139 126.139 126.139 126.139 126.139 126.139 126.139 126.139 126.139 126.139 Current Asset 91.001 311.827 319.137 326.756 334.987 343.861 353.410 363.669 374.674 386.465 399.080 412.564 Coal Stock 12.910 54.220 56.931 59.778 62.766 65.905 69.200 72.660 76.293 80.108 84.113 88.319 Secondary Fuel 0.973 4.046 4.208 4.376 4.551 4.733 4.923 5.120 5.324 5.537 5.759 5.989 Maintenance Spares 20.396 21.563 22.796 24.100 25.479 26.936 28.477 30.105 31.828 33.648 35.573 37.607 Receivables 56.723 231.998 235.202 238.503 242.191 246.287 250.810 255.784 261.229 267.172 273.636 280.648 Cash 86.718 255.056 431.572 619.026 815.959 1024.832 1247.934 1487.306 1744.905 2022.522 2321.867 2644.587 Total Assets 4397.39 4660.41 4718.10 4787.03 4866.06 4957.66 5064.18 5187.67 5330.13 5493.40 5679.22 5889.29 Difference 0.00 0.00 0.00 0.00 0.00 0.00 0.00 0.00 0.00 0.00 0.00 0.00 ANNEXURE XI: BALANCE SHEET 12 13 14 15 16 17 18 19 20 21 22 23 24 25 2026 2027 2028 2029 2030 2031 2032 2033 2034 2035 2036 2037 2038 2039 1062.801 1062.801 1062.801 1062.801 1062.801 1062.801 1062.801 1062.801 1062.801 1062.801 1062.801 1062.801 1062.801 1062.801 4837.962 5400.660 5984.244 6590.244 7220.192 7875.637 8558.151 9269.338 10010.843 10784.358 11591.632 12434.473 13314.760 14060.37 333.014 347.273 363.547 380.660 398.654 417.575 437.471 458.392 480.391 503.525 527.851 553.432 580.333 453.553 0.000 0.000 0.000 0.000 0.000 0.000 0.000 0.000 0.000 0.000 0.000 0.000 0.000 0.000 333.014 347.273 363.547 380.660 398.654 417.575 437.471 458.392 480.391 503.525 527.851 553.432 580.333 453.553 6233.78 6810.73 7410.59 8033.70 8681.65 9356.01 10058.42 10790.53 11554.03 12350.68 13182.28

14050.71 14957.89 15576.73 2742.95 2653.76 2564.58 2475.39 2386.21 2297.02 2207.84 2118.65 2029.46 1940.28 1851.09 1761.91 1672.72 1606.83 89.186 89.186 89.186 89.186 89.186 89.186 89.186 89.186 89.186 89.186 89.186 89.186 89.186 66.889 427.453 445.517 466.214 487.972 510.844 534.889 560.165 586.737 614.671 644.037 674.909 707.364 741.485 570.597 92.735 97.371 102.240 107.352 112.719 118.355 124.273 130.487 137.011 143.862 151.055 158.608 166.538 131.149 6.229 6.478 6.737 7.007 7.287 7.578 7.882 8.197 8.525 8.866 9.220 9.589 9.973 7.779 39.759 42.033 44.437 46.979 49.666 52.507 55.510 58.686 62.042 65.591 69.343 73.309 77.503 81.936 288.731 299.635 312.800 326.635 341.172 356.448 372.500 389.368 407.092 425.718 445.291 465.858 487.471 349.734 3063.378 3711.450 4379.805 5070.335 5784.591 6524.105 7290.423 8085.142 8909.899 9766.369 10656.280 11581.440 12543.685 13399.30 6233.78 6810.73 7410.60 8033.70 8681.64 9356.01 10058.42 10790.53 11554.03 12350.68 13182.28 14050.71 14957.89 15576.73 0.00 0.00 0.00 0.00 0.00 0.00 0.00 0.00 0.00 0.00 0.00 0.00 0.00 0.00 2010 2011 2012 2013 2014 2015 2016 2017 2018 2019 2020 2021 2022 2023 -657.558 -900.794 -1034.16 -1002.49 0 0 0 0 71.558 304.986 329.065 340.068 349.667 361.757 376.112 392.550 410.922 431.108 0 0 0 0 31.535 126.139 126.139 126.139 126.139 126.139 126.139 126.139 126.139 126.139 0 0 0 0 105.616 415.575 381.135 344.399 307.663 270.928 234.192 197.456 160.720 123.984 0 0 0 0 9.701 31.279 32.042 32.838 33.696 34.621 35.614 36.681 37.824 39.047 0 0 0 0 18.976 80.877 87.262 108.406 131.989 154.169 175.222 195.389 214.876 233.866 0 0 0 0 237.386 958.857 955.643 951.851 949.156 947.613 947.280 948.215 950.481 954.144 -657.558 -900.794 -1034.16 -1002.49 237.386 958.857 955.643 951.851 949.156 947.613 947.280 948.215 950.481 954.144 18.49% -547.342 0 -175.362 -340.10 0 0 0 0 71.558 304.986 329.065 340.068 349.667 361.757 376.112 392.550 410.922 431.108 -547.342 0 -175.362 -340.10 71.558086 304.98623 329.06473 340.06764 349.66729 361.75651 376.11202 392.5503 410.92209 431.10764 21.37% ANNEXURE XII: RATIOS Cash Outflow Cash Inflow Cash to the project PAT Add: Depreciation Add: Interest on loan Add: Interest on WC Add: Tax Total cash inflow Project IRR Cash Inflow Cash to equity holder Equity IRR Cash Outflow 2024 2025 2026 2027 2028 2029 2030 2031 2032 2033 2034 2035 2036 2037 2038 453.013 476.565 540.591 562.698 583.584 605.999 629.948 655.445 682.514 711.187 741.505 773.515 807.274 842.841 880.287 126.139 126.139 89.186 89.186 89.186 89.186 89.186 89.186 89.186 89.186 89.186 89.186 89.186 89.186 89.186 87.248 50.512 13.776 0.000 0.000 0.000 0.000 0.000 0.000 0.000 0.000 0.000 0.000 0.000 0.000 40.355 41.753 43.292 45.145 47.261 49.486 51.825 54.285 56.871 59.591 62.451 65.458 68.621 71.946 75.443 252.517 270.970 290.340 306.386 321.146 336.132 351.426 367.104 383.237 399.893 417.134 435.023 453.620 472.983 493.170 959.273 965.940 977.185 1003.415 1041.177 1080.803 1122.385 1166.020 1211.808 1259.857 1310.276 1363.183 1418.700 1476.956 1538.086 959.273 965.940 977.185 1003.415 1041.177 1080.803 1122.385 1166.020 1211.808 1259.857 1310.276 1363.183 1418.700 1476.956 1538.086 453.013 476.565 540.591 562.698 583.584 605.999 629.948 655.445 682.514 711.187 741.505 773.515 807.274 842.841 880.287 453.01274 476.56532 540.59141 562.69847 583.58389 605.9992 629.94819 655.44518 682.51395 711.18699 741.50481 773.51537 807.27366 842.841393 880.286707 0 1 2 3 4 5 6 7 8 9 10 11 12 Year 2014 2015 2016 2017 2018 2019 2020 2021 2022 2023 2024 2025 2026 PAT 71.558 304.986 329.065 340.068 349.667 361.757 376.112 392.550 410.922 431.108 453.013 476.565 540.591 Add: Depreciation 31.535 126.139 126.139 126.139 126.139 126.139 126.139 126.139 126.139 126.139 126.139 126.139 89.186 Add: Interest on Term Loan 105.616 415.575 381.135 344.399 307.663 270.928 234.192 197.456 160.720 123.984 87.248 50.512 13.776 Add: Tax 18.976 80.877 87.262 108.406 131.989 154.169 175.222 195.389 214.876 233.866 252.517 270.970 290.340 Total 227.685 927.578 923.602 919.013 915.460 912.993 911.665 911.534

912.657 915.097 918.917 924.187 933.893 Principal Repayment 0.000 207.939 277.252 277.252 277.252 277.252 277.252 277.252 277.252 277.252 277.252 277.252 207.939 Interest Payment 105.616 415.575 381.135 344.399 307.663 270.928 234.192 197.456 160.720 123.984 87.248 50.512 13.776 Total Debt Services 105.616 623.515 658.388 621.652 584.916 548.180 511.444 474.708 437.972 401.236 364.500 327.764 221.715 DSCR 2.156 1.488 1.403 1.478 1.565 1.665 1.783 1.920 2.084 2.281 2.521 2.820 4.212 Minimum DSCR 1.403 Average DSCR 2.106 Maximum DSCR 4.212 ANNEXURE XIII: DSCR