manual for mangrove monitoring · manual for mangrove monitoring in the pacific islands region /...
TRANSCRIPT

Manual for Mangrove Monitoring in the Pacific Islands Region

Manual for Mangrove Monitoring in the Pacific Islands Region
Joanna Ellison, Vainuupo Jungblut, Paul Anderson, Christian Slaven

SPREP Library/IRC Cataloguing-in-Publication Data
Secretariat of the Pacific Regional Environment Programme (SPREP)
Ellison, Joanna C…[et al.]
Manual for mangrove monitoring in the Pacific Islands region /
Joanna C. Ellison … [et al.] – Apia, Samoa : SPREP, 2012.
52 p. : col. ill. ; 29 cm.
ISBN: 978-982-04-0433-5 (print)
978-982-04-0434-2 (online)
1. Mangrove monitoring – Oceania – Handbooks, manuals, etc.
2. Wetlands conservation – Oceania – Handbooks, manuals, etc.
3. Mangrove forest – Protection - Oceania. 4. Mangrove ecology – Oceania. I. Ellison, Joanna C. II. Jungblut, Vainuupo. III. Anderson, Paul. IV. Slaven, Christian. V. Pacific Regional Environment Programme (SPREP) II. Title.
583.42099
Authors:
Joanna C. Ellison, School of Geography and Environmental Studies, University of Tasmania, Locked Bag 1376, Launceston, Tasmania 7250, Australia. Email: [email protected]
Vainuupo Jungblut, Ramsar Officer Oceania Secretariat of the Pacific Regional Environment Programme (SPREP), Programme regional oceanien de l’environnement, PO Box 240 Apia, Samoa. Email: [email protected]
Paul Anderson, Marine Conservation Analyst Secretariat Pacific Regional Environment Programme (SPREP), Programme regional oceanien de l’environnement, PO Box 240 Apia, Samoa. Email: [email protected]
Christian Slaven, Database & Systems Administrator Secretariat of the Pacific Regional Environment Programme (SPREP), Programme regional oceanien de l’environnement, PO Box 240 Apia, Samoa. Email: [email protected]
Cover photos: Vainuupo Jungblut.
Mangroves, Vanua Levu, Fiji © Stuart Chape

3Manual for Mangrove Monitoring in the Pacific islands region
Contents
1.0 IntroductIon 5
1.1 Mangrove monitoring – identification and need 5
1.2 Mangrove functions and values 7
1.3 Global and regional context 8
2.0 MonItorIng technIques 10
2.1 Level 1 Monitoring: Transect based survey 10
2.2 Level 2 Monitoring: Permanent plots 17
2.3 Level 3 Monitoring: Litter productivity and sedimentation monitoring 21
3.0 data recordIng 25
3.1 Making a Map of your Mangrove(s) 25
3.2 Database Entry 25
4.0 exaMples of fIeld MonItorIng data 26
4.1 Example 1: Suva, Fiji 26
4.2 Example 2: Tongatapu, Tonga 28
4.3 Example 3: Ailuk Atoll, Marshall Islands 33
references 35
appendIces:
Appendix A: Using Google Earth to view Mangroves 37
Appendix B: Regional Mangrove Research and Monitoring Database System 41
acronYMs 52
lIst of tables:
Table 1: Mangrove areas and species diversity in the Pacific Islands 8
Table 2: Distribution of mangrove species in the Pacific Islands 9
Table 3: Codes used to record the impact of pressure on mangrove ecosystems 13
Table 4: Codes used to describe the type of impact at a site 13
Table 5: Summary of Mangrove Level 1 Survey Data, Tongatapu 29
Table 6: Mangrove tree dimensions at Bigen Mangrove Pond 33
Table 7: Mangrove sapling dimensions at Bigen Mangrove Pond 34

4 Manual for Mangrove Monitoring in the Pacific islands region
lIst of fIgures:
Figure 1: Mangrove species zones from mean tide to high tide 5
Figure 2: Mangrove conversion to development, Viti Levu, Fiji 5
Figure 3: Mangrove dieback with rising sea-level, Bermuda 6
Figure 4: Fish-trap in the mangrove fringed Fanga ‘Uta Lagoon, Tongatapu, Tonga 7
Figure 5: Canoe tour through Enipein mangrove swamp, Pohnpei, Federated States of Micronesia 7
Figure 6: Mangrove margin at Ha’ateiho, Tongatapu 11
Figure 7: Google Earth image, Tikina I Wai Mangroves, Fiji 11
Figure 8: Vaiusu Bay mangroves near Apia, Samoa 11
Figure 9: Transecct through mangrove swamp with thrre zones 12
Figure 10: Storm damage to Rhizophora at Masefau, American Samoa 14
Figure 11: Bark stripped from Bruguiera for tanin use, Viti Levu, Fiji 14
Figure 12: Open mangrove margin with no recruitment, Pala lagoon, American Samoa 15
Figure 13: Erosion of sediment at an Avicennia seaward margin, southern New Guinea 15
Figure 14: High tide mark showing on tree trunks, Kubulau, Vanua Levu, Fiji 15
Figure 15: Measuring high tide mark above the average mud level 15
Figure 16: Measuring tree height in the mangroves of Ailuk atoll, Marshall Islands 18
Figure 17: Rhizophora/ Bruguiera permanent plot, southern New Guinea 18
Figure 18: Litter catcher hung in Rhizophora forest 21
Figure 19: Sedimentation stake measurement at Tikina I Wai, Fiji 23
Figure 20: Highly impacted zone 2 at Kamarusi Park, Suva, Fiji 28
Figure 21: Moderately impacted zone 3 at Kamarusi Park, Suva, Fiji 28
Figure 22: Aerial view of Halaleva mangrove margin, Tongatapu 28
Figure 23: Aerial view of Nukuhetulu mangrove forest, Tongatapu 28
Figure 24: Fanga ‘Uta lagoon mangrove zoning map (from Prescott et al., 1993) 32
Figure 25: Mangrove pond on Bigen Islet, Ailuk atoll, Marshall Islands 33
lIst of datasheets:
Level 1 Mangrove monitoring datasheet 16
Level 2 Mangrove permanent plot datasheet 19
Level 2 mangrove permanent plot sketchmap 20
Mangrove litter datasheet 22
Sedimentation stake datasheet 24

5Manual for Mangrove Monitoring in the Pacific islands region
High tide level
Mean sea level
Low tide levelAvicennia Rhizophora Bruguiera Nypa Rainforest Inland
1.0 Introduction
1.1 Mangrove Monitoring – Identification of need Mangrove forests occur on low energy, sedimentary shorelines of the tropics, between mean tide and high tide elevations. Mangrove trees have physiological and morphological adaptations to the environmental stresses of their intertidal habitat, of high salinity, low oxygen, poor nutrient availability and substrate mobility. These cause the different mangrove species to prefer a particular elevation between mean tide and high tide (Figure 1). True mangrove species occur exclusively in this saline wetland environment, with adaptations such as aerial roots, halophytic strategies.
Figure 1. Mangrove species zones from mean tide to high tide, typical of PNG and the Solomon Islands
In the last few decades, large areas of mangrove forests have been destroyed by overexploitation and conversion to other uses (Figure 2).
Figure 2. Mangrove conversion to development, Viti Levu, Fiji

6 Manual for Mangrove Monitoring in the Pacific islands region
Mangrove wetlands are one of the most threatened natural communities worldwide, with about 50% of the global area lost since 1900, and 35% of the global area lost in the past two decades (FAO, 2003; Spalding et al., 2010). Human activities remain a major cause of degradation and loss of mangrove ecosystems in all parts of the world, including the Pacific Islands region (Polidero et al., 2010). Monitoring will measure mangrove extent and condition, and allow mangrove ecosystems to be conserved and managed sustainably to maintain their environmental, ecological, and socioeconomic benefits.
Mangrove ecosystems are also sensitive to climate change impacts, particularly to associated relative sea-level rise. Inter-tidal mangroves are most extensively developed on sedimentary shorelines, where mud accretion determines their ability to keep up with sea-level rise. The IPCC 4th Assessment projected a global sea level rise of 0.18-0.59 m by 2099 (1.5-9.7 mm per year), and mangrove accretion rates are usually less than this, resulting in dieback at the seaward edge (Figure 3), and inland recruitment. Rise in temperature and the effects of increased CO2 levels should increase mangrove productivity, change phenological patterns, and continue expansion of mangrove species ranges into higher latitudes. Several expert groups have identified the need for a monitoring system of mangrove response to climate change (IOC, 1990; IOC, 1991; UNEP/ UNESCO, 1993; UNEP, 1994). A monitoring program would help identify how the Pacific region mangroves respond to climate change impacts.
Figure 3. Mangrove dieback with rising sea-level, Bermuda
In the Pacific Regional Wetlands Action Plan for the Pacific Islands (SPREP, 2011) endorsed by the 26 member countries, three actions identify the need for scientific monitoring of mangroves in the region. This would assess mangrove extent, community structure, status and health. In recent years, mangroves of the region have come under increasing pressure from coastal development, and increased threats from sea-level rise projections (IPCC, 2007). This monitoring protocol adapts internationally accepted mangrove monitoring methods (English et al., 1997) to Pacific Island settings, with three levels of intensity of monitoring. The methods will generate baseline survey data that can be used to monitor changes and make comparisons across mangrove areas in the wider Pacific. The objectives of this monitoring program are: ■ To detect and quantify major changes through time in the community structure and health of
mangroves in the Pacific Island Region using biological and physical parameters. ■ To develop a centralised database system for mangrove monitoring for use by all.
This will be a tool in improving mangrove management, augmenting or restoring a mangrove conservation ethic, and reversal of trends in human-caused degradation of mangroves.
7Manual for Mangrove Monitoring in the Pacific islands region
1.2. Mangrove functions and values Mangrove ecosystems provide a useful buffer between the land and the sea. Mangrove forests are a sink for sediment and nutrient-rich runoff, protecting nearshore waters from eutrophication and turbidity to benefit seagrass and coral reef health. They also provide protection of the land from marine inundation during storms.
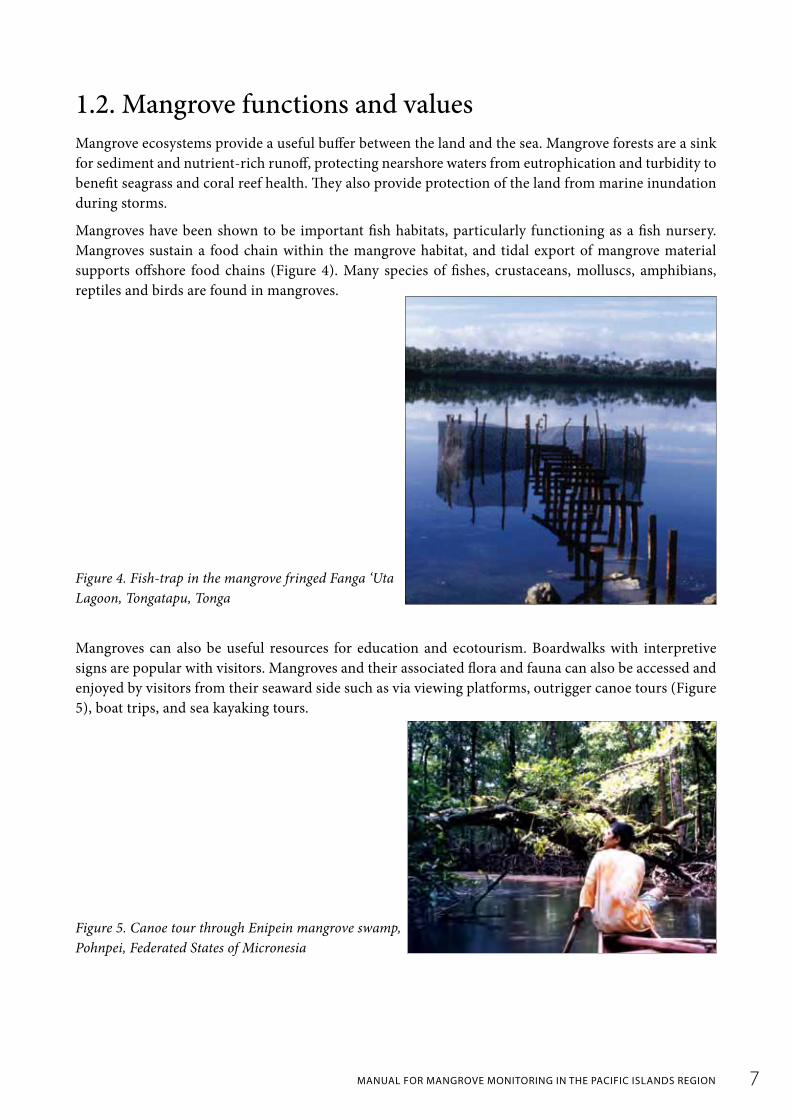
Mangroves have been shown to be important fish habitats, particularly functioning as a fish nursery. Mangroves sustain a food chain within the mangrove habitat, and tidal export of mangrove material supports offshore food chains (Figure 4). Many species of fishes, crustaceans, molluscs, amphibians, reptiles and birds are found in mangroves.
Figure 4. Fish-trap in the mangrove fringed Fanga ‘Uta Lagoon, Tongatapu, Tonga
Mangroves can also be useful resources for education and ecotourism. Boardwalks with interpretive signs are popular with visitors. Mangroves and their associated flora and fauna can also be accessed and enjoyed by visitors from their seaward side such as via viewing platforms, outrigger canoe tours (Figure 5), boat trips, and sea kayaking tours.
Figure 5. Canoe tour through Enipein mangrove swamp, Pohnpei, Federated States of Micronesia

8 Manual for Mangrove Monitoring in the Pacific islands region
1.3. global and regional context The world area of mangroves has been recently mapped at 152,000 km2 (Spalding et al., 2010). In the Pacific Islands region, the total mangrove area is nearly 5,687 km2, or 3.74% of the world’s mangroves, with the largest areas in Papua New Guinea, Solomon Islands, Fiji and New Caledonia. Mangrove areas in the Pacific Islands are however high relative to their land areas, such as 12% of the Federated States of Micronesia, and 10% of PNG and Palau. In each Pacific Island country or territory, the species mixture is different (Table 1). There are 31 true species of mangroves and five hybrids in the Pacific Islands (Table 2). These are of the Indo-Malayan assemblage, and decline in diversity from west to east across the Pacific, reaching a present limit at the Marshall Islands in the North Pacific. Mangroves have been introduced to Hawaii and possibly to Tahiti, and possibly some locations in the Marshall Islands. The mangrove area of the Pacific islands is small in global terms, but each island group has a different mix of mangrove species to give each a unique community structure, and valuable site-specific functions (Section 1.4).
Table 1. Mangrove areas and species diversity in the Pacific Islands (Sources: Ellison, 2009; Spalding et al., 2010)
North Pacific Mangrove species (hybrids) Mangrove area (km2)
Palau 14 (1) 48.53
Guam 12 0.97
Northern Marianas 3 0.07
Federated States of Micronesia 15 (1) 86.99
Marshall Islands 5 0.1?
South Pacific
Papua New Guinea 31 (2) 4,264.82
Solomon Islands 17 (2) 602.52
New Caledonia 15 (3) 227.14
Vanuatu 14 (3) 20.51
Nauru 2 0.02
Fiji 7 (1) 424.6
Tonga 7 3.36
Samoa 3 3.70
American Samoa 3 0.52
Niue 1 0
Wallis & Futuna 2 0.25
Tuvalu 2 0.4
Kiribati 4 2.58
Cook Islands 0 0
French Polynesia 1 ?
Total 31 (5) 5,687

9Manual for Mangrove Monitoring in the Pacific islands region
Table 2. Distribution of mangrove species in the Pacific Islands (ordered by hemisphere, then longitude). (Source: updated from Ellison 2009)
*PNG also has 10 species not found elsewhere in the Pacific Islands: Aegialitis annulata Camptostemon schultzii Sonneratia ovata Sonneratia lanceolata Bruguiera exaristata Bruguiera hainesii Ceriops decandra Avicennia officinalis Avicennia rumphiana Xylocarpus moluccensis

10 Manual for Mangrove Monitoring in the Pacific islands region
2.0 Monitoring techniques
LEvEL 1 – Transect based survey recording mangrove locations, species zones, mangrove condition and identifying pressures. Level 1 is quick to do, and is a suitable exercise for capacity building with community groups.
LEvEL 2 – Vegetation plots in each zone recording community structure, height and diameter of trees, density of seedlings. Level 2 takes about a day per transect, and is better carried out by project staff, though can be done with community groups assisting.
LEvEL 3 – Sedimentation monitoring and litter productivity. These techniques take longer to carry out but can give good information on mangrove health and sedimentation trends.
The three different levels build upon each other. Hence, rather than being alternatives you can start with level 1, then add in level 2 as capacity and experience builds in the team or country.
2.1 level 1 Monitoring: transect-based survey Level 1 monitoring establishes what mangrove resources are present and what condition they are in.
2.1.1 pre field work planning and preparation a) Determine the extent of the mangrove forest using the most recent aerial photographs, such as Figure
6, 7 and 8. For full instructions see Section 3.1 (page 25) and Appendix A (page 37).
b) Examine the aerial photograph or use Google Earth if the photograph is unavailable. Can you identify any species zones in the mangroves? Can you spot any mangrove disturbance, such as gaps and paths? Identify changes in areas of predominant forest types (mangrove zones).
c) Photocopy the aerial photograph. Mark the vegetation zones on the photocopy. Include a scale and identify the direction of North. This is the copy that you will take into the field to accurately check the types and positions of the zones, called ground truthing.
d) Mark on the photocopy of the aerial photograph several transects 90o to the coastline such as shown in Figure 9. Have one transect passing through the apparent centre of the mangrove area or bay, and add sequentially spaced transects to the left and right as resources allow. Number the transects from one to the final transect, from West to East or from North to South depending on the orientation of your site.
e) Mark on the photocopy of the aerial photograph any prominent landmarks or geomorphic features such as creek channels that will help you to identify your transect lines when you are in the field.
g) Make sure you have all field equipment needed (page 12).

11Manual for Mangrove Monitoring in the Pacific islands region
Figure 6. Mangrove margin at Ha’ateiho, Tongatapu (Picture: Commonwealth of Australia, 1990). Note two shore parallel zones in the mangroves shown in darker and paler green, and extensive clearance of the landward zone on the right hand side of the picture.
Figure 7. Google Earth image, Tikina I Wai Mangroves, Fiji Notice the different textures of the mangrove forest indicating patterns of growth and different mixes of mangrove species. The waterways and salt flats need to be considered when planning transects.
Figure 8. Vaiusu Bay mangroves near Apia, Samoa Change detection map showing areas of mangrove clearing for development over a seven-year period between 1999 and 2006. Aerial photography and Quickbird satellite imagery were used to produce this map.

12 Manual for Mangrove Monitoring in the Pacific islands region
equIpMent requIred: ■ Pencil and copies of data sheeet ■ Clip board ■ 50 m fibreglasstape (open reel is best in mangrove mud) ■ Magnetic compass
■ Photocopy of aerial photo of area ■ GPS ■ Brightly coloured flagging tape
Figure 9. Transect through mangrove swamp with three zones
2.1.2 field work: In the mangroves steps:
1. Go to your first transect location. Your start point for the transect should be just above the high tide mark. For the purposes of this monitoring protocol, you are in a mangrove wetland even if only a few mangrove trees are present. Use major features visible on the aerial photograph to determine where this point and yoour transect line are located.
2. Identify the trransect start position using the GPS and write this position onto your data sheet (page 16). Use a new data form for each vegetation zone along the transect. Take notes which will help you re-locate this position if you do not have a GPS, such as marking the point with flagging tape.
3. At each observation point along the transect, preferably in the centre of each mangrove zone and at special locations such as the seaward edge, record all the information required on the data sheeet (Page 16). Walk the transect lines into the forest using a 100 m fibreglass tape. Use a hand compass to ensure that the transect is perpendicular to the shoreline and stays straight. Note which species are in a zone, which species are abuundant, and which species are rare. Measure the width of each zone (mm).
4. At each observation point assess the degree of impact in an area with a 15 m radius around you. Impact is assessed on a scale from 0 to 5 where 0 is no impact and 5 is severely impacted (Table 3). Do this by looking up at the forest canopy – notice the average height of trees, and assess how many are at that level, whether they touch and overlap (code 0) or whether there are unnatural gaps between them.

13Manual for Mangrove Monitoring in the Pacific islands region
Table 3. Codes used to record the impact of pressure on mangrove ecosystems (Adapted from Table 3.5 English et al. 1997)
Code Impact % Cover Canopy Example
0 No Impact 96-100 Even canopy of trees. No gaps. No evidence of human interference.
1 Slight Impact 76-95 Canopy of trees fairly continuous but some gaps. Some regrowth. Isolated cutting/stripping of trees or some evidence of pigs digging up saplings.
2 Moderate Impact 51-75 Broken canopy of trees with lower regrowth and recruitment areas. Some trees cut and stripped.
3 Rather High Impact 31-50 Tree canopy is uneven, the majority of the area is not showing regrowth and there is bare mud.
4 High Impact 11-30 Only a few trees remain at canopy height. Extensive clearance and some recruitment, large areas of bare mud
5 Severe Impact 0-10 Extensive clearance to bare mud, little recruitment, few trees remain alive
5. Then look around and consider why impact might be occurring. Remember that in some areas mangroves are naturally spaced and stunted. Impact may be direct, indirect, or both, record any activities such as piggeries, garbage, illegal cutting, storm damage, etc. Codes for the types of impacts are shown in Table 4, and examples are shown in Figures 10 -13.
6. Mangrove trees usually show a consistent level on their trunks that corresponds with high water level, seen as dark below and pale above the water mark on all trees in Figure 14. Record on the data sheet the approximate height of this water mark above the average mud level (Figure 15) as it can be useful to show relative elevation of observation points compared to sea level.
Table 4. Codes used to describe the type of impact at a site (Adapted from Table 3.4 English et al. 1997)
Code Type of Impact
CO Infrastructure including, piggeries, garbage dumps, developments
ER Erosion- shown by uneven mud surfaces or little scarps/ cliffs
EC/BS Extensive cutting or Bark stripping (for tannins/ dyes)
MI Mining activities such as sand collection
MU Multiple impact. Note codes of multiple impacts in Remarks.
OT Others eg. Pig foraging. Note this in remarks.
14 Manual for Mangrove Monitoring in the Pacific islands region
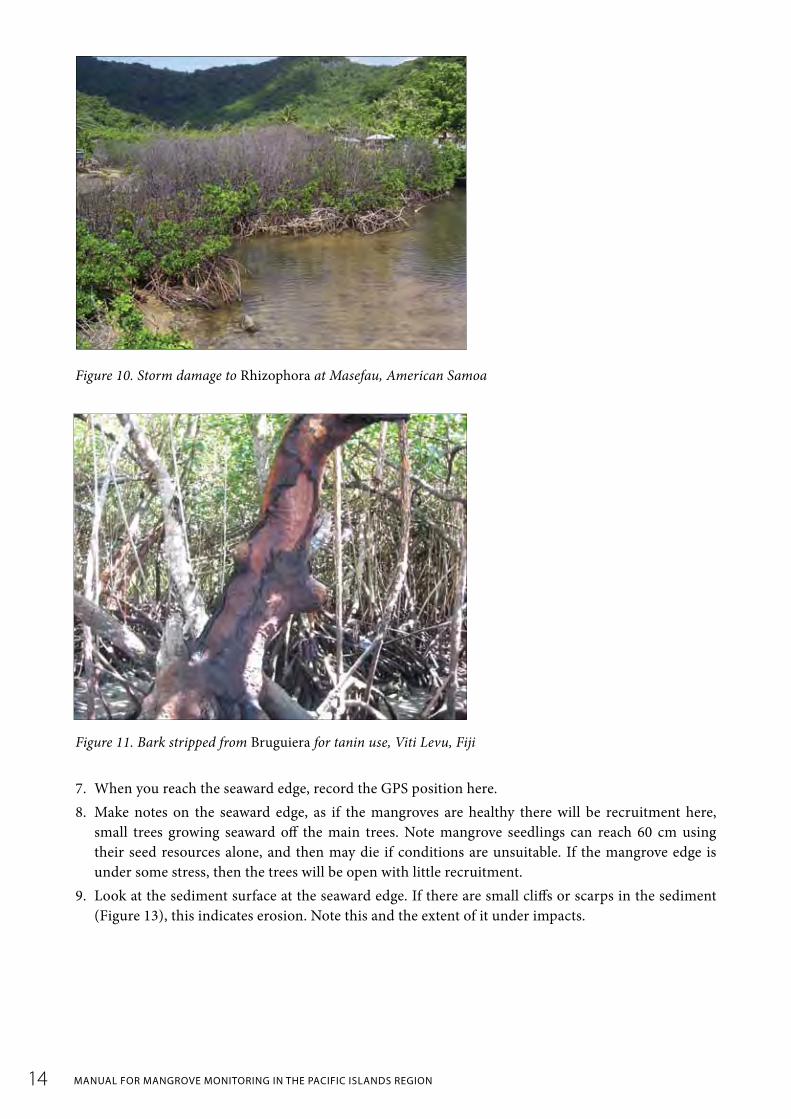
Figure 10. Storm damage to Rhizophora at Masefau, American Samoa
Figure 11. Bark stripped from Bruguiera for tanin use, Viti Levu, Fiji
7. When you reach the seaward edge, record the GPS position here. 8. Make notes on the seaward edge, as if the mangroves are healthy there will be recruitment here,
small trees growing seaward off the main trees. Note mangrove seedlings can reach 60 cm using their seed resources alone, and then may die if conditions are unsuitable. If the mangrove edge is under some stress, then the trees will be open with little recruitment.
9. Look at the sediment surface at the seaward edge. If there are small cliffs or scarps in the sediment (Figure 13), this indicates erosion. Note this and the extent of it under impacts.

15Manual for Mangrove Monitoring in the Pacific islands region
Figure 12. Open mangrove margin with no recruitment, Pala lagoon, American Samoa
Figure 13. Erosion of sediment at an Avicennia seaward margin, southern New Guinea
Figure 14. High tide mark showing on tree trunks, Kubulau, Vanua Levu, Fiji
Figure 15. Measuring high tide mark above the average mud level

level 1 Mangrove Monitoring field data sheet
date :
time:
site name:
names of fieldwork people:
transect number:
description of start point (seaward or landward?):
transect start latitude :
longitude :
description:
compass heading:
Zone Species present Width (m) Degree of Impact Impact type Height of water mark on trees (cm)
transect end latitude :
longitude :
notes on seaward edge: (ie eroding, accreting with seedlings)?
remarks

17Manual for Mangrove Monitoring in the Pacific islands region
2.2 level 2 Monitoring: permanent plots Level 2 monitoring determines the mangrove community structure, tree height, tree diameter and the density of seedlings.
2.2.1 equipment required: All listed under level 1 (Section 2.1.1, page 12). In addition, small metric tape measures (ie sewing tape measure) with mm intervals marked to measure tree circumferences, numbered aluminium tree tags (ask about these at a Forestry Department), aluminium nails, hammers, metal wire or heavy duty cable ties, wire cutters, callipers if available to measure girth of small trees, extending surveyors staff for measuring height such as shown in Figure 16 (these can be borrowed from a survey department).
2.2.2 field work: In the mangroves steps:
1. On the transect established under level 1 techniques, identify a sample location in the centre of each mangrove zone, selecting an area for each plot that appears to be characteristic of the zone based on the aerial photo and your knowledge of the site. Avoid unique places, such as next to a tidal creek or a development. Each plot should be 10 m x 10 m in dimension, though practically if the trees are very dense you can reduce this to 5 x 5 m, or if trees are very large then increase to 20 x 20 m. While one plot per zone is the minimum, you can add replicates (other adjacent plots) to improve your monitoring rigour, as greater sample size gives more robust statistical analysis.
2. Mark the corners of each plot with a flagging tape, and use the GPS to identify the location of each corner.
3. For each tree in the plot, hammer in a tag at around 1.3 m above the mud level using a stainless steel nail and numbered tag. Choose a section of the trunk that is blemish free, and below any major branches. Try to have all tags in the plot facing one direction such as landward, this makes them easier to find when re-measuring years later (Figure 17). On Rhizophora, measure above where the roots converge and below where the branches spread. Where trees branch low, tag and measure all limbs at 1.3 m and circle them together as one tree on the data sheet.
4. Measure the circumference of each tree at 2 cm above the height where you installed the tag, as this avoids any scarring when re-measured later. Record tree tags and measurements on the data sheet (see page 19). The diameter can be calculated later from the circumference measurement (diameter = circumference divided by phi which is 3.14).
5. If the tree is too small to take a nail, then put the tag on a loop of stainless steel wire or a heavy duty cable tie, and clasp this onto a suitable low branch. Measure the circumference 2 cm below the nail and below the branch.
6. Make a sketch map of where each of the numbered trees are located in the permanent plot, marking the direction of North on the sketch (see page 20). This makes it possible to re-find trees that may have lost their tags when the plot is re-measured.
18 Manual for Mangrove Monitoring in the Pacific islands region
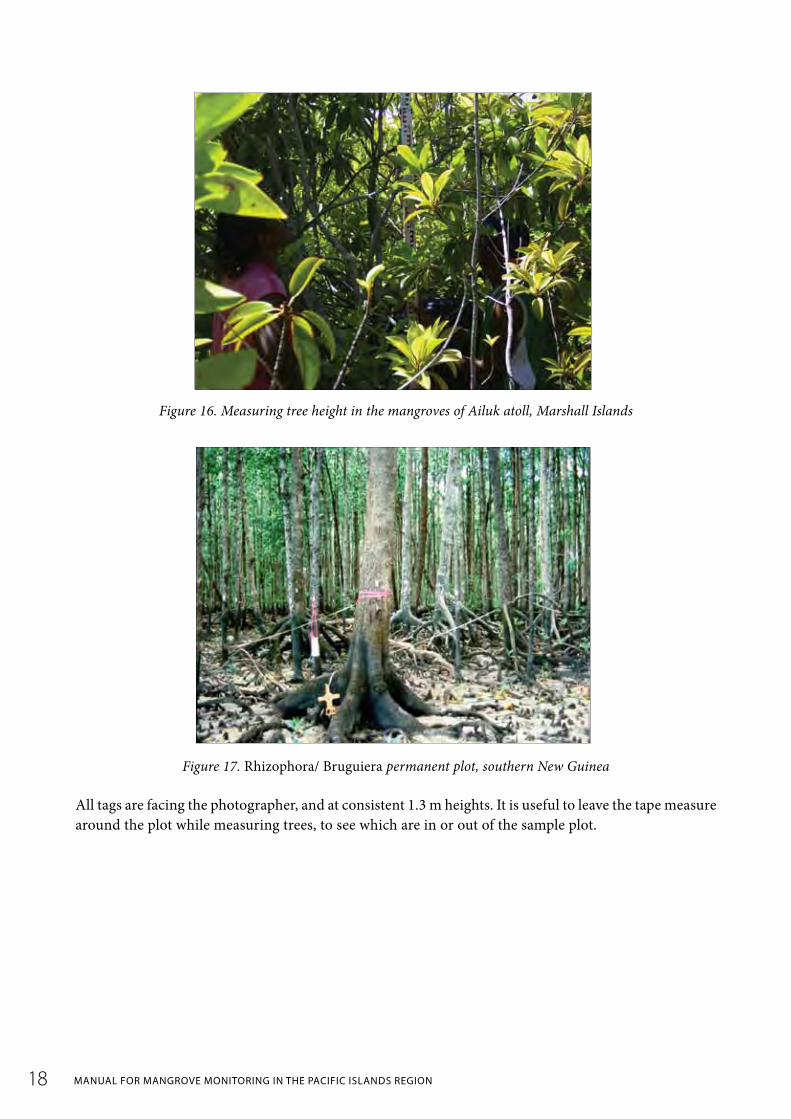
Figure 16. Measuring tree height in the mangroves of Ailuk atoll, Marshall Islands
Figure 17. Rhizophora/ Bruguiera permanent plot, southern New Guinea
All tags are facing the photographer, and at consistent 1.3 m heights. It is useful to leave the tape measure around the plot while measuring trees, to see which are in or out of the sample plot.

level 2 Mangrove PerManent Plot datasheet
Tag number Species Diameter Height Remarks
data collectors:
date:
remarks:

level 2 Mangrove PerManent Plot sketch MaP
sketch map of mangrove plot showing approximate location of each tagged tree.
give a north arrow, a scale, and show any features like fallen trees

21Manual for Mangrove Monitoring in the Pacific islands region
2.3 level 3 Monitoring: litter productivity and sedimentation monitoring Level 3 monitoring determines mangrove health/productivity and sedimentation trends.
2.3.1. litter productivity Litter in this context means the productive fall from a forest. Data on litter fall collected for a minimum of a year can show vegetative production (grams production per square meter of mangrove forest) and phenology (the timing of flowering and fruiting). These data are useful for climate change identification and productivity calculations as well as monitoring of health.
equIpMent requIred: for each litter catcher (Figures 15 and 18), 4 m of 4 cm diameter PvC pipe, 4 PvC corners to fit, glue to stick these together into a square, about 2 square metres of shadecloth or fine netting, small plastic cable ties to attach net to the pipe, rope to hang catcher in trees, plastic bags and marker pen for the samples, 60oC drying oven, 2 decimal place balance.
2.3.1.1 field work: In the mangroves In each permanent plot, hang litter catchers in the trees above the reach of tides, minimum three per plot. Empty these litter catchers monthly into a plastic bag.
2.3.1.2 laboratory work Place each sample in a large metal tray, and dry the catch of each sample in an oven at 60°C for 2 days. Then sort each into leaves, fruit, flowers, wood and weigh each component (see datasheet on page 22). This would be a good project to involve a high school or college science class.
Figure 18. Litter catcher hung in Rhizophora forest
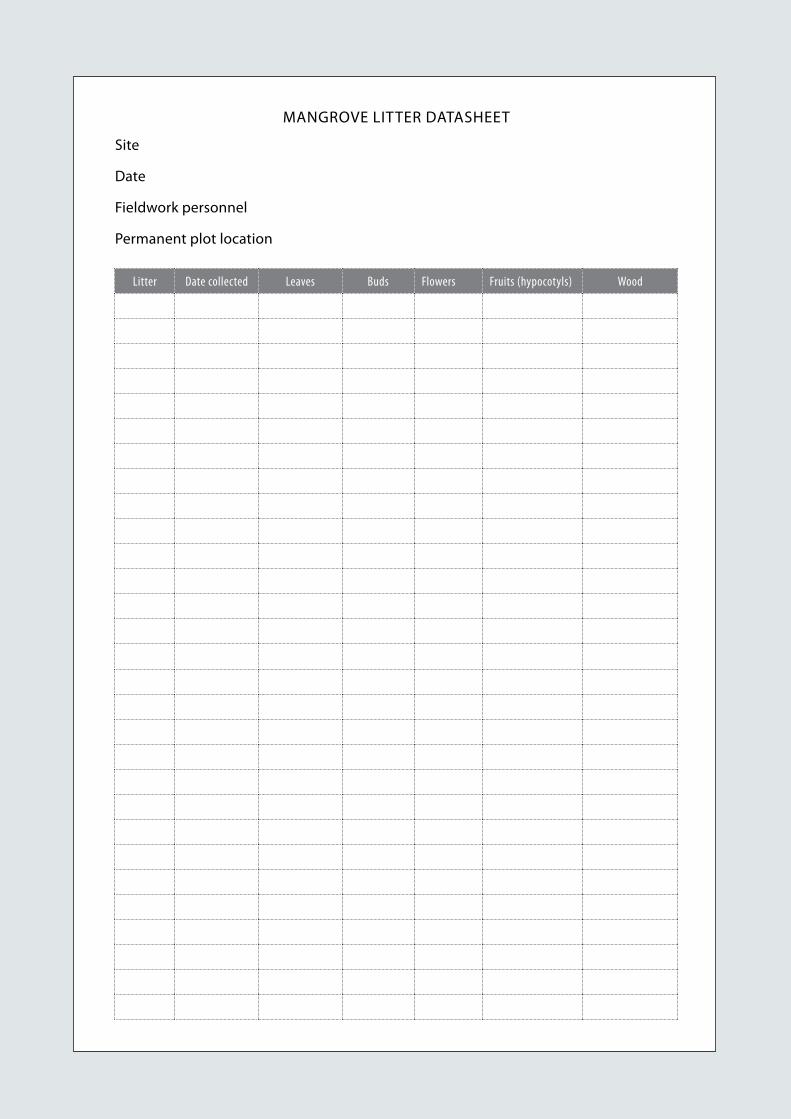
Mangrove litter datasheet
site
date
fieldwork personnel
Permanent plot location
Litter Date collected Leaves Buds Flowers Fruits (hypocotyls) Wood
23Manual for Mangrove Monitoring in the Pacific islands region
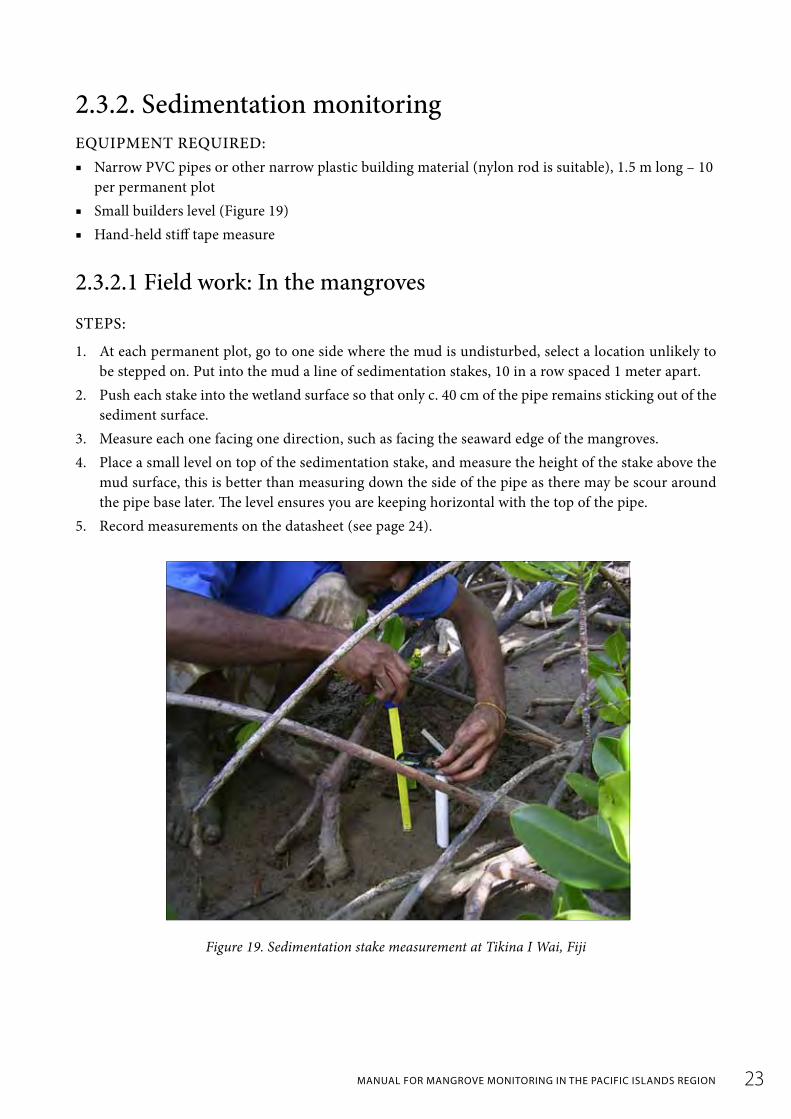
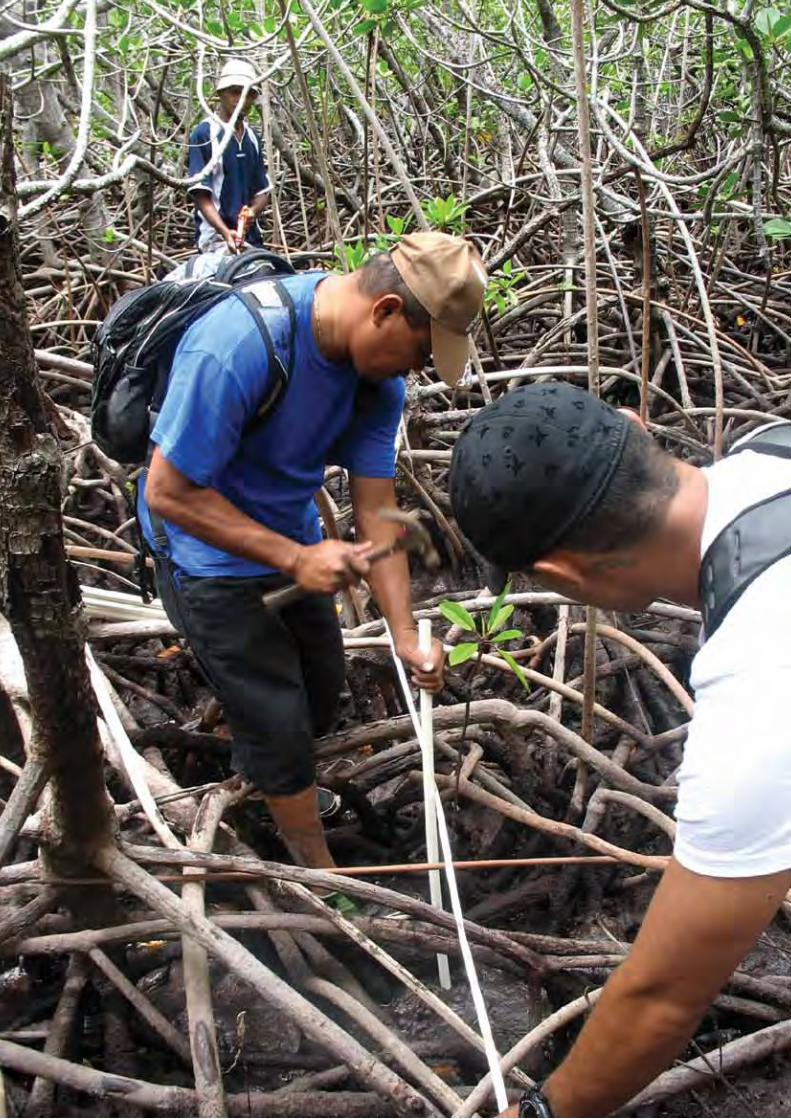
2.3.2. sedimentation monitoring equIpMent requIred: ■ Narrow PvC pipes or other narrow plastic building material (nylon rod is suitable), 1.5 m long – 10
per permanent plot ■ Small builders level (Figure 19) ■ Hand-held stiff tape measure
2.3.2.1 field work: In the mangroves
steps:
1. At each permanent plot, go to one side where the mud is undisturbed, select a location unlikely to be stepped on. Put into the mud a line of sedimentation stakes, 10 in a row spaced 1 meter apart.
2. Push each stake into the wetland surface so that only c. 40 cm of the pipe remains sticking out of the sediment surface.
3. Measure each one facing one direction, such as facing the seaward edge of the mangroves. 4. Place a small level on top of the sedimentation stake, and measure the height of the stake above the
mud surface, this is better than measuring down the side of the pipe as there may be scour around the pipe base later. The level ensures you are keeping horizontal with the top of the pipe.
5. Record measurements on the datasheet (see page 24).
Figure 19. Sedimentation stake measurement at Tikina I Wai, Fiji

sediMentation stake data sheet
site:
date:
fieldwork personnel:
Permanent plot location:
direction facing during measurement :
Stake Height
1
2
3
4
5
6
7
8
9
10
1
2
3
4
5
6
7
8
9
10

25Manual for Mangrove Monitoring in the Pacific islands region
3.0 Data recording
3.1. Making a Map of your Mangrove(s) equIpMent requIred:
■ Full Google Earth Suite – find it free at http://www.google.com/earth/index.html ■ A GPS unit and GIS software (if available).
using google earth Imagery Google Earth is a free, simple solution to create a map if you do not have GIS skills or software. It allows you to show the boundaries of your mangrove and other significant site markers by creating a map with annotations using data and information about your projects.
steps
1. Before going into the field it is essential that you have a survey plan. Using Google Earth, you can identify the entire extent of the mangrove forest, select a representative transect(s) and identify the coordinates to use with your GPS to find the start and end point of your transect.
2. Google Earth can help you identify different vegetation types, mixes of mangrove species and water bodies or streams that you need to traverse. Using imagery such as Google Earth, you can identify unique features such as stunted mangroves, gaps in the mangroves which may have been caused by human activities or salt pans. If these features are normal parts of your mangrove system they should be included in your transect.
3. After identifying the boundaries of your mangroves and the start and end coordinates of the representative transect you can enter the coordinates into your GPS unit, and then use it to navigate to your field site.
4. While in the field you will need your mangrove monitoring data sheet on which you can record significant features such as mangrove harvesting or survey site points you have logged in your GPS during that visit. It is important to note which coordinates go with which data on your data sheet.
5. These coordinates can then be uploaded to Google Earth or an existing GIS System in the office and then linked to your mangrove monitoring data. The final product is a spatially referenced mangrove monitoring data set, which can be used as a reference so you can return to the same sites year after year to observe changes over time such as harvesting or climate related change.
6. If aerial photographs are available from your lands and survey department – they are almost always preferable since the accuracy, resolution and date are known and they are of high quality. It is important to remember that the georeferencing for the images on Google Earth is uncertain – the time frame is three years thus only major changes are obvious. For detailed instructions on using Google Earth to view mangroves see Appendix A.
3.2 database entry A spreadsheet will be created for each mangrove site. Enter the data from your field data sheets, where there is one data sheet for each transect’s vegetation zone, into the database (for instructions, see Appendix B). After inputting your data into the computer, check your field data sheet against the data you entered in the computer and correct any mistakes made during the data entry.

26 Manual for Mangrove Monitoring in the Pacific islands region
4.0 Examples of field monitoring data
4.1. example 1: suva, fiji
Mangrove Monitoring field data sheet
date : 16.03.07
time: 0950
site name: Muanikau at R.T. Kamarusi Park, Suva, Fiji
transect number: 1
vegetation zone (dominant tree species): Rhizophora
description of start point (seaward or landward?) Landward
transect start latitude : 180 09’ 26.4”S
longitude : 1780 26’ 40.4”E
description
compass heading: 90 degrees from coastline: 1200
Zone Species present Width (m) Degree of Impact Impact type
1 Rhizophora samoensis 19.6 Moderate garbage
2 Bruguiera gymnorrhiza 15.0 Highly impacted Bark stripping, garbage, recently introduced sediment burying roots
3 R. samoensis, R. stylosa 35.6 Moderately impacted
Large woody debris, garbage
transect end latitude : 1800 09’ 29.0”s
longitude : 1780 26’ 43.2”e
notes on seaward edge: (ie eroding, accreting with seedlings)? Stable sediment, few young seedlings offshore (Figure 21).
remarks (include names of observers/team): George Petro (Vanuatu), Joanne Pita (Solomon Islands), Katareti (Kiribati), Champion Mata’u (American Samoa), Thomas Bebeu (Solomon Islands), Marciano Imar (Pohnpei), Ana Tiraa (SPREP).

27Manual for Mangrove Monitoring in the Pacific islands region
Mangrove Monitoring field data sheet
date : 16.03.07
time: 0948
site name: R.T. Kamarusi Park, Suva, Fiji
transect number: 2
vegetation zone (dominant tree species): R. stylosa, some R. mangle
description of start point (seaward or landward?) Landward
transect start latitude : 180 09’ 26.4”S longitude : 1780 26’ 40.4”E
description
compass heading: 90 degrees from coastline: 1200
Zone Species present Width (m) Degree of Impact Impact type
1 Bruguiera, Rhizophora samoensis, Excoecaria gallocha
25.7 Moderate cuttings
2 Bruguiera gymnorrhiza 4.5 Rather high impact (see Figure 20)
Bark stripping, garbage, hydrocarbons
3 R. samoensis, R. stylosa 26.9 Slightly impacted
Cutting, garbage
transect end latitude : 1800 09’ 29.85”s
longitude : 1780 26’ 42.22”e
notes on seaward edge: (ie eroding, accreting with seedlings)? Stable sediment, very few seedlings, seaward edge Rhizophora trees roots not fixing into sediment
remarks (include names of observers/team): Robert Kinika (Solomon Islands; Rufus Mahuro (PNG), Deyna Marsh (Cook Islands), Susan Ewen (PNG), Selaina Vaitautolu- Tuimavave (American Samoa).

28 Manual for Mangrove Monitoring in the Pacific islands region
Figure 20. Rather high impact zone 2 at Kamarusi Park, Suva, Fiji Note stripped bark and light gaps in canopy.
Figure 21. Moderately impacted zone 3 at Kamarusi Park, Suva, Fiji The seaward edge roots are not fixing in the mud because of large woody debris rolling around at high tide.
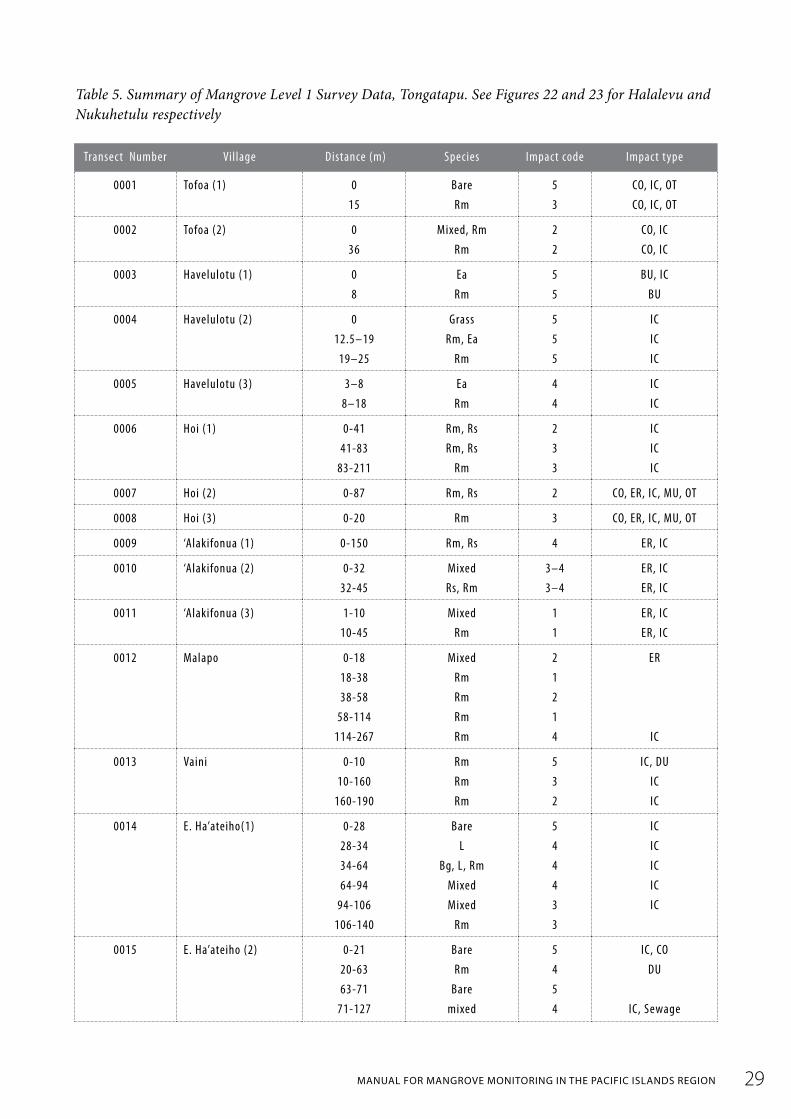
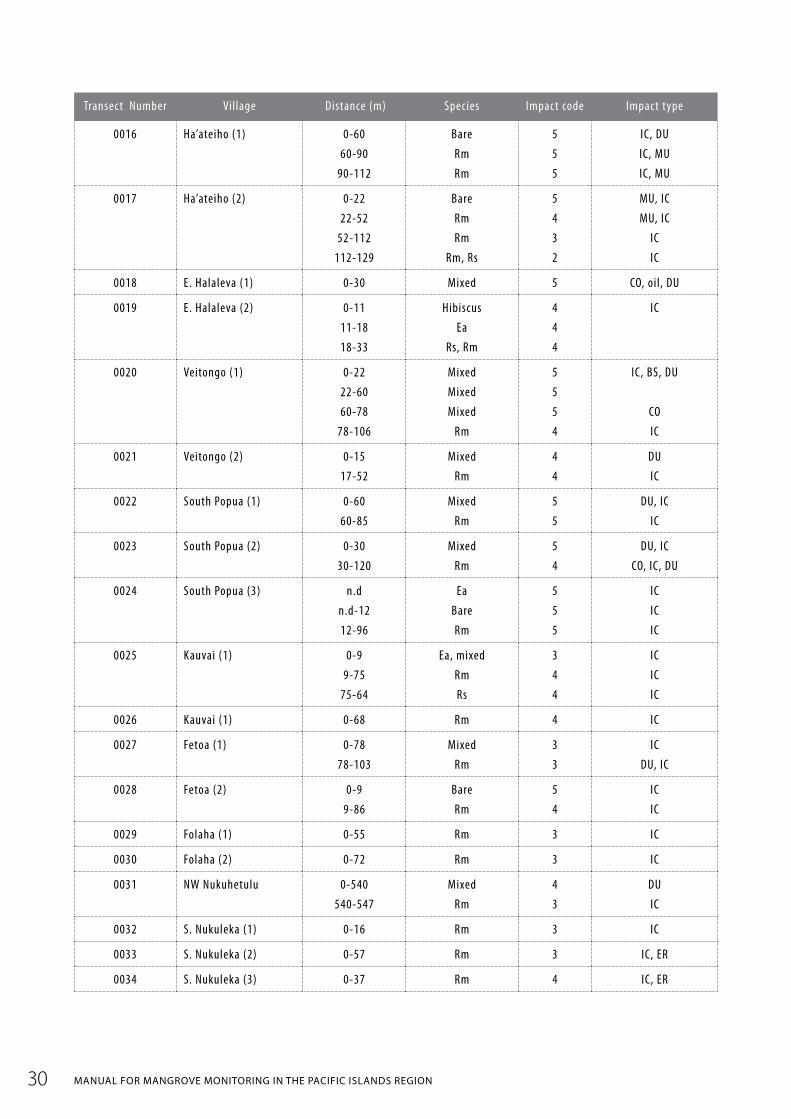
4.2. example 2: tongatapu, tonga During the AusAID Tonga Environment and Management Planning Project (TEMPP), Ministry of Environment staff were trained how to carry out a level 1 baseline survey of mangrove species zones (Figures 22 and 23). Between March and September 1998 Ministry staff undertook 45 mangrove survey transects at 20 mangrove locations in the Fanga ‘Uta and Fanga Kakau lagoons (see Figure 24). These data were reviewed and summarized into the below Table 5. The Impact Code levels used are defined in Table 3, and the impact types are defined in Table 4.
Figure 22. Aerial view of Halaleva mangrove margin, Tongatapu
Figure 23. Aerial view of Nukuhetulu mangrove forest, Tongatapu
29Manual for Mangrove Monitoring in the Pacific islands region
Table 5. Summary of Mangrove Level 1 Survey Data, Tongatapu. See Figures 22 and 23 for Halalevu and Nukuhetulu respectively
Transect Number Village Distance (m) Species Impact code Impact type
0001 Tofoa (1) 0
15
Bare
Rm
5
3
CO, IC, OT
CO, IC, OT
0002 Tofoa (2) 0
36
Mixed, Rm
Rm
2
2
CO, IC
CO, IC
0003 Havelulotu (1) 0
8
Ea
Rm
5
5
BU, IC
BU
0004 Havelulotu (2) 0
12.5–19
19–25
Grass
Rm, Ea
Rm
5
5
5
IC
IC
IC
0005 Havelulotu (3) 3–8
8–18
Ea
Rm
4
4
IC
IC
0006 Hoi (1) 0-41
41-83
83-211
Rm, Rs
Rm, Rs
Rm
2
3
3
IC
IC
IC
0007 Hoi (2) 0-87 Rm, Rs 2 CO, ER, IC, MU, OT
0008 Hoi (3) 0-20 Rm 3 CO, ER, IC, MU, OT
0009 ‘Alakifonua (1) 0-150 Rm, Rs 4 ER, IC
0010 ‘Alakifonua (2) 0-32
32-45
Mixed
Rs, Rm
3–4
3–4
ER, IC
ER, IC
0011 ‘Alakifonua (3) 1-10
10-45
Mixed
Rm
1
1
ER, IC
ER, IC
0012 Malapo 0-18
18-38
38-58
58-114
114-267
Mixed
Rm
Rm
Rm
Rm
2
1
2
1
4
ER
IC
0013 Vaini 0-10
10-160
160-190
Rm
Rm
Rm
5
3
2
IC, DU
IC
IC
0014 E. Ha’ateiho(1) 0-28
28-34
34-64
64-94
94-106
106-140
Bare
L
Bg, L, Rm
Mixed
Mixed
Rm
5
4
4
4
3
3
IC
IC
IC
IC
IC
0015 E. Ha’ateiho (2) 0-21
20-63
63-71
71-127
Bare
Rm
Bare
mixed
5
4
5
4
IC, CO
DU
IC, Sewage
30 Manual for Mangrove Monitoring in the Pacific islands region
Transect Number Village Distance (m) Species Impact code Impact type
0016 Ha’ateiho (1) 0-60
60-90
90-112
Bare
Rm
Rm
5
5
5
IC, DU
IC, MU
IC, MU
0017 Ha’ateiho (2) 0-22
22-52
52-112
112-129
Bare
Rm
Rm
Rm, Rs
5
4
3
2
MU, IC
MU, IC
IC
IC
0018 E. Halaleva (1) 0-30 Mixed 5 CO, oil, DU
0019 E. Halaleva (2) 0-11
11-18
18-33
Hibiscus
Ea
Rs, Rm
4
4
4
IC
0020 Veitongo (1) 0-22
22-60
60-78
78-106
Mixed
Mixed
Mixed
Rm
5
5
5
4
IC, BS, DU
CO
IC
0021 Veitongo (2) 0-15
17-52
Mixed
Rm
4
4
DU
IC
0022 South Popua (1) 0-60
60-85
Mixed
Rm
5
5
DU, IC
IC
0023 South Popua (2) 0-30
30-120
Mixed
Rm
5
4
DU, IC
CO, IC, DU
0024 South Popua (3) n.d
n.d-12
12-96
Ea
Bare
Rm
5
5
5
IC
IC
IC
0025 Kauvai (1) 0-9
9-75
75-64
Ea, mixed
Rm
Rs
3
4
4
IC
IC
IC
0026 Kauvai (1) 0-68 Rm 4 IC
0027 Fetoa (1) 0-78
78-103
Mixed
Rm
3
3
IC
DU, IC
0028 Fetoa (2) 0-9
9-86
Bare
Rm
5
4
IC
IC
0029 Folaha (1) 0-55 Rm 3 IC
0030 Folaha (2) 0-72 Rm 3 IC
0031 NW Nukuhetulu 0-540
540-547
Mixed
Rm
4
3
DU
IC
0032 S. Nukuleka (1) 0-16 Rm 3 IC
0033 S. Nukuleka (2) 0-57 Rm 3 IC, ER
0034 S. Nukuleka (3) 0-37 Rm 4 IC, ER
0-30

31Manual for Mangrove Monitoring in the Pacific islands region
Transect Number Village Distance (m) Species Impact code Impact type
0035 Nukuleka (1) 0-8
8-70
Mixed, bare
Rm
5
2
IC, ER
IC
0038 Nukuleka (2) 0-9 Rm 4 IC, ER
0039 NW Kanatea (1) 0-40 Rm 5 IC, Pollution
0040 NW Kanatea (2) 0-15
15-28
Mixed
Rm
4
3
DU, IC, pollution
BS
0041 S. Nukuhetulu 0-30
30-188
188-203
Mixed, Bg
Mixed
Rm
2-3
5?
5?
IC, BS
IC, BS
0042 S. Nukuhetulu 0-227
227-251
Mixed
Rm
2
2
IC, BS
0043 S. Nukunukumotu (1) 0-360
360-600
600-840
840-1287
Rs
Rs
Rm
Rs
2
3
2
2
IC
IC
IC
0044 S. Nukunukumotu (2) 0-120
120-330
330-401
401-581
581-640
640-880
880-1135
Mixed, Rs
Mixed
Rm
Rs
Mixed
L
Mixed
3
3
3
3
5
3
IC
IC
IC
IC
0045 S. Nukunukumotu (3) 0-248
248-696
Mixed
Rs
3
3
IC
Key to species
Rm = Rhizophora samoensis (Tongolei)Rs = Rhizophora stylosa (Tongolei)Bg = Bruguiera gymnorrhiza (Tongo ta’ane)L = Lumnitzera littorea (Hangale)Ea = Excoecaria agallocha (Feta ‘anu)
coMMents on the tongatapu data
The transects were located perpendicular to the shoreline through the mangrove ecosystem at all of the major mangrove areas on the Fanga ‘Uta lagoon. The surveys indicate that zonation is simple and marked, with different species assemblages forming zones parallel to the shoreline from the lagoon fringe to the edge of dry land. The lowest zone (to seaward) consists of Rhizophora samoensis and/ or R. stylosa. Landwards of the Rhizophora zone is a Bruguiera gymnorrhiza zone, with occasional Lumnitzera littorea. The Bruguiera zone becomes inter-dispersed with Excoecaria agallocha towards land.

32 Manual for Mangrove Monitoring in the Pacific islands region
There is overall high human impact on the mangroves of the Fanga ‘Uta lagoon. Locations with higher level of human impact, requiring rehabilitation, were shown to be Havelutotu, East Ha’ateiho, Ha’ateiho, East Halaleva, veitongo, Alakifonua and South Popua. Most common impacts are cutting of trees, dumping of garbage, and reclamation for construction of houses. House construction usually introduces problems of sewage disposal. Areas shown by the Baseline Survey Transects (Table 5) to have more moderate human impact were Malapo, South Nukuhetulu and South Nukunukumotu. These are larger and more inaccessible mangrove areas (see Figure 23). This data was later used to zone mangroves of the area into different classes of usage: Special village Use, Sustainable Mangroves, and Conservation Areas (Figure 24), from Prescott et al., 1993.
Figure 24. Fanga ‘Uta lagoon mangrove zoning map (from Prescott et al., 1993)

33Manual for Mangrove Monitoring in the Pacific islands region
4.3. example 3: ailuk atoll, Marshall Islands In January 2007 in consultation with the Ailuk Atoll Marine Resource Management Advisory Committee, mangrove resources of the atoll were baseline surveyed using level 2 monitoring procedures (Tables 6 and 7; Figure 25).
Table 6. Mangrove tree dimensions at Bigen Mangrove Pond Table 7. Mangrove sapling dimensions at Bigen Mangrove Pond
Tree ID Number Diameter (cm) Height (m)
882 30.2 3.4
888 22.1 3.6
880 31.4 3.4
874 23.1 3.7
875 11.2 2.5
876 9.1 3.2
877 16.3 3.2
881 19.5 3.2
868 19.9 3.4
892 15.9 3.1
886 38.8 3.9
867 12.8 3.9
879 12.4 2.0
889 18.8 4.3
Figure 25. Mangrove pond on Bigen Islet, Ailuk atoll, Marshall Islands

34 Manual for Mangrove Monitoring in the Pacific islands region
Table 7. Mangrove sapling dimensions at Bigen Mangrove Pond
Sapling ID Number Diameter (cm) Height (m)
887 1.5 1.9
890 1.3 1.3
893 1.3 2.2
884 1.8 2.5
873 1.8 1.7
888 1.1 1.3
866 1.3 1.2
869 1.3 1.2
885 1.3 1.3
896 1.7 1.7
899 1.3 1.6
871 1.1 1.8
907 1.1 1.6
878 1.3 1.9
865 1.4 1.9
898 1.2 1.7
894 1.4 2.4
897 1.0 1.5
872 1.0 1.8
coMMents on the aIluk data:
Mangrove resources of Ailuk atoll were surveyed, finding one inland area in Bigen islet with Bruguiera gymnorrhiza trees, where a permanent monitoring site was established. This mangrove area found at Bigen, the fourth island from the north on the eastern string of islands along the Ailuk windward reef, was the only remaining mangrove area known on Ailuk Atoll. It is located in an inland depression on the NE side of the island (10o 25’ 31.6” N; 169o 58’ 01.0”E). The site appeared to be natural, with dense mangrove growth. The mangrove surface in the larger depression was surveyed to be 1.71 m above MSL. The mud substrate was found to be alkaline, with a pH of 8.5-9.0. The water present at Bigen mangrove pond was fairly saline, with an average salinity of 32.3 mS/cm, and conductivity of 20.1 ppt. Mangrove species present were all Bruguiera gymnorrhiza, in several size classes (Tables 6 and 7). There were 14 mature trees with an average diameter of 20.1 cm, and an average height of 3.3 m. These at the time of sampling (January) carried propagules which were not mature for abscission. There were also 19 saplings all in the larger triangular pond, with an average diameter of 1.3 cm and an average height of 1.7 m. These were densely spaced. Under both the trees and saplings were a large number of seedlings of mainly less than 3 years of age, and less than 60 cm in height, in total over 150 individuals densely spaced. This indicated good recruitment.

35Manual for Mangrove Monitoring in the Pacific islands region
References Ellison, J.C. (2009) Wetlands of the Pacific Island Region. Wetlands Ecology and Management 17, 169-206. Ellison, J.C., (1995). Systematics and distributions of Pacific Island mangroves. In Marine and Coastal
Biodiversity in the Tropical Island Pacific Region: Volume I. Species Systematics and Information Management Priorities, Maragos, J. E., Peterson, M. N. A., Eldredge, L. G., Bardach, J. E. and Takeuchi, H. F. Eds., East West Center, Honolulu, 59-74.
English, S., Wilkinson, C. and Baker, v. (1997). Manual for survey of tropical marine resources. 2nd Edition. Australian Institute of Marine Science, Townsville.
FAO. (2003). New Global Mangrove Estimate. Food and Agriculture Organization of the United Nations, Rome, Italy.
FAO (2003) Status and trends in mangrove area extent worldwide. In Wilkie ML, Fortuna S, editors. Forest Resources Assessment Working Paper No. 63. Rome: Forest Resources Division, FAO. http://www.fao.org/docrep/007/j1533e/j1533e00.HTM
Intergovernmental Governmental Panel on Climate Change (2007). Climate Change 2007: The Physical Basis. Intergovernmental Panel on Climate Change. IPCC, Geneva.
Intergovernmental Oceanographic Commission (1990). UNEP-IOC-WMO-IUCN Meeting of Experts on a Long-Term Global Monitoring System of Coastal and Near Shore Phenomena Related to Climate Change. Intergovernmental Ocenaographic Commission Report of Meetings of Experts and Equivalent Bodies 61.
Intergovernmental Oceanographic Commission (1991). UNEP-IOC-WMO-IUCN Meeting of Experts on a Long-Term Global Monitoring System of Coastal and Near Shore Phenomena Related to Climate Change, Pilot Projects on Mangroves and Coral Reefs. Intergovernmental Ocenaographic Commission Report of Meetings of Experts and Equivalent Bodies 69.
Prescott, N., Kaly, U., Taufa, P., Matoto, L., Tukia Lepa, S., Faletau, T., and Palaki, A., (1993). Environmental Management Plan for Fanga’uta Lagoon System. Ministry of Environment, Nukualofa, Tonga.
Polidoro, B.A., Carpenter, K.E., Collins, L., Duke, N.C., Ellison, A.M., Ellison, J.C., Farnsworth, E.J., Fernando, E.S., Kathiresan, K., Koedam, N.E., Livingstone, S.R., Miyagi, T., Moore, G.E., vien, N.N., Ong, J.E., Primavera, J.H., Salmo, S.G., Sanciangco, J.C., Sukardjo, S., Wang, Y.M., and Yong, J.W.H. (2010). The loss of species: Mangrove extinction risk and geographic areas of concern. Plos One, 5(4), 1-10.
South Pacific Regional Environment Program (2011). Regional Wetlands Action Plan for the Pacific Islands 2011-2013. SPREP, Apia.
Spalding, M., Kainuma, M. and Collins, L. (2010). World Atlas of Mangroves. Earthscan: London ad Washington D.C.
UNEP/ UNESCO (1993). Impact of expected climate change on mangroves. UNESCO Report in Marine Science 61.
UNEP (1994). Assessment and Monitoring of Climatic Change Impacts on Mangrove Ecosystems. UNEP Regional Seas Reports and Studies No 154, 62pp.

37Manual for Mangrove Monitoring in the Pacific islands region
Appendix A
using google earth to view Mangroves
InstructIons:
1. Open Google Earth on your computer and download the software at Web URL: http://www.google.com/earth/index.htm.
2. Install Google Earth if it is your first time using it. 3. In the Search Panel, enter your site name (if the name
you entered is not recognized, type in the village name or name of the island) into the Fly to box, and click → Google Earth will fly you to your site.
4. Find the toolbar above the image viewer → 5. Each button on the toolbar has a purpose.
Find the tools for creating a place mark, path, and polygon →
Find your side using the zoom and pan tools. To zoom use the right-click or roller ball on your mouse. Right click and “up” zooms out while right click and “down” zooms in. Zoom out until you can see the coast. Then “pan” with the mouse to the location.
addIng data:
Add Polygons – The Boundary of your mangrove
1. Click the Add Polygon button at the top left of your map →
A New Polygon dialog box appears, and the cursor becomes → 2. To see the image under the boundary you are drawing click on
style, color and choose ‘outlined’ – this will allow you to see the image underneath.
3. Click on a series of places on the map to form a polygon. Each time you click, a new node is added to your polygon. You can also click-and-drag to create frequent nodes, which makes a smoother boundary to your polygon. In this example, we will create a polygon around your protected area. NOTICE that

38 Manual for Mangrove Monitoring in the Pacific islands region
each “click” makes a new “point” – when you are done click OK (see below). If you make a MISTAKE – just RIGHT CLICK and the node will be removed.
4. In the New Polygon dialog box, type in a name for the polygon in the Name field. In this example, we typed “Tikina Wai South” you should add the proper name for your site.
5. Type in a description for the polygon in the Description field, which will be displayed in the polygon’s pop-up balloon. In this example, we typed “WWF Mangrove site.”
6. Save your image to use in a report or to share. – Click on FILE, click on SAvE IMAGE – Name the image and save it to the desktop.
7. Now practice sharing your new data – you can send it to yourself and SPREP via email.
Right click on the name of your protected area and click on SAvE PLACE AS → Save it to your desktop – now you can open up your email account and email it to yourself and me. Send KML file (that you saved in the last step and the “place” which, to both of us). On the desktop you now have both an image (jpg) and a kml file (which is the shape you just made). Open up your email program (outlook, g-mail or whatever you use to send email) Type in your own email address as well as mine [email protected], attach the image and KML and click send – now you have a copy waiting for you at home.

39Manual for Mangrove Monitoring in the Pacific islands region
8. You can include the coordinates of your site in your report – find them at the bottom of the screen- useful, professional and easy to do.
tIps:
• To edit a polygon’s location, name, or description, right-click on the path in the 3D viewer or in the Places panel, and choose Properties (on a PC). Then you can edit the title and description and click OK. Right-click your mouse to delete recently-created nodes. You can also click-and-drag any nodes to reshape the polygon.
addItIonal tools You can use.
Adding Placemarks 1. Click the Add Placemark button in the toolbar →
A placemark is automatically added to Google Earth. Also, a New Placemark dialog box appears.
2. Move the location of your placemark by clicking and dragging its icon, or by typing a latitude and longitude into the New Placemark dialog box.
3. In the New Placemark dialog box, type in a name for the placemark in the Name field. In this example, we typed “Draiba MPA”.
4. Type in a description for the placemark in the Description field, which will be displayed when a user clicks on the placemark. In this example, we typed “Example of and MPA location.”
5. Click on the icon button in the top-right corner of the window, and choose an icon for your placemark and press OK. In this example, we chose a water icon.
6. Click on the Style, Color tab, and choose a color, scale (or size), and opacity for the placemark icon and label text. In this example, we choose to change our label color to purple.
7. When you are finished creating your placemark, click OK and your placemark will appear in the Places panel. When you click on you’re the icon of your placemark or hyperlinked name in Google Earth, a pop-up balloon will appear with the name and description of your placemark.
tIps:
• To edit the location of a placemark, its name, or description, right-click on the placemark in the 3D viewer or in the Places panel, and choose Properties (on a PC) or Get Info (on a Mac). Click-and-drag the icon to change the location, or edit the name and description and click OK.

40 Manual for Mangrove Monitoring in the Pacific islands region
adding paths 1. Click the Add Path button at the top left of your map →
A New Path dialog box appears, and your cursor changes to → 2. Click on a series of places on the map form a path. Each time
you click, a new node is added to your path. You can also click-and-drag to create frequent nodes, which makes a smoother path. In this example, we will create a path marking a transect.
3. In the New Path dialog box, type in a name for the path in the Name field. In this example, we typed “reef crest”.
4. Click on the Style, Color tab, and choose a color, width, and opacity for the path. In this example, we choose a dark green color, a width of 5.0, and an opacity of 75%.
tIps:
• A Google Earth project file is a KML file, with a file type extension of .kml or .kmz. KM L files can be converted in GIS programs to shape files so KML is the preferable format.
• When you save your Google Earth KML project file to your computer, it is private. If you upload the file to a web server,, or e-mail it your friend or colleague, then it is no longer privvate. This is similar to putting any file, such as a PDF file, up on the web or e -mailing it to someone.
• TO MEASURE DISTANCE. You can measure distance using the ruler tool, and select units by using the pull down menu. See figure below.
• TO MEASURE AREA. This function is only available to those who ppurchase Google Pro. To generate areas for free the KML file should be converted using a GIS program– you can send your KML file to your national GIS focal point or to SPREP for assistance.
For more information see:http://earth.google.com/outreach/tutorials_all.html#beginner

41Manual for Mangrove Monitoring in the Pacific islands region
Appendix B
regional Mangrove research and Monitoring database system This section is part of the documentation that accompanies the Mangrove Research and Monitoring database system and aims at assisting users to better understand and utilise system features and functions. The Mangrove Research and Monitoring Database System is a tool developed to assist in capturing and reporting on data on the management of mangroves by SPREP member countries and territories. The objectives are to ■ develop a centralised database ■ capture national mangrove data and survey data using the 3 levels of monitoring ■ provide an analysis and reporting tool
The database was built using Microsoft Access 7. The database has been built with extensive use of menus, drop down lists and data input formatting/masks to minimize user typing errors and ease of entering information.
1. system features
drop down lIsts
On selecting it displays (drop downs) list of values for a single selection by the user. These values are stored in a table which can be updated by the Administrator. Drop down lists can be distinguished from normal text boxes by having a at the end of the text box.
Figure 1. Locality Drop down list
To add more values to the selection in the drop down fields, click on the button and an entry screen for this field will be displayed to enter new values. This option will found on most fields in data entry and editing screens to make the data entry process efficient and avoid the user having to return to the reference tables to add new values.

42 Manual for Mangrove Monitoring in the Pacific islands region
MultI-select lIsts
Multi- select lists gives the user the option to select multiple values in the list. By clicking on opens up the multi-select list, click on the values and then close the list. The selected values will be displayed in its respective text box on the screen as shown in figure 2.
Figure 2. Personnel multi‐select list
enterIng coordInates
Coordinates can be captured in the system in either degrees or decimal format. Input fields for latitude and longitude will have an button next to it to access the facility to enter the coordinates.
Figure 3. Capturing latitude and longitude entry screen
Select either decimal or degree format and enter the values for latitude and longitude. Close the Capture coordinates facility and your values will be displayed in their respective text boxes on the screen.
subforMs
Subforms are forms/screens embedded in a main form or screen such as the Plots detail subform below. You can think of it as being similar to a datasheet on an orders form where the main form has the details of the purchaser and the datasheet has the purchasers list of items ordered. In this example, the main form (transect Survey) contains data on the site/Transect and the plot details subform contains data on each plot for this site/transect.
Figure 4. Subform
Record selectors Navigation buttons
43Manual for Mangrove Monitoring in the Pacific islands region
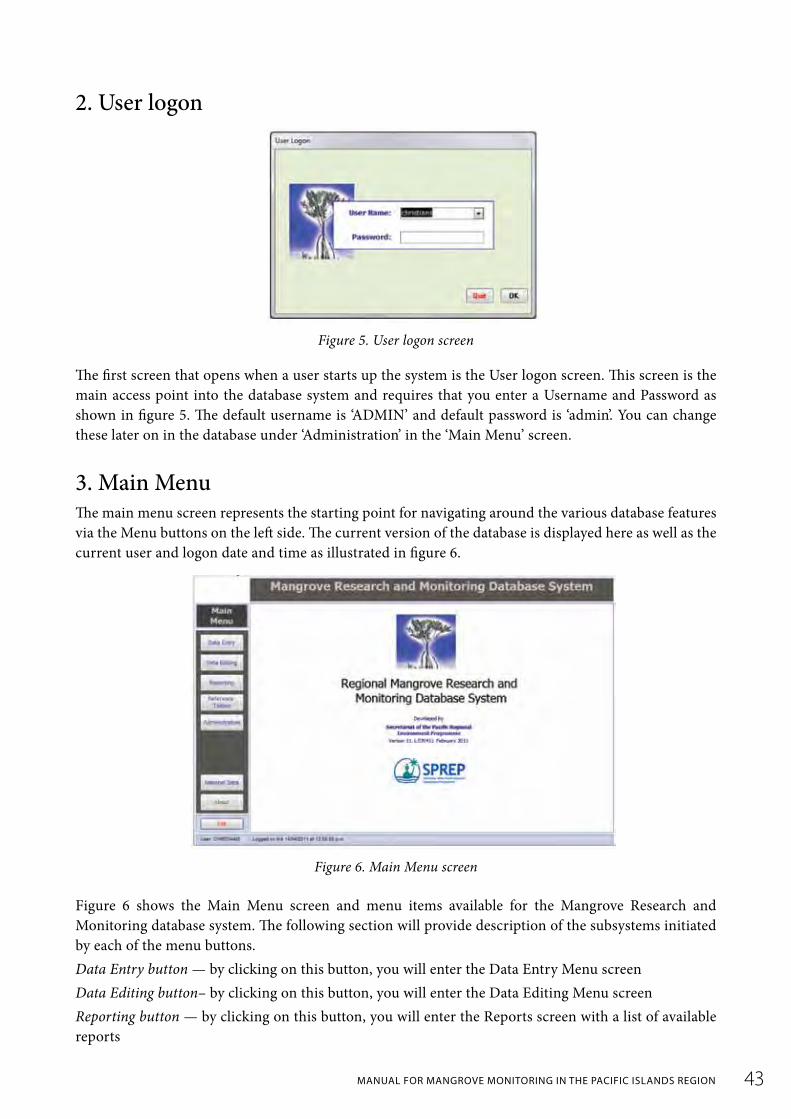
2. user logon
Figure 5. User logon screen
The first screen that opens when a user starts up the system is the User logon screen. This screen is the main access point into the database system and requires that you enter a Username and Password as shown in figure 5. The default username is ‘ADMIN’ and default password is ‘admin’. You can change these later on in the database under ‘Administration’ in the ‘Main Menu’ screen.
3. Main Menu The main menu screen represents the starting point for navigating around the various database features via the Menu buttons on the left side. The current version of the database is displayed here as well as the current user and logon date and time as illustrated in figure 6.
Figure 6. Main Menu screen
Figure 6 shows the Main Menu screen and menu items available for the Mangrove Research and Monitoring database system. The following section will provide description of the subsystems initiated by each of the menu buttons. Data Entry button — by clicking on this button, you will enter the Data Entry Menu screen Data Editing button– by clicking on this button, you will enter the Data Editing Menu screen Reporting button — by clicking on this button, you will enter the Reports screen with a list of available reports

44 Manual for Mangrove Monitoring in the Pacific islands region
Reference Tables button — by clicking on this button, the screen with a list of available reference tables will be opened. Before entering data into the database, you will need to ensure the reference tables have the required information for user selections during data entry such as country, locality and site. Administration button — by clicking on this button, you will access the administration screen for managing database users and for printing datasheets. Only users in the Administrators group can add/delete database users. National Data button — by clicking on this button, you will enter the National Mangrove Data Summary screen which lists all the national data for the country you had selected as the default for the database system. Refer to the Data Entry menu Screen. Exit button — by clicking on this button, the database system will close. Before entering information into the database, there are a few things you need to keep in mind. First, go through the reference table to make sure all values for user selection has been entered. You can access the reference tables by clicking on the Reference tables menu option. Second, you need to set the country and national mangrove area you will be working with. This is set in the Data Entry Menu screen.
4. national data summary screen
Figure 7. National Data List Screen
The selection of National Data button on the ‘Main Menu’ will take you to the National data List screen as shown in figure 7. The national data displayed pertains to the country you had set in the data entry screen (refer to the section on Data Entry Menu screen) In the National data list screen you will be able to; ■ Select ‘New’ button to add a new national data record on a mangrove area. When you select this
option you will be directed to the National Data Details screen (seen in figure 8) where you will be able to add details to populate the national data detail fields;
■ View/Modify existing national data from the list by selecting a ‘mangrove area name’ on the national data list and then click on ‘Edit’ button to view Details as shown in figure 8 below;
■ Delete a record on national data from the list by selecting the ‘delete’ button.

45Manual for Mangrove Monitoring in the Pacific islands region
new/edItIng natIonal data
Figure 8. National Data Details Screen
When you have completed working on the National data details screen select the ‘exit to main menu’ button in figure 8 to return to the main menu.
5. data entry Menu screen
Figure 9. Data Entry Menu Screen
As stated earlier, before entering transect data, you need to set the country whose data sets you will be working with or entering as well as the national mangrove area as shown in the figure below.
Figure 10. Setting Country and National Data

46 Manual for Mangrove Monitoring in the Pacific islands region
6. entering level 1 Monitoring data With your data sheets on hand, you can now start entering your site information. Click on Transect Survey button on the left menu. The following Transect based Survey screen will appear
Figure 11. Transect data entry screen
Figure 12. Plot Data List Screen
Note at the top of the screen are displayed the country and mangrove area you selected. The Transect Survey screen consists of 2 parts, the top part (figure 11) of the screen are input fields for the Transect data and the bottom part (figure 12) are input fields for capturing Plot data. Please complete the transect data before entering the plot data. Simply Tab through the input fields and enter the data. Note input fields that are Multi-select lists are not accessible. You can add/update the values only by selecting the
button next to the input field/
textbox.
47Manual for Mangrove Monitoring in the Pacific islands region
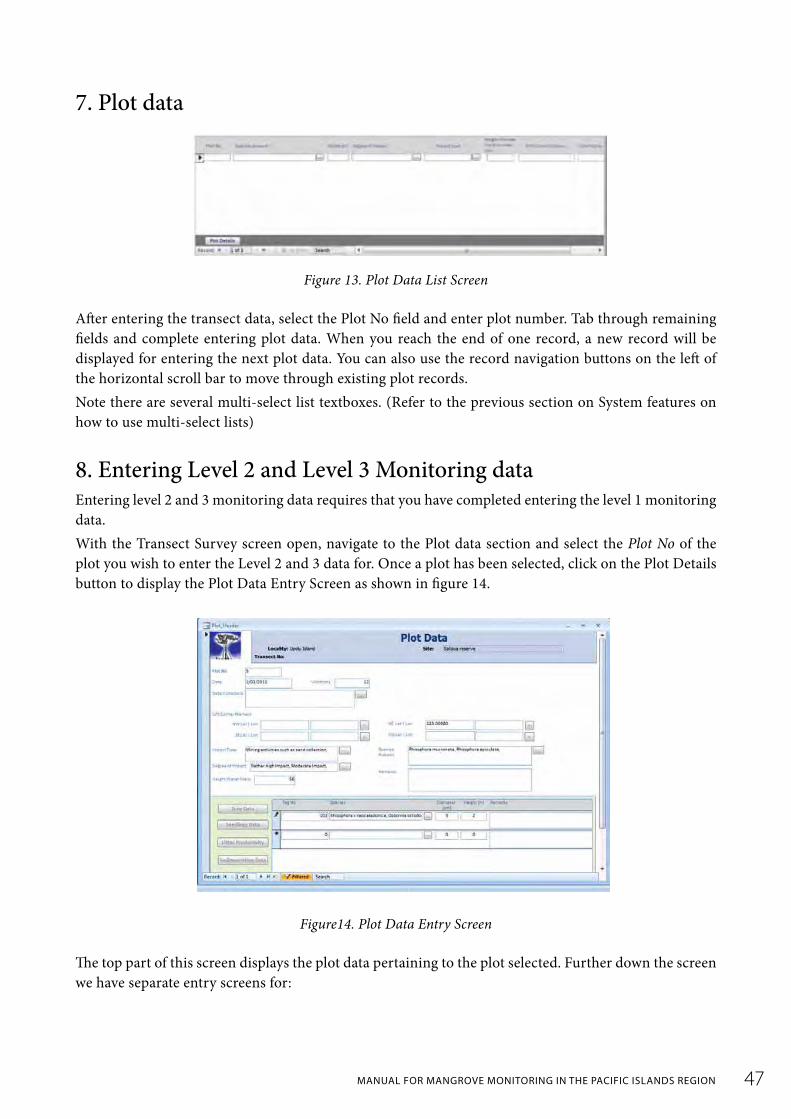
7. plot data
Figure 13. Plot Data List Screen
After entering the transect data, select the Plot No field and enter plot number. Tab through remaining fields and complete entering plot data. When you reach the end of one record, a new record will be displayed for entering the next plot data. You can also use the record navigation buttons on the left of the horizontal scroll bar to move through existing plot records. Note there are several multi-select list textboxes. (Refer to the previous section on System features on how to use multi-select lists)
8. entering level 2 and level 3 Monitoring data Entering level 2 and 3 monitoring data requires that you have completed entering the level 1 monitoring data. With the Transect Survey screen open, navigate to the Plot data section and select the Plot No of the plot you wish to enter the Level 2 and 3 data for. Once a plot has been selected, click on the Plot Details button to display the Plot Data Entry Screen as shown in figure 14.
Figure14. Plot Data Entry Screen
The top part of this screen displays the plot data pertaining to the plot selected. Further down the screen we have separate entry screens for:

48 Manual for Mangrove Monitoring in the Pacific islands region
Level 2 data–tree and sapling data
Level 3 data–litter productivity and sedimentation data
Figure 15. Level 2 and 3 menu options
The entry screen displayed on the right of the above menu will change according to the menu item selected. E.g. Clicking on the Litter productivity button will display the screen for entering litter data, clicking on the Sedimentation data button will change the screen to display sedimentation input fields.
9. data editing Menu screen Access to editing existing records in the database is through this menu screen.
Figure 16. Data Editing Menu Screen
Selecting Transect by Site menu option on the left will display the following screen
Figure 17. Transect Data List Screen
First select the country, locality and then the site to filter the information to be displayed in the results table below. From the image above, the results table is displaying all the transect records entered for country SAMOA located on the Island UPOLU at site SATAOA RESERvE.

49Manual for Mangrove Monitoring in the Pacific islands region
Figure 18. Transect List Screen
Next, select the Transect record to edit and click on the Edit button. The transect based survey screen will appear displaying the record selected for editing as shown below
Figure 19. Transect Data Edit Screen
After making changes to the record, click on the Save / Exit button to save and exit the record.
10. reporting screen The reporting module currently displays sample reports in the system. Reports can be created and added to the list as needed as well as parameters for filtering report data.
Figure 20. Reports List Screen

50 Manual for Mangrove Monitoring in the Pacific islands region
11. reference tables screen
Figure 21. Reference tables Screen
Reference tables are used in the database system to store common data values to populate list boxes and data entry selections to minimize data entry and input errors. The administrator can add/delete values in the reference tables as needed. ■ Agency ■ Degree of Impact ■ Map Format ■ Map Method ■ Species ■ Country/Locality/Site ■ Impact Types ■ Protection Status ■ Recorders/Personnel ■ Tenure
NOTE: All Country, locality and site information must be entered under the reference tables section before data is entered into the Mangrove Research and Monitoring database system. Access to Sites and localities reference tables are also provided from the Transects Entry Screen.

51Manual for Mangrove Monitoring in the Pacific islands region
12. administration screen
Figure 22. Administration Screen
user adMInIstratIon
The Mangrove Research and Monitoring database system is set up with various user access levels to avoid unnecessary alteration of data held within the database system. Users can be assigned to one of these User access levels – viewer, Data Entry Operator, Manager and Administrator. The Administrator group has full access to the database system.
Figure 23. User Profile list

52 Manual for Mangrove Monitoring in the Pacific islands region
prInt data collectIon forMs
The System also provides the facility to print datasheets or data collection forms for entering data out in the field. Forms can be created and added to the system as needed.
Figure 24. Data Collection forms
NOTE: for further information on the database please contact [email protected]
AcronymsAusAID Australian Agency for International Development
GIS Geographical Information System
GPS Global Positioning System
IPCC Intergovernmental Panel on Climate Change
KML Keyhole Markup Language file
MPA Marine Protected Area
SPREP Secretariat of the Pacific Regional Environment Programme
TEMPP Tonga Environment and Management Planning Project

FRENCH
POLYNESIA
GUAM
NEWCALEDONIA
AU S T R A L I A
NEW ZEALAND
AMERICANSAMOA
NORTHERNMARIANAISLANDS
WALLIS AND
FUTUNA
HAWAII
Tasman
Sea
ArafuraSea
Philippine
Sea
Coral
Sea
SolomonSea
BismarckSea
COOKISLANDS
PALAU
FEDERATED STATES OF MICRONESIA
MARSHALL ISLANDS
NAURUPAPUA NEW GUINEA
SOLOMON ISLANDS TUVALU
VANUATU
NIUE
TOKELAU
TONGA
SAMOA
KIRIBATI KIRIBATIKIRIBATIKIRIBATIA
FIJI
Secretariat of the Pacific Regional Environment Programme
PO BOX 240 Apia, Samoa
E: [email protected] T: +685 21 929 F: +685 20 231
W: www.sprep.org

Manual for Mangrove Monitoring in the Pacific Islands Region