manufacturing circle bulletin quarterly review second quarter 2012 presentation for manufacturing...
TRANSCRIPT
Manufacturing Circle Bulletin Quarterly ReviewManufacturing Circle Bulletin Quarterly ReviewSecond Quarter 2012Second Quarter 2012
Presentation for
Manufacturing Circle
16 August 2012
by
Dr Iraj AbedianPAN-AFRICAN INVESTMENT & RESEARCH SERVICES (PTY) LTD.

Slide # 2
OutlineOutline
1. Introduction
2. Overall Manufacturing Business Confidence
3. SA Manufacturing Environment in Q2- 2012
4. Survey Results for Q2-2012
5. Rethinking Monetary Policy in the Wake of the Financial Crisis
6. Concluding Remarks

IntroductionIntroduction

Slide # 4
Profile of RespondentsProfile of RespondentsA Total of 67 (previously 49) Participating Firms in Q2 2012

Manufacturing Business ConfidenceManufacturing Business Confidence

Slide # 6
Second Quarter 2012 Manufacturing ConditionsSecond Quarter 2012 Manufacturing ConditionsMostly Fragile / weak Environment in Q2 2012 Compared to Stable Conditions in Q1 2012

South African Manufacturing Environment in South African Manufacturing Environment in Q2 2012Q2 2012

Slide # 8
Kagiso Purchasing Managers Index Quarterly Average Kagiso Purchasing Managers Index Quarterly Average Overall weaker Conditions in Q2 2012
Source: Bureau for Economic Research
•Except for “inventories”, drop in all other component indices from Q1 2012 to Q2 2012
•Manufacturing Jobs under strain in Q2 2012
DATE PMI*BUSINESS ACTIVITY
NEW SALE
S
BACKLOG OF
ORDER SALES
INVENTORIES
PURCHASING COMMITMEN
TS
SUPPLIERS' PERFORMAN
CE
PRICES
EMPLOYMENT
EXPECTED
BUSINESS CONDITIO
NS
Q1 2012 55.4 58.9 60.6 41.5 53.1 50.3 52.0 76.7 47.0 64.6
Q2 2012 51.8 53.6 51.0 40.8 57.8 49.3 49.2 69.9 49.5 57.5

Slide # 9
Manufacturing Production Q2 2012Manufacturing Production Q2 2012
Source: Statistics South Africa
Manufacturing DivisionWeights
2005
Q/Q Seasonally Adjusted % Growth
Food & beverages 15.4 1.4Textiles, clothing, leather & footwear 4.9 -0.2Wood, paper, publishing & printing products 10.2 -4.8Petroleum, chemical & rubber products 22.1 1.7Glass & non-metallic mineral products 4.8 -1.2Basic iron & steel, non-ferrous metal products & machinery 22.9 -6.2Electrical machinery 2.5 4.5Radio, tv communication apparatus & professional equipment 1.1 -0.7Motor vehicle parts & accessories and other transport equipment 10.9 5.8Furniture & other manufacturing division 5.2 4.6
Total 100.0 -0.2

Slide # 10
Quarterly Manufacturing EmploymentQuarterly Manufacturing Employment44,000 Manufacturing Jobs Lost in Q2 2012
Source: Statistics South Africa
Summary of Q2 -2012 Survey ResultsSummary of Q2 -2012 Survey Results

Slide # 12
Demand ConditionsDemand ConditionsQ2 2012Domestic Sales Outperformed Export Sales but losing momentum

Slide # 13
Supply ConditionsSupply ConditionsInput Costs Remained Elevated in Q2 2012
Slide # 14
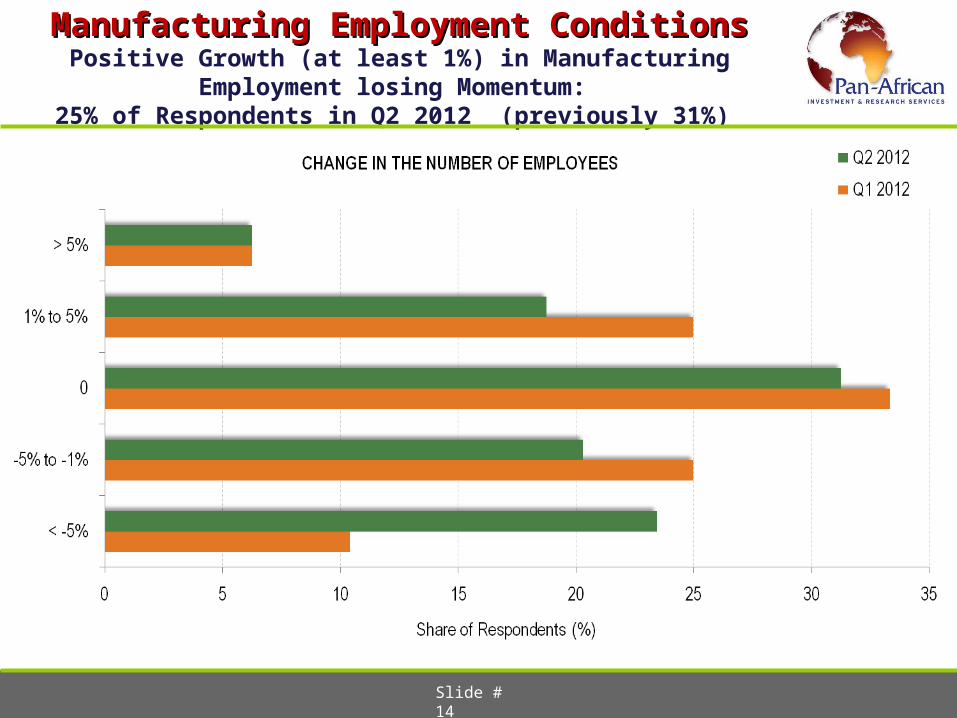
Manufacturing Employment ConditionsManufacturing Employment ConditionsPositive Growth (at least 1%) in Manufacturing Employment losing Momentum:
25% of Respondents in Q2 2012 (previously 31%)
Slide # 15
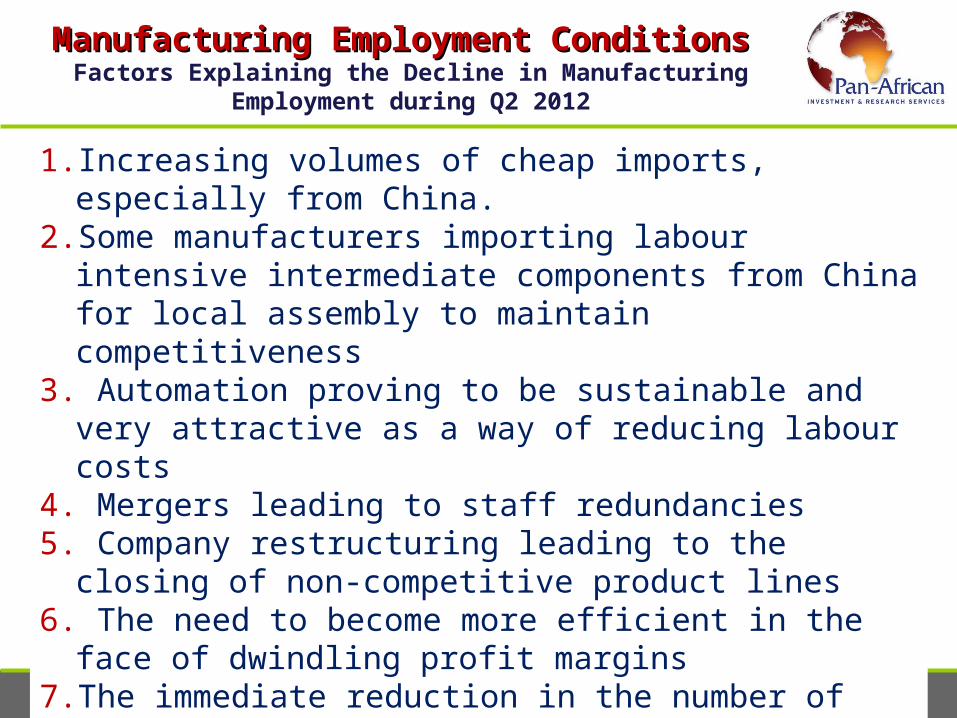
Manufacturing Employment Conditions Manufacturing Employment Conditions Factors Explaining the Decline in Manufacturing Employment during Q2 2012
1. Increasing volumes of cheap imports, especially from China.2. Some manufacturers importing labour intensive intermediate
components from China for local assembly to maintain competitiveness3. Automation proving to be sustainable and very attractive as a way of
reducing labour costs4. Mergers leading to staff redundancies5. Company restructuring leading to the closing of non-competitive product
lines6. The need to become more efficient in the face of dwindling profit
margins7. The immediate reduction in the number of contract staff as new orders
from export markets plummet

Slide # 16
Labour Productivity & Regulatory EnvironmentLabour Productivity & Regulatory Environment
Labour productivity either improved or stayed the same in Q2 2012 compared to Q1 2012
Mostly unchanged regulatory environment between Q1 2012 and Q2 2012

Slide # 17
Financial ConditionsFinancial Conditions
1. Sixty five per cent (previously 40 per cent) of surveyed firms reported
positive changes in their operating profit during Q2 -2012
2. Q2- 2012 had a more deleveraged environment compared to Q1- 2012
(58 per cent of respondents (previously 62 per cent) registered a debt to
equity ratio of up to 50 per cent in Q2- 2012
3. Sixty three per cent (previously 80 per cent) of survey participants
accessed credit at lower cost (less than JIBAR +3 per cent) in Q2 -2012

Manufacturing OutlookManufacturing Outlook

Slide # 19
Short to Long-Term Manufacturing OutlookShort to Long-Term Manufacturing Outlook
According to survey respondents, factors that will affect manufacturing performance in the short to long term include:
1)Elevated input costs (electricity, fuel and labour) and a relatively strong rand ;
2)The relocation of the manufacturing of retailers’ house brands abroad (China and India);
3)The slowdown in domestic and international demand conditions as uncertainty and volatility in the global economic environment prevail;
4)The shift in the patterns of consumer spending in South Africa due to high costs ;
5)The poor performance of the mining sector.
Rethinking Monetary Policy in the Wake of the Rethinking Monetary Policy in the Wake of the Financial CrisisFinancial Crisis

Slide # 21
Global Competitiveness IndexGlobal Competitiveness IndexBRIC Competitiveness Outperforms South Africa’s Post 2008
Source: World Economic Forum
1. Declining SA competitiveness due to:
a) The Rand exchange rate
b) High input costs2. Strong currencies eroding
competitiveness in many other countries. For example:
a) Closure of steel mills in Australia due to a strong Australian dollar
b) Honda and Nissan relocating their production plants outside Japan due to an appreciating Yen

Slide # 22
Structural Change in the Global EconomyStructural Change in the Global Economy
1. More frequent recessions in the future than has been the case in the 25 years leading up
to the financial crisis (World Economic Forum);
2. The global economy to remain on a trajectory of major structural adjustment for a
protracted period;
3. New structural regime characterised by episodes of erratic patterns of capital flows to
Emerging Market Economies (EMEs);
4. EMEs currencies to sustain high volatility for as long as free floating exchange rate
regimes are followed;
5. Highly volatile currencies to impact on the ability of firms to design proper medium term
strategies and budgets

Slide # 23
Volatility of the Rand and Peer Group CurrenciesVolatility of the Rand and Peer Group Currencies
Peer Group Countries:
oArgentinaoTurkeyoHungaryoChileoPolandoMalaysiaoPhilippinesoMexicooIsraeloUkraineoKoreaoIndonesiaoRussiaoBraziloPeruoColombiaoThailand
Implied Foreign Exchange Volatility (in per cent), South Africa vs. Peer Countries, 2005 - 2010
Source: Datastream
Slide # 24
Extra Tool For Monetary PolicyExtra Tool For Monetary Policy
1. The financial crisis has stimulated a new debate on the role of monetary
policy:
a) In advanced economies: Monetary policy should target asset prices in
addition to consumer prices.
b) In emerging and developing economies: Monetary policy should target
the exchange rate in addition to ensuring low inflation.

Slide # 25
Extra Tool For Monetary PolicyExtra Tool For Monetary Policy
2. Emerging market economies have become more vulnerable to currency volatility
because:
a) They are generally not well hedged against a currency risk;
b) A strengthening of the exchange rate may result in the loss of competitiveness of the
traded goods sector and the ensuing effect could become permanent, even if the
exchange rate subsequently returns to its previous level.
3. Foreign exchange market intervention becomes a more relevant monetary policy tool for
inflation-targeting emerging market economies relative to inflation-targeting advanced
economies.

Slide # 26
Inflation and Exchange Rate Targeting Inflation and Exchange Rate Targeting Not Mutually Exclusive
1. Policymakers should use different tools e.g. as macro-prudential regulation, capital controls, exchange rate bands, etc. to create macro-financial stability.
2. Following the financial crisis, delivering stable prices is not the only credible and appropriate target for monetary policy in emerging markets.
3. Given the effects of considerable fluctuations in the exchange rate, there is a need for two targets:
a) inflation targeting b) exchange rate targeting
4. The SARB should specifically adopt an explicit “currency band” between 8.20 and 8.60 per US$ as a “working guide” for the conduct of monetary and exchange rate policies.

Slide # 27
Inflation and Exchange Rate Targeting Inflation and Exchange Rate Targeting South Africa will be required to maintain an adequate stock of safe and liquid assets
Source: IMF
GROSS RESERVES VS. MEASURES OF ADEQUACY, SOUTH AFRICA, 2008 - 2016

Concluding RemarksConcluding Remarks
Slide # 29
Concluding RemarksConcluding Remarks
1. Despite a better overall performance in Q1 2012, manufacturing
production and business confidence remained weak during Q2 2012.
2. Following the financial crisis, the global economy is set to remain on a
trajectory of considerable structural adjustment partly characterised by
elevated EMEs currencies’ volatility.
3. Empirical global and national lessons since the financial crisis show that
refraining from using the broader array of available policy tools (including
exchange rate bands) would prove to be detrimental for economic activity,
job creation and growth sustainability.
Slide # 30
Thank you for your attentionThank you for your attention
[email protected] Tel: 011 883 8036/7Fax: 011 883 8038
Q & AQ & A