manufacturing problem solving in a job shop—research in ...€¦ · an effective and efficient...
TRANSCRIPT

Proceedings of The 2014 IAJC/ISAM Joint International Conference ISBN 978-1-60643-379-9
Manufacturing Problem Solving in a Job Shop—Research in
Layout Planning
Abdullah Sayed
Purdue University, Calumet
Lash Mapa
Purdue University, Calumet
Abstract
For ensuring efficient operation of a job shop, it is important to minimize waste, which has
no value addition to the final product. For a job shop, minimizing movement is considered as
the highest priority for waste prevention. For this reason, the layout for a job shop should be
designed in such a way to ensure the lowest possible cost for production by reducing non-
value added activities, such as movement of work-in-process. An effective and efficient way
of layout planning for a job shop is a key for solving movement inefficiencies and facilitating
communication and interaction between workers and supervisors. This involves relocation of
equipment and machinery to streamline materials flow. The primary objective of relocation is
to avoid flow conflicts, reduce process time, and increase efficiency of labor usage.
Proximity of the most frequently used machines minimizes the movement cost significantly,
which eventually minimizes the cost of production. This paper describes the research done in
process flow improvements in a job shop manufacturing steel components. The literature
focused mainly on mathematical modeling with assumptions that are not applicable for a
typical small-scale job shop operation. However, this was overcome by collecting material
movement data over three months and analyzing the information using a From-To chart. By
analyzing the chart, the actual loads between departments for the operation period were
tabulated in available plant space. From this information, the inter-departmental flow was
shown by a model. This provides the basic layout pattern, which was improved. A second
step was to determine the cost of this layout by multiplying the material handling cost by the
number of loads moved between each pair of departments. As a recommendation for solving
the problem, two layout models have been developed for ensuring the lowest movement cost.
Introduction
Transportation is considered as one of the seven wastes for lean manufacturing, and effective
layout planning is considered as a key to overcome this kind of waste. It is stated, “Double
handling and excessive movements are likely to cause damage and deterioration with the
distance of communication between processes” [1]. Therefore, layout planning has clear
impact with the quality and quantity of the final products by reducing waste and improving
efficiency.

Proceedings of The 2014 IAJC/ISAM Joint International Conference ISBN 978-1-60643-379-9
There is significant direct benefit for designing layout to improve the overall quality of
production. The main advantages are to minimize workforce, inventory, and space to ensure
quality of products exceeds customer needs. There is a positive relationship between the
effective layout planning and total cost of waste minimization. Additionally, utilizing
existing resources to produce more is the key to success for any manufacturing operation.
According to Vaidya, Shende, Ansari, and Sorte, “An efficient layout may also contribute to
the reduction in the production cycles, work-in-progress, idle times, number of bottlenecks or
material handling times and to the increase in the production output, with obvious
implications on productivity” [2].
This research examines the applicability of systematic layout planning (SLP) for job shop
layout planning that results in effective lean manufacturing and reduces transportation waste
to a minim. By using a Form-To chart, a different state of transportation cost is observed and
compared to draw a distinct picture. Future layout designs can make overall reductions in
transportation waste for a job shop operation. It reduces the per unit travel time, which
cumulatively increases overall productivity. To maximize the overall productivity utilizing
the same resources, SLP can play a critical role.
Layout Planning for Small Manufacturing
Considering increasing demand for quality production and competition in the global
marketplace, it is necessary to change production processes to deliver products on time with
higher production efficiencies. For facing the global economic downturn, it is critically
important to minimize the overall cost of production by identifying waste and providing
systematic and methodical steps to minimize it. Zhenyuan, Xiaohong, Wei, Defeng, and
Lijun stated, “The changes of production planning, technological process, production
organizational mode and material handling will all affect the facility distribution scheme of a
production line” [3].
To ensure a lean workplace, it is necessary to have an efficient layout for the production unit.
To have a clear idea regarding lean facilities, it is stated, “Lean facility layout means
arranging the physical equipment within a workshop to help the facility work in a productive
way [3]. As lean manufacturing is the key for overall efficiency for production, arranging the
layout in such a way that ensures less waste in production is essential.
Changes of machines and workstations affect the overall production situation for every
manufacturing industry. Layout planning is considered as a part of strategic planning for any
organization. Abraham and Sasikumar asserted, “Plant layout planning includes decisions
regarding the physical allocation of the economic activity centers in a facility, where an
economic activity center is any entity occupying space” [4]. Therefore, layout planning
ensures that every aspect of production and planning are synchronized. It is very costly to
have an inefficient layout. According to D. R. Sule, “Plant layout is important for two
reasons:
a). Material handling costs comprise 30-75% of total manufacturing costs and
b). Modifications or rearrangements are usually costly in terms of both time and money” [5].
Proceedings of The 2014 IAJC/ISAM Joint International Conference ISBN 978-1-60643-379-9
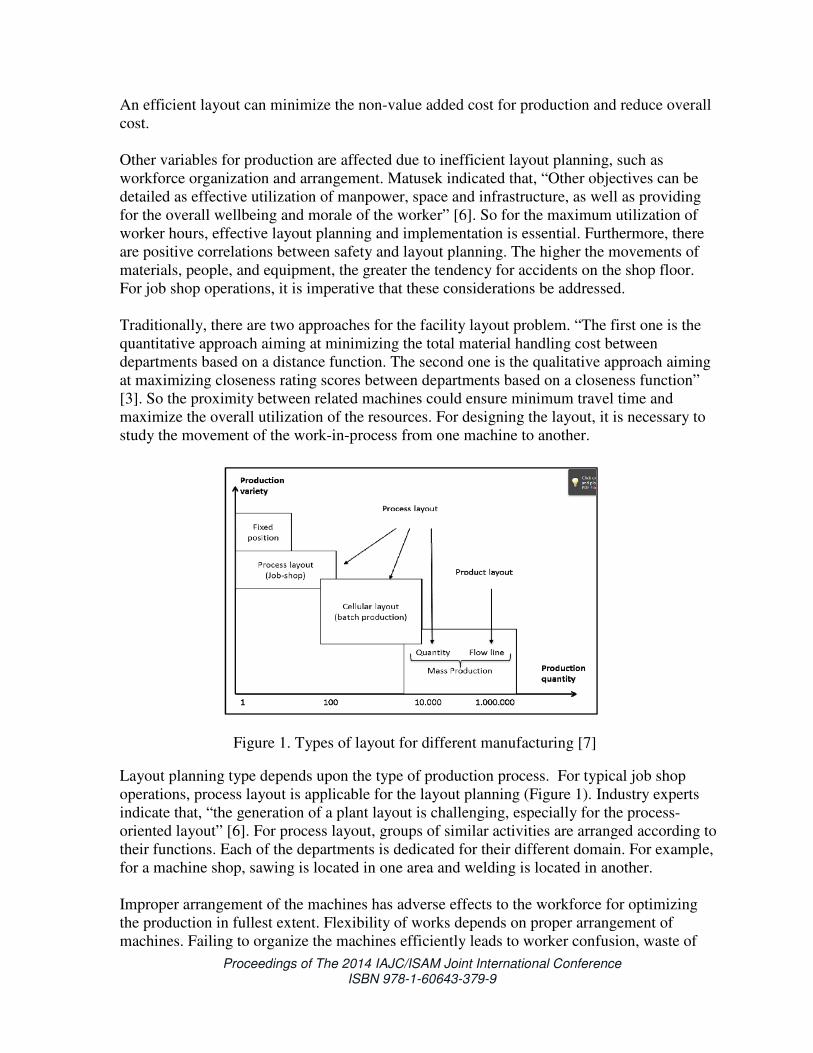
Figure 1. Types of layout for different manufacturing [7]
An efficient layout can minimize the non-value added cost for production and reduce overall
cost.
Other variables for production are affected due to inefficient layout planning, such as
workforce organization and arrangement. Matusek indicated that, “Other objectives can be
detailed as effective utilization of manpower, space and infrastructure, as well as providing
for the overall wellbeing and morale of the worker” [6]. So for the maximum utilization of
worker hours, effective layout planning and implementation is essential. Furthermore, there
are positive correlations between safety and layout planning. The higher the movements of
materials, people, and equipment, the greater the tendency for accidents on the shop floor.
For job shop operations, it is imperative that these considerations be addressed.
Traditionally, there are two approaches for the facility layout problem. “The first one is the
quantitative approach aiming at minimizing the total material handling cost between
departments based on a distance function. The second one is the qualitative approach aiming
at maximizing closeness rating scores between departments based on a closeness function”
[3]. So the proximity between related machines could ensure minimum travel time and
maximize the overall utilization of the resources. For designing the layout, it is necessary to
study the movement of the work-in-process from one machine to another.
Layout planning type depends upon the type of production process. For typical job shop
operations, process layout is applicable for the layout planning (Figure 1). Industry experts
indicate that, “the generation of a plant layout is challenging, especially for the process-
oriented layout” [6]. For process layout, groups of similar activities are arranged according to
their functions. Each of the departments is dedicated for their different domain. For example,
for a machine shop, sawing is located in one area and welding is located in another.
Improper arrangement of the machines has adverse effects to the workforce for optimizing
the production in fullest extent. Flexibility of works depends on proper arrangement of
machines. Failing to organize the machines efficiently leads to worker confusion, waste of
Proceedings of The 2014 IAJC/ISAM Joint International Conference ISBN 978-1-60643-379-9
time, and lack of standardization. According to W. Wiyaratn, and A. Watanapa, “The way to
solve these problems was to improve the steps in working and the area where they worked
through observation and fieldwork as well as proposing tools to facilitate the work to set
balance and find the standardized time” [8]. Therefore, to best use a workforce in an
organization, proper arrangement of machines is necessary.
Procedure
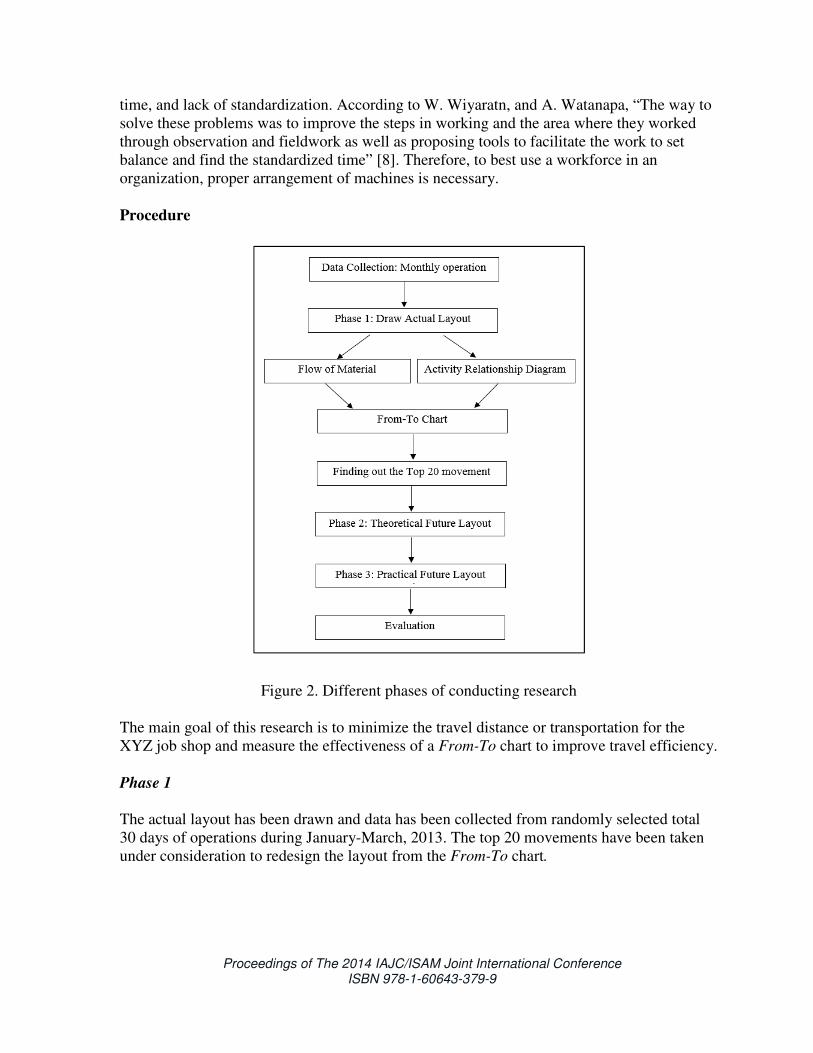
Figure 2. Different phases of conducting research
The main goal of this research is to minimize the travel distance or transportation for the
XYZ job shop and measure the effectiveness of a From-To chart to improve travel efficiency.
Phase 1
The actual layout has been drawn and data has been collected from randomly selected total
30 days of operations during January-March, 2013. The top 20 movements have been taken
under consideration to redesign the layout from the From-To chart.

Proceedings of The
Phase 2
A theoretical layout design has been drawn without considering the other variables
the cost of moving large machines
operation. This theoretical layout
distance.
Phase 3
All the related variables associated with moving the
considered strictly. It is very costly to change the po
machines. So by keeping that
have been shifted to favorable positions to get the optimum result for minimizing
transportation waste.
Data Collection
The initial data has been collected from the movement of the
shop for three months (January to March 2013)
selected via a simple random sampling
Operation day(s) without movements
were taken. Machines are renamed in a short form according to their
of the paper (Figure 3).
Figure 4 shows the number of m
(CNC 22 and VTL 23) to E (CNC 16 and 20)
Likewise, the same chart has been made for
regarding movement from machine t
from the Figure 4.
Figure
Proceedings of The 2014 IAJC/ISAM Joint International ConferenceISBN 978-1-60643-379-9
eoretical layout design has been drawn without considering the other variables
machines and workers’ flexibility to minimize travel time for the
operation. This theoretical layout creates the most efficient spacing and minimal travel
associated with moving the machines for layout designing has been
considered strictly. It is very costly to change the position of big machines, for example CNC
that in mind, only less costly moveable machines and workstations
have been shifted to favorable positions to get the optimum result for minimizing
The initial data has been collected from the movement of the work-in-process
ths (January to March 2013). For collecting data, particular dates
simple random sampling: 10 dates for movement for a particular month.
without movements were not considered, and the next randomized
taken. Machines are renamed in a short form according to their job function
shows the number of movements from machine to machine. For example, from F
(CNC 22 and VTL 23) to E (CNC 16 and 20), the number of movements is six
Likewise, the same chart has been made for February and March to organize the data
regarding movement from machine to machine. The main goal was to draw a
Figure 3. Machines in a short form
IAJC/ISAM Joint International Conference
eoretical layout design has been drawn without considering the other variables such as
to minimize travel time for the
efficient spacing and minimal travel
for layout designing has been
, for example CNC
es and workstations
have been shifted to favorable positions to get the optimum result for minimizing
rocess of XYZ job-
. For collecting data, particular dates were
ticular month.
and the next randomized dates
job function for the rest
ovements from machine to machine. For example, from F
is six for January.
to organize the data
a From-To chart

Proceedings of The
From-To Chart
A From-To chart is created to demonstrate
and to calculate the efficiency of
during January- March 2013,
(Figure 5). If the numbers were
machine to machine. Whereas, in this given diagram
A B C D E F G
A 24 4 1
B 4 1 3
C 1
D 1 1 2
E 9 2
F 2
G
H
I
J
K
L
M
N
O
P
Q
R
S
T
U
V
W
X
Y
Z
AA
AB
AC
AD
FROM
Figure 5. From
Figure 4.
Proceedings of The 2014 IAJC/ISAM Joint International ConferenceISBN 978-1-60643-379-9
to demonstrate the space relationship for manufacturing layout
o calculate the efficiency of a layout. From the movement of 30 randomly selected
, a Form- To chart was created to observe the WIP movement
If the numbers were close to diagonal of the chart, the movement was
Whereas, in this given diagram, all the numbers are scattered
H I J K L M N O P Q R S T U V
16 5 11 2 3
18 12 22 4 1 1 6 1
4 1 4 1 1
3 2 1 3 2
1
6
17 1 2 1 3 3 10 5 4
16 4 4 6 4 10 3 4
2 5
4 2 2
6 4 3 1
1
1 1
3 1
2
3
TO
From-To chart for XYZ job shop for January-March
. Movement of work in process for January 2013
IAJC/ISAM Joint International Conference
manufacturing layouts
randomly selected days
WIP movement
the movement was less from
the numbers are scattered in this
W X Y Z AA AB AC AD
2 2 5 1 1
1 2 1 2 1 1
1
2
1 1 1
1 1
1
1 1
2 3 5
1
3
2
1 1
2 3 1
ch 2013)
January 2013
Proceedings of The 2014 IAJC/ISAM Joint International Conference ISBN 978-1-60643-379-9
chart. Therefore, calculated future layout needs to be illustrated to reduce the cumulative
distance covered due to movement of WIP from machine to machine.
Assessment of the cumulative distance covered can be represented by the formula:
�������������� ������� = �����
���
�
�����
�� represents the frequency of the material handling and �� is the distance between machine
to machine. Each of the frequency and distance associated with cost.
Phase 1
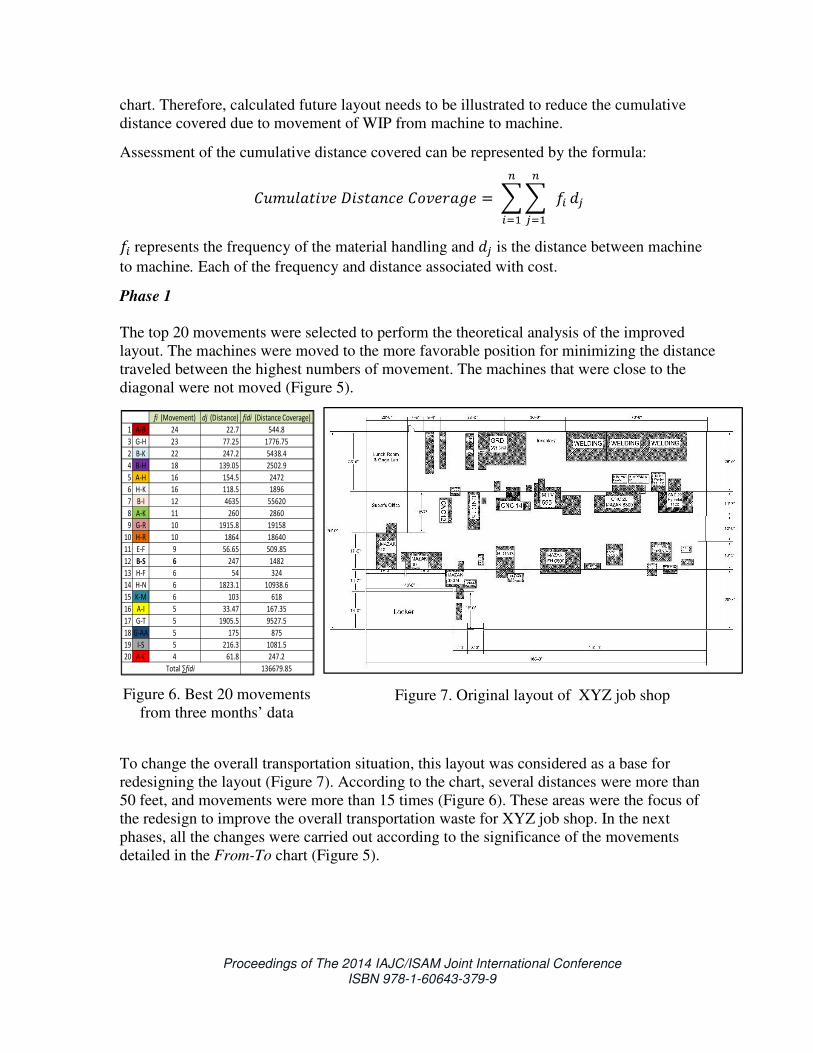
The top 20 movements were selected to perform the theoretical analysis of the improved
layout. The machines were moved to the more favorable position for minimizing the distance
traveled between the highest numbers of movement. The machines that were close to the
diagonal were not moved (Figure 5).
To change the overall transportation situation, this layout was considered as a base for
redesigning the layout (Figure 7). According to the chart, several distances were more than
50 feet, and movements were more than 15 times (Figure 6). These areas were the focus of
the redesign to improve the overall transportation waste for XYZ job shop. In the next
phases, all the changes were carried out according to the significance of the movements
detailed in the From-To chart (Figure 5).
fi (Movement) dj (Distance) fidi (Distance Coverage)
1 A-B 24 22.7 544.8
3 G-H 23 77.25 1776.75
2 B-K 22 247.2 5438.4
4 B-H 18 139.05 2502.9
5 A-H 16 154.5 2472
6 H-K 16 118.5 1896
7 B-I 12 4635 55620
8 A-K 11 260 2860
9 G-R 10 1915.8 19158
10 H-R 10 1864 18640
11 E-F 9 56.65 509.85
12 B-S 6 247 1482
13 H-F 6 54 324
14 H-N 6 1823.1 10938.6
15 K-M 6 103 618
16 A-I 5 33.47 167.35
17 G-T 5 1905.5 9527.5
18 G-AA 5 175 875
19 I-S 5 216.3 1081.5
20 A-C 4 61.8 247.2
136679.85Total ∑fidi
Figure 6. Best 20 movements
from three months’ data Figure 7. Original layout of XYZ job shop

Proceedings of The 2014 IAJC/ISAM Joint International Conference ISBN 978-1-60643-379-9
Phase 2
At this stage, machines were moved internally and externally in the layout without
considering the cost of movement and flexibility of workers. In this phase, the goal was to
reduce total distances of the top 20 movements. To accomplish this, the effected machines
were placed close to each other. According to the calculation, cumulative value of phase 2
was considered as the lowest cumulative distance coverage as possible for the current
conditions.
If the conditions (cost of movement and flexibility) remain the same, there would be a
substantial improvement of the overall transportation. By analyzing the top 20 adjusted
movements (Figure 8), the cumulative distance coverage was minimized by 95%. The reason
for this improvement of the distance coverage was due to placing the machines that had
higher movements adjacent to each other. Similarly, distances more than 50 feet and
movements exceeding 15 were taken into highest consideration for theoretical layout
planning. In this layout, highest utilization of layout space was the most important
consideration (Figure 9).
If cost of movement and flexibility remain the same, there would be a substantial
improvement of overall transportation. By analyzing the top 20 adjusted movements (Figure
8), the cumulative distance coverage was minimized by 95%. The reason for this
improvement was due to placing the machines that had higher movements adjacent to each
other. Similarly, distances more than 50 feet and more than 15 movements were taken into
consideration for theoretical layout planning. In this layout, highest utilization of space was
the most important consideration (Figure 9).
Figure 8. Top 20 movements
theoretical layout
fi (Movement) fidi (Distance Coverage) fidi (Distance Coverage)
1 A-B 24 16.09375 386.25
3 G-H 23 18.025 414.575
2 B-K 22 25.75 566.5
4 B-H 18 41.2 741.6
5 A-H 16 20.6 329.6
6 H-K 16 33.475 535.6
7 B-I 12 41.2 494.4
8 A-K 11 20.6 226.6
9 G-R 10 30.9 309
10 H-R 10 28.325 283.25
11 E-F 9 41.2 370.8
12 B-S 6 48.925 293.55
13 H-F 6 32.1875 193.125
14 H-N 6 28.325 169.95
15 K-M 6 12.875 77.25
16 A-I 5 30.9 154.5
17 G-T 5 33.475 167.375
18 G-AA 5 23.175 115.875
19 I-S 5 20.6 103
20 A-C 4 47.6375 190.55
6123.35Total ∑fidi
Figure 9. Theoretical layout, XYZ job shop

Proceedings of The 2014 IAJC/ISAM Joint International Conference ISBN 978-1-60643-379-9
Phase 3
This phase was designed for implementing the From-To chart and practicalities in the job
shop, such as cost of movement and flexibility of workers, were taken into consideration.
Practical situations, other than the travel time, included other variables as well. For that
reason, the transportation cost for WIP was higher for this phase. Two types of costs were of
highest importance for this phase: first, the cost of transportation should be compensated with
the cost of shifting the machine to a favorable position, and secondly, the machine
positioning should be flexible for the workers.
As in phase 2, in phase 3 the top 20 movements of WIP were taken into consideration to
redraw the layout (Figure 11). In this phase, the main goal was to minimize total travel time
by considering other conditions. In examining the other variables, travel distance was
increased approximately 60% in comparison with theoretical layout and 91% in comparison
with the actual layout. Shifting heavy machines was not possible in this layout. For changing
the layout positioning, workstations were prioritized rather than the heavy machines due to
the higher cost involved associated with shifting heavy machines. Fabrication workstations
were more easily moveable than lathes, mills, routers and grinders. Secondly, for positioning
machines, flexibilities of workforce were also taken under consideration. Above all, if the
practical layout is compared with original one, the overall improvement of transportation
waste is more than 91%, which is persuasive enough to accept the practical layout.
fi (Movement) fidi (Distance Coverage) fidi (Distance Coverage)
1 A-B 24 35.32 847.74
3 G-H 23 21.19 487.45
2 B-K 22 16.48 362.64
4 B-H 18 57.69 1038.48
5 A-H 16 70.64 1130.32
6 H-K 16 51.81 828.90
7 B-I 12 28.26 339.09
8 A-K 11 23.55 259.03
9 G-R 10 37.68 376.77
10 H-R 10 17.66 176.61
11 E-F 9 42.39 381.48
12 B-S 6 150.71 904.25
13 H-F 6 44.74 268.45
14 H-N 6 14.13 84.77
15 K-M 6 58.87 353.22
16 A-I 5 30.61 153.06
17 G-T 5 57.69 288.47
18 G-AA 5 94.19 470.96
19 I-S 5 167.19 835.96
20 A-C 4 49.45 197.81
9785.47Total ∑fidi
Figure 10. Top 20
movements, practical layout
Figure 11. Practical layout, XYZ job shop
Proceedings of The 2014 IAJC/ISAM Joint International Conference ISBN 978-1-60643-379-9
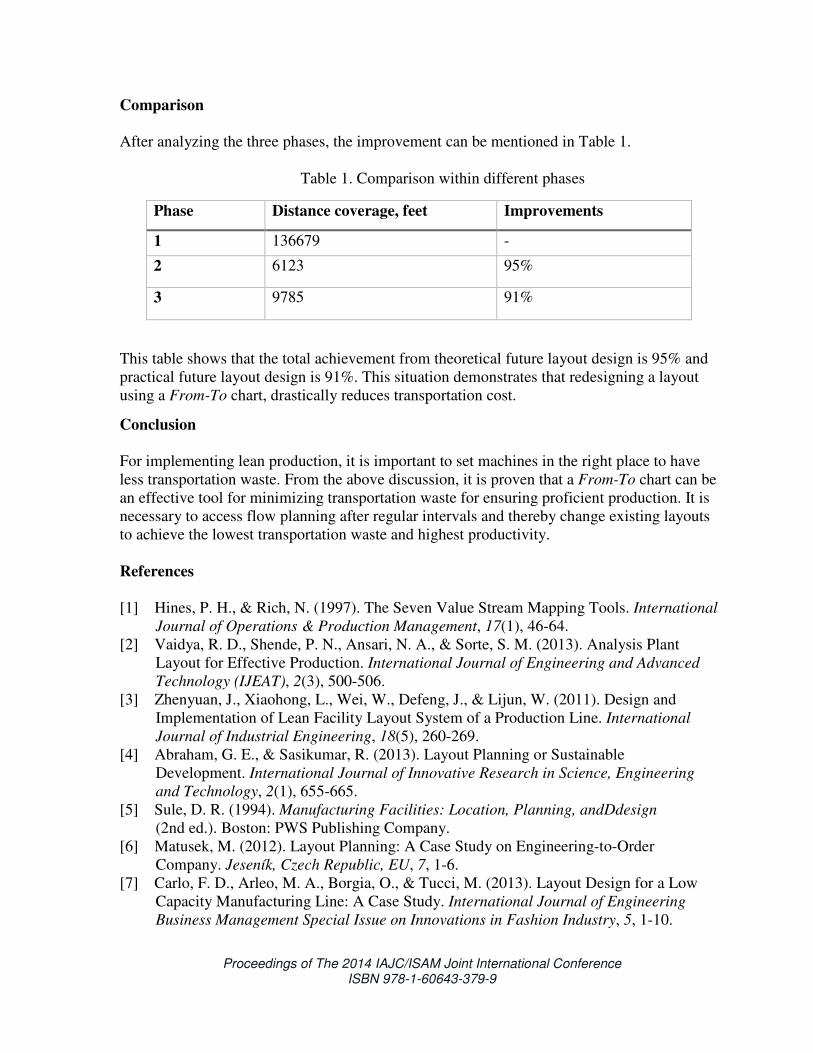
Comparison
After analyzing the three phases, the improvement can be mentioned in Table 1.
Table 1. Comparison within different phases
Phase Distance coverage, feet Improvements
1 136679 -
2 6123 95%
3 9785 91%
This table shows that the total achievement from theoretical future layout design is 95% and
practical future layout design is 91%. This situation demonstrates that redesigning a layout
using a From-To chart, drastically reduces transportation cost.
Conclusion
For implementing lean production, it is important to set machines in the right place to have
less transportation waste. From the above discussion, it is proven that a From-To chart can be
an effective tool for minimizing transportation waste for ensuring proficient production. It is
necessary to access flow planning after regular intervals and thereby change existing layouts
to achieve the lowest transportation waste and highest productivity.
References
[1] Hines, P. H., & Rich, N. (1997). The Seven Value Stream Mapping Tools. International
Journal of Operations & Production Management, 17(1), 46-64.
[2] Vaidya, R. D., Shende, P. N., Ansari, N. A., & Sorte, S. M. (2013). Analysis Plant
Layout for Effective Production. International Journal of Engineering and Advanced
Technology (IJEAT), 2(3), 500-506.
[3] Zhenyuan, J., Xiaohong, L., Wei, W., Defeng, J., & Lijun, W. (2011). Design and
Implementation of Lean Facility Layout System of a Production Line. International
Journal of Industrial Engineering, 18(5), 260-269.
[4] Abraham, G. E., & Sasikumar, R. (2013). Layout Planning or Sustainable
Development. International Journal of Innovative Research in Science, Engineering
and Technology, 2(1), 655-665.
[5] Sule, D. R. (1994). Manufacturing Facilities: Location, Planning, andDdesign
(2nd ed.). Boston: PWS Publishing Company.
[6] Matusek, M. (2012). Layout Planning: A Case Study on Engineering-to-Order
Company. Jeseník, Czech Republic, EU, 7, 1-6.
[7] Carlo, F. D., Arleo, M. A., Borgia, O., & Tucci, M. (2013). Layout Design for a Low
Capacity Manufacturing Line: A Case Study. International Journal of Engineering
Business Management Special Issue on Innovations in Fashion Industry, 5, 1-10.
Proceedings of The 2014 IAJC/ISAM Joint International Conference ISBN 978-1-60643-379-9
[8] Wiyaratn, W., Watanapa, A., & Kajondecha, P. (2013). Improvement Plant Layout
Based on Systematic Layout Planning. IACSIT International Journal of Engineering
and Technology, 5(1), 76-79.
Biographies
ABDULLAH SAYED is a graduate student in Industrial Engineering Technology at Purdue
University Calumet. He has direct experience for six years in the textile goods manufacturing
industry. He was also an instructor for organizational leadership and supervision and
business statistics. He was working as process improvement analyst for packaging industry.
He also worked for continuous improvement for medical device manufacturing industry and
steel goods manufacturing industry. Abdullah Sayed may be reached at [email protected].
LASH MAPA is a professor in Engineering Technology, with 27 years of accumulated years
of service. He has earned his Ph.D. from University of Manchester in 1980. Lash Mapa has
worked in industry as a process control engineer and quality assurance manager before
joining to Purdue University, Calumet. Moreover, he had been an engineer for off-road
vehicle components, mining and automotive. Currently, he is teaching quality management,
design of experiment, statistical process control and quality management for both graduate
and undergraduate level. He has acted as a project mentor/trainer for over thirty yellow,
green, and black belt projects in manufacturing, service, healthcare, and educational segment.
Dr. Lash Mapa may be reached at [email protected].