manungu colliery life of mine: groundwater impact … · manungu colliery, life of mine:...
TRANSCRIPT

MANUNGU COLLIERY Life of Mine:
Groundwater
Impact Assessment
DATE: Jul 2019 REVISION DRAFT2 REFERENCE: 069e(impact) COMPILED FOR: Ntshovelo Mining Resources (Pty) Ltd
No. 2 Robin Close Meyersdal, 1449
COMPILED BY: GROUNDWATER SQUARE Consulting Groundwater Specialists

MANUNGU Colliery, Life of Mine: Groundwater Impact Assessment Ref:327e DRAFT2 Jul’ 2019
GROUNDWATER SQUARE
Page i
Executive Summary
Mbuyelo Group (Pty) Ltd (Mbuyelo) Manungu Colliery is located 10km south of Delmas Town. The Phase-1 resource of the Manungu Colliery Project was originally estimated at 57 million tonnes, to be mined till 2033, through opencast methodologies, over an 18year period. The first coal was produced in July 2015. After additional geological drilling, the life-of-mine (LOM) plan was revised to include additional coal resources. Tshedza is now applying for the total 30year LOM for one opencast and two underground sections, targeting a further 68 million tonnes. A processing plant will be built to ensure the contracted qualities are always met and other markets may be explored.
The original groundwater impact study report was compiled during 2007 (Ref: FeElo/07/247, by Geo Pollution Technologies, compiled for Ferret Mining, June 2007). This groundwater study provides for 30year LOM.

MANUNGU Colliery, Life of Mine: Groundwater Impact Assessment Ref:327e DRAFT2 Jul’ 2019
GROUNDWATER SQUARE
Page ii
Table of Contents
Executive Summary ................................................................................................................................i Table of Contents ................................................................................................................................... ii 1. INTRODUCTION ............................................................................................................................ 4 1.1. Background.................................................................................................................................. 4 1.2. Life-of-Mine (LOM) Plan .............................................................................................................. 6 2. GEOGRAPHICAL SETTING .......................................................................................................... 8 2.1. Topography and Drainage ........................................................................................................... 8 2.2. Climate ......................................................................................................................................... 9 3. SCOPE OF WORK ......................................................................................................................... 9 4. METHODOLOGY.......................................................................................................................... 11 4.1. Desk Study ................................................................................................................................ 11 4.2. Hydrocensus .............................................................................................................................. 12 4.3. Geophysical Survey and Results .............................................................................................. 17 4.4. Drilling and Siting of Boreholes ................................................................................................. 22 4.5. Aquifer Testing .......................................................................................................................... 25 4.6. Sampling and Chemical Analysis .............................................................................................. 27 4.7. Groundwater Recharge Calculations ........................................................................................ 27 4.8. Groundwater Modelling ............................................................................................................. 28 4.9. Groundwater Availability Assessment ....................................................................................... 28 5. PREVAILING GROUNDWATER CONDITIONS .......................................................................... 30 5.1. Geology ..................................................................................................................................... 30 5.1.1 Regional Geology .................................................................................................................. 30 5.1.2 Local Geology ........................................................................................................................ 31 5.2. Acid Generation Capacity .......................................................................................................... 34 5.3. Hydrogeology............................................................................................................................. 35 5.3.1 Unsaturated Zone .................................................................................................................. 35 5.3.2 Saturated Zone ...................................................................................................................... 35 5.3.3 Hydraulic Conductivity ........................................................................................................... 35 5.4. Groundwater Levels .................................................................................................................. 37 5.5. Groundwater Potential Contaminants ....................................................................................... 40 5.6. Groundwater Quality .................................................................................................................. 40 6. AQUIFER CHARACTERISATION ................................................................................................ 53 6.1. Groundwater Vulnerability ......................................................................................................... 53 6.2. Aquifer Classification ................................................................................................................. 53 6.3. Aquifer Protection Classification ................................................................................................ 54 7. GROUNDWATER MODELLING ................................................................................................... 55 7.1. Software Model Choice ............................................................................................................. 55 7.2. Model Set-up and Boundaries ................................................................................................... 55 7.3. Groundwater Elevation and Gradient ........................................................................................ 56 7.4. Geometric Structure of the Model.............................................................................................. 58 7.5. Groundwater Sources and Sinks ............................................................................................... 63 7.6. Conceptual Model ...................................................................................................................... 63 7.7. Numerical Model ........................................................................................................................ 65 7.8. Results of the Model .................................................................................................................. 65 7.8.1 Pre- Mining ............................................................................................................................ 65 7.8.2 During Mining......................................................................................................................... 65 7.8.3 Post-Mining ............................................................................................................................ 69 8. GEOHYDROLOGICAL IMPACTS ................................................................................................ 76 8.1 Construction Phase ................................................................................................................... 76 8.1.1 Impacts on Groundwater Quantity ......................................................................................... 76 8.1.2 Impacts on Groundwater Quality ........................................................................................... 76 8.1.3 Groundwater Management .................................................................................................... 76 8.2 Operational Phase ..................................................................................................................... 76 8.2.1 Impacts on Groundwater Quantity ......................................................................................... 76 8.2.2 Impacts on Groundwater Quality ........................................................................................... 76 8.2.3 Impacts on Surface Water ..................................................................................................... 77 8.2.4 Groundwater Management .................................................................................................... 77

MANUNGU Colliery, Life of Mine: Groundwater Impact Assessment Ref:327e DRAFT2 Jul’ 2019
GROUNDWATER SQUARE
Page iii
8.3 Decommissioning Phase ........................................................................................................... 77 8.4 Post-mining Phase .................................................................................................................... 77 8.4.1 Groundwater Quantity ........................................................................................................... 77 8.4.2 Groundwater Quality .............................................................................................................. 78 8.4.3 Cumulative Impacts ............................................................................................................... 79 8.4.4 Groundwater Management .................................................................................................... 79 9. GROUNDWATER MONITORING SYSTEM ................................................................................ 80 9.1 Groundwater Monitoring Network .............................................................................................. 80 9.1.1 Source, Plume, Impact and Background Monitoring ............................................................. 80 9.1.2 System Response Monitoring Network ................................................................................. 80 9.1.3 Monitoring Frequency ............................................................................................................ 80 9.2 Monitoring Parameters .............................................................................................................. 81 9.3 Monitoring Boreholes ................................................................................................................. 82 10 GROUNDWATER ENVIRONMENTAL MANAGEMENT PROGRAMME ..................................... 85 10.2 Current Groundwater Conditions ............................................................................................... 85 10.3 Predicted Impacts of Mining ...................................................................................................... 85 10.4 Mitigation Measures .................................................................................................................. 85 10.4.1 Lowering of Groundwater Levels during Mining Operation ........................................................ 86 10.4.2 Rise of Groundwater Levels Post-Mining Operation .................................................................. 86 10.4.3 Spread of Groundwater Pollution Post-Mining Operation .......................................................... 86 11 POST CLOSURE MANAGEMENT PLAN .................................................................................... 88 11.2 Remediation of Physical Activity................................................................................................ 88 11.3 Remediation of Storage Facilities .............................................................................................. 88 11.4 Remediation of Environmental Impacts ..................................................................................... 89 11.5 Remediation of Water Resources Impacts ................................................................................ 89 11.6 Backfilling of the Pits ................................................................................................................. 89 12 CONCLUSIONS AND RECOMMENDATIONS ............................................................................ 90 13 ASSUMPTIONS AND LIMITATIONS ........................................................................................... 91 References ........................................................................................................................................... 93 Appendix I – Photographic Record of External Users Appendix II – Geophysical Survey Appendix III – Borehole Logs Appendix IV – Pumping Test Reports Appendix V – Groundwater Level Data Appendix VI – Groundwater Quality Data Appendix VII – Geochemical Evaluation Appendix VIII – Risk Assessment Tables

MANUNGU Colliery, Life of Mine: Groundwater Impact Assessment Ref:327e DRAFT2 Jul’ 2019
GROUNDWATER SQUARE
Page 4
1. INTRODUCTION
1.1. Background Tshedza Mining Resources (Pty) Ltd’s Manungu Colliery is located 10km south of Delmas Town. Tshedza, a subsidiary of Mbuyelo Coal (Pty) Ltd has an approved mining right (MP30/5/1/2/2/297MR) and Environmental Management Programme (EMPR), in terms of the Minerals and Petroleum Resources Development Act (Act 28 of 2002, as amended) (MPRDA), for the mining of coal at the Manungu Colliery.
The Phase-1 resource of the Manungu Colliery Project was originally estimated at 57 million tonnes, to be mined till 2033, through opencast methodologies, over an 18year period. Mining commenced in 2014 (first coal produced in July 2015). Coal production increased since the initial mining phases. By October 2017, the average production was 161ktpm for more than two years, increasing to 250ktpm by April 2018.
After additional geological drilling, the life-of-mine (LOM) plan was revised to include additional coal resources. Tshedza is now applying for the total 30year LOM for one opencast and two underground sections as indicated in Figure 1.1, targeting a further 68 million tonnes going forward. A processing plant will be built to ensure the contracted qualities are always met and other markets may be explored.
The original groundwater impact study report was compiled during 2007 (Ref: FeElo/07/247, by Geo Pollution Technologies, compiled for Ferret Mining, June 2007). The introductory sections of the impact study report provided a description of the pre-mining geohydrological environment, predicted the environmental impacts on the geohydrological regime, and designed rehabilitation measures. Importantly, the report served as an initial geohydrological evaluation of the site, and included the likely impacts of the proposed mining activity on the groundwater regime and how negative impacts should be managed.
Figure 1.1 Manungu Colliery depicted against Google Earth aerial photo backdrop

MANUNGU Colliery, Life of Mine: Groundwater Impact Assessment Ref:327e DRAFT2 Jul’ 2019
GROUNDWATER SQUARE
Page 5
Groundwater Square was approached to provide a proposal to update/upgrade the existing Manungu groundwater study, after recommendations in this regard from several consultants (environmental auditing on closure costs, water balance and water use licence consultants).
Groundwater Square recommended a completely new groundwater impact assessment, with the primary objective of studying the impact of the Manungu Phase-1 opencast on the local groundwater system, in terms of groundwater quality and groundwater levels (i.e. also studying groundwater flow and aquifer yield). After the decision in 2017 to revise the LOM plan, the groundwater study was again updated. Groundwater Square received the following appointments relating to the groundwater impact assessment of the Manungu Colliery:
• Tshedza (December 2016) – to update/upgrade the existing Manungu groundwater study; specifically, for the Phase-1 mining area; o One condition of the Phase-1 Water Use License (WUL), is the compilation of a numerical
groundwater model. Supporting studies that have already been completed around the Phase-1 mining area, were interpreted for the local aquifer characteristics and current groundwater situation; to be updated for the total 30year life of mine plan once these field studies have been completed and evaluated.
o Based on the results of the numerical groundwater model, the operational phase impacts were determined in terms of influence on surrounding groundwater levels and operational phase groundwater inflow into the Manungu Phase-1 pit. The numerical groundwater model was also utilised to assess the post-mining impact on the surrounding aquifers in terms of decant locations, volumes and groundwater quality.
• Geo Soil & Water (Pty) Ltd (May 2017) – to evaluate the deposition of discard into the Manungu pit if a coal processing plant is to be constructed;
• Environmental Impact Management Services (Pty) Ltd (EIMS) (July 2017) – to study the entire mining area; after decisions were taken by Mbuyelo Management to study the total 30year life-of-mine (LOM) (i.e. beyond the initial Phase-1, 18year mine plan);
• EIMS (July 2018)* similar to the 2017 appointment but providing for the amendment to the existing Mine Works Programme (MWP) and EMPR, through a MPRDA Section 102 Application, and a full Environmental Impact Assessment (EIA) for the newly proposed planned LOM.
* This Section 102 application is supported by an application for environmental authorisation (EA) and waste
management license (WML) as applicable. A new integrated water use license application (IWULA) for the relevant water use triggers associated with the proposed current and future planned mine will also be undertaken as well as any other public participation and regulatory approval requirements is complied with.

MANUNGU Colliery, Life of Mine: Groundwater Impact Assessment Ref:327e DRAFT2 Jul’ 2019
GROUNDWATER SQUARE
Page 6
1.2. Life-of-Mine (LOM) Plan Manungu Colliery’s 30year LOM plan is indicated in Figure 1.2, targeting 68 million tonnes, at a production rate of ±275ktpm going forward. The Seam-2 coal will be the primary target due to its economic thickness and quality (Denner, 2018). The top portion of the Seam-2 is typically of a poor coal quality with interbedded shales.
Figure 1.3 depicts the layout of the Coal Processing Wash Plant, which will be constructed to ensure that the contracted qualities are met. The Wash Plant will be located in the current coal handling area between the mining offices and the pollution control dam. Because the Wash Plant will include a filter press, there will not be any slurry to dispose. However, discard will be generated, which will have to be backfilled into the pit.
Figure 1.2 Manungu Colliery mine schedule (opencast and underground) indicating the
30year LOM extension areas

MANUNGU Colliery, Life of Mine: Groundwater Impact Assessment Ref:327e DRAFT2 Jul’ 2019
GROUNDWATER SQUARE
Page 7
Figure 1.3 Concept design of Plant (Ref: BEAL, 2018)

MANUNGU Colliery, Life of Mine: Groundwater Impact Assessment Ref:327e DRAFT2 Jul’ 2019
GROUNDWATER SQUARE
Page 8
2. GEOGRAPHICAL SETTING
2.1. Topography and Drainage As can be seen in Figures 1.2 and 2.1, the topographical elevations in the local surrounding range 65m from the highest lying ground (1615mamsl) to the lowest elevations (1550mamsl) at the confluence of the two non-perennial streams which flank the Manungu coal resource.
The highest elevation (1612mamsl) in the opencast mining area is in the south, and the lowest along the north-western, and north-eastern corners (1579mamsl = decant elevation); ranging 36m.
The average topographical slope in the mining area is 2.5%; with smaller gradients of <1% observed in the northern part of the Phase-1 mining area. Steeper gradients exceeding 6% exist to the west and east. Interestingly, very shallow gradients exist along the floodplains which are associated with the local rivers.
Figure 2.1 Thematic depiction of regional surface topography

MANUNGU Colliery, Life of Mine: Groundwater Impact Assessment Ref:327e DRAFT2 Jul’ 2019
GROUNDWATER SQUARE
Page 9
Two north-flowing non-perennial streams flank the Manungu Colliery to the west (nearest point adjacent to pit, <30m) and east (nearest points at 100m distance for smaller branch of stream and 250m for larger branch of stream). These two streams confluence 2km north of Manungu and then confluence 7km to the north, directly east of Delmas Town, with another non-perennial stream which joins from the west. Eventually, these streams join the Bronkhorstspruit River approximately 14km north of Manungu Colliery.
No upstream areas have been impacted by coal mining activities, but mining is currently underway 3km northwest (Kangala Colliery), and 5km northeast (Exxaro, Leeuwpan Colliery).
2.2. Climate The Manungu Colliery is situated in quaternary catchments B20A (see Figure 2.1). According to the WRC (1994), this catchment has a Mean Annual Precipitation (MAP) of 661mm/a. It is bounded by quaternary catchments B20B (north, MAP=663mm/a), C21E (west, MAP=691mm/a) and C21A (south, MAP=674).
A MAP of 700mm/a applied to all relevant calculations in this study.
According to the WRC (1994), the mean annual evaporation varies between 1600mm/a and 1700mm/a.
3. SCOPE OF WORK The following scope of work summarises the appointments by Groundwater Square to perform the Manungu groundwater impact assessments during the various phases of groundwater work between 2015 and 2018:
• Attend start-up meetings, site visits and workshops; • Desktop study, generate baseline infrastructure information and maps; • Collect data relevant to the study, including:
o Geology; o Geometry (XYZ) of coal seam floors; o Current and LOM mine layouts; o Relevant site information from visual inspection and discussions;
• Collect field data: o Perform geophysical surveys (during two phases), in addition to Mine aeromagnetic survey
(magnetic, gravity and resistivity to investigate the occurrence of dykes and preferential flow zones/cavities in critical areas);
o Drill hydrogeological boreholes (based on mine plan, geophysics, structural geology and potential impacts) during two phases: ▪ 8x “deep” boreholes (86 to 175m deep); ▪ 10x “medium” boreholes (26m to 35m deep); ▪ 6x “shallow” boreholes (6m to 10m deep), associated with certain “medium” or “deep”
boreholes; o Perform EC profiling on borehole water columns; o Perform water sampling of boreholes, springs, surface water and private boreholes; o Perform aquifer and borehole hydraulic testing:
▪ Slug-tests on all newly drilled boreholes (surrounding boreholes might be included); ▪ A combination of yield tests, step-tests and long-term tests on a selection of borehole(s);
o Laboratory analysis of sampled water: ▪ Minimum pH, EC, TDS, Ca, Mg, Na, K, Cl, SO4, NO3, T.Alk, Si, F, Al, Fe, Mn;
• Evaluate data in the context of geological information provided by the mine: o Computerise/analyse/interpret field test data; o Interpret/describe aquifer conditions and hydraulic attributes;
• Review project objectives and modelling scenarios, and discuss with Mine Management; • Geochemical assessment for opencast operation and Wash Plant:
o Analyse client database of mineralogical and elemental composition of the rock/coal material; o Perform laboratory analysis on core/pulp/drill samples for e.g. ABA/XRD/XRF/NAG/%S; o Determine the potential for acidic mine drainage over the long term; o Specifically evaluate the option of placing discard from the planned Wash Plant back into the
pit; o Perform oxygen diffusion and geochemical trend numerical modelling to determine the expected
variations in mine water quality:

MANUNGU Colliery, Life of Mine: Groundwater Impact Assessment Ref:327e DRAFT2 Jul’ 2019
GROUNDWATER SQUARE
Page 10
▪ During mining; ▪ Post-mining;
• Perform groundwater modelling assessment: o Compile conceptual model; o Compile and calibrate detailed numerical 3D model(s) to quantify/assess impacts; o Incorporate geochemical assessment data in numerical models, to enable prediction of
contaminant movement; • Groundwater impact calculations:
o Identify/describe/calculate impacts on the groundwater environment through analytical equations and numerical modelling;
o Propose mitigation/management measures; o Identify data gaps and focus areas for additional research if required;
• Provide guidance on: o Water monitoring; o Mitigation measures;
• Interact with project team and provide feedback; • Compile report.
A waste classification study was compiled by another consultant.
Disclaimer – The current state of hydrogeological knowledge was presented as accurately as possible using available information and new information generated during the exploration and groundwater data gathering phases. Groundwater Square exercised due care and diligence in gathering and evaluating relevant information. Groundwater Square will not accept any liability in the event of encountering unexpected aquifer conditions during mining or additional groundwater studies. Any unauthorized dissemination or reuse of the groundwater specialist impact assessment report will be at the user's sole risk and with the condition that Groundwater Square will not accept any liability for any and all claims for losses or damages and expenses arising out of or resulting from such unauthorized disclosure or reuse.

MANUNGU Colliery, Life of Mine: Groundwater Impact Assessment Ref:327e DRAFT2 Jul’ 2019
GROUNDWATER SQUARE
Page 11
4. METHODOLOGY The groundwater impact assessment relied primarily on numerical groundwater modelling, supplemented by spreadsheet calculations, geochemical laboratory testing and modelling. The basis of these assessments were field studies consisting of the original 2007 hydro-census, the 2017 hydro-census revisit, various geophysical surveys, two phases of hydrogeological drilling, geochemical sampling/analyses/modelling, various aquifer test, including falling head tests, slug tests and pump testing, as well as groundwater monitoring.
Assessments were continually upgrade with the new geological information and mine designs.
4.1. Desk Study This desk study, apart from the recent Phase-1 “Manungu Colliery WUL Commitment – Groundwater Model” study (Ref: GW2_327b_Manungu, August 2017), also incorporated assessment of the following studies:
• The original groundwater impact study report was compiled during 2007 (Ref: FeElo/07/247, by Geo Pollution Technologies, compiled for Ferret Mining, June 2007);
• Denner E. J, De Villiers E. Gemecs, 19 June 2015. “Manungu Competent Persons Resource & Reserve Report”. Project No: GMXP14060;
• Brummer K, Campbell G, Mutobo K. “Interpretation of high resolution aeromagnetic and radiometric survey data over the Welgevonden and Weilaagte prospect area, Mpumalaga Province.” On behalf of Tshedza Mining Resources (Pty) Ltd. GAP Geophysics, August 2014;
• Letsolo Water and Environmental Services cc, June 2017 “Tshedza Mining Resources (Pty) Ltd – Manungu - Manungu Colliery Water and Salt Balance”, Ref: LWES 409;
• Digby Wells & Associates, November 2009. “Wolvenfontein - Kangala: Hydrologeogical Investigation Report”;
• Meyer R, March 2010. “Hydrogeology of Groundwater Region 10: The Karst Belt (WRC Project No. K5/1916)”. WRC Report No. TT 553/14;
• Button, A., 1969, "Stratigraphic Analyses of the Transvaal Sequences in the Irene-Delmas-Devon Area, Transvaal", Economic Geology Research Unit, Univ. Witwatersrand, Johannesburg, Information Circular No.51, February 1969;
• Button, A., 1970, "Subsurface Stratigraphic Mapping of the Witwatersrand Sequences in the Irene-Delmas-Devon Area, Transvaal", Economic Geology Research Unit, Univ. Witwatersrand, Johannesburg, Information Circular No.59, October 1970;
• Werdmuller V.W, Pretorius D. A, Poulos D.J, Hansen L. C, 1990, "A Partial Listing of Witwatersrand Boreholes", Economic Geology Research Unit, Univ. Witwatersrand, Johannesburg, Information Circular No.225, October 1990;
• The 2017 updated Gemecs geological model.

MANUNGU Colliery, Life of Mine: Groundwater Impact Assessment Ref:327e DRAFT2 Jul’ 2019
GROUNDWATER SQUARE
Page 12
4.2. Hydrocensus The 2007 hydrocensus, within a 1km radius of the larger Manungu reserve area across Weilaagte 271 IR and Welgevonden 272 IR, performed by Geo Pollution Technologies as part of the original groundwater impact study was revisited and updated during March 2017 (Manungu Phase-1 groundwater study). All hydrocensus information is summarised in Tables 4.1A-D.
Table 4.1A Hydrocensus - Owner Information
Map Nr Name of Owner Contact Person Phone Numbers
Farm Name Farm
Number
MBH1 Tshedza Mining Resources Pty Ltd Manungu Coal Mine 013 648 8934 Weilaagte 271/9
MBH2 Tshedza Mining Resources Pty Ltd Manungu Coal Mine 013 648 8934 Weilaagte 271/9
MBH3 Tshedza Mining Resources Pty Ltd Manungu Coal Mine 013 648 8934 Weilaagte 271/7
MBH4 Tshedza Mining Resources Pty Ltd Manungu Coal Mine 013 648 8934 Weilaagte 271/7
MBH4R Tshedza Mining Resources Pty Ltd Manungu Coal Mine 013 648 8934 Weilaagte 271/7
MBH6 J Z Moolman Boerdery CC Jurgens 083 327 4914 Weilaagte 271/10
MBH7 Werda Handel Pty Ltd Jurgens 083 327 4914 Weilaagte 271/11
MBH8 Werda Handel Pty Ltd Jurgens 083 327 4914 Weilaagte 271/11
MBH9 J Z Moolman Boerdery CC Jurgens 083 327 4914 Weilaagte 271/10
MBH10 J Z Moolman Boerdery CC Jurgens 083 327 4914 Weilaagte 271/10
MBH11 Werda Handel Pty Ltd Jurgens 083 327 4914 Weilaagte 271/11
MBH12 Cowenburg Boerdery CC Louis 083 676 1164 Welgevonden 272/4
MBH13 Lategan Hendrik Daniel Hennie 083 711 1261 Welgevonden 272/8
MBH14 Unknown Goede Hoop 290/1
MBH15 Kallie Madel Trust Martinus 060 868 4594 Weilaagte 271/2
MBH16 Cowenburg Boerdery CC Francois 083 676 1158 Welgevonden 272/11
MBH17 Koos Uys & Seun Boerdery Koos Uys 082 316 3151 Weilaagte 271/4
MBH18 Liplek Kuikens Pty Ltd Kobus Oelofse 082 787 1789 Weilaagte 271/12
MBH18B Liplek Kuikens Pty Ltd Kobus Oelofse 082 787 1789 Weilaagte 271/12
MBH19 Tshedza Mining Resources Pty Ltd Kobus Oelofse 0827871789 Weilaagte 271/8
MBH20 Louis Rossouw Louis Rossouw 0727398176 Leeuwpan 246
MBH20A Louis Rossouw Louis Rossouw 0727398177 Leeuwpan 246
MBH20B Louis Rossouw Louis Rossouw 0727398178 Leeuwpan 246
MBH21 Louis Rossouw Louis Rossouw 0727398178 Leeuwpan 246
MBH22 Leeuwpan 246/2
MBH23 Hannes Potgieter Shaun 078 290 1666 Vlakplaas 268/1
MBH24 Morgan Beef Goede Hoop 290/4
MBH25 Ernst Ernst 071 472 0676 Puntstaan 289
MBH26 Syferfontein 288/11
MBH27 Rappard Frans Johannes Gustaf Rappard 083 226 1882 Syferfontein 288/4
MBH28 Rappard Frans Johannes Gustaf Rappard 083 226 1882 Syferfontein 288/4
MBH29 Janus Oosthuizen Janus Oosthuizen 082 445 2368 Stompiesfontein 273/35
MBH30 Philippie Phillipie 082 788 2344 Stompiesfontein 273/19
MBH31 Philippie Phillipie 082 788 2344 Stompiesfontein 273/10
MBH32 Gunter Gunter 072 116 1884 Stompiesfontein 273/3
MBH33 Gunter Gunter 072 116 1884 Stompiesfontein 273/41
MBH34 Gunter Gunter 072 116 1884 Stompiesfontein 273/41
MBH35 Andries Lategaan Andries Lategaan 083 729 4770 Welgevonden 272/9
MBH36A Reinhold Probst Reinhold Probst 072 40 20184 Welgevonden 272
MBH36B Reinhold Probst Reinhold Probst 072 402 0185 Welgevonden 272
MBH40 Gustaf Rappard Gustaf Rappard 083 226 1882 Syferfontein 288/4
MBH41 Jaco Oosterhuis Jaco Oosterhuis 083 283 2716 Wolwefontein 244/5
MBH42 Jaco Oosterhuis Jaco Oosterhuis 083 283 2716 Wolwefontein 244/5
MBH44 Louis Rossouw Louis Rossouw 072 739 8178 De Denne 256
MBH45 Philippie Phillipie 082 788 2345 Stompiesfontein 273/20
MBH46 Philippie Phillipie 082 788 2346 Stompiesfontein 273/20
MBH47 Pieter Fleischmann Pieter Fleischmann 082 924 3966 Stompiesfontein 273/26
G37016 DWS Kobus Oelofse 082 787 1790 Strydpan 243/35
G37017 DWS Strydpan 243/30
G37018 DWS Universal Coal 076 786 3739 Wolwefontein 244/1
G37030 DWS Cowenburg Boerdery CC 082 927 9596 Welgevonden 272/3
KAM01 Kangala Coal Mine Puis 076 786 3739 Wolwefontein 244/1
KAM02 Kangala Coal Mine Puis 076 786 3739 Wolwefontein 244/2
KGA14 Universal Coal Puis 076 786 3739 Wolwefontein 244/1
KGA15 Schoeman Boerdery Solomon 082 388 1009 Wolwefontein 244/2
KGA17 Oosterhuis Johannes Jocobus Jaco Oosterhuis 083 283 2716 Wolwefontein 244/4
KGA17B Oosterhuis Johannes Jocobus Jaco Oosterhuis 083 283 2716 Wolwefontein 244/4
MAN-BH1 Tshedza Mining Resources Pty Ltd Manungu Coal Mine 013 648 8934 Weilaagte 271/9
MBH48 Eloff Mining Co Pty Ltd Gehard 082 927 9596 Welgevonden 272/10
OC1 Eloff Mining Co Pty Ltd Gehard 082 927 9596 Welgevonden 272/10

MANUNGU Colliery, Life of Mine: Groundwater Impact Assessment Ref:327e DRAFT2 Jul’ 2019
GROUNDWATER SQUARE
Page 13
Table 4.1B Hydrocensus – Location information
Map Nr XCoord WGS84
(Latitude)
YCoord WGS84
(Longitude)
Elevation (mamsl)
Sit
e T
yp
e
Sit
e S
tatu
s
User
Ap
pli
cati
on
Eq
uip
men
t
MBH1 26.22456 28.69487 1578.85 Borehole In use Submersible
MBH2 26.22400 28.69508 1578.30 Borehole In use Domestic – all purposes Submersible
MBH3 26.22886 28.69595 1582.25 Borehole Unused No equipment
MBH4 26.23123 28.69703 1583.45 Borehole Unused No equipment
MBH4R 26.23156 28.69783 1583.00 Borehole In use Domestic – all purposes Submersible
MBH6 26.23880 28.73051 1605.40 Borehole In use Agricultural & domestic use Submersible
MBH7 26.24239 28.73364 1610.00 Borehole Unused
MBH8 26.24220 28.73180 1611.00 Borehole Unused
MBH9 26.24218 28.74617 1494.90 Borehole - -
MBH10 26.23940 28.73688 1609.50 Borehole Unused
MBH11 26.24150 28.73069 1608.35 Borehole Unused
MBH12 26.25900 28.69771 1587.40 Borehole In use Agricultural & domestic use Submersible
MBH13 26.27770 28.71000 1595.00 Borehole In use Domestic – all purposes Submersible
MBH14 26.26810 28.74852 1590.00 Borehole Destroyed No equipment
MBH15 26.24970 28.73188 1613.60 Borehole In use Domestic – all purposes Submersible
MBH16 26.26532 28.68764 1607.00 Borehole In use Agricultural & domestic use Submersible
MBH17 26.22436 28.70062 1567.50 Borehole In use Agricultural & domestic use Submersible
MBH18 26.24264 28.71501 1585.80 Borehole Unused No equipment
MBH18B 26.24235 28.71588 1586.43 Borehole In use Agricultural & domestic use Submersible
MBH19 26.22856 28.69684 1580.00 Borehole In use Agricultural & domestic use Submersible
MBH20 26.21252 28.74054 1602.00 Borehole In use Agricultural & domestic use Submersible
MBH20A 26.21106 28.73859 1602.00 Borehole In use Agricultural & domestic use Submersible
MBH20B 26.21290 28.73601 1589.00 Borehole In use Agricultural & domestic use Submersible
MBH21 26.21810 28.73605 1594.00 Borehole In use Agricultural & domestic use Submersible
MBH22 26.20550 28.72372 1594.00 Borehole Unused No equipment
MBH23 26.21661 28.76258 1593.00 Borehole In use Agricultural – irrigation Submersible
MBH24 26.27850 28.76117 1594.00 - - - -
MBH25 26.29482 28.72866 1613.00 Borehole In use Agricultural & domestic use Submersible
MBH26 26.29255 28.69990 1599.00 - - - -
MBH27 26.28010 28.71542 1589.00 Borehole Unused No equipment
MBH28 26.28045 28.71376 1591.00 Borehole In Use - Submersible
MBH29 26.28358 28.66032 1626.00 Borehole In use Agricultural & domestic use Submersible
MBH30 26.26790 28.64737 1620.00 Borehole In use Agricultural – stock watering Submersible
MBH31 26.26665 28.64936 1621.00 Borehole In use Domestic – all purposes Submersible
MBH32 26.23692 28.66129 1589.00 Borehole In use Agricultural & domestic use Submersible
MBH33 26.23224 28.65540 1605.00 Borehole -
MBH34 26.23465 28.65672 1603.00 Borehole -
MBH35 26.27257 28.71876 1594.50 Borehole In use Agricultural & domestic use Submersible
MBH36A 26.28398 28.68740 1604.90 Borehole In use Agricultural & domestic use Mono -type
MBH36B 26.28566 28.68692 1606.20 Borehole Unused Windmill
MBH40 26.28940 28.71273 1596.00 Borehole In use Agricultural & domestic use Submersible MBH41 26.19694 28.71645 1587.00 Borehole In use Agricultural – stock watering Submersible MBH42 26.19683 28.71343 1586.00 Borehole In use Agricultural & domestic use Submersible MBH44 26.19813 28.74189 1593.00 Borehole In use Domestic – all purposes Submersible MBH45 26.26927 28.65341 1619.00 Borehole In use Domestic – all purposes Submersible MBH46 26.27109 28.65185 1625.00 Borehole In use Agricultural – stock watering Submersible MBH47 26.27683 28.65543 1628.00 Borehole In use Agricultural & domestic use Submersible G37016 26.24934 28.63293 1628.00 Borehole Unused No equipment
G37017 26.23053 28.64877 1605.00 Borehole Unused No equipment
G37018 26.20297 28.67848 1575.00 Borehole Unused No equipment
G37030 26.25884 28.69279 1596.10 Borehole Unused No equipment
KAM01 26.19756 28.67773 1611.49 Borehole In use Industrial - mining No equipment
KAM02 26.21273 28.67163 1591.98 Borehole In use -
KGA14 26.20238 28.67720 1575.00 Borehole In use Domestic – all purposes Submersible KGA15 26.20622 28.68375 1568.00 Borehole In use Domestic – all purposes Submersible KGA17 26.20380 28.70122 1563.00 Borehole Unused Submersible KGA17B 26.20132 28.70061 1559.00 Borehole Unused Submersible MAN-BH1 26.22369 28.69895 1569.79 Borehole In use Domestic – all purposes Submersible MBH48 26.25688 28.67919 1597.00 Borehole Unused No equipment
OC1 26.25786 28.67449 1592.00 Outcrop Unused No equipment

MANUNGU Colliery, Life of Mine: Groundwater Impact Assessment Ref:327e DRAFT2 Jul’ 2019
GROUNDWATER SQUARE
Page 14
Table 4.1C Hydrocensus – Water related information
Map Nr Collar Height
(m)
Depth (m)
Date Previous
Water level (mbc)
Date Time Water level
(mbc) 2017
Reported Yield (l/s)
Sampled (Yes/No)
MBH1 0.43 74 20170322 1057 7.52 Yes
MBH2 0.00 35.7 20070530 7.00 20170322 1105 5.23 No
MBH3 40 20170322 No MBH4 20170322 8.68 0.28 No
MBH4R 100 2.50 No
MBH6 0.00 80 20070531 9.00 20170313 1500 11.55 0.28 Yes
MBH7 0.50 183 20170313 0.67 No MBH8 0.00 110 20070531 42.30 20170313 No MBH9 20170322 No MBH10 0.34 20170322 80.56 No MBH11 20070531 3.20 20170313 No MBH12 0.14 20170314 1430 56.80 0.14 Yes
MBH13 0.24 20 20070531 30.00 20170314 1248 3.88 0.11 Yes
MBH14 20070531 5.00 20170320 1400 No
MBH15 0.40 80 20070531 6.00 20170314 1600 31.43 0.28 Yes
MBH16 0.40 100 20170314 5.56 No
MBH17 0.00 80 20070531 24 20170322 1330 5.85 2.78 Yes
MBH18 80 20070531 24 20170314 730 4.17 No
MBH18B 0.19 20170314 830 28.48 0.28 Yes
MBH19 0.34 115 20070531 20 20170322 5.00 No
MBH20 0.07 30 20170315 1145 0.69 Yes
MBH20A 0.20 30 20170315 1155 0.42 Yes
MBH20B 0.10 30 20170315 1210 0.69 Yes
MBH21 60 20170315 1244 2.22 No
MBH22 0.28 85 20071206 38.13 20170315 1044 39.10 No
MBH23 0.13 240 20170322 71.74 No MBH24 20071206 10.04 20170320 No MBH25 0.21 20170320 1436 0.56 Yes
MBH26 20071206 9.35 20170320 No
MBH27 0.23 20071206 8.05 20170322 1255 6.56 Yes
MBH28 0.17 20170322 1.14 No
MBH29 0.00 20170320 1100 11.26 Yes
MBH30 0.25 100 20170320 920 0.42 No
MBH31 0.14 65 20170320 1000 0.33 Yes
MBH32 55 20071206 30.00 20170314 745 5.56 Yes
MBH33 190 20170314 730 33.33 No
MBH34 20170314 730 No
MBH35 9.00 35 20170320 1330 27.21 0.28 Yes
MBH36A 20170320 1210 0.28 Yes
MBH36B 0.19 20170320 1150 15.41 No
MBH40 0.20 30 20170314 1400 3.33 2.78 Yes
MBH41 0.29 90 20170315 850 11.20 7.50 Yes
MBH42 85 20170315 900 4.44 No
MBH44 0.00 20170315 1300 0.69 No
MBH45 0.41 65 20170320 845 9.91 0.42 Yes
MBH46 0.38 110 20170320 1007 75.75 0.42 Yes
MBH47 0.19 130 20170320 1030 12.63 3.33 Yes
G37016 0.08 171 20050309 90.00 20170314 930 60.16 3.00 No
G37017 0.38 213 20010105 52.77 20170313 1200 30.00 No
G37018 0.07 188 20050309 46.03 20170313 1005 42.24 40.00 Yes
G37030 180 19960711 35.25 20170314 1505 8.00 No
KAM01 0.47 80 20090611 11.59 20170313 1045 11.48 11.05 Yes
KAM02 60 20091026 11.2 20170313 0.45 No
KGA14 0.19 20170313 900 11.80 Yes
KGA15 0.10 20170313 1545 10.41 Yes
KGA17 0.03 90 20170315 No
KGA17B 0.21 90 20170315 No
MAN-BH1 80 20140711 15.91 20170322 0.28 No
MBH48 0.27 20170823 1145 3.72 No
OC1 20170803 No

MANUNGU Colliery, Life of Mine: Groundwater Impact Assessment Ref:327e DRAFT2 Jul’ 2019
GROUNDWATER SQUARE
Page 15
Table 4.1D Hydrocensus – Water related information
Map Nr COMMENTS: P=People; LSU=Large Stock; SSU=Small Stock; D=Dairy; G=Garden; N=Nursery
MBH1 Not linked to reservoir, ave k = 0.02885m/d, contrasting yield 2.78l/s reported during 2007 census. Low yielding.
MBH2 Mine Office supply, meter reservoir in-take 630m3, meter reservoir output 3650m3, 4 x 5000L JoJo tanks, Abs rate roughly 0.34l/s.
MBH3 Not found, possibly destroyed.
MBH4 Trollop Mining water supply, pumping at 0.26l/s, 2 x 5000L JoJo Tanks, meter reading 5229m3, pumping water level. Poor yielding capacity. Borehole replaced during November 2017.
MBH4R Drilled 27/11/2017. Replaces MBH-4, equipment moved across. Solid casing = 36m. Water strike = 81-82mbs.
MBH6 Wire Factory (Draad Trek), Feed lot occasionally up to 3000 sheep, boreholes BH7, BH8 & BH11 not in use.
MBH7 Not in use.
MBH8 Not in use.
MBH9 No access, wet road overgrown.
MBH10 Old hole, with base plate. Not in use.
MBH11 Not in use.
MBH12 Supplies 2 households.
MBH13 Supplies 1 household, Hole collapsed from 50m to 20m.
MBH14 Destroyed.
MBH15 1 Household, 9 People.
MBH16 Need Permission from MORGAN BEEF for access (Tel: 013 688 9300).
MBH17 Two households on farmstead.
MBH18 Not in use, water turned brown.
MBH18B Household use. Pumps backup water for chicken coops 5 x 20000L Tanks on standby.
MBH19 Abstraction yielding capacity down from 12,000L/hour to 3 000L/hour, pump to new chicken coups to the south.
MBH20 Sample combination of BH20, 20A, 20B.
MBH20A BH20, 20A, 20B and BH21A. P =18, LSU = 300, SSU + 500.
MBH20B
MBH21 No access, covered with heavy metal box.
MBH22 Abandoned farmhouse, open hole.
MBH23 Cosmo Farm. Pump to large irrigation dam, large diameter borehole, high yielding.
MBH24 Does not exist - Water to property is pumped from Morgan Beef (Tel: 013 688 9300).
MBH25 1 Household, LSU = 300.
MBH26 No access gate locked.
MBH27 Grab sample at 10m.
MBH28 Down gradient from dam wall.
MBH29 Brookefield Beef.
MBH30 Hole blocked, water for farm animals and goats (about 50).
MBH31 Household use, Sample taken from house across road.
MBH32 1 Household, LSU = 1000. No water level measurement- permission denied.
MBH33 Permission denied.
MBH34 Permission denied.
MBH35 1 Household, barn with chickens, 30 pigs.
MBH36A 1 Household, goats, horses. Sample tank overflow. Supply to house has water filtration system.
MBH36B Unused.
MBH40 Supplies 1 household, 700 cattle, 300 sheep.
MBH41 Water for approximately 100 000 chickens.
MBH42 Supplies about 300 cattle and 40 people, backup for chicken houses. Bees. Alternative number KGA18.
MBH44 Louis Roussouw's brother in law.
MBH45 Use at workshop, 20 people.
MBH46 Sample from dam next to BH31, cattle 250.
MBH47 Ternus veekraal, 2 households, feedlot 2000 cattle.
G37016 Dept. Water & Sanitation monitoring borehole. Hole Blocked. Alternative number B2N0057.
G37017 Blocked. Alternative number B2N0075.
G37018 Dept. Water & Sanitation monitoring borehole. Grab sampled at 100m. Alternative number B2N0073.
G37030 Dept. Water & Sanitation monitoring borehole. Bees. Alternative number B2N0074.
KAM01 Observation borehole, grab sample at 75m.
KAM02 Wet road no access.
KGA14 Training facility for Universal Coal, old farmhouse, 1 permanent resident and up to 12 trainees during day.
KGA15 Okkie 071 678 3740. Previous resident might have more info on borehole.
KGA17 Previously used for agricultural irrigation [Mariwija Boerdery].
KGA17B Previously used for agricultural irrigation, bees.
MAN-BH1 Overgrown, 2 x 5000L JoJo tanks, mine office supply, tillite 41m - 44m, water strike 49m - 50m 0.28l/s.
MBH48 Sealed borehole, old wind pump, stand and equipment removed.
OC1 Dolerite sill outcrop in intermittent stream, water ponding, baseflow rainy season.

MANUNGU Colliery, Life of Mine: Groundwater Impact Assessment Ref:327e DRAFT2 Jul’ 2019
GROUNDWATER SQUARE
Page 16
The external users’ borehole localities in relation to the Manungu reserve, the current as well as 30year LOM extension, depicted against a backdrop of the contoured residual gravity results pertaining to the recent geophysical survey, are presented in Figure 4.1. A photograph record of the external users’ borehole is attached in Appendix I.
The survey of 59 points included four of the Department Water and Sanitation’s (DWS) hydrostatic monitoring stations. Thirty-five boreholes were found to be in use for water supply. Water level measurements were recorded (28) ranging between 1m and 80m deep. The reported yielding capacities ranged between 0.11L/s and 40L/s. Borehole depths (48) were recorded ranging between 20m and 240m below surface (median of 80m). The average yielding capacity for the boreholes <80m in depth was 1.3L/s, while the average for the boreholes deeper than 80m was 8.5L/s. It is important to note that the information consisted of both shallow weathered Karoo aquifers, deep fractured Karoo aquifers as well as the underlying dolomitic aquifer. The more productive dolomitic aquifer areas are located ±2.8km north of the current Manungu mining area on Wolwefontein, as well as >2.2km west on Stompiesfontein and Strydpan (see gravimetric geophysical survey results).
A dolerite sill outcrop was surveyed in an intermittent stream on Portion 10 of the farm Welgevonden.
Groundwater samples (24) were submit to a water laboratory for water quality analyses.
DWS’s Water Authorisation and Registration Management System (WARMS) information (2007) indicates one registered groundwater use volume of 90,200 m3/annum as well as two surface water use registrations totalling 686,600m3/annum for Weilaagte 271 IR (after Meyer, March 2014).
Figure 4.1 Hydrocensus localities

MANUNGU Colliery, Life of Mine: Groundwater Impact Assessment Ref:327e DRAFT2 Jul’ 2019
GROUNDWATER SQUARE
Page 17
4.3. Geophysical Survey and Results Existing information in the form of the interpretation of the June 2014 high resolution aeromagnetic and radiometric survey over the Welgevonden and Weilaagte reserve area (GAP Geophysics, August 2014) was sourced from the client.
Figure 4.2 Total Magnetic Field Image (GAP Geophysics, August 2014)

MANUNGU Colliery, Life of Mine: Groundwater Impact Assessment Ref:327e DRAFT2 Jul’ 2019
GROUNDWATER SQUARE
Page 18
Figure 4.3 Geophysical Interpretation Map (GAP Geophysics, August 2014)
The airborne survey (Figures 4.2 & 4.3) indicated the Prospect Area to be underlain by up to 16 broad irregularly shaped dolerite sills at different depths. It is also stated that the prominent NS striking dyke-like magnetic anomaly responses in the eastern sector of the Prospect Area mask the near surface magnetic responses of the sills in the eastern sector. These are characterized by apparent dips within 35º of the vertical and apparent widths of 60m to 95m. An EW trending fault is interpreted based on the break in the dykes within the eastern sector.
As part of the Manungu Phase-1 groundwater study, a gravimetric geophysical survey (Figures 4.4 to 4.7) comprising a total of 310 stations were acquired along two north-south and four east-west profiles across the larger reserve area at 100m intervals (30.5 km). The survey results indicated a residual Bouguer gravity high around the centre of the surveyed area, roughly where the mayor NS and EW profiles intersect. The high extends across the existing mining area as well as the intended extension to the south. There is a significant drop-off to the extreme east (east of the R548, where the two prominent NS striking dyke-like magnetic anomaly responses [aeromagnetic survey] transect the R548), as well as to the far-west (Stompiesfontein & Strydpan).
The second Phase groundwater investigation (Manungu 30year LOM) started off with a Stratagem Magneto Telluric (AMT) geophysical traverse line along the boundary between the existing mining area and the proposed extension to the south which also corresponds with the major central EW gravity survey lined performed during the initial investigation.
The MT data correlated well with the displacement of the coal measures as indicated by the geological model around the southwestern part of the current mining area. Similar displacements were found to the west and further to the east.
Limited areas of more conductive zones are present at the base of the Karoo Sequence; and these appear to be structurally controlled. There does not appear to be a definable resistivity contrast correlation with the base of the Transvaal Sequence.
The broad conductive anomalies around Station 2800m and 3250m can be attributed to cultural effects, while the anomaly associated with Station 2650m were targeted for a replacement borehole for BH4 (see Section 4.2 & 4.3).
The available and newly commissioned geophysical survey reports are attached in Appendix II.

MANUNGU Colliery, Life of Mine: Groundwater Impact Assessment Ref:327e DRAFT2 Jul’ 2019
GROUNDWATER SQUARE
Page 19
Figure 4.4 Gravity Survey Traverse Lines (GeoFocus, March 2017)
Figure 4.5 Residual Gravity Contour Map (GeoFocus, March 2017)

MANUNGUN Colliery, Life of Mine: Groundwater Impact Assessment Ref:327e DRAFT2 Jul’ 2019
GROUNDWATER SQUARE
Page 20
Figure 4.6 Google image with residual gravity overlay indicating external users’ borehole localities

MANUNGUN Colliery, Life of Mine: Groundwater Impact Assessment Ref:327e DRAFT2 Jul’ 2019
GROUNDWATER SQUARE
Page 21
Figure 4.7 Google image with residual gravity overlay indicating geohydrological borehole localities

MANUNGU Colliery, Life of Mine: Groundwater Impact Assessment Ref:327e DRAFT2 Jul’ 2019
GROUNDWATER SQUARE
Page 22
4.4. Drilling and Siting of Boreholes In total, 8 “deep” (86m to 101m deep), 10x “medium” (26m to 35m deep) and 6x “shallow” boreholes (6m to 10m deep) were drilling during April and August 2017, as summarised in Tables 4.2A-B; and Figures 4.7 and 9.1.
Six drill sites, consisting of 13 holes were drilled during April 2017 for the first groundwater impact assessment. Borehole locations were based on the geophysical information and the original 18year mine plan.
A further 7 drill sites, consisting of 12 more holes were drilled during July-August 2017 for the Phase-2 groundwater impact assessment. The sites were based on the existing and newly commissioned geophysical (AMT) results, the Phase-1 drilling experience and latest 30year LOM.
MAN-BH2D, 2M&S were sited between the flanking intermittent stream and the western extent of the opencast section planned for April 2022–April 2023 along the edge of the gravity high across the 18year mine plan area, some 290m west of a displacement of the coal measures. This displacement coincides with the boundary between identified dolerite sills S13 and S14 in Figure 4.3. The placement also coincides with the central eastern boundary of the Underground West 30year LOM extension section. MAN-BH2D was drilled to a depth of 101m below surface during the first phase of drilling. A water intersection of 1.09L/s was recorded between 71m-72m (Dwyka – mostly angular chert fractions with Karoo fractions), as well as 0.26L/s between 90m-92m (upper dolerite sill contact, below Dwyka – mostly chert with Karoo fractions), cumulating in a total blow yield of 1.35L/s. The borehole was drilled deeper to an end-of-hole depth of 175m below surface during the second phase of drilling. Dolomite was intersected between sill intrusions at the base of the Karoo sequence (Dwyka – chert with Karoo fractions) at depths of 106m-107m, 136m-156m, 164m-165m and 170m-175m. No additional water intersections were recorded. An old gold mining exploration borehole (SW.1) located some 600m southwest of MAN-BH2D indicated the base of the Karoo Sequence at a depth of 64m (Figure 4.7). The base of the Transvaal Sequence represented by the Black Reef is indicated at a depth of 242m. Table 4.2A Pertinent hydrogeological information – physical borehole parameters
Site Name
WGS84 LO29 End of hole (m)
Collar Height
(m)
Water Level (m)
Sampling Horizon
(m) Latitude Longitude
Elevation (mamsl)
MAN-BH2D 26.237200 28.679010 1592 175 0.50 34.40 88
MAN-BH2M 26.237160 28.679010 1590 41 0.55 3.54 23
MAN-BH2S 26.237130 28.679020 1590 10 0.57 3.03 5
MAN-BH3D 26.236750 28.703780 1580 100 0.27 26.01 71
MAN-BH3M 26.236730 28.703790 1580 30 0.32 4.18 15
MAN-BH3S 26.236690 28.703820 1580 10 0.3 3.99 7
MAN-BH4D 26.239650 28.694450 1595 90 0.32 28.1 67
MAN-BH4M 26.239630 28.694490 1595 41 0.28 7.23 25
MAN-BH4S 26.239600 28.694530 1596 10 0.24 6.4 8
MAN-BH5M 26.234210 28.683400 1597 40 0.36 4.43 32
MAN-BH6D 26.216920 28.683900 1572 91 0.3 32.6 75
MAN-BH6M 26.216880 28.683880 1572 40 0.42 5.15 30
MAN-BH7M 26.243110 28.682930 1597 36 0.27 6.53 25
MAN-BH8M 26.222640 28.699540 1570 31 0.61 2.77 15
MAN-BH9D 26.248280 28.698050 1593 96 0.43 43.84 66
MAN-BH9M 26.248340 28.698050 1593 46 0.58 8.23 30
MAN-BH9S 26.248370 28.698050 1593 10 0.53 7.82 8.5
MAN-BH10M 26.240870 28.706280 1577 26 0.47 5.23 17
MAN-BH11D 26.247860 28.687810 1606 86 0.46 36 71
MAN-BH11S 26.247850 28.687830 1606 7 0.52 4.18 5.5
MAN-BH12D 26.256870 28.678330 1596 86 0.73 41.17 59
MAN-BH12M 26.256880 28.678300 1596 40 0.75 4.11 28
MAN-BH12S 26.256850 28.678270 1596 7 0.74 3.5 5
MAN-BH13D 26.265620 28.674660 1602 86 0.70 52.22 78
MAN-BH2M recorded water seepage after casing installation as well as between 24-30m. Although the seepage wasn’t enough for dust suppression, a final blow yield of 0.125L/s were nevertheless recorded.

MANUNGU Colliery, Life of Mine: Groundwater Impact Assessment Ref:327e DRAFT2 Jul’ 2019
GROUNDWATER SQUARE
Page 23
MAN-BH3D, 3M&S were sited along the gradient of a small gravity low around the toe of the current overburden (softs) stockpile, just within the northeastern extent of the opencast section planned for the 30year LOM extension, between the dump and the wetland associated with the eastern flanking stream. The roof of the Dwyka Tillite Formation was intersected 20m below surface. Leucocratic, tonelite sill intersections were recorded between 41-64m and 66-73m below surface, followed by interbedded black shale and siliceous quartzite down to a depth of 100m below surface. The placement of this borehole is near, and west of the Black Reef’s sub-outcrop (after Button, February 1969) along the western flank of the Winterhoek anticline, indicated to basically coincide with the flanking stream locally. A distinct correlation exists between the lithologies intersected at the base of both MAN-BH3D and the water supply borehole (MAN-BH1) commissioned during 2014, which is located some 1.5km to the northwest, also near west of said outcrop.
A falling head test was performed on MAN-BH3D during drilling. The test section (26m-41m) in borehole MAN-BH3D featured the contact between the Dwyka Tillite Formation and a tonelite sill intrusion. Table 4.2B Pertinent hydrogeological information – physical and hydraulic parameters
Site Name
Water strike Lithological Intersections
Depth (m)
Yield (L/s)
OBDN (m)
LOW (m)
Coal (m)
Dwyka Roof (m)
Chert Breccia
(m)
Dolomite (m)
Intrusions (m)
MAN-BH2D
71-72 90-96
1.09 0.26
5 23 23-24 46-63
63 68-90 106-107 136-156 164-165 170-175
90-101 (D) 101-105 (D) 107-136 (T) 157-163 (T) 165-170 (D)
MAN-BH2M 12-30 0.125 6 24 23-24
MAN-BH2S 6
MAN-BH3D 21-22 0.10 11 17 17-20 20 41-64 (T)
66-73 (T)
MAN-BH3M 21-22 0.10 11 17 17-20 21
MAN-BH3S 10
MAN-BH4D 25-30 1.45 5 30 43-52 52 56-65
11-13 (D) 20-34.5 (D) 65-90 (T)
MAN-BH4M 23-30 0.77 5 30
MAN-BH4S 5
MAN-BH5M 4 27 22-23 32-40 (D)
MAN-BH6D
8.5-16 34-40 64-66 73-75
3.40 0.46 3.01 2.50
6 26 29-31 34-40 42-47
47 65-77 6-25.5 (D) 77-91 (T)
MAN-BH6M 8.5-16 3.40 6 27 29-31
34-40
6-25.5 (D)
MAN-BH7M 6 25 22-23 30-36 (D)
MAN-BH8M 6 15 11-14 15
MAN-BH9D 30-31 66-67
0.11 1.40
6 30 36-41 66-67
42 47-48 96 6-17 (D) 61-96 (T)
MAN-BH9M 30-31 0.11 6 30 39-43 45 4-18 (D)
MAN-BH9S 6 6-10 (D)
MAN-BH10M 11-17 0.10 7 17 11-17 17
MAN-BH11D 68-71 2.50 7 31 27-28
48-54 54 64-78 78-80 80-86 (D)
MAN-BH11S 7
MAN-BH12D 3 28 41-42
56-76 79 82-86
MAN-BH12M 3 28 41-42
MAN-BH12S 3
MAN-BH13D 17-18 1.05 1 18 44-45
58-59 65-78
81 83-86
* (D=Dolerite; T=Tonelite)
MAN-BH4D,4M&S were sited along the gradient of the central gravity high across the 18year mine plan area’s eastern opencast section planned for April 2028–April 2029. Both the deep and medium boreholes featured dolerite intersections between 11-13m and 20-34.5m below surface. Respective water makes of 1.45L/s and 0.77L/s, associated with the lower, weathered, fractured dolerite sill, were

MANUNGU Colliery, Life of Mine: Groundwater Impact Assessment Ref:327e DRAFT2 Jul’ 2019
GROUNDWATER SQUARE
Page 24
recorded 23-30m below surface. The roof of the Dwyka Tillite Formation was intersected 52m below surface. Between 56-65m the intersection consisted mostly out of chert, followed by a tonelite sill intersection to the base of the borehole at 90m below surface. The upper portion of the sill was noted to be leucocratic. The water strike in the deep hole was cut-off with 36m solid casing installed with a bentonite plug. The final blow yield recorded in the deep borehole was <0.1L/s. A falling head test was also performed on MAN-BH4D during drilling. The test section (36m-61m) in borehole MAN-BH4D featured the contact between the Vryheid and Dwyka Tillite Formations with the latter consisting mostly of chert below 56m.
MAN-BH5M was drilled across the 18year mine plan area’s central opencast section planned for April 2023–April 2024, north of the dirt road between the R42 and the R548, some 200m south of the exiting pit’s first bench, as well as some 300m east of the already mentioned displacement of the coal measures. A thin coal intersection was recorded 22-23m below surface, while a dolerite sill was intersected 32m below surface. The borehole was terminated in dolerite at a depth of 40m below surface.
MAN-BH6D and MAN-BH6M were sited across a broad, minor gravity low north of the exiting opencast pit, between the pit and the R42. MAN-BH6D recorded water intersections of 3.01L/s between 64m-66m (chert breccia with carbonaceous shale), as well as 2.50L/s between 73m-75m (fractured chert breccia), with a total blow yield of >5.00L/s. The roof of the Dwyka Tillite Formation was intersected 47m below surface.
Chert breccia was intersected 65-77m below surface, above a tonalite sill intrusion. The hole was terminated in tonalite at a depth of 91m below surface.
MAN-BH6M recorded a water strike of 3.4L/s between 8.5m-16m relating to a (weathered fractured) dolerite sill intersection 6-25.5m below surface. Although the same water make was encountered in MAN-BH6D, it was cased-off with 41m solid steel casing and a bentonite plug.
XRF & XRD samples were collected from MAN-BH3D (55m-56m & 86-87m), MAN-BH4D (75m-76m) and MAN-BH6D (77m-86m). The sill intrusions intersected at the base of the Karoo Sequence and the upper part of the Malmani Subgroup plot as tonalite, using the QAPF or "Quartz, Alkali feldspar, Plagioclase, Feldspathoid (Foid)" diagram of Streckeisen (1973 and 1976), an igneous, plutonic (intrusive) rock of felsic composition, with phaneritic texture. Feldspar is present as plagioclase (typically oligoclase or andesine) with 10% or less alkali feldspar. Quartz is present as more than 20% of the rock.
MAN-BH7M was sited along a gravity gradient along the 18year mine plan area’s central, eastern opencast section planned for April 2029 – April 2030. A dolerite intersection was recorded across the last 6m of this 36m deep borehole. No water intersections were recorded.
MAN-8M was sited some 120m north of MAN-BH1 close to the south-eastern corner of the current PCD, below the coal loadout facility. Dwyka tillite with chert fractions were intersected 15-16m below surface above soft, light olive brown, weathered shale. Rocks of the West Rand Group’s Hopsital Hill Subgroup is indicated to outcrop to the near east of this borehole.
The placement of MAN-BH9D, 9M&S coincides with the larger gravity high’s south-eastern gradient as well as the central area of the opencast section planned for the 30year LOM extension. MAN-BH9D intersected some dolomite along the lower contact of a tonalite sill intersected 61-96m below surface. The hole has been re-drilled on 28/8/2017. Unlike the original borehole, this hole, drilled 9m away, recorded a water strike of 1.40L/s at a depth of 67m below surface, associated with the upper part of the tonalite sill intersected. The Dwyka Tillite Formation (tillite with chert fractions) was intersected between 42m to >60m below surface.
Both borehole MAN-BH9M and 9D intersected a water make of 0.11L/s 30-31m below surface, although this water make was cased-off in the deep hole with 48m solid steel casing and a bentonite plug.
MAN-BH10M was sited close to the eastern flanking stream, some 530m south-southeast of the MAN-BH3D, 3M&S placement, also within the north-eastern extent of the opencast section planned for the 30year LOM extension. A water intersection of some 0.10L/s were encounter along the coal measures intersected above the Dwyka Tillite Formation between 11m-17m below surface.
MAN-BH11D&S were sited across the western part of the opencast section planned for the 30year LOM extension. Borehole MAN-BH11D intersected dolomite between 78m-80m below surface, below chert breccia at the base of the Karoo sequence (64m-78m); and a sill intrusion intersected between 80m and the end-of-hole at 86m. A water strike of 2.51L/s was recorded in the chert between 68m-71m. The placement of MAN-BH12D, 12M&S coincides with the boundary between the western extent of the opencast section and the Eskom Underground section planned for the 30year LOM extension. It is also located along the south-western gradient of the lager gravity high. MAN-BH12D intersected the roof of

MANUNGU Colliery, Life of Mine: Groundwater Impact Assessment Ref:327e DRAFT2 Jul’ 2019
GROUNDWATER SQUARE
Page 25
the Dwyka Tillite Formation some 79m below surface. The samples pertaining to the last 5m’s drilled up to the end of the hole, consisted largely of chert. No water intersections were encountered.
The placement of MAN-BH13D coincides with the boundary between the western extent of the opencast section and the Eskom Underground section planned for the 30year LOM extension. Man-BH12D intersected the roof of the Dwyka Tillite Formation some 81m below surface. The samples pertaining to the last 3m’s drilled up to the end of the hole, consisted solely of chert. No water intersections were encountered. A water strike of 1.05L/s was intersected 17-18m below surface, although this water make was cased-off with 42m solid steel casing and a bentonite plug.
Geochemical samples (79) were collected during drilling for ABA analyses and an additional 10kg ROM sample was collected on 03/08/2017.
The water columns in the boreholes were EC-profiled and sampled after a two-week resting period. A sample of the PCD dam was also collected and submitted to a water laboratory together with the borehole samples.
Slug tests were performed on all the boreholes except borehole MAN-BH6D. The bentonite seal in this borehole (cased to 41m) was not effective and water leaking from the upper part of this borehole was falling down the hole.
During the end of November 2017, BH4, the Trollop Mining water supply borehole was replaced. The replacement borehole (BH4R – 26.23156 28.69783) was sited along Station 2650 of the AMT traverse performed during August 2017. A dolerite sill was reported to be intersected 34-81m below surface. A water strike of 2.50L/s was intersected along the lower contact of this sill with the underlying dolomite.
The Borehole Construction and Geological Log Reports are attached in Appendix III.
4.5. Aquifer Testing Four of the newly commissioned boreholes were pump tested between June and November 2017.
The data obtained from the pumping tests was analysed using the Flow Characteristic Method (FC Method). This program was developed by the Institute for Groundwater Studies at the University of the Free State, Bloemfontein, South Africa. The program evaluates the sustainable yield of a borehole using derivatives, boundary information, error propagation and influence of other boreholes. It is important to keep in mind that the program simulates a 2-year abstraction scenario, using a zero-recharge rate. In other words, abstraction is calculated but no groundwater recharge from rainfall is factored in. The program is therefore conservative in its recommended abstraction rates. Other hydraulic parameters were determined with Aquifer Test software.
The sustainable safe abstraction rates and abstraction recommendations are summarized in Table 4.3. The Pumping Test Analysis Reports are attached in Appendix IV, and interpretations in Tables 4.4&4.5.
A calibration yield of 3.04L/s was determined for MAN-BH2D (101m deep, before drilled deeper during the second phase drilling program) at the end of the fourth step test. The constant discharge test was performed at an abstraction rate of 1.2L/s, resulting in a drawdown of 41.89m. A slow 70% recovery was achieved after 24 hours. No reaction was observed in boreholes MAN-BH2M and MAN-BH2S during the test. An average transmissivity (T) value of 1.78m2/day was determined for this borehole. A sustainable safe yield of 0.20L/s (24 hours/day) was determined for this borehole. The recommended sustainable long-term abstraction rate for this borehole is 0.35L/s (1.260m3/h) for a maximum of 8 hours/day (10.080m3/day).
A calibration yield of 7.00L/s was recorded for MAN-BH6D at the end of the third step test. The constant discharge test was performed at an abstraction rate of 5.00L/s resulting in a drawdown of 34.66m. A 53% recovery was achieved after 24 hours. The extremely low rate of recovery continued, such that an 86% recovery was achieved only after 165 hours. No drawdown was observed in borehole MAN-BH6M during the test. An average T value of 9.40m2/day was determined for this borehole. A sustainable safe yield of 0.85L/s (24 hours/day) was determined for this borehole. The recommended sustainable long-term abstraction rate for this borehole is 1.47L/s (3.060m3/hr) for a maximum of 8 hours/day (24.480m3/d).
A calibration yield of 2.60L/s was recorded for MAN-BH11D at the end of the fourth step test. The 24-hour constant discharge test was performed at an abstraction rate of 1.60L/s, resulting in a drawdown of 24.10m. A 63% recovery was achieved after 24 hours. The extremely low rate of recovery continued, and 84% recovery was achieved only after 192 hours. No drawdowns were observed in neighbouring shallow and deep boreholes MAN-BH11S and MAN-BH9D (collapsed – before re-drill) during the test.

MANUNGU Colliery, Life of Mine: Groundwater Impact Assessment Ref:327e DRAFT2 Jul’ 2019
GROUNDWATER SQUARE
Page 26
An average transimissivity (T) value of 4.9m2/d was determined for this borehole. A sustainable safe yield of 0.35L/s (24 hours/day) was determined for this borehole. The recommended sustainable long-term abstraction rate for this borehole is 0.61L/s (2.2m3/hr) for a maximum of 8hours/day (17.568m3/d).
A calibration yield of 2.66L/s was recorded for MAN-BH9D (re-drill) at the end of the fourth step test. The 12-hour constant discharge test was performed at an abstraction rate of 1.6L/s, resulting in a drawdown of 13.23m. A 92.1% recovery was achieved after 12hr. No drawdowns were observed in boreholes MAN-BH9M and MAN-BH9S. An average T value of 6.1m2/d and a sustainable safe yield of 0.60L/s (24 hr/d) was determined for this borehole. The recommended sustainable long-term abstraction rate for this borehole is 1.04L/s (3.7m3/hr) for a maximum of 8 hours/day (29.952m3/d).
Water samples were collected from each of the tested boreholes towards the end of the constant discharge tests.
Table 4.3 Sustainable safe yields & abstraction recommendations
Borehole ID AD used Specified Maximum Drawdown
(m)
Sustainable Safe Yield 24hr/day
(L/s)
Abstraction Schedule
(hours/day)
Abstraction Rate (L/s)
Abstraction Rate
(m3/day)
Installation Depth
(m)
MAN-BH2D 35 0.20 8 0.35 10.080 91
MAN-BH6D 30 0.85 8 1.47 24.480 70
MAN-BH9D 17.1 0.60 8 1.04 29.952 64
MAN-BH11D 29.4 0.35 8 0.61 17.568 66
Table 4.4 Pumping test and step test results
Pumping Test Step Test
MAN-BH2D
MAN-BH6D
MAN-BH11D
0
5
10
15
20
25
30
35
40
45
0 1000 2000 3000 4000 5000 6000 7000 8000
Gro
undw
ate
r le
vel
(m)
Time (minutes)
0
5
10
15
20
25
30
35
40
45
50
0 20 40 60 80 100 120 140 160
Gro
undw
ate
r le
vel
(m)
Time (minutes)
0
5
10
15
20
25
30
35
40
45
0 2000 4000 6000 8000 10000 12000
Gro
undw
ate
r le
vel
(m)
Time (minutes)
0
5
10
15
20
25
30
35
40
45
50
0 50 100 150 200
Gro
undw
ate
r le
vel
(m)
Time (minutes)

MANUNGU Colliery, Life of Mine: Groundwater Impact Assessment Ref:327e DRAFT2 Jul’ 2019
GROUNDWATER SQUARE
Page 27
MAN-BH9D
Table 4.5 Summary pumping test analyses
Borehole Number
Drilling information Slug test hydraulic
conductivity (m/d)
Pumping test interpretation
Depth (m)
Water-strike Transmissivity
(m2/d) Hydraulic
conductivity (m/d)
Sustainable yield (L/s)
MAN-BH2D 90.64 71m-72m deep; yielding 1.2L/s
0.068 1.78 0.057 0.20
MAN-BH6D 89.60 63m-66m and
73m-75m deep; yielding 5.0L/s
0.190 9.4 0.26 0.85
MAN-BH11D 87 68m-71m deep; yielding 1.61L/s
0.160 4.9 0.14 0.35
MAN-BH9D 96 66m-67m deep; yielding 1.8L/s
0.024 6.1 0.22 0.60
4.6. Sampling and Chemical Analysis Groundwater samples (24) taken during the 2017 hydro-census revisit were submitted to Yanka Laboratory for water quality analyses during March 2017.
The water columns in the newly commissioned boreholes were EC-profiled and sampled after a two-week resting period during both phases of drilling. A sample of the PCD dam was also collected during the Phase-1 investigation. The samples were submitted to Yanka Laboratory for water quality analyses towards the end of May 2017 (12) and (11) August 2017. MAN-BH9D was re-drilled towards the end of August 2017. The borehole was EC-profiled and sampled after a two-week resting period and the sampled submitted to Yanks Laboratory during mid-September 2017.
Water samples (4) were also collected from each of the aquifer tested boreholes towards the end of the constant discharge tests performed on them.
The hydro-chemistry results are discussed in Section 5.6.
4.7. Groundwater Recharge Calculations Recharge values were based on the following:
• Previous hydrogeological assessments in the surrounding coal fields served as a guide for potential recharge, taking cognisance of the specific topographical setting, geological setting;
0
5
10
15
20
25
30
35
40
45
0 500 1000 1500 2000 2500 3000 3500
Gro
undw
ate
r le
vel
(m)
Time (minutes)
0
5
10
15
20
25
30
35
40
45
50
0 50 100 150 200
Gro
undw
ate
r le
vel
(m)
Time (minutes)
0
5
10
15
20
25
30
35
40
45
0 200 400 600 800 1000 1200 1400 1600
Gro
undw
ate
r le
vel
(m)
Time (minutes)
0
5
10
15
20
25
30
35
40
45
50
0 50 100 150 200 250
Gro
undw
ate
r le
vel
(m)
Time (minutes)

MANUNGU Colliery, Life of Mine: Groundwater Impact Assessment Ref:327e DRAFT2 Jul’ 2019
GROUNDWATER SQUARE
Page 28
o The numerical groundwater flow model was calibrated for rainfall recharge of ±2% of MAP (=14mm/a =3.8x10 5m/d), which agrees with hydrogeological assessments in the surrounding coal fields;
o The numerical groundwater flow model was calibrated through simulating observed groundwater levels through the optimum combination of rainfall recharge and aquifer hydraulic conductivity;
o Recharge values are summarised in Section 7.6; o Rainfall recharge is expected to be in the order of:
▪ For rehabilitated mining areas, 12%.
4.8. Groundwater Modelling The Phase-1 opencast pit (of ±448ha) predominantly targets the Seam-2 over a mining period of 18years till 2033, as depicted in Figures 1.1 and 1.2. A Box-cut was constructed along the north-western perimeter of the opencast. Mining is progressing eastwards, as indicated in Figure 1.2. After the whole west-east strip has been mined, mining will continue to the south in west-east strips.
The following approaches were used in the evaluation of the potential impacts:
• The FEFLOW Finite Element Numerical Groundwater Modelling software package developed by WASY Institute for Water Research Planning in Berlin, Germany, was used to calculate the extent of dewatering, water balance, likely decant volumes and associated contamination plumes: o The model domain (depicted in Figure 2.1), consists of 9 layers and 2.1 million mesh elements
to accommodate the geometry of the aquifers and coal seams; o Seam-2 constituted the bottom of model Layer-4; o The cross-sections discussed in Section 7.3 provides an explanation of the aquifer geometry
(e.g. depths/elevations of Seam-2 in relation to aquifers); • Model parameters are listed in Tables 7.1(A-B) and 7.2(A-B); • Boundary conditions are discussed in Section 7.2; • The extent of the model grid and cell size (minimum 10m) are believed to be sufficient for the
purpose of the groundwater impact assessment; • Steady state groundwater flow modelling was employed to assess pre-mining and post-mining
groundwater flow; • Transient flow modelling was performed to determine:
o Groundwater base-flow volumes during mining/operation and post-mining; o Dewatering impact zone; o Time to decant; o Contamination movement;
• Water balance calculations took cognisance of groundwater base-flow/inflow and rainfall recharge; • Several spreadsheet calculations were performed in support of the numerical model calculations. Modelling scenarios in Section 7 evaluated the above-mentioned considerations.
4.9. Groundwater Availability Assessment With reference to DWAF’s map: Groundwater Resources of the Republic of South Africa, Sheet 1 & 2, 1995, the following:
• Sheet 1 indicates the nature of the water-bearing rock to be compact arenaceous and argillacecous strata. The lithostratigraphy of the water-bearing rock is indicated as the Ecca Group: shale, sandstone; intruded by dolerite dykes and sheets; o The probability of drilling a successful borehole (Accessibility) is indicated as ranging between
40 and 60%. A borehole is deemed successful if upon completion it yields more than 0.1 l/s o The probability of drilling a successful borehole, yielding more than 2L/s (Exploitability) is
indicated as 20–30%; • Sheet 2 describes the saturated interstice (storage medium) / aquifer as pores in disintegrated /
decomposed, partly decomposed rocks and fractures which are principally restricted to a zone below the ground water table. In fresh rock, water bearing fractures are comparatively sparse. The storage coefficient (order of magnitude only) is indicated as 0.001 to 0.01.
According to the explanation of DWAF’s 1: 500 000 Hydrogeological map series of the Republic of South Africa, Sheet 2526 Johannesburg (H. C. Barnard, Oct 2000) the following:

MANUNGU Colliery, Life of Mine: Groundwater Impact Assessment Ref:327e DRAFT2 Jul’ 2019
GROUNDWATER SQUARE
Page 29
• The groundwater yielding potential for the Vryheid Formation (intergranular & fractured aquifer type -506 records) including intrusive dolerite (intergranular & fractured aquifer type) is classed as low on the basis that 83% of the boreholes on record produce less than 2L/s, while 31.2% range between 2L/s and 5L/s and 6.3% produce more than 5L/s; o The map indicates the borehole yield class (median L/s - excluding dry boreholes) the area as
ranging between 0.10 and 0.50L/s; o The groundwater rest level is generally encountered between 5m and 25m below surface;
• The Dwyka Tillite Formation (34 records - intergranular & fractured aquifer type) comprises glacial deposits (tillite). The permeability of fresh tillite is generally and widely considered as being very low. The groundwater yielding potential is classed as low on the basis that 76% of the boreholes on record produce less than 2L/s, while 23.5% range between 2L/s and 5L/s and 0% more than 5L/s.
Of the 12 newly commissioned drill sites, 6 boreholes intersected water within the shallow weathered zone aquifer, indicating an “Accessibility” of 50%. Only one borehole recorded a water strike more than 2L/s, indicating an “Exploitability” of <10%:
• Two of the larger water intersections were associated with dolerite sill intrusions. The average blow yield of the individual water intersections recorded calculates to 0.93L/s, while the median calculates to 0.45L/s. Taking the two water strikes associated with the dolerite sill intrusions out of the equation, the average comes down to 0.35L/s.
Drilling (including MAN-BH1 and BH4R) indicated an “Accessibility” of >60 for the deep fractured aquifer. An “Exploitability” of <30% was achieved. The average blow yield of the individual water intersections recorded calculates to 1.56L/s, while the median calculates to 1.4L/s.
• Only one water intersection of 0.46L/s was associated with the Karoo strata above the Dwyka Tillite Formation;
• Four of the water intersections recorded were associated with chert breccia at the base of the Dwyka Tillite Formation, the average blow yield of these calculate to 2.28L/s;
• Three water strikes with an average blow yield of 1.39L/s were associated with intrusive sills below the Dwyka Tillite Formation;
• Of 4 boreholes that intersected dolomite, only one water strike of 0.28L/s were associated with slightly fractured dolomite at the base of a dolerite sill intersection: o Based on the results of the gravity survey, the hydro-census information, as well as both
phases of drilling, the storage medium of the concealed dolomite aquifer which attains a maximum thickness of approximately 200m across the Manungu reserve is described as fractures, with dissolution features absent or poorly developed.
In terms of “A South African Aquifer System Management Classification, WRC Report No KV 77/95, December 1995”, (see Section 6.2), both the shallow weathered zone and deep fractured Karoo aquifers, including the transitional chert breccia zone at the base of the Dwyka Tillite Formation, the intrusive zone below the Karoo Sequence, as well as the underlying dolomite, are all classified as minor aquifer systems:
• Dolomite was intersected directly below the chert breccia in one borehole only. Although it is uncertain whether the chert breccia forms part of the Dwyka Tillite Formation or represents the top of the Malmani Subgroup locally, it doesn’t influence the aquiver classification and the permeability of overlying tillite is still considered as very low.

MANUNGU Colliery, Life of Mine: Groundwater Impact Assessment Ref:327e DRAFT2 Jul’ 2019
GROUNDWATER SQUARE
Page 30
5. PREVAILING GROUNDWATER CONDITIONS
5.1. Geology
5.1.1 Regional Geology It is not the purpose of this report to provide a detailed geological description. However, several regional and local geological aspects are relevant to the hydrogeological evaluation.
Figure 5.1 depicts the surface geology according to the Council for Geoscience (1:250 000 Map Series, 2628 East Rand, 1986). The primary features are dolerite sill outcrops to the north and across the southern extent of the 30year LOM extension area, coal bearing Karoo-Ecca sedimentary strata of the Vryheid Formation in the proposed mining area, Karoo-Dwyka outcrops of the north, Malmani dolomites to the north and rocks of the West Rand Group’s Hopsital Hill Subgroup to the northeast and southeast. Alluvium can be seen along the natural surface water drainage lines.
Figure 5.1 Regional geology (Council for Geoscience)
According to Button (1969 & 1970), Witwatersrand rocks are preserved, beneath the Paleozoic Karroo Sequence and Transvaal strata. An extensive area of Lower Witwatersrand rocks and limited areas of Upper Witwatersrand sediments are preserved in an area north of the Devon granite Dome.
The latter are situated along the Delmas Syncline in two small structural basins, the Middelbult and Bultfontein basins which lie southwest and north, respectively, of the town of Delmas.
The isolated outcrops of Witwatersrand quartzite and shale found to the south of Delmas were mentioned by Venter (1934), who correlated these quartzites with the Black Grit Quartzite (Hospital Hill Series) of the Heidelberg area, on the basis of black chert granules found in the quartzite.
AlluviumDolerite (Jd)Vryheid Formation (Pv)Dwyka Formation (C-Pd)Malmani Subgroup (Vmd)
Hekpoort Formation(Rh)

MANUNGU Colliery, Life of Mine: Groundwater Impact Assessment Ref:327e DRAFT2 Jul’ 2019
GROUNDWATER SQUARE
Page 31
An old gold mining exploration borehole (SW.1) located some 600m southwest of MAN-BH2D indicates the base of the Karoo Sequence at a depth of 64m. The base of the Transvaal Sequence represented by the Black Reef is indicated at a depth of 242m (postulated thickness of TVL intersection = 182m). At Borehole SW.1, a horizon which was tentatively correlated with the Main Reef was intersected. This correlation rested on the presence of an amygdaloidal lava found to underlie the Transvaal Sequence. This lava, which could be either of the Bird or Jeppestown amygdaloids, lies at no great distance above or below the Main Reef Horizon. In either case, Borehole SW.1 must be in the proximity of a sub-outcrop of the Main Reef Horizon postulated at a depth of ±352mbs.
A probable basin structure is located between Borehole SW.1 and the Middelbult group of boreholes. Since the same elevation of the key bed occurs in Boreholes SW.1, MB.1, and MB.2, the key bed is either flat-lying between these localities or, more likely; the two are separated by a structural depression.
Some 4.4km to the southeast on Ptn.5 of the farm Welgevonden old gold mining exploration borehole (rwv.1) indicate the base of the Karoo Sequence at a depth of 40m. The base of the Transvaal Sequence represented by the Black Reef is indicated at a depth of 90m (postulated TVL thickness = 50m). This borehole was terminated in rocks of the West Rand Group at a depth of some 537mbs.
Button (1969) indicates the sub-outcrop of the Black Reef within a kilometre of the southwestern southern reserve boundary from where it turns to the north to transect the reserve area east of the central reserve area along the eastern limb of the Delmas Syncline, past and to the immediate west of the Hospital Hill Subgroup outcrop along the reserve’s central northern boundary for another 4km before turning east to loop around the Winterhoek anticline.
5.1.2 Local Geology All five coal seams, typically encountered in the Witbank coal fields (Seam-5, Seam-4, Seam-3, Seam-2 and Seam-1) are present in the Manungu study area. Due to the present-day topography some portions of the upper seams have been eroded away. Although being negatively affected by erosion, the Seam-5 is present. According to Denner (2018), dolerite sill intrusions towards the upper part of the coal sequence have a negative impact on especially the Seam-4, resulting in the Seam-4 either not being present or devolatilised as a result. Although the Seam-3 is fairly well-developed, it is very thin, as is usually the case. The Seam-1 coal seam has an erratic distribution, both in terms of thickness and occurrence, which is mainly due to the undulating pre-Karoo basement underlying the coal seams.
The Seam-2 coal will be the primary target due to its economic thickness and quality. The average depth below surface of the Seam-2 is 48m (57m deep to the Seam-1). See Figure 5.2 (Figures 7.5 and 7.6 reflect the correct project layout)
According to Denner (2018), the thickness and occurrence of the Seam-2 is affected by the pre-Karoo topography, as well as weathering along these basement highs. There is a variation of 70m from west to east in the Dwyka floor elevation, causing the Seam-2 to have a very thick distribution towards the west in the basement valley (around 12m), and a thinner (<5m) or even weathered distribution to the east where the basement reaches its highest elevation. A dolerite sill present across the area, has a limited impact on the Seam-2 in the planned mining area, but elsewhere it can negatively influence the occurrence and quality of the coal seam.
According to Denner (2018), the top portion of the Seam-2 is typically of a poor coal quality with interbedded shales. From a coal quality perspective, this poor coal zone has been identified and separated from the Seam-2 selection; locally renamed as Seam-2T (Top) coal seam. This seam varies in thickness across the property, and is mainly absent towards the east, but increases in thickness to the west where it can reach a thickness of over 4m.
A cross-section of the local lithology is included as Figure 5.4.
A contour map indicating the depth to Seam-2 coal roof is presented in Figure 5.2. A map indicating the locality of a SW-NE orientated geological cross-section across the 18year LOM area is portrayed in Figure 5.3, while the cross section is presented in Figure 5.4.
As can be seen in Figure 5.2, apart from the somewhat isolated basin across the north-western part of the 18year LOM area, Seam-2 coal can be seen to be dipping to the southwest, with the deepest coal located across the 30year LOM Eskom underground extension area.
The distribution of the S14-dolerite sill aeromagnetic interpretation (Section 4.3) above the main economic coal reserves and S13-dolerite sill below them is highlighted in the cross section across the 18year LOM area in Figure 5.4.

MANUNGU Colliery, Life of Mine: Groundwater Impact Assessment Ref:327e DRAFT2 Jul’ 2019
GROUNDWATER SQUARE
Page 32
Figure 5.2 Depth to Seam-2 coal roof (m); depicted against 2017 mine plan (GEMECS,
2017)

MANUNGU Colliery, Life of Mine: Groundwater Impact Assessment Ref:327e DRAFT2 Jul’ 2019
GROUNDWATER SQUARE
Page 33
Figure 5.3 Locality of SW-NE Cross-section across 18year mine plan area; depicted
against 2017 mine plan (GEMECS, 2017)
Figure 5.4 SW-NE Cross-section across 18year mine plan area; depicted against 2017 mine
plan (GEMECS, 2017)

MANUNGU Colliery, Life of Mine: Groundwater Impact Assessment Ref:327e DRAFT2 Jul’ 2019
GROUNDWATER SQUARE
Page 34
5.2. Acid Generation Capacity Initial ABA sample collection was undertaken during February 2017 from two exploration boreholes, EF030 and EF036, drilled immediately south of the active mining area. Eleven and another twenty-three samples were respectively collected from the floor of the coal Seam-2 up to and including the regolith for Acid Base Accounting (ABA) testing. The run of mine coal stockpile was also sampled (3 x 2kg bags) for ABA testing.
Additionally, another 79 geochemical samples were collected for ABA analyses during both phases of drilling the geohydrological boreholes. An additional 10kg ROM sample was also collected on 03/08/2017.
The rehabilitated backfill of the Manungu pit will be a heterogeneous mixture of acid generation and non-acid generation rocks. Approximately 37% of the waste rock samples have a very low sulphide content (%S <0.1%) and will not generate acidic drainage, and 31% have a medium to low sulphide content (therefore a low to very low potential to generate acidic drainage). The remaining 32% of clastic rocks (including especially the carbonaceous shale) do, however, have a significant potential to generate localised acidic drainage and will form localised hot-spots within the backfill. Because of the significant volume of acid generating waste rock, the backfilled pit will generate a high salt load dominated by sulphate.
A full description of samples collected, static geochemical laboratory testing, kinetic geochemical laboratory testing, and geochemical modelling, will be discussed in detail in the final groundwater impact assessment report. Results from the recent geochemical sampling for the 30year LOM plan area, are still being assessed.
The results indicated in Table 5.2 and Figure 5.5 were determined through numerical geochemical modelling of the Phase-1 samples. Table 5.2 Summary of geochemical model output for SO4
Time Short Term Medium term Long term
Time after closure 0year to 10years 10years to 30years 30years to 200years
SO4 in pit water 500mg/L - 3500mg/L 3500mg/L - 3700mg/L 3700mg/L - 2000mg/L
Figure 5.5 Summary of geochemical model output – major contaminant indicators

MANUNGU Colliery, Life of Mine: Groundwater Impact Assessment Ref:327e DRAFT2 Jul’ 2019
GROUNDWATER SQUARE
Page 35
5.3. Hydrogeology
5.3.1 Unsaturated Zone
The unsaturated zone refers to the zone between the surface topography and the groundwater table. The depth to water table pertaining to the shallow weathered zone aquifer ranged between 2.77m and 8.23m, averaging at 5.24m.
The depth to the groundwater table as observed during various drilling phases is summarised in Figure 5.6 (Section 5.4).
5.3.2 Saturated Zone The limit of weathering ranged between 15mbs and 31mbs, averaging at 24.64mbs. The depth to water table pertaining to the shallow weathered zone aquifer ranged between 2.77m and 8.23m, averaging at 5.24m. The average thickness of the saturated zone therefore calculates to 19.4m. As the case for the unsaturated zone, the saturated zone thickness will depend on the type of geology, topographical setting, dewatering due to nearby mining and any groundwater abstraction.
5.3.3 Hydraulic Conductivity
Table 5.3A Summary of aquifer hydraulic parameters
Site Name
Water strike Lithological Intersections Test Interval
(m)
(k) (m/day) Depth
(m) Yield (L/s)
OBDN (m)
LOW (m)
Coal (m)
Dwyka Roof (m)
Chert Breccia
(m)
Dolomite (m)
Intrusions (m)
MAN-BH2D 71-72 90-96
1.09 0.26
5 23 23-24 46-63
63 68-90 106-107 136-156 164-165 170-175
90-101 (D) 101-105 (D) 107-136 (T) 157-163 (T) 165-170 (D)
68-100 68-100# 68-175
8.63E-02 7.88E-02 4.98E-02
MAN-BH2M 12-30 0.125 6 24 23-24 12-40 2.14E-02
MAN-BH2S 6 4-10.77 6.83E-02
MAN-BH3D 11 17 17-20 20 41-64 (T) 66-73 (T)
26-41* 26-100
2.07E-05 4.79E-03
MAN-BH3M 21-22 0.10 11 17 17-20 21 12-30 2.06E-02
MAN-BH3S 10 4.00-10.24 2.05E-02
MAN-BH4D 5 30 43-52 52 56-65
11-13 (D) 20-34.5 (D) 65-90 (T)
36-61* 36-100
7.24E-03 5.71E-03
MAN-BH4M 23-30 0.77 5 30 21-41 3.37E-01
MAN-BH4S 5 6.4-11.09 4.95E-02
MAN-BH5M 4 27 22-23 32-40 (D) 18-40 3.21E-02
MAN-BH6D 34-40 64-66 73-75
0.46 3.01 2.50
6 26 29-31 34-40 42-47
47 65-77 6-25.5 (D) 77-91 (T)
41-91# 1.90E-01
MAN-BH6M 8.5-16 3.40 6 27 29-31 34-40
6-25.5 (D)
6-40 3.72E+00
MAN-BH7M 6 25 22-23 30-36 (D) 24-36 8.63E-02
MAN-BH8M 6 15 11-14 15 10-31 2.06E-02
MAN-BH9D 66-67 1.40 6 30 36-41 66-67
42 47-48 96 6-17 (D) 61-96 (T)
48-96 48-96#
2.84E-01 1.96E-01
MAN-BH9M 30-31 0.11 6 30 39-43 45 4-18 (D) 16-46 3.67E-02
MAN-BH9S 6 6-10 (D) 7.82-10.02 3.29E-02
MAN-BH10M 11-17 0.10 7 17 11-17 17 9-26 2.55E-02
MAN-BH11D 68-71 2.50 7 31 27-28 48-54
54 64-78 78-80 80-86 (D) 60-86 60-86#
1.28E-01 1.88E-01
MAN-BH11S 7 4.18-7.23 8.78E-02
MAN-BH12D
3 28 41-42 56-76
79 82-86
48-86 6.19E-03
MAN-BH12M 3 28 41-42 12-40 2.65E-02
MAN-BH12S 3 3.50-6.99 8.42E-02
MAN-BH13D 1 18 44-45 58-59 65-78
81 83-86 52.22-86 1.17E-02

MANUNGU Colliery, Life of Mine: Groundwater Impact Assessment Ref:327e DRAFT2 Jul’ 2019
GROUNDWATER SQUARE
Page 36
# = Pumping Test, * = Falling Head Test, (k) = Hydraulic Conductivity
Initial aquifer testing was undertaken during February 2017. Five slug tests were performed on exploration boreholes drilled to intersect basement, immediately south of the active mining area. The chert breccia encountered at the base of the Dwyka Formation or the top of the Transvaal sequence proof difficult to drill, resulting in limited intersections. Due to the casing being pulled after drilling, only one hole that was tested (EF036), featured a chert breccia intersection between 38.38m and 44.73m. A hydraulic conductivity of 0.028m/d was determined for the total saturated zone. An average hydraulic conductivity of 0.046m/d was determined for the saturated zone above coal Seam-1 in the other four exploration boreholes.
Falling head tests were performed on MAN-BH3D and MAN-BH4D during drilling. The test section (26m-41m) in borehole MAN-BH3D featured the contact between the Dwyka Tillite Formation and a sill intrusion. An average hydraulic conductivity of 0.000021m/d was determined for this zone. After completion to end-of-hole depth and a two-week resting period, a slug test performed on this borehole determined a hydraulic conductivity value of 0.00479m/d for the full saturated zone (26m-100m). The test section (36m-61m) in borehole MAN-BH4D featured the contact between the Ecca Group sediments and the Dwyka Tillite Formation, as well as a sill intrusion contact with the latter. An average hydraulic conductivity of 0.00724m/d was determined for this zone. After completion to end-of-hole depth and a two-week resting period, a slug test performed on this borehole determined a hydraulic conductivity value of 0.00571m/d for the full saturated zone (36m-100m).
Slug tests were performed on all the newly commissioned geohydrological boreholes (see Section 4.4) except borehole MAN-BH6D. The bentonite seal in this borehole (cased to 41m) was not effective and water leaking from the upper part of this borehole was falling down the hole.
The test results obtained from the slug tests, falling head tests as well as the pumping tests performed are summarized in Table 5.3A. Statistical analyses of the hydraulic conductivity values determined for the newly commissioned geohydrological boreholes are presented in Tables 5.3B – 5.3D.
Table 5.3B Statistical evaluation of slug test results: Shallow boreholes (7-11m deep)
Site Name Test Interval (m)
Hydraulic Conductivity k (m/day)
Hydraulic Conductivity k (m/day)
MAN-BH2S 4-10.77 6.83E-02 0.068
MAN-BH3S 4.00-10.24 2.05E-02 0.021
MAN-BH4S 6.4-11.09 4.95E-02 0.050
MAN-BH9S 7.82-10.02 3.29E-02 0.033
MAN-BH11S 4.18-7.23 8.78E-02 0.088
MAN-BH12S 3.50-6.99 8.42E-02 0.084
Average 5.72E-02 0.057
Median 5.89E-02 0.059
Harmonic mean 4.37E-02 0.044
Geometric mean 5.06E-02 0.051
Table 5.3C Statistical evaluation of slug test results: Medium boreholes (26-41m deep)
Site Name Test Interval (m)
Hydraulic Conductivity k (m/day)
Hydraulic Conductivity k (m/day)
MAN-BH2M 12-40 2.14E-02 0.021
MAN-BH3M 12-30 2.06E-02 0.021
MAN-BH4M 21-41 3.37E-01 0.337
MAN-BH5M 18-40 3.21E-02 0.032
MAN-BH6M 6-40 3.72E+00 3.720
MAN-BH7M 24-36 8.63E-02 0.086
MAN-BH8M 10-31 2.06E-02 0.021
MAN-BH9M 16-46 3.67E-02 0.037
MAN-BH10M 9-26 2.55E-02 0.026
MAN-BH12M 12-40 2.65E-02 0.027
Average 4.33E-01 0.433
Median 2.98E-02 0.030
Harmonic mean 3.39E-02 0.034
Geometric mean 6.15E-02 0.062
Table 5.3D Statistical evaluation of slug test results: Deep boreholes (86-175m deep)

MANUNGU Colliery, Life of Mine: Groundwater Impact Assessment Ref:327e DRAFT2 Jul’ 2019
GROUNDWATER SQUARE
Page 37
Site Name Test Interval (m)
Hydraulic Conductivity k (m/day)
Hydraulic Conductivity k (m/day)
MAN-BH2D 68-100 68-100# 68-175
8.63E-02 7.88E-02 4.98E-02
0.086 0.079 0.050
MAN-BH3D 26-41* 26-100
2.07E-05 4.79E-03
0.000021 0.005
MAN-BH4D 36-61* 36-100
7.24E-03 5.71E-03
0.007 0.006
MAN-BH6D 41-91# 1.90E-01 0.190
MAN-BH9D 48-96 48-96#
2.84E-01 1.96E-01
0.284 0.196
MAN-BH11D 60-86 60-86#
1.28E-01 1.88E-01
0.128 0.188
MAN-BH12D 48-86 6.19E-03 0.006
MAN-BH13D 52.22-86 1.17E-02 0.012
Average 1.13E-01 0.113
Median 1.28E-01 0.128
Harmonic mean 1.37E-02 0.014
Geometric mean 4.30E-02 0.043
An average hydraulic conductivity of 0.057m/d was determined for the 6 shallow boreholes. The average of the harmonic and geometric mean values for shallow boreholes was 0.047m/d.
An average hydraulic conductivity of 0.433m/d was determined for the 10 medium boreholes. If the one high-yielding borehole is ignored, the average hydraulic conductivity calculates to 0.067m/d. The observed heterogeneity is typical for shallow weathered zone Karoo aquifers. It is the experience of Groundwater Square that the representative hydraulic conductivity for the shallow weathered zone aquifer can be estimated from the harmonic mean and the geometric mean; calculated as 0.048m/d.
The average value of the harmonic and geometric mean values for the shallow boreholes, all the medium boreholes, the medium boreholes without the most significant outlier, as well as the medium boreholes without both obvious outliers, calculated to 0.041m/d.
An average hydraulic conductivity of 0.113m/d was determined for the 8 deep boreholes (slug, falling head and pumping tests). If the three moderate-yielding boreholes are ignored, the average hydraulic conductivity calculates to 0.0071m/d. The average for the 3 moderate-yielding boreholes calculates to 0.197m/day. The average value for all the deep boreholes, the deep boreholes without the outliers and the 3 moderately-yielding boreholes by themselves, calculate to 0.106m/d.
The unique hydraulic conductivity values for each geological unit, are presented in Section 7.6. The major groundwater flow units/aquifers, listed in Tables 7.1A-B and 7.2A-B, were identified and calibrated. Numerical modelling for this study did not indicate that the parameters may be substantially different.
5.4. Groundwater Levels Thematically highlighted groundwater level depth distribution is indicated in Figure 5.6 (see summary of drill locations and initial groundwater levels in Table 5.4)

MANUNGU Colliery, Life of Mine: Groundwater Impact Assessment Ref:327e DRAFT2 Jul’ 2019
GROUNDWATER SQUARE
Page 38
Figure 5.6 Thematic depiction of groundwater level depths(m) for monitoring boreholes
The depth to water table in shallow boreholes (6-11m deep) ranged between 3.0m and 7.8m, averaging at 4.8m.
Medium-depth boreholes in the shallow weathered zone aquifer ranged between 2.8m and 8.2m, averaging at 5.2m. The difference between the depth to water table in the shallow and medium boreholes are insignificant; and are not indicative of perched conditions of any significance.
The depth to water table in deep fractured aquifer ranged between 26.0m and 52.2m, averaging at 36.7m. Interestingly the observed hydraulic head between MAN-BH2D (101m deep) before it was drilled to 175m and after it was deepened differed by 6.11m.
The mining method at Manungu contributes to changes in groundwater levels in the direct vicinity of the mine. This is because, in order to remove coal, groundwater must be pumped out of the mine. Unfortunately, groundwater levels were not recorded in all 2017 hydrogeological boreholes for a while, before Groundwater Square made recommendations in this regard in August 2017. Some monitoring boreholes were equipped with pumps, which made it difficult to measure groundwater levels during this period.
Table 5.4 Drill locations and initial groundwater level

MANUNGU Colliery, Life of Mine: Groundwater Impact Assessment Ref:327e DRAFT2 Jul’ 2019
GROUNDWATER SQUARE
Page 39
Site Name Latitude Longitude Date Water Level
(m)
MAN-BH1 26.2237 28.6990 2014/08/01 15.91
MAN-BH2D 26.2372 28.6790 2018/10/01 40.40
MAN-BH2M 26.2372 28.6790 2018/10/01 8.70
MAN-BH2S 26.2371 28.6790 2018/10/01 6.40
MAN-BH3D 26.2368 28.7038 2018/10/01 31.35
MAN-BH3M 26.2367 28.7038 2018/10/01 5.80
MAN-BH3S 26.2367 28.7038 2018/10/01 4.80
MAN-BH4D 26.2397 28.6945 2018/10/01 43.90
MAN-BH4M 26.2396 28.6945 2018/10/01 8.50
MAN-BH4S 26.2396 28.6945 2018/10/01 8.50
MAN-BH5M 26.2342 28.6834 2017/05/23 4.43
MAN-BH6D 26.2169 28.6839 2018/10/01 31.20
MAN-BH6M 26.2169 28.6839 2018/10/01 5.60
MAN-BH7M 26.2431 28.6829 2018/07/31 7.67
MAN-BH8M 26.2226 28.6995 2018/10/01 2.90
MAN-BH9D 26.2483 28.6981 2018/07/31 44.11
MAN-BH9M 26.2483 28.6981 2018/07/31 8.56
MAN-BH9S 26.2484 28.6981 2018/07/31 8.36
MAN-BH10M 26.2409 28.7063 2018/07/31 3.62
MAN-BH11D 26.2479 28.6878 2018/07/31 30.12
MAN-BH11S 26.2479 28.6878 2018/07/31 5.21
MAN-BH12D 26.2569 28.6783 2018/07/31 40.42
MAN-BH12M 26.2569 28.6783 2018/07/31 4.55
MAN-BH12S 26.2569 28.6783 2018/07/31 4.32
MAN-BH13D 26.2656 28.6747 2018/07/31 52.08

MANUNGU Colliery, Life of Mine: Groundwater Impact Assessment Ref:327e DRAFT2 Jul’ 2019
GROUNDWATER SQUARE
Page 40
5.5. Groundwater Potential Contaminants The main indicator for groundwater contamination is sulphate. During the various stages of geochemical transformation, sulphate will be associated with sodium, calcium and magnesium. Total Dissolved Solids (TDS) or Electrical Conductivity (EC), indicates the total salt load.
Other contaminant indicators associated with sulphate, are pH levels. When low-pH conditions prevail, increased metals concentrations may manifest, such as iron (but they also include additional metals as indicated in the geochemical assessment, Appendix VI).
5.6. Groundwater Quality The hydrochemistry can be discussed at hand of the samples taken during the recent hydrocensus as well as the samples taken after the two drilling phases and during the pumping tests.
The water quality compliance and distribution will be discussed using Standards South Africa’s, (a division of SABS) specification for Drinking Water, SANS 241-1:2015 Edition 2, as compliance criteria.
For visual inspection of hydro-chemical data the results of the analysis were plotted on tri-linear Piper Durov and Expanded Durov diagrams (Figures 5.9A-D). The diagrams permit the cation and anion compositions of samples to be represented on single graphs in which major groupings or trends in the data can be discerned visually.
Table 5.5A indicates the measured physical, macro and micro-determinants for the samples taken from the external users’ boreholes, during the revisit of the hydrocensus, all to be compliant with the SANS 241-1:2015 physical, aesthetic and chemical numerical limits for lifetime consumption except for the following exceedances:
• The nitrate concentrations for boreholes MBH13, MBH29, MBH47, KGA14 and KGA15 all exceeded the acute health limit;
• Borehole MBH29 also exceeded the aesthetic and acute health limits for EC, TDS, Cl and SO4. Elevated sulphate concentrations were noted for MBH31 (72.3mg/L) and MBH47 (127mg/L). Elevated chloride concentrations (>42) were noted for boreholes MBH6, 17, 25, 31, 36A, 40, 45, 46 and MBH47. Elevated sodium concentrations (>100mg/L) were noted for MBH12 and MBH17.
The hydrocensus (revisit) samples all exhibit a calcium / magnesium bicarbonate character and plot as unpolluted on the Expanded Durov Diagram (except for MBH12, 17 and 36A, which exhibit a sodium / potassium bicarbonate character, as well as MBH29, which is representative of a calcium / sodium sulphate water and a sample from MBH5 with a magnesium sulphate character.
Table 5.5B indicates the measured physical, macro and micro-determinants for the samples taken from the newly commissioned geohydrological boreholes, all to be compliant with the SANS 241-1:2015 physical, aesthetic and chemical numerical limits for lifetime consumption except for the following exceedances:
• The nitrate concentrations for boreholes MAN-BH9M&S exceeded the acute health limit; • The ammonia concentrations for boreholes MAN-BH2M&S, MAN-BH4S, MAN-BH5M, 8M, 9M,
10M as well as MAN-BH12D, M&S exceeded the aesthetic limit. An elevated sulphate concentration (92.61mg/L) was noted for MAN-BH12S. Elevated chloride concentrations (>42) were noted for boreholes MAN-BH11D & S, as well as MAN-BH12S and MAN-BH13D. Elevated sodium concentrations (>100mg/L) were noted for MAN-BH2D (stratified sample), MAN-BH11D, 12D and 13D. The sodium concentration for the sample taken from MAN-BH2D towards the end of the constant discharge test performed on this borehole was reported as 76.6mg/L.
The average TDS for the shallow boreholes (7-11m deep) calculated to 274mg/L, while the average for the medium (26-41m deep) and deep boreholes (86-175m deep, respectively calculated to 231.93mg/L and 410.63mg/L.
The samples from the shallow boreholes exhibit a calcium/magnesium bicarbonate character and plot as unpolluted on the Expanded Durov Diagram.
The samples from the medium boreholes exhibit a calcium/magnesium bicarbonate character and plot as unpolluted on the Expanded Durov Diagram, except for MAN-BH12M, which exhibits a sodium / potassium bicarbonate character.

MANUNGU Colliery, Life of Mine: Groundwater Impact Assessment Ref:327e DRAFT2 Jul’ 2019
GROUNDWATER SQUARE
Page 41
In terms of the deep boreholes, only MAN-BH4D, MAN-BH9D and MAN-BH6D exhibit a calsium / magnesium bicarbonate character and plot as unpolluted on the Expanded Durov Diagram. The plotting positions of the rest (MAN-BH2D, 3D, 11D, 12D & 13D) exhibits a sodium / potassium bicarbonate character.
Except for borehole MBH29 and apart from the noted exceedances for nitrate, the external users’ groundwater quality is generally of a good quality. The noted exceedances and elevated concentrations are attributed to agricultural and domestic impacts.
In terms of the newly commissioned boreholes, apart from the noted exceedances for nitrate and ammonia, the groundwater quality is generally of a good quality. The noted exceedances and elevated concentrations are also attributed to agricultural and domestic impacts.
Figure 5.8 pH, Electrical conductivity (mS/m), pH and Sulphate (mg/L) concentration for
monitoring boreholes

MANUNGU Colliery, Life of Mine: Groundwater Impact Assessment Ref:327e DRAFT2 Jul’ 2019
GROUNDWATER SQUARE
Page 42
Piper Diagram
Durov Diagram
Expanded Durov Diagram
Figure 5.9A Piper/Durov/Expanded Durov plots of Hydrocensus qualities
KAM01 KGA14 KGA15 MAN-BH1 MBH01
MBH12 MBH13 MBH15 MBH17 MBH20 MBH25 MBH27 MBH29 MBH31 MBH32 MBH35 MBH36A
MBH4
MBH40 MBH41 MBH45 MBH46 MBH47
MBH5 MBH6

MANUNGU Colliery, Life of Mine: Groundwater Impact Assessment Ref:327e DRAFT2 Jul’ 2019
GROUNDWATER SQUARE
Page 43
Piper Diagram
.
Durov Diagram
Expanded Durov Diagram
Figure 5.9B Piper/Durov/Expanded Durov plots of shallow groundwater borehole water qualities
MAN-BH11S
MAN-BH2S MAN-BH3S
MAN-BH12S
MAN-BH4S MAN-BH9S

MANUNGU Colliery, Life of Mine: Groundwater Impact Assessment Ref:327e DRAFT2 Jul’ 2019
GROUNDWATER SQUARE
Page 44
Piper Diagram
Durov Diagram
Expanded Durov Diagram
Figure 5.9C Piper/Durov/Expanded Durov plots of medium groundwater borehole water qualities
MAN-BH10M
MAN-BH2M MAN-BH3M MAN-BH4M MAN-BH5M MAN-BH6M MAN-BH7M MAN-BH8M MAN-BH9M
MAN-BH12M

MANUNGU Colliery, Life of Mine: Groundwater Impact Assessment Ref:327e DRAFT2 Jul’ 2019
GROUNDWATER SQUARE
Page 45
Piper Diagram
.
Durov Diagram
Expanded Durov Diagram
Figure 5.9D Piper/Durov/Expanded Durov plots of deep groundwater borehole water qualities
MAN-BH11D MAN-BH12D MAN-BH13D
MAN-BH2D MAN-BH3D MAN-BH4D MAN-BH6D MAN-BH9D

MANUNGU Colliery, Life of Mine: Groundwater Impact Assessment Ref:327e DRAFT2 May’ 2019
GROUNDWATER SQUARE
Page 46
Table 5.5A Water Quality Results: Hydro-census
MBH1 MBH6 MBH12 MBH13 MBH15 MBH17 MBH18B MBH20 MBH25 MBH27 SANS 241-1:2015 Standard Limits
Sample date 22/03/2017 13/03/2017 14/03/2017 14/03/2017 14/03/2017 22/03/2017 14/03/2017 15/03/2017 20/03/2017 22/03/2017
pH – Value 7.04 7.46 7.86 7.73 7.81 7.81 7.78 7.44 7.53 6.99 ≥ 5.0 to ≤ 9.5
Electrical Conductivity (EC mS/m)
35.40 60.60 66.90 74.80 72.20 131.00 38.30 31.80 93.60 40.30 ≤ 170
Total Dissolved Solids (TDS mg/L)
198.25 312.39 356.39 420.99 389.48 725.23 187.52 171.32 494.32 206.87 ≤ 1200
Calcium (Ca mg/L) 25.80 62.10 15.66 99.70 59.47 47.10 32.40 22.36 60.10 40.40
Magnesium (Mg mg/L) 13.70 17.20 14.17 20.30 23.17 29.90 16.10 10.93 36.70 12.50
Sodium (Na mg/L) 12.60 20.20 104.00 15.30 49.02 197.00 16.30 18.90 77.50 22.00 ≤ 200
Potassium (K mg/L) 7.23 9.88 2.82 5.25 9.24 5.31 3.69 5.81 4.30 1.94
Silicon (Si mg/L) 31.10 22.00 5.19 22.30 15.80 7.58 6.61 29.10 11.50 16.40
Total Alkalinity (mg/L) 78.80 198.00 308.00 251.00 330.00 542.00 161.00 119.00 370.00 191.00
Chloride (Cl mg/L) 17.10 48.10 21.40 38.40 13.90 83.40 13.20 9.76 56.10 4.82 ≤ 300
Sulphate (SO4 mg/L) 29.80 9.56 11.40 21.00 20.70 32.70 9.09 3.83 23.20 10.60 ≤ 500
Nitrate as N (mg/L) 10.10 5.99 0.36 15.90 3.58 0.97 <0.35 6.33 3.22 <0.35 ≤ 11
Fluoride (F mg/L) <0.09 <0.09 0.52 <0.09 0.12 0.32 0.14 0.11 0.15 <0.09 ≤ 1.50
Chemical Oxygen Demand (COD mg/L)
<1.00 3.00 3.00 <1.00 6.00 6.00 1.00 <1.00 4.00 <1.00
Oxygen Absorbed (AO4 mg/L)
Oxygen Dissolved (DO mg/L)
6.49 6.62 6.64 6.71 6.83 6.78 6.68 6.81 6.82 6.77
Ammonia as Ammonium (N mg/L)
<0.450 <0.450 <0.450 <0.450 <0.450 <0.450 <0.450 <0.450 <0.450 <0.450 ≤ 1.5
Phosphate as P (mg/L)
<0.03 <0.03 <0.03 <0.03 <0.03 <0.03 <0.03 0.05 <0.03 <0.03
Aluminium (Al ppm) <0.01 <0.01 <0.01 <0.01 <0.01 <0.01 <0.01 <0.01 <0.01 <0.01 ≤ 0.30
Arsenic (As ppm) <0.01 <0.01 0.01 0.01 0.01 0.02 0.01 <0.01 0.01 0.01 ≤ 0.01
Chromium (Cr mg/L) <0.01 <0.01 <0.01 <0.01 <0.01 <0.01 <0.01 <0.01 <0.01 <0.01 ≤ 0.05
Cobalt (Co mg/L) <0.01 <0.01 <0.01 <0.01 <0.01 <0.01 <0.01 <0.01 <0.01 <0.01 ≤ 0.5
Copper (Cu mg/L) <0.01 <0.01 <0.01 <0.01 <0.01 <0.01 <0.01 <0.01 <0.01 <0.01 ≤ 2
Cyanide (CN mg/L) 0.01 0.01 0.01 0.01 0.01 0.01 0.01 <0.01 <0.01 0.01 ≤ 0.2
Iron (Fe mg/L) <0.01 <0.01 <0.01 <0.01 <0.01 <0.01 <0.01 <0.01 <0.01 <0.01 ≤ 2
Lead (Pb mg/L) <0.01 <0.01 <0.01 <0.01 <0.01 <0.01 <0.01 <0.01 <0.01 <0.01 ≤ 0.01
Manganese (Mn mg/L)
<0.01 <0.01 <0.01 <0.01 <0.01 <0.01 <0.01 <0.01 <0.01 0.01 ≤ 0.4
Nickle (Ni mg/L) <0.01 <0.01 <0.01 <0.01 <0.01 <0.01 <0.01 <0.01 <0.01 <0.01 ≤ 0.07
Uranium (U mg/L) <0.01 <0.01 <0.01 <0.01 <0.01 <0.01 <0.01 <0.01 <0.01 <0.01 ≤ 0.03
Zinc (Z mg/L <0.01 0.01 0.02 <0.01 <0.01 <0.01 <0.01 0.02 0.01 <0.01 ≤ 5

MANUNGU Colliery, Life of Mine: Groundwater Impact Assessment Ref:327e DRAFT2 May’ 2019
GROUNDWATER SQUARE
Page 47
Ion Difference (%) -0.04 -0.03 -0.04 -0.01 -0.03 -0.02 0.00 -0.03 -0.01 -0.01
Table 5.5A Water Quality Results: Hydro-census (continued)
MBH29 MBH31 MBH32 MBH35 MBH36A MBH40 MBH41 MBH45 MBH46 MBH47 SANS 241<1:2015
Standard Limits
Sample date 20/03/2017 20/03/2017 14/03/2017 20/03/2017 20/03/2017 14/03/2017 15/03/2017 20/03/2017 20/03/2017 20/03/2017
pH – Value 7.79 7.79 7.48 7.21 7.61 7.67 7.31 7.43 7.88 7.81 ≥ 5.0 to ≤ 9.5
Electrical Conductivity (EC mS/m)
325.00 74.00 63.00 44.70 87.90 76.30 22.90 123.00 67.30 116.00 ≤ 170
Total Dissolved Solids (TDS mg/L)
2166.30 378.43 332.88 236.23 449.08 405.47 124.47 660.20 335.78 676.20 ≤ 1200
Calcium (Ca mg/L) 302.00 52.27 59.30 35.30 36.80 70.37 15.52 140.00 44.10 99.20
Magnesium (Mg mg/L) 259.00 33.26 21.40 17.00 25.90 25.97 11.88 43.00 28.70 65.80
Sodium (Na mg/L) 76.00 39.34 25.50 18.80 98.20 44.32 8.83 38.20 38.70 33.40 ≤ 200
Potassium (K mg/L) 1.53 2.75 7.10 5.45 4.89 2.06 2.77 1.47 3.11 2.61
Silicon (Si mg/L) 23.30 15.90 21.40 21.60 9.53 12.30 25.10 20.60 13.70 24.70
Total Alkalinity (mg/L) 435.00 239.00 232.00 146.00 346.00 301.00 89.60 357.00 218.00 316.00
Chloride (Cl mg/L) 545.62 72.30 34.30 24.40 54.10 46.40 3.66 153.00 64.40 87.70 ≤ 300
Sulphate (SO4 mg/L) 516.92 8.22 23.80 16.40 20.60 24.20 3.89 34.80 8.38 127.00 ≤ 500
Nitrate as N (mg/L) 46.10 6.07 5.03 7.06 <0.35 2.54 5.43 8.02 3.97 16.00 ≤ 11
Fluoride (F mg/L) <0.09 <0.09 <0.09 <0.09 0.31 0.12 0.11 <0.09 <0.09 <0.09 ≤ 1.50
Chemical Oxygen Demand (COD mg/L)
14.00 <1.00 2.00 <1.00 1.00 2.00 3.00 2.00 5.00 4.00
Oxygen Absorbed (AO4 mg/L)
Oxygen Dissolved (DO mg/L)
6.80 6.81 6.75 6.60 6.82 6.71 6.87 6.81 6.77 6.88
Ammonia as Ammonium (N mg/L)
<0.450 <0.450 <0.450 <0.450 0.520 <0.450 <0.450 <0.450 <0.450 <0.450 ≤ 1.5
Phosphate as P (mg/L)
<0.03 <0.03 <0.03 <0.03 <0.03 <0.03 <0.03 <0.03 <0.03 <0.03
Aluminium (Al ppm) <0.01 <0.01 <0.01 <0.01 <0.01 <0.01 <0.01 <0.01 <0.01 <0.01 ≤ 0.30
Arsenic (As ppm) 0.01 0.01 0.01 0.01 0.01 0.01 <0.01 0.01 0.01 0.01 ≤ 0.01
Chromium (Cr mg/L) <0.01 <0.01 <0.01 <0.01 <0.01 <0.01 <0.01 <0.01 <0.01 <0.01 ≤ 0.05
Cobalt (Co mg/L) <0.01 <0.01 <0.01 <0.01 <0.01 <0.01 <0.01 <0.01 <0.01 0.05 ≤ 0.5
Copper (Cu mg/L) <0.01 <0.01 <0.01 <0.01 0.01 <0.01 <0.01 <0.01 <0.01 <0.01 ≤ 2
Cyanide (CN mg/L) 0.01 <0.01 0.02 0.01 0.05 0.01 <0.01 <0.01 <0.01 <0.01 ≤ 0.2
Iron (Fe mg/L) <0.01 <0.01 <0.01 <0.01 0.01 <0.01 <0.01 <0.01 <0.01 <0.01 ≤ 2
Lead (Pb mg/L) <0.01 <0.01 <0.01 <0.01 <0.01 <0.01 <0.01 <0.01 <0.01 <0.01 ≤ 0.01
Manganese (Mn mg/L)
<0.01 <0.01 <0.01 <0.01 <0.01 <0.01 <0.01 <0.01 <0.01 <0.01 ≤ 0.4
Nickle (Ni mg/L) <0.01 <0.01 <0.01 <0.01 <0.01 <0.01 <0.01 <0.01 <0.01 <0.01 ≤ 0.07

MANUNGU Colliery, Life of Mine: Groundwater Impact Assessment Ref:327e DRAFT2 May’ 2019
GROUNDWATER SQUARE
Page 48
Uranium (U mg/L) <0.01 <0.01 <0.01 <0.01 <0.01 <0.01 <0.01 <0.01 <0.01 <0.01 ≤ 0.03
Zinc (Z mg/L 0.01 0.01 <0.01 <0.01 <0.01 0.18 <0.01 <0.01 <0.01 0.01 ≤ 5
Ion Difference (%) 0.02 -0.02 -0.03 -0.04 -0.03 -0.02 -0.03 -0.02 -0.02 -0.03
Table 5.5A Water Quality Results: Hydro-census (continued)
B2N073 KAM01 KGA14 KGA15 SANS 241-1:2015 Standard Limits
Sample date 13/03/2017 13/03/2017 13/03/2017 13/03/2017
pH – Value 9.43 7.22 7.84 7.77 ≥ 5.0 to ≤ 9.5
Electrical Conductivity (EC mS/m)
33.40 72.80 54.60 62.80 ≤ 170
Total Dissolved Solids (TDS mg/L)
175.52 374.49 300.58 346.73 ≤ 1200
Calcium (Ca mg/L) 2.58 36.67 52.50 58.20
Magnesium (Mg mg/L) 12.41 21.11 24.80 33.40
Sodium (Na mg/L) 46.60 73.80 13.10 11.90 ≤ 200
Potassium (K mg/L) 1.26 3.16 4.11 3.25
Silicon (Si mg/L) 4.56 13.70 19.20 19.30
Total Alkalinity (mg/L) 91.80 235.00 211.00 230.00
Chloride (Cl mg/L) 13.26 55.80 15.20 18.00 ≤ 300
Sulphate (SO4 mg/L) 12.34 42.60 4.91 7.76 ≤ 500
Nitrate as N (mg/L) 3.39 <0.35 13.40 17.20 ≤ 11
Fluoride (F mg/L) 0.18 0.31 <0.09 <0.09 ≤ 1.50
Chemical Oxygen Demand (COD mg/L)
4.00 4.00 <1 3.00
Oxygen Absorbed (AO4 mg/L)
Oxygen Dissolved (DO mg/L)
6.88 6.77 6.73 6.76
Ammonia as Ammonium (N mg/L)
<0.45 <0.45 <0.45 <0.45 ≤ 1.5
Phosphate as P (mg/L)
<0.03 <0.03 <0.03 <0.03
Aluminium (Al ppm) <0.01 <0.01 <0.01 <0.01 ≤ 0.30
Arsenic (As ppm) <0.005 0.01 <0.005 <0.005 ≤ 0.01
Chromium (Cr mg/L) <0.01 <0.01 <0.01 <0.01 ≤ 0.05
Cobalt (Co mg/L) <0.01 <0.01 <0.01 <0.01 ≤ 0.5
Copper (Cu mg/L) <0.01 <0.01 <0.01 <0.01 ≤ 2
Cyanide (CN mg/L) <0.01 <0.01 <0.01 <0.01 ≤ 0.2
Iron (Fe mg/L) <0.01 <0.01 <0.01 <0.01 ≤ 2
Lead (Pb mg/L) <0.01 <0.01 <0.01 <0.01 ≤ 0.01

MANUNGU Colliery, Life of Mine: Groundwater Impact Assessment Ref:327e DRAFT2 May’ 2019
GROUNDWATER SQUARE
Page 49
Manganese (Mn mg/L)
<0.01 0.04 <0.01 <0.01 ≤ 0.4
Nickle (Ni mg/L) <0.01 <0.01 <0.01 <0.01 ≤ 0.07
Uranium (U mg/L) <0.01 <0.01 <0.01 <0.01 ≤ 0.03
Zinc (Z mg/L <0.01 <0.01 <0.01 0.02 ≤ 5
Ion Difference (%) -0.01 -0.02 -0.03 -0.02
Table 5.5B Water Quality Results: Newly commissioned boreholes
MAN-BH2D MAN-BH2D MAN-BH2M MAN-BH2S MAN-BH3D MAN-BH3M MAN-BH3S MAN-BH4D MAN-BH4M MAN-BH4S SANS 241-1:2015 Standard Limits
Sample date 23/05/2017 03/07/2017 23/05/2017 23/05/2017 23/05/2017 23/05/2017 23/05/2017 23/05/2017 23/05/2017 23/05/2017
pH – Value 9.33 7.23 8.19 9.19 8.36 7.23 7.87 7.99 7.16 8.08 ≥ 5.0 to ≤ 9.5
Electrical Conductivity (EC mS/m)
70.30 68.80 34.40 21.20 55.40 36.10 24.20 37.10 33.70 27.00 ≤ 170
Total Dissolved Solids (TDS mg/L)
389.12 361.69 175.33 109.44 300.93 188.95 125.35 196.16 167.44 135.28 ≤ 1200
Calcium (Ca mg/L) 0.28 43.50 30.62 12.00 15.00 27.10 15.50 29.50 26.78 18.30
Magnesium (Mg mg/L) 0.16 15.10 11.48 6.76 15.50 15.50 10.30 18.40 14.51 11.70
Sodium (Na mg/L) 163.00 76.60 15.04 13.00 77.80 25.10 14.80 18.00 15.10 8.29 ≤ 200
Potassium (K mg/L) 4.36 2.76 4.56 4.54 5.47 6.61 3.08 8.31 9.69 10.10
Silicon (Si mg/L) 0.34 9.60 5.38 0.14 4.92 14.60 1.21 10.80 15.90 1.24
Total Alkalinity (mg/L) 318.00 326.00 140.00 66.80 225.00 169.00 67.60 168.00 154.00 115.00
Chloride (Cl mg/L) 22.80 17.40 11.52 13.70 20.20 6.70 16.50 4.88 3.58 5.94 ≤ 300
Sulphate (SO4 mg/L) 5.40 2.64 7.74 12.20 30.50 6.24 23.40 9.36 4.24 8.39 ≤ 500
Nitrate as N (mg/L) <0.35 1.73 1.64 0.51 <0.35 <0.35 <0.35 1.54 <0.35 <0.35 ≤ 11
Fluoride (F mg/L) 1.37 0.36 0.11 0.21 0.82 0.17 0.26 <0.09 0.11 0.16 ≤ 1.50
Chemical Oxygen Demand (COD mg/L)
4.00 1.00 4.00 4.00 2.00 <1 2.00 3.00 <1 <1
Oxygen Absorbed (AO4 mg/L)
1.36 <0.02 3.06 0.30 1.40 <0.1 0.98 1.04 0.08 <0.02
Oxygen Dissolved (DO mg/L)
5.82 6.88 6.78 6.84 5.91 7.25 5.64 5.88 5.24 5.28
Ammonia as Ammonium (N mg/L)
0.670 <0.45 2.300 3.190 0.490 <0.45 0.670 <0.45 0.640 2.520 ≤ 1.5
Phosphate as P (mg/L)
<0.03 <0.03 <0.03 0.18 <0.03 <0.03 <0.03 <0.03 <0.03 <0.03
Aluminium (Al ppm) 0.05 0.04 <0.01 <0.01 0.01 <0.01 <0.01 <0.01 <0.01 <0.01 ≤ 0.30
Arsenic (As ppm) <0.005 <0.005 <0.005 <0.005 <0.005 <0.005 <0.005 <0.005 <0.005 <0.005 ≤ 0.01
Chromium (Cr mg/L) <0.01 <0.01 <0.01 <0.01 <0.01 <0.01 <0.01 <0.01 <0.01 <0.01 ≤ 0.05
Cobalt (Co mg/L) <0.01 <0.01 <0.01 <0.01 <0.01 <0.01 <0.01 <0.01 <0.01 <0.01 ≤ 0.5
Copper (Cu mg/L) <0.01 <0.01 <0.01 <0.01 <0.01 <0.01 <0.01 <0.01 <0.01 <0.01 ≤ 2
Cyanide (CN mg/L) <0.01 <0.01 <0.01 <0.01 <0.01 <0.01 <0.01 <0.01 <0.01 <0.01 ≤ 0.2

MANUNGU Colliery, Life of Mine: Groundwater Impact Assessment Ref:327e DRAFT2 May’ 2019
GROUNDWATER SQUARE
Page 50
Iron (Fe mg/L) 0.04 0.03 0.01 0.02 <0.01 <0.01 0.01 0.07 <0.01 <0.01 ≤ 2
Lead (Pb mg/L) <0.01 <0.01 <0.01 <0.01 <0.01 <0.01 <0.01 <0.01 <0.01 <0.01 ≤ 0.01
Manganese (Mn mg/L)
<0.01 <0.01 0.02 <0.01 <0.01 0.13 0.08 0.02 0.20 0.15 ≤ 0.4
Nickle (Ni mg/L) <0.01 <0.01 <0.01 <0.01 <0.01 <0.01 <0.01 <0.01 <0.01 <0.01 ≤ 0.07
Uranium (U mg/L) <0.01 <0.01 <0.01 <0.01 <0.01 <0.01 <0.01 <0.01 <0.01 <0.01 ≤ 0.03
Zinc (Z mg/L <0.01 <0.01 <0.01 <0.01 <0.01 <0.01 <0.01 <0.01 <0.01 <0.01 ≤ 5
Ion Difference (%) 0.01 -0.027 0.00 0.01 -0.014 0.03 0.02 0.03 0.03 0.01
Table 5.5B Water Quality Results: Newly commissioned boreholes (continued)
MAN-BH5M MAN-BH6D MAN-BH6D MAN-BH6M MAN-BH7M MAN-BH8M MAN-BH9D MAN-BH9D MAN-BH9M MAN-BH9S SANS 241-1:2015 Standard Limits
Sample date 23/05/2017 23/05/2017 28/06/2017 23/05/2017 22/08/2017 22/08/2017 15/09/2017 16/09/2017 23/08/2017 23/08/2017
pH – Value 8.79 7.87 7.23 7.49 8.08 7.61 7.32 8.14 7.88 8.05 ≥ 5.0 to ≤ 9.5
Electrical Conductivity (EC mS/m)
31.40 42.10 68.40 37.90 40.40 56.10 43.50 45.80 39.60 36.40 ≤ 170
Total Dissolved Solids (TDS mg/L)
173.67 227.62 351.08 231.18 203.55 299.84 222.55 246.41 234.79 212.70 ≤ 1200
Calcium (Ca mg/L) 17.00 22.30 48.60 33.30 29.40 33.80 27.20 38.52 34.10 28.31
Magnesium (Mg mg/L) 10.90 11.60 17.40 17.40 13.90 21.90 25.80 20.76 17.11 14.20
Sodium (Na mg/L) 19.10 45.40 63.30 15.20 23.60 43.20 18.10 28.11 12.23 9.31 ≤ 200
Potassium (K mg/L) 9.06 3.47 2.71 4.86 9.99 6.36 4.72 2.19 9.17 8.58
Silicon (Si mg/L) 1.44 14.30 10.40 23.40 1.19 6.01 6.50 0.23 10.66 2.81
Total Alkalinity (mg/L) 108.00 152.00 323.00 108.00 181.00 279.00 186.00 221.00 132.00 68.80
Chloride (Cl mg/L) 12.90 14.10 16.40 8.59 8.65 8.47 18.20 12.08 23.90 21.97 ≤ 300
Sulphate (SO4 mg/L) 19.60 13.50 <0.5 36.50 5.73 12.80 3.88 4.87 3.91 6.15 ≤ 500
Nitrate as N (mg/L) 3.25 5.71 1.93 11.40 0.76 0.44 2.53 1.41 11.22 18.50 ≤ 11
Fluoride (F mg/L) 0.16 0.51 0.27 <0.09 <0.09 0.10 0.72 0.57 <0.09 0.26 ≤ 1.50
Chemical Oxygen Demand (COD mg/L)
<1 <1 <1 <1 34.00 3.00 2.00 <1 4.00 7.00
Oxygen Absorbed (AO4 mg/L)
0.40 0.66 <0.02 1.58 1.30 <0.02
Oxygen Dissolved (DO mg/L)
6.31 7.11 6.94 6.99 6.10 6.02 7.85 6.97 6.41 5.70
Ammonia as Ammonium (N mg/L)
4.450 <0.45 <0.45 <0.45 <0.45 2.870 0.630 3.410 <0.45 ≤ 1.5
Phosphate as P (mg/L)
<0.03 0.05 <0.03 <0.03 <0.03 <0.03 0.06 0.04 <0.03 <0.03
Aluminium (Al ppm) <0.01 <0.01 0.03 <0.01 0.03 <0.01 0.01 <0.01 0.01 0.15 ≤ 0.30
Arsenic (As ppm) <0.005 <0.005 <0.005 <0.005 <0.005 <0.005 <0.005 <0.005 <0.005 <0.005 ≤ 0.01
Chromium (Cr mg/L) <0.01 <0.01 <0.01 <0.01 <0.01 <0.01 <0.01 <0.01 <0.01 <0.01 ≤ 0.05
Cobalt (Co mg/L) <0.01 <0.01 <0.01 <0.01 <0.01 <0.01 <0.01 <0.01 <0.01 <0.01 ≤ 0.5

MANUNGU Colliery, Life of Mine: Groundwater Impact Assessment Ref:327e DRAFT2 May’ 2019
GROUNDWATER SQUARE
Page 51
Copper (Cu mg/L) <0.01 <0.01 <0.01 <0.01 <0.01 <0.01 <0.01 <0.01 <0.01 <0.01 ≤ 2
Cyanide (CN mg/L) <0.01 <0.01 <0.01 <0.01 <0.01 <0.01 ≤ 0.2
Iron (Fe mg/L) <0.01 0.06 0.02 0.03 0.24 <0.01 0.08 0.02 1.04 0.51 ≤ 2
Lead (Pb mg/L) <0.01 <0.01 <0.01 <0.01 <0.01 <0.01 <0.01 <0.01 <0.01 <0.01 ≤ 0.01
Manganese (Mn mg/L)
0.01 0.03 <0.01 <0.01 0.04 0.16 0.04 0.02 0.03 0.03 ≤ 0.4
Nickle (Ni mg/L) <0.01 <0.01 <0.01 <0.01 <0.01 <0.01 <0.01 <0.01 <0.01 <0.01 ≤ 0.07
Uranium (U mg/L) <0.01 <0.01 <0.01 <0.01 <0.01 <0.01 <0.01 <0.01 <0.01 <0.01 ≤ 0.03
Zinc (Z mg/L <0.01 <0.01 <0.01 <0.01 <0.01 <0.01 <0.01 <0.01 <0.01 <0.01 ≤ 5
Ion Difference (%) -0.01 0.00 -0.03 -0.01 -0.01 -0.03 -0.01 0.00 0.00 -0.03
Table 5.5B Water Quality Results: Newly commissioned boreholes (continued)
MAN-BH10M MAN-BH11D MAN-BH11D MAN-BH11S MAN-BH12D MAN-BH12M MAN-BH12S MAN-BH13D SANS 241-1:2015 Standard Limits
Sample date 22/08/2017 15/08/2017 23/08/2017 23/08/2017 22/08/2017 22/08/2017 22/08/2017 22/08/2017
pH – Value 7.26 8.47 8.78 7.20 8.74 8.02 7.92 8.76 ≥ 5.0 to ≤ 9.5
Electrical Conductivity (EC mS/m)
52.80 116.00 116.00 95.90 124.00 66.30 103.00 125.00 ≤ 170
Total Dissolved Solids (TDS mg/L)
289.22 678.63 616.91 526.52 651.66 355.39 537.95 684.84 ≤ 1200
Calcium (Ca mg/L) 53.40 3.53 2.20 143.00 1.61 31.20 45.60 2.84
Magnesium (Mg mg/L) 22.80 2.19 0.99 26.30 0.68 19.50 37.00 1.69
Sodium (Na mg/L) 15.40 277.21 249.00 14.40 271.00 74.80 99.30 260.27 ≤ 200
Potassium (K mg/L) 2.70 3.44 3.69 7.31 2.98 5.33 4.42 6.78
Silicon (Si mg/L) 10.30 3.52 1.95 6.02 4.35 2.69 2.90 26.18
Total Alkalinity (mg/L) 181.00 559.80 509.00 270.00 538.00 288.00 297.00 562.00
Chloride (Cl mg/L) 11.00 53.30 53.84 156.25 25.40 22.60 77.22 42.90 ≤ 300
Sulphate (SO4 mg/L) 29.40 <0.5 0.99 14.07 21.10 20.49 92.61 9.23 ≤ 500
Nitrate as N (mg/L) 9.84 <0.35 <0.35 0.35 0.86 0.99 <0.35 <0.35 ≤ 11
Fluoride (F mg/L) <0.09 1.86 <0.09 <0.09 0.19 <0.09 <0.09 7.40 ≤ 1.50
Chemical Oxygen Demand (COD mg/L)
6.00 13.00 0.00 85.00 8.00 0.00 11.00 32.00
Oxygen Absorbed (AO4 mg/L)
0.30
Oxygen Dissolved (DO mg/L)
6.38 6.62 6.02 4.74 6.68 6.38 6.15 6.59
Ammonia as Ammonium (N mg/L)
1.670 0.830 <0.45 <0.45 1.610 1.617 2.683 0.750 ≤ 1.5
Phosphate as P (mg/L) <0.03 0.03 <0.03 <0.03 <0.03 <0.03 <0.03 0.04
Aluminium (Al ppm) <0.01 0.02 0.05 <0.01 0.01 0.07 <0.01 14.46 ≤ 0.30
Arsenic (As ppm) <0.005 0.01 <0.005 <0.005 <0.005 <0.005 <0.005 <0.005 ≤ 0.01
Chromium (Cr mg/L) <0.01 <0.01 <0.01 <0.01 <0.01 <0.01 <0.01 <0.01 ≤ 0.05

MANUNGU Colliery, Life of Mine: Groundwater Impact Assessment Ref:327e DRAFT2 May’ 2019
GROUNDWATER SQUARE
Page 52
Cobalt (Co mg/L) <0.01 <0.01 <0.01 <0.01 <0.01 <0.01 <0.01 <0.01 ≤ 0.5
Copper (Cu mg/L) <0.01 <0.01 <0.01 <0.01 <0.01 <0.01 <0.01 <0.01 ≤ 2
Cyanide (CN mg/L) <0.01 ≤ 0.2
Iron (Fe mg/L) <0.01 0.04 0.75 0.64 <0.01 2.08 <0.01 0.99 ≤ 2
Lead (Pb mg/L) <0.01 <0.01 <0.01 <0.01 <0.01 <0.01 <0.01 <0.01 ≤ 0.01
Manganese (Mn mg/L) 0.17 <0.01 <0.01 1.00 <0.01 0.06 0.14 <0.01 ≤ 0.4
Nickle (Ni mg/L) <0.01 <0.01 <0.01 <0.01 <0.01 <0.01 <0.01 <0.01 ≤ 0.07
Uranium (U mg/L) <0.01 <0.01 <0.01 <0.01 <0.01 <0.01 <0.01 <0.01 ≤ 0.03
Zinc (Z mg/L <0.01 <0.01 <0.01 <0.01 <0.01 <0.01 <0.01 <0.01 ≤ 5
Ion Difference (%) 0.02 -0.01 -0.03 0.00 0.00 -0.01 0.00 0.02

MANUNGU Colliery, Life of Mine: Groundwater Impact Assessment Ref:327e DRAFT2 Jul’ 2019
GROUNDWATER SQUARE
Page 53
6. AQUIFER CHARACTERISATION
6.1. Groundwater Vulnerability The aquifer(s) underlying the study area were classified in accordance with “A South African Aquifer System Management Classification, WRC Report No KV 77/95, December 1995.”
With reference to the Map: Aquifer Classification of South Africa, the following regional characteristics:
The vulnerability, or the tendency or likelihood for contamination to reach a specified position in the groundwater system after introduction at some location above the uppermost aquifer is classified as moderate.
Aquifer susceptibility, a qualitative measure of the relative ease with which a groundwater body can be potentially contaminated by anthropogenic activities and which includes both aquifer vulnerability and the relative importance of the aquifer in terms of its classification is classified as medium.
6.2. Aquifer Classification Classification was done in accordance with the following definitions for Aquifer System Management Classes:
Sole Aquifer System:
An aquifer which is used to supply 50% or more of domestic water for a given area, and for which there is no reasonably available alternative sources should the aquifer be impacted upon or depleted. Aquifer yields and natural water quality are immaterial.
Major Aquifer System:
Highly permeable formations, usually with a known or probable presence of significant fracturing. They may be highly productive and able to support large abstractions for public supply and other purposes. Water quality is generally very good (less than 150mS/m Electrical Conductivity).
Minor Aquifer System:
These can be fractured or potentially fractured rocks which do not have a high primary permeability, or other formations of variable permeability. Aquifer extent may be limited and water quality variable. Although these aquifers seldom produce large quantities of water, they are important for local supplies and in supplying base flow for rivers.
Non-Aquifer System:
These are formations with negligible permeability that are regarded as not containing ground water in exploitable quantities. Water quality may also be such that it renders the aquifer unusable. However, ground water flow through such rocks, although imperceptible, does take place, and needs to be considered when assessing the risk associated with persistent pollutants.
Ratings for the Aquifer System Management and Second Variable Classifications:
Aquifer System Management Classification
Class Points Project Area
Sole Source Aquifer System: Major Aquifer System: Minor Aquifer System: Non-Aquifer System: Special Aquifer System:
6 4 2 0
0 - 6
- - 2 - -
Second Variable Classification Weathering/Fracturing
Class Points Project Area
High: Medium: Low:
3 2 1
- - 1
Note:

MANUNGU Colliery, Life of Mine: Groundwater Impact Assessment Ref:327e DRAFT2 Jul’ 2019
GROUNDWATER SQUARE
Page 54
Ratings for the Ground Water Quality Management Classification System:
Aquifer System Management Classification
Class Points Project Area
Sole Source Aquifer System: Major Aquifer System: Minor Aquifer System: Non-Aquifer System: Special Aquifer System:
6 4 2 0
0 - 6
- - 2 - -
Aquifer Vulnerability Classification
Class Points Project Area
High: Medium: Low:
3 2 1
- 2 -
The project area aquifer(s), in terms of the above definitions, is classified as a minor aquifer system (see Section 4.9).
6.3. Aquifer Protection Classification Level of ground water protection based on the Ground Water Quality Management Classification:
GQM Index = Aquifer System Management x Aquifer Vulnerability
GQM Index Level of Protection Project Area
<1 1 - 3 3 - 6 6 - 10 >10
Limited Low Level
Medium Level High Level
Strictly Non-Degradation
- - 4 - -
The ratings for the Aquifer System Management Classification and Aquifer Vulnerability Classification yield a Ground Water Quality Management Index of 4 for the project area, indicating that medium level ground water protection may be required.
In terms of DWAF’s overarching water quality management objectives which is (1) protection of human health and (2) the protection of the environment, the significance of this aquifer classification is that if any potential risk exists, measures must be put in place to limit the risk to the environment, which in this case is the protection of the Primary Underlying Aquifer, the streams which drain the study area, and the External Users’ of ground water in the area.

MANUNGU Colliery, Life of Mine: Groundwater Impact Assessment Ref:327e DRAFT2 Jul’ 2019
GROUNDWATER SQUARE
Page 55
7. GROUNDWATER MODELLING
7.1. Software Model Choice The FEFLOW finite element numerical groundwater flow and transport software package was used to perform various scenarios and calculate aspects such as:
• Groundwater flow directions; • Decant areas/volumes/quality; • Mine water balance.
7.2. Model Set-up and Boundaries The following describes the numerical model:
• The numerical model grid consisted of 9 layers and 2.1 million mesh elements to accommodate the complex geometry of the coal seams and aquifer layers: o Karoo-Ecca aquifers listed in Tables 7.1A-D, 7.2A-D, were incorporated as the top 4 model-
layers; o The underlying Dwyka was represented by model-layer-5; o Intrusive rocks were represented by model-layer-6; o A layer to minimum 70m deep, below the intrusive rocks were represented by model-layer-7; o The Black Reef was represented by model-layer-8; o The bottom layer of the model, to a depth of 305m was represented in model-layer-9; o Model-layers were incorporated/adapted to reflect the expected changing aquifer hydraulics
with depth for both the Karoo- and non-Karoo geology; o All underground mining areas were incorporated as discrete elements, which enabled the
simulation of free-flow; • Post-mining aquifer parameters were incorporated as follows:
o Opencast mining was assumed to have an aquifer hydraulic conductivity of 100m/d; o Recharge on all rehabilitated opencast mining was assumed 12% of MAP; o The extent of the model grid and cell size of minimum 12m in model sensitive zones, were
believed to be sufficient to simulate groundwater flow accurately enough for this report; • Steady-state groundwater flow modelling was performed to simulate pre-mining groundwater level
elevations and flow directions; • Steady-state and transient groundwater flow modelling were performed to simulate post-mining
groundwater level elevations and flow directions; • Transient flow modelling was performed to determine:
o Groundwater base-flow volumes during mining/operation and post-mining; o Dewatering impact zone; o Time to decant; o Contamination movement;
• Water balance calculations took cognisance of groundwater base-flow/inflow and rainfall recharge; • Several spreadsheet calculations were performed in support of the numerical model calculations.
Rivers and non-perennial streams serve as hydraulic boundaries to the local groundwater flow system. Aquifers discharge into these features (i.e. groundwater base-flow), especially during the rainy season when groundwater levels rise due to rainfall recharge. Internal to the model domain, such features were incorporated as drainage boundary conditions.
The extent of the model domain (as indicated in Figure 2.1), were chosen along local non-perennial streams, rivers and local topographical highs, which are located far enough from the Manungu Colliery, to have no influence on the model accuracy (8km to the west, 9km to the north, 6km to the west, and 6km to the east).

MANUNGU Colliery, Life of Mine: Groundwater Impact Assessment Ref:327e DRAFT2 Jul’ 2019
GROUNDWATER SQUARE
Page 56
7.3. Groundwater Elevation and Gradient Pre-mining groundwater flow directions/gradients are presented in Figure 7.1. Post-mining groundwater flow directions/gradients for the August 2018 mine design are presented in Figure 7.2 for aquifer depths of 35m below surface. These elevations are almost identical to the groundwater levels at the level of the coal floor.
Prior to mining, groundwater flow directions were primarily northeast across the pit, with a northwestern component in the northwestern region of the Pit. Two northward-draining non-perennial streams flank the Manungu Pit to the west and east. The western spruit appears to have a smaller effect on groundwater flow direction than the eastern spruit, because groundwater flow from the west, is also toward this eastern spruit. The combined effect of both streams prior to mining was that the groundwater levels in the pit area were a relatively flat. During mining, the Pit will draw groundwater flow from all sides in its proximity. After mining, the regional groundwater flow directions will similar to the pre-mining environment, but locally, groundwater flow will be altered significantly as described in Section 8.
During the pre-mining situation, groundwater gradients west and southwest of the Pit were 0.8%, and 1% to the east of the Pit near the eastern stream. Within the pre-mined Pit, groundwater gradients were ≤0.5%.
Figure 7.1 Steady state pre-mining groundwater levels (mamsl) and flow directions

MANUNGU Colliery, Life of Mine: Groundwater Impact Assessment Ref:327e DRAFT2 Jul’ 2019
GROUNDWATER SQUARE
Page 57
Figure 7.2 Long-term post-mining groundwater levels (mamsl) and flow directions in the
Karoo aquifers approximately 35m below surface

MANUNGU Colliery, Life of Mine: Groundwater Impact Assessment Ref:327e DRAFT2 Jul’ 2019
GROUNDWATER SQUARE
Page 58
7.4. Geometric Structure of the Model One of the primary concerns in a post-mining situation is decant of contaminated mine water. In this regard, the elevations of the coal seam in relation to the surface topography and surrounding streams are very important, i.e. aquifer geometry. Cross-sections are included as Figure 7.4 (see location of cross-section lines in Figure 7.3). Elevations and the depth to the coal seam floor are indicated in Figures 7.5 and 7.6 respectively.
It is clear that the dolerite sills in the area will have major influence of rainfall recharge to the deeper aquifers.
Figure 7.3 Location of cross-sections

MANUNGU Colliery, Life of Mine: Groundwater Impact Assessment Ref:327e DRAFT2 Jul’ 2019
GROUNDWATER SQUARE
Page 59
WE-1
WE-2

MANUNGU Colliery, Life of Mine: Groundwater Impact Assessment Ref:327e DRAFT2 Jul’ 2019
GROUNDWATER SQUARE
Page 60
WE-3
WE-4

MANUNGU Colliery, Life of Mine: Groundwater Impact Assessment Ref:327e DRAFT2 Jul’ 2019
GROUNDWATER SQUARE
Page 61
NS
NW-SE

MANUNGU Colliery, Life of Mine: Groundwater Impact Assessment Ref:327e DRAFT2 Jul’ 2019
GROUNDWATER SQUARE
Page 62
NE-SW
Figure 7.4 Cross-sections (see location of cross-section in Figure 7.3)
Figure 7.5 Thematic depiction of coal Seam-2 elevations (mamsl)

MANUNGU Colliery, Life of Mine: Groundwater Impact Assessment Ref:327e DRAFT2 Jul’ 2019
GROUNDWATER SQUARE
Page 63
Figure 7.6 Thematic depiction of coal Seam-2 depths (m)
7.5. Groundwater Sources and Sinks Rainfall is the only natural water source to the groundwater balance. No other/artificial water is generated otherwise (i.e. no irrigation or rivers draining over the area). Farmer dams in the eastern stream can contribute to a dewatered shallow weathered zone aquifer. The deepest aquifers below the Karoo Ecca probably benefits relatively slowly from these dams.
The only sinks to the groundwater resource are groundwater abstraction from boreholes, mine water pumping from the pit and natural evaporation from the pit. Groundwater is abstracted by both the mine (used for domestic all-purposes) and external users (used for agricultural & domestic use). Mine water that is pumped from the pit is used for dust suppression or storage in the pollution control dam.
7.6. Conceptual Model The major groundwater flow units/aquifers, listed in Tables 7.1A-B and 7.2A-B, were identified and calibrated during the 2017 assessment for the Phase-1 mining period of 18years till 2033 which included numerical groundwater modelling required by the WUL. Numerical modelling for this study did not indicate that the parameters are substantially different.
Based on both the Phase-1 and Phase-2 field studies, the main aquifers identified from top-to-bottom, were:
• Karoo-Ecca (coal-bearing), Vryheid Formation, sandstone with dolerite sill intrusions above the coal Seam-2 in the Phase-1 pit area; which outcrops in regions south of the pit;
• Karoo-Dwyka, tillites with chert fractions, largely cementated to have low hydraulic conductivity below the Phase-1 pit area (see outcrops in Figure 5.1, indicated >1.2km north of Manungu pit);
• “Transition zone”, wedged between Karoo rock and Black Reef (estimated 100m to 200m thick, below the Phase-1 pit), consisting of: o Dolerite intrusion zone on contact with Transvaal geology, average 15m thick, with the highest
borehole yields in the area; o Low-yielding dolomite (not the same as the high-yielding Malmani Dolomites ±2.8km north); o Granite in places;

MANUNGU Colliery, Life of Mine: Groundwater Impact Assessment Ref:327e DRAFT2 Jul’ 2019
GROUNDWATER SQUARE
Page 64
o Tonalite in places; • Black Reef (150m to 300m below surface beneath the Manungu Phase-1pit). Based on slug-testing and pump testing of DWS monitoring boreholes, external users’ survey and newly drilled monitoring boreholes for Manungu Colliery, all indications are that the reserve is not underlain by major leached dolomitic aquifers, which occur to the north (Malmani Dolomites), but instead by a fractured aquifer with a moderate yielding capacity. Higher yielding boreholes (DWS) G37018, 50L/s and G37017, 33L/s are respectively located north (2.5km) and west (2.5km) of Manungu.
On a local scale, the Dwyka is intact and forms a barrier, while on a regional scale interaction can be expected along geological structures or where sinkholes have occurred.
The aquifer with the highest hydraulic conductivity in the area, is an intrusion zone below the Karoo-Dwyka, which is on average 15m thick. Borehole yields range between 0m/d and >5L/s, with an estimated representative hydraulic conductivity of 0.1m/d. Interestingly, groundwater levels recovered very slowly (no full recovery, days after the pumping test), leading to the believe that these aquifers have very low storage capacity and have been partially dewatered.
The above statement on the dewatered state of the intrusion zone was further confirmed; i.e. deeper boreholes, in general, have deeper groundwater levels than shallower boreholes.
The dolerite sill in the Phase-1 pit is found above the Seam-2 and probably restricts rainfall recharge to deeper aquifers. In some boreholes, water-strikes were encountered on top of the sill, but the magnitude of these water-strikes could not be correlated to the depth of the sills. Consequently, the sill was not incorporated as a separate numerical model layer.
Descriptions and hydraulic characteristics of aquifer layers, incorporated in the numerical groundwater model, are presented in Tables 7.1(A-B) to 7.2(A-B). Karoo-Dwyka, dolomites and other geology types, not mentioned in these tables, were assigned the same hydraulic properties to the upper Karoo Ecca and Dwyka aquifers i.e. dependent on depth below surface.
The numerical groundwater flow model was calibrated for rainfall recharge of ±2% of MAP (=14mm/a =3.8x10 5m/d), which is in agreement with hydrogeological assessments in the surrounding coal fields.
Numerical groundwater modelling assumed that recharge to the rehabilitated opencast may be 12% of MAP.
Table 7.1A Aquifer layers – description – Karoo-Ecca
Aquifer Average depth
Description Comment
Aquifer-1A
5m to >30m (20m thick)
Soil-clay overburden profile forming part of the shallow weathered zone aquifer
Unconfined to semi-confined conditions. Groundwater levels are shallower after wet rainfall periods or in close proximity to drainage/rivers/streams. Deepest water strikes and depth of hydrogeological weathering used as indicator of zone bottom.
Aquifer-1B 20m to 35m (15m thick)
Highly weathered hard rock profile of the shallow weathered zone aquifer
Immediately below shallow weathered zone aquifer, with water-strikes contributing to borehole yields
Dolerite sill
Aquifer-2
35m to 70m (35m thick)
Deep fractured aquifer
Observations have shown that the potential for the Karoo aquifer to transmit water is largely restricted at depths exceeding 60m to 80m below surface. This is assumed to be true for the Pre-Karoo aquifers in the area of investigation.
Aquifer-3 >80m Deep non-fractured aquifer Almost all fractures are believed closed.
Table 7.1B Aquifer layers – description – transition zone intrusive sills
Aquifer Average depth
Description Comment
Transition zone
intrusions
- (average
15m thick)
Highest yielding aquifer. Yields vary substantially in boreholes. Very slow recovery after pump testing
Hydraulic properties assigned irrespective of depth.

MANUNGU Colliery, Life of Mine: Groundwater Impact Assessment Ref:327e DRAFT2 Jul’ 2019
GROUNDWATER SQUARE
Page 65
Table 7.2A Aquifer layer – parameters – Karoo Ecca, Karoo-Dwyka, dolomite and other
Aquifer Layer
Thickness (m)
hydraulic conductivity (m/d) [m/s]
Storativity Porosity Rainfall Recharge (m/d) {mm/a} [%of MAP]
Aquifer-1A 20m (0.04) [4.6x10⁻⁷] 0.04 0.08 (3.8x10⁻⁵) {14} [2]
Aquifer-1B 15m (0.04) [4.6x10⁻⁷] 0.04 0.08
Aquifer-2 35m (0.005) [5.8x10⁻⁸] 0.01 0.06
Aquifer-3 (0.001) [5.8x10⁻⁸] 0.01 0.06
Table 7.2B Aquifer layer – parameters – transition zone intrusive sills
Aquifer Layer
Thickness (m)
Permeability (m/d) [m/s]
Storativity Porosity Rainfall Recharge (m/d) {mm/a} [%of MAP]
Transition zone intrusions
(average 15m thick))
(0.1) [1.2x10⁻⁶] 0.01 0.02 Not applicable
7.7. Numerical Model A complete description is provided in Section 7.2.
7.8. Results of the Model
7.8.1 Pre- Mining Pre-mining groundwater level elevations and groundwater flow directions are depicted in Figure 7.1 (Section 7.3). Prior to mining, groundwater flow directions were primarily northeast across the pit, with a northwestern component in the northwestern region of the Pit. Two northward-draining non-perennial streams flank the Manungu Pit to the west and east. The western spruit is believed to have a smaller effect on groundwater flow direction than the eastern spruit, because groundwater flow from the west (except for the northwestern corner), was also toward this eastern spruit. The combined effect of both streams prior to mining was that the groundwater levels in the pit area were considered a relatively flat.
7.8.2 During Mining Pertinent opencast water balance information during the operational phase is provided in Tables 7.3 and 7.4. The following main conclusions were reached with regard to the opencast mining:
• Mine water balance – opencast mining: o The main components of the opencast water balance were identified as groundwater inflow
and direct rainfall recharge on various areas inside the opencast: o The groundwater volumes expected to flow into opencast, are summarised in Table 7.3:
▪ Groundwater inflow volumes gradually increased over the first year, where after inflow increased at a slower rate; to be the case until the end of mining;
▪ The minimum inflow volumes are estimated at 50% of the predicted average volumes during dry rainfall periods on an annual basis, and even lower during excessive droughts;
▪ The maximum inflow volumes may be twice the average predictions during wet rainfall periods on an annual basis;
▪ It is also possible that the maximum volumes may be exceeded for short periods (during the initial stages of mining, or during excessively wet rainfall periods);
o The Letsolo (2017) estimates of (600m3/d-1000m3/d) compares favourably to the groundwater model predictions for the total first cut (600m3/d);
o Rainfall seasonality is therefore the main driver for variations in the mine water balance; o The calculated volumes served as input to the detailed operational water balance;
▪ Although a rainfall deficit applies on an annual basis (MAP<MAE), summer rainfall will create a positive balance during certain months, especially during “wet” rainfall cycles;
▪ On an annual basis, the groundwater inflow components will most likely be smaller than the contribution of rainfall to the total opencast water balance;
o As indicated in Table 7.3, rainfall recharge to the opencast during the final stages of mining, calculates to 2500m3/d and 350m3/d for the main Pit and the OC-E: ▪ Recharge at 12% of MAP on 70% rehabilitated areas; with much higher recharge on the
remaining 30% which will not yet be rehabilitated; ▪ The water balance will therefore be smaller once these pits are fully rehabilitated;
• In-pit storage of mine water:

MANUNGU Colliery, Life of Mine: Groundwater Impact Assessment Ref:327e DRAFT2 Jul’ 2019
GROUNDWATER SQUARE
Page 66
o Although it is currently possible to store water in small localised depressions in the coal floor and mined zones, especially where the mine floor is deeper in the west, this may hamper mining progress;
o The blasting of in-pit sumps for water storage is not practical; o All mine water is currently pumped out;
• The opencast is not expected to decant during the life-of-mine (LOM); • Impact on groundwater levels (see projected maximum zone of influence in Figure 7.7A&B and
summary in Table 7.5): o Groundwater levels in the immediate vicinity of the open pits will be influenced; o None of the monitoring boreholes are close enough to the pit to have been influenced to date; o The main contributing factors are the direction of groundwater flow, depth of mining below the
groundwater level, mining schedule and hydraulic aquifer parameters; o Although the maximum extent of the dewatering cone should generally not exceed 350m from
the Pit perimeter in the Karoo rock environment, various indicators (including numerical modelling) suggests a much wider impact zone (a larger impact zone is indicated in Figure 7.7 of generally 400m-500m wide, but up to 800m to the south – it is important that groundwater monitoring confirms this);
• Impact on groundwater quality: o Groundwater flow into the opencast workings is expected to be of similar quality than the
background groundwater; o When groundwater and rainwater come into contact with loose material in the pits, mine water
quality will deteriorate: ▪ Currently, mine water quality SO4 concentrations range between 150mg/L and 400mg/L; ▪ If all in-pit water is pumped out within a relatively short period (<3months), the water will
not acidify and SO4 concentrations should not exceed 800mg/L; ▪ If in-pit water is allowed to collect in the lowest regions for longer periods, it may eventually
deteriorate, depending on the oxygen-water-rock (carbonaceous material) interaction; ▪ Isolated “hot-spots” of higher concentrations and lower pH may exist;
o Numerical geochemical modelling confirmed that in-pit storage of discard will have an insignificant effect on the long-term Pit mine water quality;
o The surrounding aquifers are not expected to be impacted in terms of groundwater quality during the Operational Phase, due to groundwater flow being toward the dewatered mine;
• A summary of the Manungu impact on the local groundwater use, is provided in Table 7.5.
Table 7.3 Pertinent water balance information – operational phase
Pit
size (ha)
Elevations (mamsl)
Seam-2 average depth
(m)
Post-mining material flooded
(%)
Water volumes (m3/d)
Decant Topo-graphy
Seam-2
Water balance components average
Total water-make
Ground-water
Rainfall recharge to OC **
Long-term average
Typical dry
season
Typical wet
season
OC Main 561 1579 1592.37 1539.19 53.2 75% 760 2516 3276 304 6172
OC E 78 1573 1582.27 1555.42 26.8 65% 240 350 590 96 1060
UG NW 14 1579.3 1510.48 68.8 <40 * <40 <40 <40
UG W 39 1581.42 1518.48 62.9 <40 * <40 <40 <40
UG SW 495 1603.32 1531.27 72.1 140 * 142 85 200 TOTAL FOR MINE 4050 # <1000 ±7 500
* Essentially rainfall recharge reaching the underground mining areas (passing through overlying dolerite sill). ** Estimate only (assuming 70% rehabilitation while mining final cut; water engineer will perform detailed work,
inclusive of evaporation component. # Used for post-closure WUL requires = 4050m3/d (ranging between 1000m3/d and ±7500m3/d)
Table 7.4 Time till flooding
If underground sealed
from opencast (years)
If opencast interact freely with underground
(years)
Elevation to flood (mamsl)
Estimated volume that can be stored
(Million m3)
OC Main 20-30 25-40 1579 = decant 2.7
OC E 15-20 1573 = decant 44.5
UG NW Several decades <2 1502 to 1527 * 0.3
UG W Several decades <5 1508 to 1534 * 0.8
UG SW Several decades <10 1510 to 1555 * 9.6
* Minimum floor till maximum roof (estimate) to flood underground

MANUNGU Colliery, Life of Mine: Groundwater Impact Assessment Ref:327e DRAFT2 Jul’ 2019
GROUNDWATER SQUARE
Page 67
Table 7.5 Boreholes that may be impacted by mining activities
Operational Phase
Post-mining Phase
Coordinate Farm Site status
Owner Name No Impact on groundwater
Latitude Longitude Level
Quality **
Level Quality
MBH01 X X X -26.2248 28.6949 Manungu Coal Mine
Weilaagte 271/9 Manungu monitoring
MBH2 -26.2240 28.6950
MBH3 -26.2288 28.6959
MBH4 -26.2312 28.6972
MBH5 -26.2331 28.7015
MBH12 -26.2590 28.6977
MBH12-Rep -26.2599 28.6938
MBH16 -26.2653 28.6876
MBH19 X X X -26.2286 28.6968 Kobus
Oelofse Weilaagte 271/8
Manungu monitoring
G37030 -26.2588 28.6927
MWQ1 * -26.2382 28.67664
MWQ3 * -26.2326 28.70714
MWQ4 * -26.2311 28.71144
MWQ5 * -26.2391 28.66237
MWQ6 * -26.208 28.68672
PCD * -26.2231 28.69862
PCD Drainage *
-26.2225 28.6993
MBH 01 Gate (Tap) *
-26.2248 28.69488
MBH 17 JoJo Tank *
-26.2237 28.69889
MBH Temp Tap (Trollop tap) *
-26.2312 28.69724
MAN-BH2D X X X -26.2372 28.6790 New monitoring borehole group
MAN-BH2M -26.2372 28.6790
MAN-BH2S -26.2371 28.6790
MAN-BH3D X X -26.2368 28.7038 New monitoring borehole group
MAN-BH3M -26.2367 28.7038
MAN-BH3S -26.2367 28.7038
MAN-BH4D X X X -26.2397 28.6944 New monitoring borehole group
MAN-BH4M -26.2396 28.6945
MAN-BH4S -26.2396 28.6945
MAN-BH5M X X X -26.2342 28.6834 New monitoring
borehole
MAN-BH7M X X X -26.2431 28.6829 New monitoring
borehole
MAN-BH8M X X -26.2226 28.6995
MAN-BH9D X X X -26.2483 28.6981 New monitoring borehole group
MAN-BH9M -26.2483 28.6980
MAN-BH9S -26.2484 28.6980
MAN-BH10M X -26.2408 28.7062 New monitoring
borehole
MAN-BH11D X X X -26.2479 28.6878 New monitoring borehole group MAN-BH11S -26.2478 28.6878
MAN-BH12D -26.2568 28.67833 New monitoring borehole group
MAN-BH12M -26.2568 28.67830
MAN-BH12S -26.2568 28.67827
MAN-BH13D -26.2656 28.67466 New monitoring
borehole
* Not a borehole (e.g. surface water or mine water)

MANUNGU Colliery, Life of Mine: Groundwater Impact Assessment Ref:327e DRAFT2 Jul’ 2019
GROUNDWATER SQUARE
Page 68
Figure 7.7A Groundwater level impact zone (operational and post-closure phases) and
groundwater quality impact zone (post-closure phase)

MANUNGU Colliery, Life of Mine: Groundwater Impact Assessment Ref:327e DRAFT2 Jul’ 2019
GROUNDWATER SQUARE
Page 69
Figure 7.7B Groundwater level impact zone (operational and post-closure phases) and
groundwater quality impact zone (post-closure phase) with boreholes that might be impacted
7.8.3 Post-Mining The following were concluded:
• Type of decant: o In addition to the decant at the opencast pit perimeter (i.e. decant that will flow to surface at
the pit perimeter), a small volume of sub-surface decant will most-likely occur as contaminated base-flow to low-lying areas downstream/north of the pit perimeter (i.e. groundwater will flow below surface to a point further downstream where this water may decant to surface);
o Sub-surface decant can be expected in the form of a contamination plume developing in the direction of groundwater flow;
• Time to decant (see summary in Table 7.4): o It is anticipated that decant will occur between 20years (earliest) and 30years after mining
ceases for the main opencast if the underground is sealed off, and a few years longer if the underground is not sealed;

MANUNGU Colliery, Life of Mine: Groundwater Impact Assessment Ref:327e DRAFT2 Jul’ 2019
GROUNDWATER SQUARE
Page 70
o If the underground is sealed off from the main opencast pit area, it might take decades to flood; especially the UG SW, but will flood very quickly if the water that recharges to the pit can flow into the underground workings freely;
o The time to decant has a bearing on the long-term water quality trends as geochemically modelled;
o Stage curves are included as Figure 7.11 (i.e. indicating the volume of water that can be stored in opencast and underground sections below certain elevations);
o Calculations took account of: ▪ Depth to pit floor; ▪ Moisture content of backfill material; ▪ Soil subsidence/compaction; ▪ In-pit water volume at the end of mining; ▪ Natural rainfall recharge at 12% of MAP;
• Flooding status at time of decant (see Table 7.4): o The Manungu main Pit is expected to decant along the north-eastern and north-western pit
perimeters at the locations indicated in Figure 7.10; o The decant elevation is estimated at 1579mamsl, which will result in 75% of the opencast being
flooded eventually (see Tables 7.3 and 7.4); with small volumes of sub-surface decant potentially directly downstream/east of the pit perimeter;
• Impact on groundwater levels: o Pre-mining and post-mining groundwater levels are indicated in Figures 7.1 and 7.2A&B
(Section 7.3); o Due to the flat groundwater table that can be expected inside the highly permeable backfill
material inside the Pit, the post-mining situation will differ slightly from the pre-mining situation: ▪ A slight rise in groundwater levels can be predicted in the vicinity of the decant point; ▪ Groundwater levels in the rest of the opencast will be slightly deeper, but groundwater flow
directions will essentially be in the same direction; o The post-mining dewatering cone will be smaller than the dewatering cone during the
operational phase: ▪ As the Mine continues to fill, the dewatering cone will retract from all directions; ▪ The dewatering cone is not likely to expand further in any direction after the mining phase; ▪ The difference between pre-mining and post-mining groundwater levels is expected to be
less than 10m in the pit area; o Until such time as when the pit groundwater levels reach flooding elevations, groundwater flow
will essentially be towards the pit. These flow conditions will continue from the south, and, to a limited extent, along the western pit boundaries (even after post-mining steady-state groundwater level elevations have been reached);
o Groundwater flow will be away from the pit in the north-east and east; the driving force for contaminated movement;
o Although the maximum extent of the dewatering cone should generally not exceed 350m from the Pit perimeter in the Karoo rock environment, various indicators (including numerical modelling and current observations in external user borehole which supplies the chicken farming) suggests a much wider impact zone of up to 800m to the south (it is important that groundwater monitoring confirms this);
o All springs and hydrocensus boreholes potentially situated within the dewatering post-mining impacted groundwater level zones, are summarised Table 7.5;
• Impact on groundwater quality: o The time to flood was considered in the geochemical modelling as this will influence the long-
term post-mining mine water quality; o The effect of placing discard from the proposed plant, into the Pit, was considered (see
assessment in Appendix VI); o The anticipated average SO4 concentrations within the opencast for a period of 100years after
mining, was geochemically simulated (see Appendix VII and Figure 7.8 which serves as a summary of geochemical trends); ▪ Within 10years after the cessation of mining, SO4 concentrations are anticipated to
increase to 3500mg/L, where after concentrations will gradually improve over many decades;
▪ As can be seen, there is very little difference in the mine water quality if discard from the Wash Plant is added to the backfill;
o Model results after 10/20/50/200years are included as Figures 7.9: ▪ This would represent groundwater quality 10/20/50/200years after the cessation of mining;

MANUNGU Colliery, Life of Mine: Groundwater Impact Assessment Ref:327e DRAFT2 Jul’ 2019
GROUNDWATER SQUARE
Page 71
▪ A worst-case scenario is portrayed, which assumed that contamination plumes will form immediately, while in fact, the plume will only migrate after sufficient flooding;
▪ The results are depicted in the shallow weathered zone aquifer as this is the highest yielding aquifer and an indication of the water qualities to be expected at decant areas;
o The anticipated long-term groundwater quality impact zone on the local aquifers is depicted in Figure 7.7A. Provided that decant water is captured, the surrounding rivers/streams, wetlands and pans are not expected to be impacted in terms of groundwater quality;
• Mitigation of impact on groundwater quality (2017 assessment): o A modelling scenario was carried out where the pit level was artificially lowered 14m below the
decant elevation to 1565mamsl; o Approximately 2000m3/d will have to be removed from the pit on average (probably about 60%
more during the summer rainfall season and 50% less during the dry winter months) to maintain this groundwater level elevation inside the pit: ▪ This is ±500m3/d more (±33% more) than the ±1500m3/d that would have decanted
naturally if no mitigation measures were introduced; ▪ Further modelling is required to find an optimum management level to limit the water that
has to be treated as well as limit the movement of groundwater contamination; o In pit manipulation can be achieved through evaporation or pumping, in which case this water
will have to be treated before discharging to the surface water environment; ▪ Natural decant at the pit perimeter
• Mine water balance and decant volumes/quality (see summary in Tables 7.3, 7.4 and 7.6): o Rainfall recharge to the opencast, at a rate of 12% of MAP over the long-term, calculates to
1500m3/d which is equal to the long-term average decant volume at the north-eastern and western pit perimeter as numerically simulated: ▪ This is because groundwater baseflow (subsurface outflow) away from the opencast areas
will equal the groundwater inflow component (inclusive of the contribution from underground mining);
▪ Some groundwater base-flow from the opencast (i.e. sub-surface groundwater flow to the northwest, east and northeast) may eventually manifest as surface seepage some distance from the opencast perimeter – the contaminated seepage volumes from all such areas were numerically simulated at 150m3/d downstream of the opencast perimeter;
o The changing hydro-chemical nature of the rehabilitated opencast will manifest in the groundwater decant and plume dynamics (i.e. varying over time, especially relevant to main impact zone at the pit perimeter – see Figure 7.8);
o Decant volumes are summarised in Tables 7.6: ▪ Decant volumes will gradually increase until the mine is flooded 20years to 30years after
the cessation of mining, as the mine starts flooding, and the groundwater system establish pseudo steady-state flow patterns;
▪ Decant volumes will vary on a seasonal basis and may potentially be 50% smaller or more during extreme dry seasons and be double during wet rainfall seasons.
Figure 7.8 Summary of geochemical SO4 (mg/L) trends for opencast and underground
sections as geochemically modelled
0
500
1000
1500
2000
2500
3000
3500
4000
4500
0 20 40 60 80 100 120 140 160 180 200
Sulp
ha
te c
on
cen
trat
ions
(mg/
L)
Time (years)
O/C phase 1 O/C pit1 U/G West
U/G Eskom Phase-1 Discard Pit1 Discard
U/G-W (Phase1 discard) U/G Eskom (Pit1 discard) U/G-W sealed
U/G Eskom sealed

MANUNGU Colliery, Life of Mine: Groundwater Impact Assessment Ref:327e DRAFT2 Jul’ 2019
GROUNDWATER SQUARE
Page 72
Slice 3 Slice 5
10y
10y
20y
20y

MANUNGU Colliery, Life of Mine: Groundwater Impact Assessment Ref:327e DRAFT2 Jul’ 2019
GROUNDWATER SQUARE
Page 73
Slice 3 Slice 5
50y
50y
100y
100y
Figure 7.9 Numerically simulated SO4 contamination plume (mg/L) after 10, 20 50 and
100years

MANUNGU Colliery, Life of Mine: Groundwater Impact Assessment Ref:327e DRAFT2 Jul’ 2019
GROUNDWATER SQUARE
Page 74
Figure 7.10 Decant zones after 100years

MANUNGU Colliery, Life of Mine: Groundwater Impact Assessment Ref:327e DRAFT2 Jul’ 2019
GROUNDWATER SQUARE
Page 75
Table 7.6 Summary of anticipated decant volumes and quality after 100years
Decant Zone Volume (m3/d)]
SO4 concentration (mg/L)
East-1 <10 90
East-2 20 40
East-3 20 280
East-4 50 580
East-5 50 1290
East-6 25 1380
East-7 10 1430
East-8 <10 990
East-9 <10 320
East-10 <10 810
East-11 <10 170
East-12 <10 40
East-13 20 30
East-Perimeter 570 1980
NorthEast-Perimeter 900 1970
South-1 30 100
South-2 40 0
West-1 15 1580
West-2 35 1410
West-3 40 1430
West-4 40 1430
West-5 <10 1080
West-6 10 1180
West-7 10 1140
West-8 <10 900
West-9 <10 200
West-10 <10 210
West-11 <10 110
West-12 20 190
West-Perimeter 670 1960
Figure 7.11 Water volume stage curves for opencast and underground sections
0
5 000 000
10 000 000
15 000 000
20 000 000
25 000 000
30 000 000
35 000 000
40 000 000
45 000 000
50 000 000
1490 1500 1510 1520 1530 1540 1550 1560 1570 1580
Vo
lum
e (m
3)
Elevation (mamsl)
OC OC-E
UG-NW UG-W
UG-SW

MANUNGU Colliery, Life of Mine: Groundwater Impact Assessment Ref:327e DRAFT2 Jul’ 2019
GROUNDWATER SQUARE
Page 76
8. GEOHYDROLOGICAL IMPACTS The headings in this section are contained in the risk assessment which are provided in Appendix VIII.
Manungu Colliery may potentially impact on the surrounding groundwater systems in terms of groundwater volumes, levels and quality. During the operational phase, groundwater is pumped from the mine, and the local groundwater levels are being impacted. During this operational phase period, groundwater contamination is primarily restricted to the pit. During the post-mining phase, groundwater levels may remain lower than the pre-mining situation in certain areas, while a rise in the groundwater table is expected near the decant zones. A groundwater contamination plume will also manifest during the post-mining phase.
The potential impacts on the local groundwater system, nearby rivers system, and external groundwater users, were investigated.
8.1 Construction Phase The mine is currently operational. The following aspects are relevant for the 30year LOM extension:
• The upgrade of the Manungu sanitation facility(ies) at the office and changeroom ablutions; • The relocation of the contactors yard and workshop; • The establishment of a Coal Wash Plant facility; • An additional Pollution Control Dam; • Access and ventilation portals to the proposed underground workings.
8.1.1 Impacts on Groundwater Quantity The 30year LOM extension in terms of access and ventilation portals to the proposed underground sections should have very limited localised, with insignificant changes to the larger groundwater regime. In close proximity to these mining activities, groundwater levels and boreholes yields may be impacted. Cumulative impacts will remain insignificant.
8.1.2 Impacts on Groundwater Quality Apart from potential hydrocarbon contamination due lesser diesel and oil spills, as well as on-site sanitation there are no other activities that could impact on the regional groundwater quality.
8.1.3 Groundwater Management Management measures that need to be put in place include the following:
• Procedures must be put in place for the storage, use & disposal of fuels, oils and grease. o Bunded impervious areas are to be created for the storage of all hazardous chemical
substances; • Emergency procedure to be put in place for the containment and clean-up of spillages of hazardous
chemical substances.
8.2 Operational Phase The discussion in Section 7.8.2 are condensed in this Section.
8.2.1 Impacts on Groundwater Quantity The opencast is not expected to decant during the Life-of-Mine (LOM).
Although the maximum extent of the dewatering cone should generally not exceed 350m from the Pit perimeter in the Karoo rock environment, various indicators (including numerical modelling) suggests a much wider impact zone of generally 400m-500m wide, but up to 800m to the south (it is important that groundwater monitoring confirms this).
8.2.2 Impacts on Groundwater Quality • Impact on groundwater quality:
o Groundwater flow into the opencast workings is expected to be of similar quality than the background groundwater (to be evaluated for the final impact assessment report);

MANUNGU Colliery, Life of Mine: Groundwater Impact Assessment Ref:327e DRAFT2 Jul’ 2019
GROUNDWATER SQUARE
Page 77
o Once in contact with the various materials within the Mine, the water quality will deteriorate over time: ▪ Currently, mine water quality SO4 concentrations range between 150mg/L and 400mg/L; ▪ If all in-pit water is pumped out within a relatively short period (<3months), the water will
not acidify and SO4 concentrations should not exceed 800mg/L; ▪ If in-pit water is allowed to collect in the lowest regions for longer periods, it may eventually
deteriorate, depending on the oxygen-water-rock (carbonaceous material) interaction; ▪ Isolated “hot-spots” of higher concentrations and lower pH may exist;
o The surrounding aquifers are not expected to be impacted in terms of groundwater quality during the Operational Phase. This is due to groundwater flow being toward the dewatered mining areas.
8.2.3 Impacts on Surface Water The whole of the western flanking non-perennial stream falls within the expected cone of depression. Approximately two-thirds of the eastern flanking non-perennial stream falls within the expected cone of depression. A first order baseflow loss calculation (at 10.3mm/a) amounts to ±2.5l/s at the end-of-LOM or some 18.7% of the modelled groundwater inflows into the different mining sections.
Some manageable quality impact can be expected pertaining to the wash plant and associated stockpiles as far as the eastern flanking stream is concerned. All discharge water quality to rivers must comply with DWS standards.
8.2.4 Groundwater Management Management measures and options in terms of the disposal of coal discard and residue from the wash plant are discussed in Section 10.4. Associated stockpiles are also addressed.
Operational Phase groundwater management measures include the following:
• Boreholes intersected by underground mining should be sealed to prevent drainage into the mine. Impacted external users’ boreholes need to be replaced if impacted upon;
• Unstable geological conditions and problematic water makes (structural related) in the underground sections should be sealed off;
• Excess water in the mine must be used in the mine or pumped to pollution control facilities for re-use e.g. coal wash plant; o Water containment pollution control facilities must be lined; o All mine water pumpage and uses are to be metered and recorded; o Discharge water quality to rivers must comply with DWS standards;
• The mine water (monthly), groundwater, including external users’ boreholes within a 1km radius (quarterly and selective monthly) and surface water (monthly) quality must be monitored on a regular basis;
• Water level measurements should be taken on a monthly basis in the monitoring boreholes, while the external users’ boreholes within a 1km radius are to be monitored quarterly with some selected for monthly monitoring; o All groundwater abstractions are to be metered and recorded; o Selected surface water monitoring localities (rivers & streams) are to be monitored for stream
flow on a monthly basis; o Monthly rainfall records should be kept in aid of the mine water balance as well as impact
disputes.
8.3 Decommissioning Phase It is anticipated that decant will occur between 20years (earliest) and 30years after mining ceases for the main opencast if the underground is sealed off, and a few years longer if the underground is not sealed Remediation of the Physical Activity, Storage Facilities, Environmental Impacts and Resources Impacts are discussed in Section 11.
8.4 Post-mining Phase The discussion in Section 7.8.3 are condensed in this Section.
8.4.1 Groundwater Quantity The following conclusions were reached:

MANUNGU Colliery, Life of Mine: Groundwater Impact Assessment Ref:327e DRAFT2 Jul’ 2019
GROUNDWATER SQUARE
Page 78
• Type of decant: o In addition to the decant at the opencast pit perimeter (i.e. decant that will flow to surface at
the pit perimeter), a small volume of sub-surface decant will most-likely occur as contaminated base-flow to low-lying areas downstream/north of the pit perimeter (i.e. groundwater will flow below surface to a point further downstream where this water may decant to surface);
o Sub-surface decant can be expected in the form of a contamination plume developing in the direction of groundwater flow;
• Time to decant: o It is anticipated that decant will occur between 20years (earliest) and 30years after mining
ceases; o The time to decant has a bearing on the long-term water quality trends as geochemically
modelled; o Calculations took account of:
▪ Depth to pit floor; ▪ Moisture content of backfill material; ▪ Soil subsidence/compaction; ▪ In-pit water volume at the end of mining; ▪ Natural rainfall recharge at 12% of MAP;
• Flooding status at time of decant are summarised in Table 7.4: o The Manungu Main Pit is expected to decant along the north-eastern and north-western pit
perimeters at the location indicated in Figure 7.10; o The decant elevation is estimated at 1579mamsl, which will result in 75% of the opencast being
flooded eventually; with small volumes of sub-surface decant potentially directly downstream/east of the pit perimeter;
• Impact on groundwater levels: o Pre-mining and post-mining groundwater levels are indicated in Figures 7.1 and 7.2A&B; o Due to the flat groundwater table that can be expected inside the highly permeable backfill
material inside the Pit, the post-mining situation will differ slightly from the pre-mining situation: ▪ A slight rise in groundwater levels can be predicted in the vicinity of the decant point; ▪ Groundwater levels in the rest of the opencast will be slightly deeper, but groundwater flow
directions will essentially be in the same direction; o The post-mining dewatering cone will be smaller than the operational phase dewatering cone:
▪ As the Mine continues to fill, the dewatering cone will retract along the pit perimeter; ▪ The dewatering cone is not likely to expand further in any direction after the mining phase; ▪ The difference between pre-mining and post-mining groundwater levels is expected to be
less than 5m in the pit area; o Until such time as when the pit groundwater levels reach flooding elevations, groundwater flow
will essentially be towards the pit. These flow conditions will continue from the south, and, to a limited extent, along the western pit boundaries (even after post-mining steady-state groundwater level elevations have been reached);
o Groundwater flow will be away from the pit in the north-east and east; the driving force for contaminated movement;
o All springs and hydrocensus boreholes potentially situated within the dewatering post-mining impacted groundwater level zones, are summarised Table 7.5.
8.4.2 Groundwater Quality • Impact on groundwater quality:
o The anticipated average SO4 concentrations within the opencast for a period of 100years after mining, was geochemically simulated as summarised in Figure 7.8: ▪ Within 10years after the cessation of mining, SO4 concentrations are likely to increase to
3500mg/L, where after concentrations will gradually improve over many decades; o Model results after 10/20/50/200years for the contamination plume are included as Figures 7.9:
▪ This would represent groundwater quality 10/20/50/200years after the cessation of mining; ▪ A worst-case scenario is portrayed, which assumed that contamination plumes will form
immediately, while in fact, the pit will take between 20years to 30years to flood, after which the plumes can form beyond the pit perimeter;
▪ The results are depicted in the shallow weathered zone aquifer as this is the highest yielding aquifer and an indication of the water qualities to be expected at decant areas;
o The anticipated long-term groundwater quality impact zone on the local aquifers is depicted in Figures 7.7A-B. Provided that decant water is captured, the surrounding rivers/streams, wetlands and pans are not expected to be impacted in terms of groundwater quality;
• Mitigation of impact on groundwater quality:

MANUNGU Colliery, Life of Mine: Groundwater Impact Assessment Ref:327e DRAFT2 Jul’ 2019
GROUNDWATER SQUARE
Page 79
o During the 2017 Phase-1 (18years LOM) study, a modelling scenario was carried out where the pit level was artificially lowered 14m below the decant elevation to 1565mamsl;
o On average, ±50% more will have to be removed to keep the in-pit level at this elevation; o In pit manipulation can be achieved through evaporation or pumping, in which case this water
will have to be treated before discharging to the surface water environment; • Mine water balance and decant volumes/quality (see summary in Tables 7.3, 7.4 and 7.6):
o Rainfall recharge to the opencast, at a rate of 12% of MAP over the long-term, calculates to 1500m3/d which is equal to the long-term average decant volume at the north-eastern and western pit perimeter as numerically simulated: ▪ This is because groundwater baseflow (subsurface outflow) away from the opencast areas
will equal the groundwater inflow component (inclusive of the contribution from underground mining);
▪ Some groundwater base-flow from the opencast (i.e. sub-surface groundwater flow to the northwest, east and northeast) may eventually manifest as surface seepage some distance from the opencast perimeter – the contaminated seepage volumes from all such areas were numerically simulated at 150m3/d downstream of the opencast perimeter;
o The changing hydro-chemical nature of the rehabilitated opencast will manifest in the groundwater decant and plume dynamics (i.e. varying over time, especially relevant to main impact zone at the pit perimeter);
o Decant volumes will vary on a seasonal basis and may potentially be 50% smaller or 60% higher than the average during extreme dry and wet rainfall seasons.
8.4.3 Cumulative Impacts The main cumulative impact relates to the disposal of the discard. Groundwater contamination may occur through AMD toe seepages, if a discard dump is placed on surface. Given the almost identical mine water qualities for an opencast backfill with or without discard material, it is recommended that discard from the proposed Wash Plant be placed deep enough in the main Pit; thus, preventing the impacts associated with surface Discard Dumps.
Secondary, if the underground is sealed off from the main opencast pit area, it might take decades to flood; especially the UG SW but will flood very quickly if the water that recharges to the pit can flow into the underground workings freely. The time to decant has a bearing on the long-term water quality trends as geochemically modelled.
8.4.4 Groundwater Management This report evaluated one management measure to reduce the mine water quality impact on the local groundwater setting. During the Phase-1 assessment, a modelling scenario was carried out to evaluate the effect of artificially lowering the in-pit level by 14m below the decant elevation to 1565mamsl. On average, ±50% more that the natural decant volume will have to be removed to keep the in-pit level at this elevation. In pit manipulation can be achieved through evaporation or pumping, in which case this water will have to be treated before discharging to the surface water environment. Further modelling is required to find an optimum management level to limit the water that has to be treated as well as limit the movement of groundwater contamination.

MANUNGU Colliery, Life of Mine: Groundwater Impact Assessment Ref:327e DRAFT2 Jul’ 2019
GROUNDWATER SQUARE
Page 80
9. GROUNDWATER MONITORING SYSTEM The following aspects/information were considered:
• A review of current monitoring localities; • Potential groundwater level and groundwater quality impacts of Manungu mining on the local
groundwater system; • Potential impacts from neighbouring mining activities on Manungu Colliery; • Location of external groundwater users; • The complex geological environment; • Groundwater drilling by Groundwater Square. Manungu is currently monitoring the surface water environment (surface water and mine water) and groundwater localities as summarised in Tables 9.1 to 9.3, indicated in Figure 9.1 (also see Figures 4.1 and 5.6. Sampling and water level (flow measurement frequencies) are indicated in Tables 9.1 and 9.2.
The following water quality parameters are analysed by an accredited water laboratory at least biannually: pH, EC, TDS, Ca, Mg, Na, K, Cl, SO4, NO3, Tot.Alk., P, F, Fe, Mn, Al, Si, N, SS, NTU.
9.1 Groundwater Monitoring Network
9.1.1 Source, Plume, Impact and Background Monitoring The monitoring system must be designed to distinguish between the following types of monitoring boreholes:
• Source = nearest to potential contamination sources; • Plume = monitoring the progression/break-through water quality trend curves; • Background = upstream to serve as reference. As mining progresses, and more information is gathered, these subdivisions will be emphasized. The dewatering effect during mining will have to be monitored with the existing groundwater monitoring system; potentially expanding the monitoring system to provide additional/relevant monitoring.
9.1.2 System Response Monitoring Network The plume monitoring boreholes serve as an early warning system to take remedial action if contamination occurs. These holes, together with the source monitoring boreholes will indicate drastic changes in the groundwater levels; especially important with regard to the village drinking water supplies.
Due to the slow changes that normally occur in groundwater quality and natural groundwater level fluctuations, quarterly groundwater monitoring should be sufficient to identify any changes which may require action. Boreholes that supply drinking water may, however, become unusable more abruptly, if such holes are reliant on single water fractures, which may become dewatered during droughts, or excessive pumping. Fortunately, the groundwater supply to the local village is utilised continuously, which will prompt an immediate complain to the mine.
Investigations should be conducted to determine the reasons for sudden changes in groundwater quality and groundwater levels.
9.1.3 Monitoring Frequency Table 9.1 Surface water sampling points
Borehole No. Coordinates Current monitoring frequency Sampling
depth (m) Latitude Longitude Water volume Water quality
MWQ1 26.2382 28.6766 Monthly Monthly
Below water surface
MWQ3 26.2326 28.7071 Monthly Monthly
MWQ4 26.2310 28.7114 Monthly Monthly
MWQ5 26.2391 28.6623 Monthly Monthly
MWQ6 26.2080 28.6867 Monthly Monthly
PCD 26.2231 28.6986 Monthly Monthly
PCD Drainage 26.2225 28.6993 Monthly Monthly
Pit area Changes monthly Monthly Monthly

MANUNGU Colliery, Life of Mine: Groundwater Impact Assessment Ref:327e DRAFT2 Jul’ 2019
GROUNDWATER SQUARE
Page 81
Table 9.2 Groundwater sampling points
Borehole No. Coordinates Current monitoring frequency Sampling
depth (m) Latitude Longitude Water level Water quality
MBH01 26.2247 28.6948 Monthly Monthly
To be verified
MBH4 26.2312 28.6972 Monthly Monthly
MBH5 26.2331 28.7015 Quarterly Quarterly
MBH6 ** 26.2388 28.7305 Quarterly Quarterly
MBH7 26.2369 28.6612 Quarterly Quarterly
MBH12-Replace 26.2599 28.6938 Monthly Monthly
MBH17 26.2236 28.6988 Monthly Monthly
MBH19 26.2286 28.6968 Quarterly Quarterly
MBH22* ** 26.2055 28.7237 Quarterly Quarterly
MBH32 26.2369 28.6612 Quarterly Quarterly *Coordinates for MBH22 (-26.8948/28.66129) according to Philo Environmental Management Report. **It is recommended that boreholes MBH6 and MBH22 be removed from the current monitoring system (located >3km from the Pit LOM).
Table 9.3 Additional sampling points to be added to Manungu groundwater monitoring system
Site Name
WGS84 LO29 Monitoring frequency Sampling Horizon
(m) Latitude Longitude
Elevation (mamsl)
Water level Water quality
MAN-BH2D 26.237200 28.679010 1592 Monthly Quarterly 88
MAN-BH2M 26.237160 28.679010 1590 Monthly Quarterly 23
MAN-BH2S 26.237130 28.679020 1590 Monthly Quarterly 5
MAN-BH3D 26.236750 28.703780 1580 Monthly Quarterly 71
MAN-BH3M 26.236730 28.703790 1580 Monthly Quarterly 15
MAN-BH3S 26.236690 28.703820 1580 Monthly Quarterly 7
MAN-BH4D 26.239650 28.694450 1595 Monthly Quarterly 67
MAN-BH4M 26.239630 28.694490 1595 Monthly Quarterly 25
MAN-BH4S 26.239600 28.694530 1596 Monthly Quarterly 8
MAN-BH5M 26.234210 28.683400 1597 Monthly Quarterly 32
MAN-BH6D 26.216920 28.683900 1572 Monthly Quarterly 75
MAN-BH6M 26.216880 28.683880 1572 Monthly Quarterly 30
MAN-BH7M 26.243110 28.682930 1597 Monthly Quarterly 25
MAN-BH8M 26.222640 28.699540 1570 Monthly Quarterly 15
MAN-BH9D 26.248280 28.698050 1593 Monthly Quarterly 66
MAN-BH9M 26.248340 28.698050 1593 Monthly Quarterly 30
MAN-BH9S 26.248370 28.698050 1593 Monthly Quarterly 8.5
MAN-BH10M 26.240870 28.706280 1577 Monthly Quarterly 17
MAN-BH11D 26.247860 28.687810 1606 Monthly Quarterly 71
MAN-BH11S 26.247850 28.687830 1606 Monthly Quarterly 5.5
MAN-BH12D 26.256870 28.678330 1596 Monthly Quarterly 59
MAN-BH12M 26.256880 28.678300 1596 Monthly Quarterly 28
MAN-BH12S 26.256850 28.678270 1596 Monthly Quarterly 5
MAN-BH13D 26.265620 28.674660 1602 Monthly Quarterly 78
It is assumed that monitoring recommendations do exist for the local surface water environment. Mine water quality in Dams and the Pits, should be monitored at least monthly.
It is recommended that groundwater levels in the regular boreholes be initially measured on a monthly basis. Water quality samples should be collected quarterly, except for drinking water supply to the mine and local village, which require monthly monitoring.
Drinking water supply boreholes and external users’ boreholes which may be affected should also be monitored monthly. Elsewhere, external users’ boreholes should be monitored annually.
9.2 Monitoring Parameters Water quality monitoring parameters are summarised in Table 9.2 for the mining phase and post-mining phases respectively. Note, as explained in Section 9.1, there is a distinction between the monitoring of regular mining boreholes and monitoring intervals for external users (originally identified during the 2009 hydrocensus), consisting of village boreholes and holes further away.

MANUNGU Colliery, Life of Mine: Groundwater Impact Assessment Ref:327e DRAFT2 Jul’ 2019
GROUNDWATER SQUARE
Page 82
Groundwater monitoring of the boreholes listed in Table 9.2 and Table 9.3, should be conducted as follows (as minimum for a period of two years, when less frequent groundwater quality monitoring may be recommended by an expert):
Table 9.2 Monitoring parameters and frequency
Groundwater levels Groundwater quality
Quarterly Quarterly:
pH, EC, TDS, Ca, Mg, Na, K, Cl, SO4, NO3, Tot.Alk. [NOTE: all drinking water to be analysed monthly]
Annually:
Si, Fe, Mn, Al & ICP-Scan, additional recommendations by geochemist Annually:
hydrocarbon-type analyses (e.g. TPH, DRO and GRO) and bacteriological.
9.3 Monitoring Boreholes Groundwater monitoring points are summarised in Tables 9.4. See Figure 9.1 for monitoring localities. External user’s boreholes are depicted in Figure 9.2.
Mine water quality in Dams and the Pits are important. Surface water monitoring, as recommended by the surface water expert should be reported/interpreted together with groundwater monitoring.
Table 9.4 Monitoring boreholes – regular monitoring
Site Name
WGS84 LO29 End of hole (m)
Collar Height
(m)
Water Level (m)
Sampling Horizon
(m) Latitude Longitude
Elevation (mamsl)
MAN-BH2D 26.237200 28.679010 1592 175 0.50 34.40 88
MAN-BH2M 26.237160 28.679010 1590 41 0.55 3.54 23
MAN-BH2S 26.237130 28.679020 1590 10 0.57 3.03 5
MAN-BH3D 26.236750 28.703780 1580 100 0.27 26.01 71
MAN-BH3M 26.236730 28.703790 1580 30 0.32 4.18 15
MAN-BH3S 26.236690 28.703820 1580 10 0.3 3.99 7
MAN-BH4D 26.239650 28.694450 1595 90 0.32 28.1 67
MAN-BH4M 26.239630 28.694490 1595 41 0.28 7.23 25
MAN-BH4S 26.239600 28.694530 1596 10 0.24 6.4 8
MAN-BH5M 26.234210 28.683400 1597 40 0.36 4.43 32
MAN-BH6D 26.216920 28.683900 1572 91 0.3 32.6 75
MAN-BH6M 26.216880 28.683880 1572 40 0.42 5.15 30
MAN-BH7M 26.243110 28.682930 1597 36 0.27 6.53 25
MAN-BH8M 26.222640 28.699540 1570 31 0.61 2.77 15
MAN-BH9D 26.248280 28.698050 1593 96 0.43 43.84 66
MAN-BH9M 26.248340 28.698050 1593 46 0.58 8.23 30
MAN-BH9S 26.248370 28.698050 1593 10 0.53 7.82 8.5
MAN-BH10M 26.240870 28.706280 1577 26 0.47 5.23 17
MAN-BH11D 26.247860 28.687810 1606 86 0.46 36 71
MAN-BH11S 26.247850 28.687830 1606 7 0.52 4.18 5.5
MAN-BH12D 26.256870 28.678330 1596 86 0.73 41.17 59
MAN-BH12M 26.256880 28.678300 1596 40 0.75 4.11 28
MAN-BH12S 26.256850 28.678270 1596 7 0.74 3.5 5
MAN-BH13D 26.265620 28.674660 1602 86 0.70 52.22 78

MANUNGU Colliery, Life of Mine: Groundwater Impact Assessment Ref:327e DRAFT2 Jul’ 2019
GROUNDWATER SQUARE
Page 83
Figure 9.1 Recommended groundwater monitoring boreholes

MANUNGU Colliery, Life of Mine: Groundwater Impact Assessment Ref:327e DRAFT2 Jul’ 2019
GROUNDWATER SQUARE
Page 84
Figure 9.2 External users identified by Groundwater Square (Ref: GW2_069, 2009),
depicted against an August 2016 Google Earth aerial photograph

MANUNGU Colliery, Life of Mine: Groundwater Impact Assessment Ref:327e DRAFT2 Jul’ 2019
GROUNDWATER SQUARE
Page 85
10 GROUNDWATER ENVIRONMENTAL MANAGEMENT PROGRAMME
10.2 Current Groundwater Conditions Prior to the commencement of mining in 2014, the area represented an unimpacted groundwater environment with no mining, only agricultural impacts.
Currently, the main impacts relate to the dewatering of the local aquifer surrounding the current Pit.
10.3 Predicted Impacts of Mining Dewatering of the local aquifers will expand. Mining will impact on the local groundwater supply through dewatering of the local aquifers. Groundwater contamination from the opencast pit should not impact on the local groundwater supply.
Groundwater contamination may occur through AMD toe seepages, if a discard dump is placed on surface. Given the almost identical mine water qualities for an opencast backfill with or without discard material, it is recommended that discard from the proposed Wash Plant be placed deep enough in the main Pit; thus preventing the impacts associated with surface Discard Dumps.
10.4 Mitigation Measures During the operational phase the most-important mitigation measures relate to:
• Groundwater monitoring recommendations in Section 9 are important. • The placement of discard material:
o If discard is placed on undisturbed/uncontaminated ground, a liner system will be required to prevent the contamination of the local groundwater system, and toe seepages should be collected: ▪ Any seepages and rainfall runoff originating from stockpiles should be identified and
captured/diverted to the dirty water system; ▪ Dirty water should be removed as quickly as possible to reduce the driving mechanism for
contaminant migration; o If the dump is placed on rehabilitated mining areas without a liner system, the discard seepage
water will mix with pit water and pumped out if necessary; o If the discard is paced in mined-out areas – the preferred option – it should be placed sufficiently
deep below the long-term decant elevation (e.g. 10m); • In line with pollution prevention and minimisation strategies, the following principles should apply if
filter cake material is stored on-site as non-select product: o Source reduction through general site maintenance:
▪ Product should be moved off-site as quickly to prevent continuous seepages from occurring;
▪ The site should be maintained to be free draining. Where relevant, areas should be compacted/shaped;
▪ Rainfall runoff should be separated into clean and dirty water (rainfall falling on the site should be allowed to drain quickly/freely, and contaminated water should then be captured in the mine dirty water system and re-used where possible);
▪ Clean upstream rainfall water runoff should be diverted around the site; o Treatment:
▪ If too much water has to be manged, treatment may need to be considered; o Secure disposal:
▪ All dirty water collected on the site should be re-used or stored during operation; • The storage of contaminated operational mine water:
o This water will be pumped to surface water dams where it can be reused; o In-pit water storage in low-lying areas may also be pursued.
AMD Prevention
One option that may be pursued, is the placement of coal-fire station fly ash on top of the backfilled opencast. However, detailed research is required to investigate, especially, the geochemistry and water balance of such a scenario. Due to the long-term benefits of flushing acid-generating minerals from backfill material, this option should be carefully evaluated in terms of the potential impact on the local

MANUNGU Colliery, Life of Mine: Groundwater Impact Assessment Ref:327e DRAFT2 Jul’ 2019
GROUNDWATER SQUARE
Page 86
surface water environment and ecosystem. One aspect to consider is that water should first flow through the ash (e.g. rainfall recharge) before entering acid generating material, such as backfill. If decant water is treated in this way, it is advisable not to use ash, unless properly researched, but rather add calcitic lime.
A combination of ash and cement can potentially be utilised to limit rainfall recharge into rehabilitated areas.
SA National Development Plan
Water will remain a critical component of the National Development Plan initiative of the South African Government, as it can stimulate economic growth. Local farmers have been utilising the local surface water environment for decades to irrigate crops. The irrigation infrastructure consists of the river system, purpose build canals and -dams, as well as pump stations.
The Manungu opencast (and surrounding mining environment) can potentially be incorporated into this system to store water for long periods, from where it can be utilised for irrigation; obviously ensuring that the water is of acceptable quality. It can potentially be beneficial for future generations, thus stimulating job creation in the local surroundings.
Detailed planning and research are required.
Decant Prevention Measures
In-pit evaporation from a final void or large enough in-pit-shaped evaporation can minimise the opencast water balance. Such a design is not currently planned. If such a design is pursued, it should account for rainfall that would fall directly on the evaporation area and the rainfall deficit that occurs on an annual basis.
A fundamental design criteria of in-pit evaporation areas, relates to the slopes above- and below the anticipated in-pit groundwater level. The slopes would be steeper above the groundwater level to minimise rainfall run-off. The slopes below the anticipated groundwater would be more gradual to optimise evaporation and evapotranspiration by plants, to account for the fluctuating in-pit groundwater levels on a seasonal basis. In practice, it will be very difficult to construct a large in-pit evaporation area.
10.4.1 Lowering of Groundwater Levels during Mining Operation It is not possible to prevent the dewatering of the aquifers surrounding the proposed opencast mining (see anticipated zone of dewatering in Figure 7.7A-B, Section 7.8.2). As soon as groundwater monitoring indicates a dewatered state of boreholes which supply external groundwater users, an alternative water sources should be provided.
10.4.2 Rise of Groundwater Levels Post-Mining Operation As discussed in Section 11, groundwater levels around the decant zones are anticipated to be higher than prior to mining. Decant will be contaminated, resulting an overland run-off towards the local surface water drainage lines.
Because this decant cannot be prevented (unless water is evaporated somewhere in the pit, or water is pumped from the pit), and in line with best practice guidelines, water management measures should be introduced to reduce the impact of the source (i.e. specifically addressing water quality).
With reference to comments made on the South African National Development Plan, consideration should be given to utilise this water for irrigation projects in the area.
10.4.3 Spread of Groundwater Pollution Post-Mining Operation The anticipated spread of groundwater contamination is discussed in Section 7.8.2 (see anticipated migration of groundwater in Figures 7.9, and maximum groundwater contamination impact zones in Figure 7.7A-B).
The spread of groundwater contamination can be restricted through active manipulation of the groundwater flow directions in the decant areas; e.g. pumping from boreholes or installation of a trench. However, this will require a huge rehabilitation fund.
The spread of groundwater contamination can also be restricted through the manipulation of groundwater gradients through lowering the in-pit levels. The added water that will have to be removed

MANUNGU Colliery, Life of Mine: Groundwater Impact Assessment Ref:327e DRAFT2 Jul’ 2019
GROUNDWATER SQUARE
Page 87
from the pit should be considered. Pumped water should be managed, but a tree plantation may have benefits in terms of water management and creating an income.

MANUNGU Colliery, Life of Mine: Groundwater Impact Assessment Ref:327e DRAFT2 Jul’ 2019
GROUNDWATER SQUARE
Page 88
11 POST CLOSURE MANAGEMENT PLAN The impact assessments and management of the impacts contained in this report (Sections 5 and 6), adhere to the DWAF series of Best Practice Guidelines (BPGs), which was developed for mines in line with International Principles and Approaches towards sustainability. The series of BPGs were grouped as outlined below (directly quoted from the documents):
• BEST PRACTICE GUIDELINES dealing with aspects of DWAF’s water management HIERARCHY: o H1. Integrated Mine Water Management; o H2. Pollution Prevention and Minimisation of Impacts; o H3. Water Reuse and Reclamation; o H4. Water Treatment;
• BEST PRACTICE GUIDELINES dealing with GENERAL water management strategies, techniques and tools, which could be applied cross-sectoral: o G1. Storm Water Management; o G2. Water and Salt Balances; o G3. Water Monitoring Systems; o G4. Impact Prediction; o G5. Water Management Aspects for Mine Closure;
• BEST PRACTICE GUIDELINES dealing with specific mining ACTIVITIES or ASPECTS, which address the prevention and management of impacts from: o A1. Small-scale Mining; o A2. Water Management for Mine Residue Deposits; o A3. Water Management in Hydrometallurgical Plants; o A4. Pollution Control Dams; o A5. Water Management for Surface Mines; o A6. Water Management for Underground Mines.
One of the functions performed within the hierarchy of decision making is to inform interested and affected parties on good practice at mines.
11.2 Remediation of Physical Activity Groundwater monitoring recommendations in Section 9 are important.
The following recommendations are noteworthy in terms of adhering to the principle of pollution prevention and source reduction:
• All remaining material of the coal Wash Plant area should be removed, and placed into the bottom of a mining area below the final post-mining groundwater level;
• The expertise of a soil scientist should be called upon to assess the base/foundation layer and underlying soils in terms of the degree of contamination (in the context of the general soil contamination of surrounding soils): o In the event that salts are identified, a decision should be taken on the need (and best method)
to rehabilitate the footprint areas (e.g. placement of foundation layer into the bottom of the pit); o Topsoil should be placed back to restore the site to its original status/soil-condition.
11.3 Remediation of Storage Facilities It is recommended that discard material be placed in mined-out areas, sufficiently deep below the long-term decant elevation. However, if permission is not granted for this, contaminated toe seepages of sulphate concentrations exceeding 5000 mg/L should be prevented, through covering the Discard Dump with an engineered capping system to prevent rainfall infiltration. This approach adheres to the principle of source reduction. Groundwater monitoring recommendations in Section 9 are important.
In line with pollution prevention and minimisation strategies, the following principles should apply if filter cake material and discard remain on site as a discard dump:
• Groundwater monitoring recommendations in Section 9 are important; • Source reduction through:
o Capping of the dump; o General site maintenance, allowing free draining, and capturing of dirty water (runoff and
seepages originating from the dump);

MANUNGU Colliery, Life of Mine: Groundwater Impact Assessment Ref:327e DRAFT2 Jul’ 2019
GROUNDWATER SQUARE
Page 89
• Storage, treatment and/or reuse of contaminated water (e.g. such as the irrigation projects mentioned in Section 11.5).
Similarly, remaining contaminated footprint materials and soils in the coal handling areas, ROM stockpiles and Pollution Control Dams, should be removed according to the guidelines of a soil scientist, and placed in the bottom of the Pit.
11.4 Remediation of Environmental Impacts It is recommended that optimal surface rehabilitation be performed, such as the placing of a thin topsoil layer and ensuring that the area is covered by indigenous plants (i.e. also removal of invading plant species). It is important that a free draining post-mining topography be established. This will prevent contaminated rainfall runoff over the contaminated soils.
11.5 Remediation of Water Resources Impacts The Manungu Mine does not impact directly on the local surface water resources. When decant eventually occur at the Pit perimeters, these will be managed. Options include, capturing, reuse through projects (e.g. irrigation if possible) or treatment. Insufficient storage will be available.
Sub-surface decant, will affect the groundwater system, gradually expanding over decades. Remediation options include:
• Quick flooding of the underground will result in an improved water quality; especially if this water can be replenished from surface water sources, similar to a water reservoir, to be utilised for irrigation on an ongoing basis;
• It is preferable that the underground be sealed from the opencast workings; • Manipulating the in-pit mine water levels, with obvious increased treatment costs (unless the water
quality proves to be of good enough quality to use directly for irrigation); • Artificially treating the backfill material at high cost to improve the long-term post-mining water
quality.
11.6 Backfilling of the Pits All post-mining rehabilitated areas need to be free draining where possible unless stated differently in the EMP. This will limit groundwater recharge and maximise clean surface water runoff from the rehabilitated areas.
If the discard is placed in mined-out areas – the preferred option – it should be placed sufficiently deep below the long-term decant elevation (e.g. 10m). In all likelihood, sufficient space will be available to store this material.

MANUNGU Colliery, Life of Mine: Groundwater Impact Assessment Ref:327e DRAFT2 Jul’ 2019
GROUNDWATER SQUARE
Page 90
12 CONCLUSIONS AND RECOMMENDATIONS See executive summary

MANUNGU Colliery, Life of Mine: Groundwater Impact Assessment Ref:327e DRAFT2 Jul’ 2019
GROUNDWATER SQUARE
Page 91
13 ASSUMPTIONS AND LIMITATIONS The numerical groundwater flow and transport model is believed to be sufficiently representative of the local aquifers and groundwater conditions, to predict the post-mining decant situation to a sufficient level of accuracy.
The following main assumptions applied to this study:
• Data and information were presumed sufficiently accurate: o Where relevant, datasets (e.g. hydraulic testing, water monitoring, surface topography and
aquifer geometry); o The basis of the impact assessments, were field studies (e.g. hydrocensus, hydrogeological
drilling, geophysical surveys, pump testing and groundwater monitoring) by Groundwater Square over the past 5years, and the collection of various water/geochemical samples;
o Project consultants ECMA, GeoSoilWater, GEMECS, CCIC, and EIMS supplied the following information (through discussions, spreadsheets, presentations and electronic CAD drawings): ▪ Latest mining scheduling and life-of-mine plans; ▪ Infrastructure layout and design; ▪ Geological model of coal seams; ▪ Groundwater monitoring database; ▪ Bulking factor of rehabilitated backfill material;
o During several visits to the Manungu Colliery, the current water situation was discussed with Mine Personal and mentioned project consultants; providing valuable insight into the future mine water balance;
• Inter-mine flow calculations are not relevant to the project; • Aquifer parameters of geological units:
o Although aquifer parameters vary over orders of magnitude over short distances (e.g. fracture flow compared to flow through the solid portions of the rock matrix), the values utilised in the groundwater model for similar geological units of similar depths, will be representative of groundwater flow over distances applicable to typical mining impacts;
o Where aquifer information was not to the same level of detail as the Karoo aquifers (i.e. hydraulic aquifer parameters of geological units within the numerical groundwater model domain, other than Karoo Ecca rock, within which coal mining is taking place), pumping test information, and anecdotal information on farmers’ boreholes and knowledge of these rock type aquifers were considered;
o The dolerite sills in the area probably has a major impact of groundwater recharge to the deeper aquifers;
• The existing and proposed pit areas are devoid of major vertical geological structures, which can create preferential flow zones, but horizontal aquifer zones and are believed relevant to the deeper aquifers below coal bearing rocks;
• Conceptually, the groundwater flow field is well understood; • The current interaction of mining with the surrounding aquifers will continue as the opencast mine
expands to the south and underground areas; • Geochemical evaluation:
o Geochemical samples were representative of the backfilled spoils, mined coal seams and the complete litho-stratigraphical profile;
o Discard samples were created from coal, based on the Plant design criteria to perform geochemical testing;
o Given the scientific integrity of the geochemical modelling considerations and technique, geochemical trend predictions are therefore within an acceptable range of accuracy.
The following limitations applied to the study:
• Rainfall seasonality will influence the mine water balance, and the compounding effect of sequential wet or dry rainfall periods may result in much larger than average decant for such extreme wet periods, and zero decant during extreme droughts. An indication of “relatively” wet and dry cycles was provided in the report, but it is not possible to provide for extreme events, such as 100/1000year extremes†;
† The National Water Act requires operators to be able to handle a 1:50 rainfall event, i.e. a risk of spillage
<2%. Unfortunately, there is insufficient meteorological data to estimate a 1:1000 year event.

MANUNGU Colliery, Life of Mine: Groundwater Impact Assessment Ref:327e DRAFT2 Jul’ 2019
GROUNDWATER SQUARE
Page 92
• The sequence of mining will affect the mine water balance; especially relevant with regard to the storage of mine water from the historical underground workings;
• It is very important to perform groundwater level and groundwater quality monitoring, to verify modelling predictions, and timeously correct assumptions in the unlikely event that the groundwater system behaves differently to expectations.
_____________________________ Louis Botha (M.Sc., Pr.Sci.Nat.) for GROUNDWATER SQUARE file: GW2_327e-Manungu_GroundwaterImpactAssessment_rep_DRAFT2.docx

MANUNGU Colliery, Life of Mine: Groundwater Impact Assessment Ref:327e DRAFT2 Jul’ 2019
GROUNDWATER SQUARE
Page 93
References
Bredenkamp DB, Botha LJ, Van Tonder GJ & Van Rensburg HJ, 1995. “Manual on Quantitative Estimation of Groundwater Recharge and Aquifer Storativity” Prepared for the WRC, Report.No.TT73/95
Brummer K, Campbell G, Mutobo K. “Interpretation of high resolution aeromagnetic and radiometric survey data over the Welgevonden and Weilaagte prospect area, Mpumalaga Province.” On behalf of Tshedza Mining Resources (Pty) Ltd. GAP Geophysics, August 2014;
DWAF, 1995. “Groundwater Resources of the Republic of South Africa, SHEET 1 & 2”
DWAF, 1996. “Groundwater Harvest Potential of the Republic of South Africa
DWAF, 1999. “1: 500 000 Hydrogeological map series of the Republic of South Africa, Sheet 2526 Johannesburg“
DWAF, 2008. “Best Practice Guidelines”
Button, A., 1969, "Stratigraphic Analyses of the Transvaal Sequences in the Irene-Delmas-Devon Area, Transvaal", Economic Geology Research Unit, Univ. Witwatersrand, Johannesburg, Information Circular No.51, February 1969
Button, A., 1970, "Subsurface Stratigraphic Mapping of the Witwatersrand Sequences in the Irene-Delmas-Devon Area, Transvaal", Economic Geology Research Unit, Univ. Witwatersrand, Johannesburg, Information Circular No.59, October 1970.
Denner E. J, De Villiers E. Gemecs, 19 June 2015. “Manungu Competent Persons Resource & Reserve Report”. Project No: GMXP14060
Digby Wells & Ass. 2009. “Wolvenfontein - Kangala: Hydrologeogical Investigation Report”;
GEMECS, 2017. Updated geological model.
GPT, 2017. The original groundwater impact study report was compiled during 2007 (Ref: FeElo/07/247, by Geo Pollution Technologies, compiled for Ferret Mining, June 2007).
Letsolo Water and Environmental Services cc, June 2017 “Tshedza Mining Resources (Pty) Ltd – Manungu - Manungu Colliery Water and Salt Balance”, Ref: LWES 409.
Meyer R, March 2010. “Hydrogeology of Groundwater Region 10: The Karst Belt (WRC Project No. K5/1916)”. WRC Report No. TT 553/14.
Miller, S., Robertson, A. and Donahue, T. (1997). Advances in Acid Drainage Prediction using the Net Acid Generation (NAG) Test. Proc. 4th International Conference on Acid Rock Drainage, Vancouver, BC, 0533-549.
Price, W.A. (1997). DRAFT Guidelines and Recommended Methods for the prediction of Metal leaching and Acid Rock Drainage at Minesites in British Columbia. British Columbia Ministry of Employment and Investment, Energy and Minerals Division, Smithers, BC, p.143.
Rudnick, R.L. and Gao, S. (2003). The Composition of the Continental Crust. In: The Crust (ed. R.L. Rudnick), Treatise on Geochemistry (eds. H.D. Holland and K.K. Turekian). Elsevier-Pergamon, Oxford. 3, 1-64.
Soregaroli, B.A. and Lawrence, R.W. (1998). Update on Waste Characterization Studies. Proc. Mine Design, Operations and Closure Conference, Polson, Montana.
South African Water Quality Guidelines, Second Edition, 1996. “Volume 1: Domestic Water Use”
Water Use License (WUL).
Waygood C, Palmer M, Schwab R, 2006. “CASE STUDY ON THE REMEDIATION OF THE DEFUNCT COAL MINE ARBOR COLLIERY, IN MPUMALANGA SOUTH AFRICA” Presented at 7th International Conference on Acid Rock Drainage (ICARD).
Werdmuller V.W, Pretorius D. A,Poulos D.J, Hansen L. C, 1990, "A Partial Listing of Witwatersrand Boreholes", Economic Geology Research Unit, Univ. Witwatersrand, Johannesburg, Information Circular No.225, October 1990.

MANUNGU Colliery, Life of Mine: Groundwater Impact Assessment Ref:327e DRAFT2 Jul’ 2019
GROUNDWATER SQUARE
Appendix I – Photographic Record of External Users

MANUNGU Colliery, Life of Mine: Groundwater Impact Assessment Ref:327e DRAFT2 Jul’ 2019
GROUNDWATER SQUARE
Appendix II – Geophysical Survey

MANUNGU Colliery, Life of Mine: Groundwater Impact Assessment Ref:327e DRAFT2 Jul’ 2019
GROUNDWATER SQUARE
Appendix III – Borehole Logs

MANUNGU Colliery, Life of Mine: Groundwater Impact Assessment Ref:327e DRAFT2 Jul’ 2019
GROUNDWATER SQUARE
Appendix IV – Pumping Test Reports

MANUNGU Colliery, Life of Mine: Groundwater Impact Assessment Ref:327e DRAFT2 Jul’ 2019
GROUNDWATER SQUARE
Appendix V – Groundwater Level Data
Site name
Date Water Level (m)
BH1 01-08-2014 6.42
KAM01 20-03-2017 11.48
KGA14 20-03-2017 11.80
KGA15 20-03-2017 10.41
MAN-BH1 01-08-2014 15.91
MAN-BH2D 23-05-2017 28.29
MAN-BH2D 01-07-2018 47.30
MAN-BH2D 31-07-2018 32.49
MAN-BH2D 01-10-2018 40.40
MAN-BH2M 23-05-2017 3.54
MAN-BH2M 01-07-2018 8.13
MAN-BH2M 31-07-2018 8.38
MAN-BH2M 01-10-2018 8.70
MAN-BH2S 23-05-2017 3.03
MAN-BH2S 01-07-2018 6.85
MAN-BH2S 31-07-2018 6.03
MAN-BH2S 01-10-2018 6.40
MAN-BH3D 23-05-2017 26.01
MAN-BH3D 01-07-2018 35.00
MAN-BH3D 31-07-2018 32.39
MAN-BH3D 01-10-2018 31.35
MAN-BH3M 23-05-2017 4.18
MAN-BH3M 01-07-2018 11.00
MAN-BH3M 31-07-2018 5.89
MAN-BH3M 01-10-2018 5.80
MAN-BH3S 23-05-2017 3.99
MAN-BH3S 01-07-2018 5.81
MAN-BH3S 31-07-2018 4.97
MAN-BH3S 01-10-2018 4.80
MAN-BH4D 23-05-2017 28.10
MAN-BH4D 01-07-2018 9.00
MAN-BH4D 31-07-2018 27.79
MAN-BH4D 01-10-2018 43.90
MAN-BH4M 23-05-2017 7.23
MAN-BH4M 01-07-2018 8.67
MAN-BH4M 31-07-2018 8.34
MAN-BH4M 01-10-2018 8.50
MAN-BH4S 23-05-2017 6.40
MAN-BH4S 01-07-2018 8.60
MAN-BH4S 31-07-2018 8.44
MAN-BH4S 01-10-2018 8.50
MAN-BH5M 23-05-2017 4.43
MAN-BH6D 23-05-2017 32.60
MAN-BH6D 01-07-2018 30.00
MAN-BH6D 01-10-2018 31.20
MAN-BH6M 23-05-2017 5.15
MAN-BH6M 01-07-2018 5.50
MAN-BH6M 01-10-2018 5.60
MAN-BH7M 22-08-2017 6.53
MAN-BH7M 31-07-2018 7.67
MAN-BH8 01-07-2018 2.87
MAN-BH8 01-10-2018 2.90
Site name
Date Water Level (m)
MAN-BH8M 22-08-2017 2.77
MAN-BH9D 22-08-2017 8.99
MAN-BH9D 31-07-2018 44.11
MAN-BH9M 22-08-2017 8.23
MAN-BH9M 31-07-2018 8.56
MAN-BH9S 22-08-2017 7.82
MAN-BH9S 31-07-2018 8.36
MAN-BH10M 22-08-2017 5.23
MAN-BH10M 31-07-2018 3.62
MAN-BH11D 15-08-2017 32.10
MAN-BH11D 22-08-2017 36.00
MAN-BH11D 31-07-2018 30.12
MAN-BH11S 22-08-2017 4.18
MAN-BH11S 31-07-2018 5.21
MAN-BH12D 22-08-2017 41.17
MAN-BH12D 31-07-2018 40.42
MAN-BH12M 22-08-2017 4.11
MAN-BH12M 31-07-2018 4.55
MAN-BH12S 22-08-2017 3.50
MAN-BH12S 31-07-2018 4.32
MAN-BH13D 22-08-2017 52.22
MAN-BH13D 31-07-2018 52.08
MBH01 01-08-2014 6.42
MBH01 20-03-2017 7.52
MBH2 01-08-2014 6.33
MBH2 20-03-2017 5.23
MBH4 20-03-2017 8.68
MBH5 08-06-2016 0.50
MBH5 08-09-2016 0.50
MBH5 06-12-2016 0.50
MBH5 16-03-2017 0.50
MBH6 20-03-2017 11.55
MBH10 20-03-2017 80.56
MBH12 20-03-2017 56.80
MBH12 31-07-2018 67.40
MBH13 20-03-2017 3.88
MBH15 20-03-2017 31.43
MBH17 20-03-2017 5.85
MBH18B 20-03-2017 28.48
MBH22 20-03-2017 39.10
MBH23 20-03-2017 71.74
MBH27 20-03-2017 6.56
MBH28 20-03-2017 1.14
MBH29 20-03-2017 11.26
MBH35 20-03-2017 27.21
MBH36B 20-03-2017 15.41
MBH40 20-03-2017 3.33
MBH41 20-03-2017 11.20
MBH45 20-03-2017 9.91
MBH46 20-03-2017 75.75
MBH47 20-03-2017 12.63

MANUNGU Colliery, Life of Mine: Groundwater Impact Assessment Ref:327e DRAFT2 Jul’ 2019
GROUNDWATER SQUARE
Appendix VI – Groundwater Quality Data
Site Name Date pH EC
(mS/m) TDS
(mg/L) Ca
(mg/L) Mg
(mg/L) Na
(mg/L) K
(mg/L) Cl
(mg/L) SO4
(mg/L) TALK (mg/L)
NO3 (as N) (mg/L)
F (mg/L)
Fe (mg/L)
Mn (mg/L)
Al (mg/L)
1 - Target Level (<) 5.5
2 - Target Level (>) 9.5 150 1000 150 70 200 50 200 400 10.0 1.0 0.20 0.10 0.30
3 - Critical Level (<) 4
4 - Critical Level (>) 11 370 2400 300 100 400 100 600 600 20.0 1.5 2.00 1.00 0.50
B2N073 13-03-2017 9.4 33 176 3 12 47 1 13 12 120 3.4 0.2 <0.01 <0.01 <0.01
KAM01 13-03-2017 7.2 73 374 37 21 74 3 56 43 235 <0.35 0.3 <0.01 0.04 <0.01
KGA14 13-03-2017 7.8 55 301 53 25 13 4 15 5 211 13.4 <0.09 <0.01 <0.01 <0.01
KGA15 13-03-2017 7.8 63 347 58 33 12 3 18 8 230 17.2 <0.09 <0.01 <0.01 <0.01
MAN-BH1 16-07-2014 8.2 48 255 28 20 40 6 11 2 244 <0.01 0.5 0.54 0.14 0.12
MAN-BH2D 23-05-2017 9.3 70 389 0 0 163 4 23 5 318 <0.35 1.4 0.04 <0.01 0.05
MAN-BH2D 01-06-2018 9.1 48 389 1 1 161 1 20 1 314 0.3 1.3 <0.004 <0.001 <0.002
MAN-BH2D 01-09-2018 9.0 69 376 1 0 160 1 24 <0.141 304 <0.194 1.4 0.01 <0.001 1.09
MAN-BH2D-Pumptest
03-07-2017 7.2 69 362 44 15 77 3 17 3 326 1.7 0.4 0.03 <0.01 0.04
MAN-BH2M 23-05-2017 8.2 34 175 31 11 15 5 12 8 140 1.6 0.1 0.01 0.02 <0.01
MAN-BH2M 01-06-2018 8.7 8 32 3 2 4 1 3 5 15 0.5 0.4 <0.004 <0.001 <0.002
MAN-BH2M 01-09-2018 8.3 31 207 39 10 14 4 14 4 127 3.2 <0.263 0.01 0.04 0.24
MAN-BH2S 23-05-2017 9.2 21 109 12 7 13 5 14 12 67 0.5 0.2 0.02 <0.01 <0.01
MAN-BH2S 01-06-2018 7.9 19 117 20 7 12 4 12 5 87 0.4 <0.263 <0.004 0.18 <0.002
MAN-BH2S 01-09-2018 8.3 22 120 22 7 12 4 14 0 99 <0.194 <0.263 <0.004 0.17 1.37
MAN-BH3D 23-05-2017 8.4 55 301 15 16 78 5 20 31 225 <0.35 0.8 <0.01 <0.01 0.01
MAN-BH3D 01-06-2018 8.2 38 263 24 18 44 5 6 6 209 0.4 0.5 <0.004 0.03 <0.002
MAN-BH3D 01-09-2018 8.4 43 261 24 19 45 5 8 6 208 0.4 0.4 <0.004 0.01 0.13
MAN-BH3M 23-05-2017 7.2 36 189 27 16 25 7 7 6 169 <0.35 0.2 <0.01 0.13 <0.01
MAN-BH3M 01-06-2018 7.1 39 259 27 16 27 5 5 2 187 0.4 0.8 3.88 0.16 <0.002
MAN-BH3M 01-09-2018 7.5 34 259 28 17 27 6 7 <0.141 192 0.2 0.3 3.68 0.17 0.56
MAN-BH3S 23-05-2017 7.9 24 125 16 10 15 3 17 23 68 <0.35 0.3 0.01 0.08 <0.01
MAN-BH3S 01-06-2018 6.9 14 85 9 6 10 2 13 2 51 0.3 0.5 2.32 0.38 <0.002
MAN-BH3S 01-09-2018 6.9 13 80 8 6 10 2 17 <0.141 53 0.2 <0.263 1.81 0.44 0.51
MAN-BH4D 23-05-2017 8.0 37 196 30 18 18 8 5 9 168 1.5 <0.09 0.07 0.02 <0.01
MAN-BH4D 01-06-2018 9.1 26 143 7 12 11 7 17 4 96 2.6 <0.263 <0.004 0.00 <0.002
MAN-BH4D 01-09-2018 8.5 33 193 23 20 20 6 12 3 149 2.2 0.6 <0.004 0.04 0.24
MAN-BH4M 23-05-2017 7.2 34 167 27 15 15 10 4 4 154 <0.35 0.1 <0.01 0.20 <0.01
MAN-BH4M 01-06-2018 8.3 27 168 18 18 16 9 3 2 161 0.3 <0.263 <0.004 0.02 <0.002
MAN-BH4M 01-09-2018 8.3 39 232 35 20 17 10 4 <0.141 199 0.2 <0.263 <0.004 0.09 0.46
MAN-BH4S 23-05-2017 8.1 27 135 18 12 8 10 6 8 115 <0.35 0.2 <0.01 0.15 <0.01
MAN-BH4S 01-06-2018 8.0 34 190 30 18 9 8 18 19 127 0.4 <0.263 <0.004 0.64 <0.002
MAN-BH4S 01-09-2018 8.3 30 159 27 16 9 8 21 0 122 0.4 <0.263 <0.004 0.64 0.14
MAN-BH5M 23-05-2017 8.8 31 174 17 11 19 9 13 20 108 3.3 0.2 <0.01 0.01 <0.01
MAN-BH6D 23-05-2017 7.9 42 228 22 12 45 3 14 14 152 5.7 0.5 0.06 0.03 <0.01
MAN-BH6D 01-06-2018 7.7 37 276 22 10 62 3 19 9 180 1.9 0.8 <0.004 0.02 <0.002
MAN-BH6D 01-09-2018 8.3 45 279 22 10 61 3 23 13 170 2.9 0.9 <0.004 0.01 0.41
MAN-BH6D-Pumptest
29-06-2017 7.2 68 351 49 17 63 3 16 <0.5 323 1.9 0.3 0.02 <0.01 0.03
MAN-BH6M 23-05-2017 7.5 38 231 33 17 15 5 9 37 108 11.4 <0.09 0.03 <0.01 <0.01
MAN-BH6M 01-06-2018 7.7 34 263 33 16 16 5 7 16 114 8.5 0.6 <0.004 0.01 <0.002
MAN-BH6M 01-09-2018 8.1 39 292 36 17 16 5 9 24 116 9.6 <0.263 <0.004 0.01 1.26
MAN-BH7M 22-08-2017 8.1 40 204 29 14 24 10 9 6 181 0.8 <0.09 0.24 0.04 0.03
MAN-BH8M 22-08-2017 7.6 56 300 34 22 43 6 8 13 279 0.4 0.1 <0.01 0.16 <0.01
MAN-BH8M 01-06-2018 9.2 25 170 3 15 39 6 10 8 141 0.3 0.6 <0.004 <0.001 <0.002
MAN-BH8M 01-09-2018 8.9 30 173 6 16 40 6 13 <0.141 148 0.2 0.6 <0.004 0.01 0.56
MAN-BH9D 15-09-2017 7.3 44 223 27 26 18 5 18 4 186 2.5 0.7 0.08 0.04 0.01
MAN-BH9D-Pumptest
16-09-2017 8.1 46 246 39 21 28 2 12 5 221 1.4 0.6 0.02 0.02 <0.01
MAN-BH9M 23-08-2017 7.9 40 235 34 17 12 9 24 4 132 11.2 <0.09 1.04 0.03 0.01
MAN-BH9S 23-08-2017 8.1 36 213 28 14 9 9 22 6 69 18.5 0.3 0.51 0.03 0.15
MAN-BH10M 22-08-2017 7.3 53 289 53 23 15 3 11 29 181 9.8 <0.09 <0.01 0.17 <0.01
MAN-BH11D 23-08-2017 8.8 116 617 2 1 249 4 54 1 509 <0.35 <0.09 0.75 <0.01 0.05
MAN-BH11D -Pumptest
15-08-2017 8.5 116 679 4 2 277 3 53 <0.5 560 <0.35 1.9 0.04 <0.01 0.02
MAN-BH11S 23-08-2017 7.2 96 527 143 26 14 7 156 14 270 0.4 <0.09 0.64 1.00 <0.01
MAN-BH12D 22-08-2017 8.7 124 652 2 1 271 3 25 21 538 0.9 0.2 <0.01 <0.01 0.01
MAN-BH12M 22-08-2017 8.0 66 355 31 20 75 5 23 20 288 1.0 <0.09 2.08 0.06 0.07
MAN-BH12S 22-08-2017 7.9 103 538 46 37 99 4 77 93 297 <0.35 <0.09 <0.01 0.14 <0.01
MAN-BH13D 22-08-2017 8.8 125 685 3 2 260 7 43 9 562 <0.35 7.4 0.99 <0.01 14.46
MAN-PCD 23-05-2017 8.6 154 942 28 12 260 7 13 265 245 46.4 1.4 0.02 <0.01 0.05
MBH01 08-06-2016 7.4 37 208 30 14 13 7 21 36 77 9.5 0.0 <0.01 <0.01 <0.01
MBH01 14-10-2016 7.6 36 212 30 15 13 6 19 39 83 9.0 <0.09 <0.01 <0.01 0.05
MBH01 14-11-2016 7.7 43 243 37 19 15 8 25 26 119 9.5 <0.09 <0.01 <0.01 0.02
MBH01 06-12-2016 7.7 43 235 37 18 15 7 26 16 122 9.6 <0.09 <0.01 <0.01 0.04
MBH01 19-01-2017 7.4 37 202 35 14 8 6 21 25 80 9.7 <0.01 <0.63 0.08 <0.01
MBH01 20-02-2017 7.4 42 247 40 19 15 7 26 19 118 11.2 <0.09 <0.01 <0.01 <0.01
MBH01 16-03-2017 7.7 42 231 37 18 14 7 24 16 114 10.8 <0.09 <0.01 <0.01 <0.01

MANUNGU Colliery, Life of Mine: Groundwater Impact Assessment Ref:327e DRAFT2 Jul’ 2019
GROUNDWATER SQUARE
Site Name Date pH EC
(mS/m) TDS
(mg/L) Ca
(mg/L) Mg
(mg/L) Na
(mg/L) K
(mg/L) Cl
(mg/L) SO4
(mg/L) TALK (mg/L)
NO3 (as N) (mg/L)
F (mg/L)
Fe (mg/L)
Mn (mg/L)
Al (mg/L)
1 - Target Level (<) 5.5
2 - Target Level (>) 9.5 150 1000 150 70 200 50 200 400 10.0 1.0 0.20 0.10 0.30
3 - Critical Level (<) 4
4 - Critical Level (>) 11 370 2400 300 100 400 100 600 600 20.0 1.5 2.00 1.00 0.50
MBH01 22-03-2017 7.0 35 198 26 14 13 7 17 30 79 10.1 <0.09 <0.01 <0.01 <0.01
MBH01 11-07-2017 7.5 43 244 100 83 15 7 26 16 124 10.3 <0.09 <0.01 <0.01 <0.01
MBH01 21-08-2017 7.9 40 210 31 15 13 6 21 21 98 9.9 <0.09 <0.01 <0.01 <0.01
MBH01 21-09-2017 7.7 42 239 38 17 13 6 25 18 119 11.5 <0.09 <0.01 <0.01 <0.01
MBH01-Office Tap 1
16-07-2017 7.5 43 244 100 83 15 7 26 16 124 10.3 <0.09 <0.01 <0.01 <0.01
MBH01-Office Tap 1
16-08-2017 7.9 40 210 31 15 13 6 21 21 98 9.9 <0.09 <0.01 <0.01 <0.01
MBH01-Office Tap 1
16-09-2017 7.7 42 239 38 17 13 6 25 18 119 11.5 <0.09 <0.01 <0.01 <0.01
MBH01-Office Tap 1
16-10-2017 7.8 42 238 36 18 14 6 26 20 118 11.0 <0.09 <0.01 <0.01 <0.01
MBH01-
Office Tap 1 16-11-2017 7.6 42 242 38 18 13 5 25 19 119 11.9 <0.09 <0.01 <0.01 <0.01
MBH01-Office Tap 1
16-12-2017 7.4 42 230 36 17 13 5 23 15 <0.01 11.3 <0.09 <0.01 <0.01 <0.01
MBH01-Office Tap 1
16-01-2018 7.4 42 248 38 21 14 6 28 17 121 11.9 <0.09 <0.01 <0.01 <0.01
MBH01-Office Tap 1
16-02-2018 7.7 40 300 37 18 16 7 23 16 121 8.1 <0,063 <0,004 <0,001
MBH01-Office Tap 1
16-03-2018 7.5 46 312 41 19 16 7 24 17 132 8.6 <0.263 <0.004 <0.001 <0.002
MBH01-Office Tap 1
01-05-2018 7.8 42 330 40 19 15 7 23 19 138 8.9 <0.263 <0.004 0.00 <0.002
MBH01-Office Tap 1
01-06-2018 7.7 49 312 34 16 15 7 31 24 102 8.7 <0.263 <0.004 <0.001 <0.002
MBH01-Office Tap 1
01-07-2018 7.6 44 296 34 16 15 7 19 25 105 7.1 <0.263 <0.004 <0.001 <0.002
MBH01-Office Tap 1
01-08-2018 7.6 34 283 30 14 14 7 15 29 109 6.5 <0.263 <0.004 <0.001 <0.002
MBH01-Office Tap 1
01-09-2018 7.7 42 344 42 19 15 7 21 21 153 8.7 0.3 <0.004 <0.001 <0.002
MBH01-Office Tap 1
01-10-2018 8.0 39 314 36 18 15 7 22 31 105 7.6 <0.263 <0.004 0.00 0.03
MBH01-Office Tap 1
Q1 7.7 45 313 36 17 15 7 24 22 115 8.2 <0.263 <0.004 0.00 <0.002
MBH01-Office Tap 1
Q2 7.7 38 314 36 17 15 7 19 27 122 7.6 0.3 <0.004 0.00 0.03
MBH01-Office Tap 2
16-03-2017 7.4 40 234 20 8 33 5 6 78 22 16.0 0.2 0.01 0.01 0.01
MBH01-Office Tap 2
16-06-2017 7.7 47 246 37 19 25 6 10 33 181 1.7 <0.09 0.02 0.06 0.05
MBH01-Office Tap 2
16-09-2017 7.7 70 386 62 37 24 6 25 49 304 <0.35 0.1 <0.01 0.06 <0.01
MBH01-Office Tap 2
16-12-2017 7.5 52 281 41 23 26 4 14 34 <0.01 2.0 0.3 0.43 0.38 0.75
MBH01-Office Tap 2
16-02-2018 7.7 40 275 35 17 15 6 23 15 124 7.9 <0,263 <0,004 <0,001 <0,002
MBH01-Office Tap 2
16-03-2018 7.6 46 306 40 19 15 7 24 17 121 8.6 <0.263 <0.004 <0.001 <0.002
MBH01-Office Tap 2
01-05-2018 7.7 42 332 39 18 15 7 22 21 135 8.9 <0.263 <0.004 <0.001 <0.002
MBH01-Office Tap 2
01-06-2018 7.6 44 313 34 16 15 7 23 23 114 8.9 <0.263 <0.004 <0.001 <0.002
MBH01-Office Tap 2
01-07-2018 7.5 44 298 34 16 15 7 19 23 107 7.2 <0.263 <0.004 <0.001 <0.002
MBH01-Office Tap 2
01-08-2018 7.6 33 282 30 14 14 7 15 29 105 6.7 <0.263 <0.004 <0.001 <0.002
MBH01-Office Tap 2
01-09-2018 7.6 40 332 42 19 15 7 21 14 149 8.6 <0.263 <0.004 <0.001 <0.002
MBH01-Office Tap 2
01-10-2018 8.0 38 296 32 17 15 7 21 32 84 7.2 <0.263 <0.004 <0.001 0.11
MBH01-Office Tap 2
Q1 7.6 43 314 36 17 15 7 21 22 119 8.3 <0.263 <0.004 <0.001 <0.002
MBH01-Office Tap 2
Q2 7.7 37 303 35 17 15 7 19 25 113 7.5 <0.263 <0.004 <0.001 0.11
MBH05 14-09-2017 7.7 70 386 62 37 24 6 25 49 304 <0.35 0.1 <0.01 0.06 <0.01
MBH4 08-06-2016 6.9 38 212 30 16 13 7 15 9 97 14.3 <0.09 <0.01 <0.01 0.03
MBH4 14-10-2016 7.0 37 204 32 16 11 7 17 9 100 11.8 <0.09 0.02 <0.01 0.10
MBH4 14-11-2016 7.5 39 214 32 18 12 8 19 10 108 11.3 <0.09 <0.01 <0.01 0.05
MBH4 06-12-2016 7.2 41 218 34 18 14 7 18 10 112 11.3 <0.09 <0.01 <0.01 0.06
MBH4 20-02-2017 7.1 39 231 35 19 13 7 18 10 114 13.6 <0.09 <0.01 <0.01 <0.01
MBH4 16-03-2017 7.6 39 221 33 17 13 7 17 13 101 13.7 0.2 <0.01 <0.01 <0.01
MBH4 16-04-2017 7.1 39 217 30 17 12 6 17 9 101 14.6 0.1 0.01 0.01 0.01
MBH4 16-05-2017 7.1 42 233 33 18 13 9 18 16 122 12.2 <0.09 <0.01 <0.01 <0.01
MBH4 16-06-2017 7.2 42 233 34 18 13 8 18 17 118 12.2 0.1 0.02 <0.01 <0.01
MBH4 17-07-2017 7.1 40 <0.01 14 7 18 18 113 15.9 <0.09 <0.01 <0.01 <0.01

MANUNGU Colliery, Life of Mine: Groundwater Impact Assessment Ref:327e DRAFT2 Jul’ 2019
GROUNDWATER SQUARE
Site Name Date pH EC
(mS/m) TDS
(mg/L) Ca
(mg/L) Mg
(mg/L) Na
(mg/L) K
(mg/L) Cl
(mg/L) SO4
(mg/L) TALK (mg/L)
NO3 (as N) (mg/L)
F (mg/L)
Fe (mg/L)
Mn (mg/L)
Al (mg/L)
1 - Target Level (<) 5.5
2 - Target Level (>) 9.5 150 1000 150 70 200 50 200 400 10.0 1.0 0.20 0.10 0.30
3 - Critical Level (<) 4
4 - Critical Level (>) 11 370 2400 300 100 400 100 600 600 20.0 1.5 2.00 1.00 0.50
MBH4 21-08-2017 39 217 30 17 12 6 17 9 101 14.6 <0.09 <0.01 <0.01 <0.01
MBH4 21-09-2017 7.3 42 241 38 17 13 7 18 18 120 13.0 <0.09 0.01 <0.01 <0.01
MBH4 16-10-2017 7.4 42 241 36 72 13 5 19 15 112 15.4 <0.09 0.01 <0.01 <0.01
MBH4 16-11-2017 7.2 43 240 38 19 13 6 19 17 122 12.6 <0.09 0.01 <0.01 <0.01
MBH4 16-12-2017 7.1 44 249 38 19 13 6 21 20 12.9 <0.09 0.01 <0.01 <0.01
MBH4 16-01-2018 7.8 48 258 40 24 26 3 19 12 205 2.1 0.6 0.02 <0.01 0.03
MBH4 16-02-2018 8.0 46 258 34 26 37 2 17 16 216 0.6 0.6 <0,004 0.00 <0,04
MBH4 16-03-2018 8.0 41 284 35 26 34 3 18 11 219 0.6 0.5 <0.004 <0.001 <0.002
MBH4 01-05-2018 8.1 45 302 34 25 33 3 17 12 239 0.8 0.6 <0.004 0.02 <0.002
MBH4 01-06-2018 8.0 45 281 33 24 35 2 19 12 203 0.8 0.7 <0.004 <0.001 <0.002
MBH4 01-07-2018 8.0 46 290 34 25 36 3 17 10 219 0.7 0.6 <0.004 <0.001 <0.002
MBH4 01-08-2018 7.9 49 294 33 24 35 2 15 11 244 0.5 0.7 <0.004 <0.001 <0.002
MBH4 01-09-2018 7.8 47 306 38 27 34 3 15 10 247 0.6 0.7 <0.004 <0.001 <0.002
MBH4 01-10-2018 8.2 48 299 38 26 30 5 20 22 200 1.3 0.5 <0.004 0.01 0.08
MBH4 Q1 8.0 45 291 34 25 35 3 18 11 220 0.8 0.6 <0.004 0.02 <0.002
MBH4 Q2 8.0 48 300 36 25 33 3 17 14 230 0.8 0.6 <0.004 0.01 0.08
MBH5 08-06-2016 6.9 30 153 24 12 6 8 11 44 74 0.8 0.1 0.15 0.20 0.59
MBH5 06-12-2016 7.7 40 220 34 18 16 7 17 64 97 1.5 <0.09 <0.01 0.02 0.05
MBH5 16-03-2017 7.4 40 234 20 8 33 5 6 78 22 16.0 0.2 <0.01 <0.01 <0.01
MBH6 13-03-2017 7.5 61 312 62 17 20 10 48 10 198 6.0 <0.09 <0.01 <0.01 <0.01
MBH12 14-03-2017 7.9 67 356 16 14 104 3 21 11 308 0.4 0.5 <0.01 <0.01 <0.01
MBH12 31-07-2018 7.7 67 362 20 16 101 2 26 11 305 0.4 0.7 0.08 <0.01 <0.01
MBH13 14-03-2017 7.7 75 421 100 20 15 5 38 21 251 15.9 <0.09 <0.01 <0.01 <0.01
MBH15 14-03-2017 7.8 72 389 59 23 49 9 14 21 330 3.6 0.1 <0.01 <0.01 <0.01
MBH17 08-06-2016 8.6 43 208 20 22 27 6 18 6 174 1.1 0.3 <0.01 <0.01 0.03
MBH17 22-03-2017 7.8 131 725 47 30 197 5 83 33 542 1.0 0.3 <0.01 <0.01 <0.01
MBH18B 14-03-2017 7.8 38 188 32 16 16 4 13 9 161 <0.35 0.1 <0.01 <0.01 <0.01
MBH20 15-03-2017 7.4 32 171 22 11 19 6 10 4 119 6.3 0.1 <0.01 <0.01 <0.01
MBH25 20-03-2017 7.5 94 494 60 37 78 4 56 23 370 3.2 0.2 <0.01 <0.01 <0.01
MBH27 22-03-2017 7.0 40 207 40 13 22 2 5 11 191 <0.35 <0.09 <0.01 0.01 <0.01
MBH29 20-03-2017 7.8 325 2166 302 259 76 2 546 517 435 46.1 <0.09 <0.01 <0.01 <0.01
MBH31 20-03-2017 7.8 74 378 52 33 39 3 72 8 239 6.1 <0.09 <0.01 <0.01 <0.01
MBH32 08-06-2016 7.2 66 340 64 22 25 8 39 25 217 6.1 <0.09 <0.01 <0.01 0.02
MBH32 06-12-2016 7.3 68 360 71 23 27 8 39 32 223 5.8 <0.09 0.10 <0.01 0.03
MBH32 14-03-2017 7.5 63 333 59 21 26 7 34 24 232 5.0 <0.09 <0.01 <0.01 <0.01
MBH32 16-03-2017 7.3 63 338 65 21 24 7 33 28 227 5.3 <0.09 <0.01 <0.01 <0.01
MBH32 16-06-2017 7.9 66 348 66 23 26 9 37 29 <0.01 4.6 <0.09 <0.01 <0.01 <0.01
MBH32 16-09-2017 7.4 63 344 65 21 23 7 35 29 5.7 <0.09 <0.01 <0.01 <0.01
MBH32 17-09-2017 7.4 63 344 65 21 23 7 35 29 5.7 <0.09 <0.01 <0.01 <0.01
MBH32 16-12-2017 7.3 65 352 67 22 24 6 37 29 <0.01 6.3 <0.09 <0.01 <0.01 <0.01
MBH35 20-03-2017 7.2 45 236 35 17 19 5 24 16 146 7.1 <0.09 <0.01 <0.01 <0.01
MBH36A 20-03-2017 7.6 88 449 37 26 98 5 54 21 346 <0.35 0.3 0.01 <0.01 <0.01
MBH40 14-03-2017 7.7 76 405 70 26 44 2 46 24 301 2.5 0.1 <0.01 <0.01 <0.01
MBH41 15-03-2017 7.3 23 124 16 12 9 3 4 4 90 5.4 0.1 <0.01 <0.01 <0.01
MBH45 20-03-2017 7.4 123 660 140 43 38 1 153 35 357 8.0 <0.09 <0.01 <0.01 <0.01
MBH46 20-03-2017 7.9 67 336 44 29 39 3 64 8 218 4.0 <0.09 <0.01 <0.01 <0.01
MBH47 20-03-2017 7.8 116 676 99 66 33 3 88 127 316 16.0 <0.09 <0.01 <0.01 <0.01
MWQ1 08-06-2016 7.5 24 122 11 9 18 6 4 15 91 0.7 0.3 0.09 0.02 0.10
MWQ1 14-11-2016 6.9 27 152 11 10 22 11 12 31 88 <0.35 0.2 0.36 0.78 0.78
MWQ1 06-12-2016 7.9 36 194 22 16 30 7 14 16 147 <0.35 0.2 0.12 <0.01 0.10
MWQ1 19-01-2017 7.2 31 167 15 13 30 4 11 24 115 <0.35 0.3 0.32 0.08 0.27
MWQ1 20-02-2017 8.3 33 182 18 13 36 4 10 11 151 <0.35 0.3 0.11 <0.01 0.02
MWQ1 16-03-2017 7.6 39 209 19 14 28 9 13 21 152 0.8 0.2 0.04 <0.01 0.02
MWQ1 16-04-2017 7.2 39 188 16 14 34 4 25 13 137 <0.35 0.2 0.16 <0.01 <0.01
MWQ1 17-05-2017 7.8 30 150 18 13 18 5 14 16 110 <0.35 0.1 0.05 0.01 0.05
MWQ1 17-06-2017 7.3 37 202 25 16 27 6 20 20 144 <0.35 0.2 0.09 0.33 0.07
MWQ1 11-07-2017 7.1 45 251 30 23 31 7 29 19 183 <0.35 0.3 0.02 1.47 <0.01
MWQ1 17-08-2017 8.0 52 274 27 23 44 11 47 11 180 0.8 0.1 0.01 <0.01 <0.01
MWQ1 17-09-2017 7.3 106 577 49 37 96 21 128 8 374 <0.35 0.4 4.52 4.83 <0.01
MWQ1 16-11-2017 7.0 17 299 38 22 26 17 28 65 162 0.5 0.3 0.32 0.61 0.06
MWQ1 16-12-2017 7.2 56 306 19 19 61 8 31 71 158 0.4 0.3 0.21 0.01 0.08
MWQ1 16-01-2018 7.5 68 374 26 29 73 12 47 21 267 0.5 0.5 0.26 0.53 0.31
MWQ1 16-02-2018 8.4 58 382 20 68 16 <0,002 36 13 246 0.2 28.8 2.11 0.02 0.11
MWQ1 16-03-2018 7.4 45 300 31 22 37 18 26 <0.141 240 0.2 0.5 0.92 1.48 <0.002
MWQ1 01-05-2018 8.1 46 283 23 17 57 7 21 14 220 0.5 0.4 <0.004 0.28 <0.002
MWQ1 01-06-2018 7.9 51 326 31 22 65 7 30 12 242 0.3 0.5 <0.004 2.15 0.05
MWQ1 01-07-2018 7.9 45 349 36 25 67 11 33 5 271 0.3 0.4 <0.004 1.96 <0.002
MWQ1 01-08-2018 8.1 82 462 38 29 101 12 48 1 378 <0.194 0.6 <0.004 1.16 <0.002
MWQ1 Q1 8.0 47 319 30 21 63 9 28 10 244 0.3 0.4 <0.004 1.46 0.05
MWQ3 08-06-2016 7.4 32 165 14 11 24 7 16 27 95 1.3 0.4 0.80 <0.01 1.77
MWQ3 14-10-2016 7.7 48 276 21 17 43 13 30 57 141 1.6 0.7 1.32 <0.01 1.45
MWQ3 14-11-2016 7.1 19 99 7 6 12 11 10 21 52 <0.35 0.3 0.08 0.01 0.16
MWQ3 06-12-2016 7.6 31 175 16 12 26 12 15 35 90 0.7 0.5 0.09 <0.01 0.16
MWQ3 19-01-2017 7.4 25 129 14 8 17 7 12 24 75 <0.35 0.6 <0.01 0.01 <0.01

MANUNGU Colliery, Life of Mine: Groundwater Impact Assessment Ref:327e DRAFT2 Jul’ 2019
GROUNDWATER SQUARE
Site Name Date pH EC
(mS/m) TDS
(mg/L) Ca
(mg/L) Mg
(mg/L) Na
(mg/L) K
(mg/L) Cl
(mg/L) SO4
(mg/L) TALK (mg/L)
NO3 (as N) (mg/L)
F (mg/L)
Fe (mg/L)
Mn (mg/L)
Al (mg/L)
1 - Target Level (<) 5.5
2 - Target Level (>) 9.5 150 1000 150 70 200 50 200 400 10.0 1.0 0.20 0.10 0.30
3 - Critical Level (<) 4
4 - Critical Level (>) 11 370 2400 300 100 400 100 600 600 20.0 1.5 2.00 1.00 0.50
MWQ3 20-02-2017 7.5 31 176 16 11 28 10 17 35 93 0.9 0.6 <0.01 <0.01 <0.01
MWQ3 16-03-2017 7.5 24 127 12 9 17 10 9 18 85 <0.35 0.4 0.06 <0.01 0.08
MWQ3 16-04-2017 7.2 32 161 13 11 24 9 14 32 93 0.4 0.5 0.01 <0.01 <0.01
MWQ3 17-05-2017 7.6 32 172 14 12 25 10 16 34 96 <0.35 0.5 1.34 0.02 2.22
MWQ3 17-06-2017 7.6 34 183 15 12 28 11 16 35 104 0.5 0.5 0.23 <0.01 0.45
MWQ3 11-07-2017 7.4 36 212 18 14 32 11 19 45 113 0.8 0.6 0.09 0.01 0.18
MWQ3 11-08-2017 7.9 41 223 20 14 34 11 23 47 117 0.9 0.3 0.13 <0.01 0.25
MWQ3 11-09-2017 7.4 44 241 22 15 35 11 23 56 123 1.1 0.7 <0.01 <0.01 <0.01
MWQ3 16-10-2017 7.8 48 277 25 17 47 14 26 60 141 0.6 0.9 0.04 <0.01 0.06
MWQ3 16-11-2017 7.7 15 296 27 19 48 11 30 70 148 0.5 1.1 <0.01 <0.01 <0.01
MWQ3 16-12-2017 7.2 28 306 12 9 21 10 13 42 70 <0.35 0.4 0.11 0.05 0.15
MWQ3 16-01-2018 7.5 60 374 32 26 56 11 36 84 156 <0.35 1.3 ,0 <0.01 <0.01
MWQ3 16-02-2018 7.8 20 138 6 15 8 0 7 26 63 0.3 9.8 0.04 0.01 <0,004
MWQ3 16-03-2018 7.6 22 171 22 13 18 9 8 23 126 <0.194 0.3 <0.004 0.02 0.07
MWQ3 01-06-2018 8.0 57 368 36 26 59 14 42 66 196 0.8 0.7 <0.004 0.90 <0.002
MWQ3 01-07-2018 8.2 63 458 45 28 85 16 52 78 248 0.3 0.8 <0.004 <0.001 <0.002
MWQ3 Q1 8.1 60 413 40 27 72 15 47 72 222 0.6 0.7 <0.004 0.90 <0.002
MWQ3 Q2
MWQ4 08-06-2016 7.5 97 485 41 28 98 11 95 28 300 0.4 0.3 0.09 0.11 0.04
MWQ4 14-10-2016 7.2 207 1218 63 62 294 26 233 13 836 <0.35 1.4 2.03 6.49 0.03
MWQ4 14-11-2016 8.2 115 721 90 32 88 9 64 375 103 <0.35 <0.09 0.03 <0.01 0.05
MWQ4 16-03-2017 7.4 114 625 53 35 130 14 117 64 354 <0.35 0.2 0.39 <0.01 <0.01
MWQ4 17-05-2017 7.4 144 786 52 38 184 13 152 76 448 <0.35 <0.09 0.11 1.05 <0.01
MWQ4 17-06-2017 7.4 181 943 70 50 200 25 148 5 719 <0.35 0.3 3.27 5.29 0.22
MWQ4 11-07-2017 7.4 36 212 18 14 32 11 19 45 113 0.8 0.6 0.09 0.01 0.18
MWQ4 11-08-2017 7.9 41 223 20 14 34 11 23 47 117 0.9 0.3 0.13 <0.01 0.25
MWQ4 11-09-2017 7.4 44 241 22 15 35 11 23 56 123 1.1 0.7 <0.01 <0.01 <0.01
MWQ4 16-09-2017 7.8 172 888 60 48 216 12 127 11 687 <0.35 0.2 1.28 <0.01 <0.01
MWQ5 08-06-2016 7.5 36 177 22 17 19 8 16 19 123 0.5 0.2 0.08 <0.01 0.17
MWQ5 14-10-2016 7.9 50 277 19 26 40 10 36 35 184 <0.35 0.4 0.03 0.02 0.05
MWQ5 14-11-2016 7.3 34 176 14 14 24 11 25 35 86 <0.35 0.1 0.35 <0.01 0.65
MWQ5 06-12-2016 8.1 57 297 30 24 40 13 33 35 201 <0.35 0.1 0.01 <0.01 0.06
MWQ5 19-01-2017 7.6 48 226 2 17 36 7 54 24 110 <0.35 0.2 0.27 0.08 0.28
MWQ5 20-02-2017 8.7 40 208 16 17 35 7 51 15 111 <0.35 0.3 0.07 0.04 0.03
MWQ5 16-03-2017 7.5 42 213 16 18 35 10 46 25 106 <0.35 0.1 0.13 0.01 0.12
MWQ5 16-04-2017 8.2 43 214 17 17 34 9 47 19 118 <0.35 0.2 0.05 <0.01 0.04
MWQ5 17-05-2017 7.9 32 161 16 14 19 9 26 12 103 <0.35 0.1 1.17 0.13 1.58
MWQ5 17-06-2017 6.9 36 166 17 14 20 9 31 5 109 <0.35 0.2 0.17 1.65 <0.01
MWQ5 11-07-2017 7.1 45 251 30 23 31 7 29 19 183 <0.35 0.3 0.02 1.47 <0.01
MWQ5 11-08-2017 8.0 52 251 23 23 33 12 51 9 169 <0.35 0.1 <0.01 0.06 <0.01
MWQ5 11-09-2017 7.6 60 281 22 98 38 12 56 6 188 <0.35 0.5 1.97 2.19 <0.01
MWQ5 16-10-2017 7.7 64 327 27 29 47 13 75 6 206 0.4 0.5 <0.01 <0.01 0.03
MWQ5 16-11-2017 7.5 21 276 28 24 33 13 54 19 168 0.5 0.5 0.02 0.08 <0.01
MWQ5 16-12-2017 7.1 58 310 21 21 52 13 43 62 160 <0.35 0.3 0.37 0.26 0.16
MWQ5 16-01-2018 8.9 67 353 26 25 65 15 60 17 190 0.4 0.4 0.27 0.04 0.37
MWQ5 16-02-2018 8.3 78 538 34 89 26 <0,002 66 <0,141 329 0.9 35.0 2.72 0.02 0.27
MWQ5 16-03-2018 7.5 39 260 32 20 33 12 29 6 196 <0.194 0.3 <0.004 0.04 <0.002
MWQ5 01-05-2018 8.1 34 279 30 20 39 12 30 20 196 0.4 0.3 0.01 0.32 0.14
MWQ5 01-06-2018 8.2 32 252 25 19 39 11 33 16 162 0.3 0.4 <0.004 0.74 <0.002
MWQ5 01-07-2018 8.4 37 252 24 15 42 13 35 17 160 2.0 0.3 <0.004 <0.001 <0.002
MWQ5 01-08-2018 8.2 57 324 29 22 50 14 39 18 236 0.4 0.5 0.01 0.25 0.10
MWQ5 01-09-2018 7.9 58 349 29 27 61 14 51 13 248 0.2 0.5 <0.004 0.40 0.03
MWQ5 01-10-2018 8.5 68 359 22 25 76 16 81 6 213 <0.194 0.5 <0.004 <0.001 <0.002
MWQ5 Q1 8.2 34 261 26 18 40 12 33 18 173 0.9 0.3 0.01 0.53 0.14
MWQ5 Q2 8.2 61 344 26 25 62 15 57 12 232 0.3 0.5 0.01 0.33 0.06
MWQ6 08-06-2016 8.0 27 137 16 11 15 7 9 27 83 0.5 0.3 0.13 <0.01 0.36
MWQ6 06-12-2016 7.6 40 215 33 14 25 8 3 51 135 <0.35 0.2 <0.01 <0.01 0.04
MWQ6 19-01-2017 7.7 30 151 24 13 8 9 8 23 108 <0.35 0.4 0.03 0.04 0.04
MWQ6 20-02-2017 7.1 27 155 23 6 11 13 8 56 49 1.3 0.2 0.03 <0.01 0.02
MWQ6 16-04-2017 7.7 33 176 18 12 21 11 16 40 94 0.4 0.1 0.09 0.02 0.14
MWQ6 16-05-2017 7.6 44 229 24 17 27 13 21 49 129 <0.35 0.2 0.05 <0.01 0.13
MWQ6 17-05-2017 7.7 33 176 18 12 21 11 16 40 94 0.4 0.1 0.09 0.02 0.14
MWQ6 17-06-2017 7.6 44 229 24 17 27 13 21 49 129 <0.35 0.2 0.05 <0.01 0.13
MWQ6 16-10-2017 7.6 40 207 30 15 19 12 11 28 145 0.4 0.9 0.05 0.61 0.05
MWQ6 16-11-2017 7.3 32 160 14 14 23 9 12 10 130 <0.35 0.3 0.15 <0.01 0.11
MWQ6 16-12-2017 8.0 25 138 20 10 12 8 5 19 101 0.4 0.5 0.04 <0.01 0.08
MWQ6 16-02-2018 8.0 26 178 8 11 10 <0,002 5 44 76 0.2 21.6 0.10 0.02 <0,004
MWQ6 16-03-2018 7.6 24 184 26 12 14 10 6 29 121 0.4 0.4 <0.004 <0.001 <0.002
MWQ6 01-05-2018 8.1 28 194 21 12 17 11 13 23 127 0.4 0.3 <0.004 0.00 0.17
MWQ6 01-06-2018 8.2 31 246 36 18 24 12 19 47 140 0.3 0.3 <0.004 0.01 0.01
MWQ6 Q1 8.1 29 220 28 15 21 11 16 35 134 0.3 0.3 <0.004 0.00 0.09
OB2 01-06-2018 8.4 130 1004 95 51 128 9 28 478 124 30.6 0.3 <0.004 <0.001 <0.002
OB2 01-07-2018 8.3 127 986 111 56 132 9 27 508 117 16.3 0.3 <0.004 <0.001 <0.002
OB2 01-08-2018 8.3 152 1144 112 62 138 11 44 519 143 38.3 0.4 <0.004 <0.001 <0.002

MANUNGU Colliery, Life of Mine: Groundwater Impact Assessment Ref:327e DRAFT2 Jul’ 2019
GROUNDWATER SQUARE
Site Name Date pH EC
(mS/m) TDS
(mg/L) Ca
(mg/L) Mg
(mg/L) Na
(mg/L) K
(mg/L) Cl
(mg/L) SO4
(mg/L) TALK (mg/L)
NO3 (as N) (mg/L)
F (mg/L)
Fe (mg/L)
Mn (mg/L)
Al (mg/L)
1 - Target Level (<) 5.5
2 - Target Level (>) 9.5 150 1000 150 70 200 50 200 400 10.0 1.0 0.20 0.10 0.30
3 - Critical Level (<) 4
4 - Critical Level (>) 11 370 2400 300 100 400 100 600 600 20.0 1.5 2.00 1.00 0.50
OB2 01-09-2018 8.4 143 1035 104 62 144 9 36 465 118 31.8 0.3 <0.004 <0.001 <0.002
OB2 01-10-2018 9.2 147 1099 93 62 136 10 44 601 68 25.0 0.4 <0.004 <0.001 <0.002
OB2 Q1 8.4 129 995 103 53 130 9 27 493 121 23.5 0.3 <0.004 <0.001 <0.002
OB2 Q2 8.6 147 1093 103 62 139 10 41 528 110 31.7 0.4 <0.004 <0.001 <0.002
PCD 08-06-2016 8.3 66 388 31 12 72 5 4 143 89 15.3 0.8 <0.01 <0.01 0.09
PCD 14-10-2016 8.2 75 484 36 15 91 6 7 191 111 15.8 1.0 0.01 <0.01 0.06
PCD 14-11-2016 8.4 67 379 27 11 78 5 6 138 91 13.2 0.7 <0.01 <0.01 <0.01
PCD 06-12-2016 8.3 68 396 31 14 74 6 6 137 96 16.0 0.9 0.03 <0.01 0.15
PCD 20-02-2017 8.5 76 493 37 15 97 6 7 189 105 17.5 0.9 <0.01 <0.01 <0.01
PCD 16-03-2017 8.6 105 631 32 14 143 6 7 212 132 30.5 1.0 0.03 <0.01 0.14
PCD 16-04-2017 8.1 296 442 34 22 104 3 34 58 296 1.7 0.5 0.08 0.05 0.19
PCD 17-05-2017 8.5 146 937 22 15 249 8 12 232 243 56.2 1.4 0.04 <0.01 0.10
PCD 07-06-2017 8.5 156 960 29 17 251 8 13 237 258 55.8 1.4 <0.01 <0.01 <0.01
PCD 11-07-2017 8.3 159 994 23 12 280 8 15 239 263 57.8 1.7 0.03 <0.01 0.09
PCD 17-08-2017 8.6 184 1181 20 12 337 7 17 278 287 73.3 1.1 <0.01 <0.01 0.02
PCD 17-09-2017 8.4 224 1383 22 16 393 7 20 436 339 63.9 2.0 0.19 0.02 0.70
PCD 16-10-2017 8.6 233 1535 23 20 452 7 23 529 353 60.2 2.2 0.05 <0.01 0.11
PCD 16-11-2017 8.9 224 1536 14 12 450 7 21 559 329 60.4 2.2 1.57 0.02 4.98
PCD 16-12-2017 8.3 175 1101 22 12 315 5 12 409 256 38.7 1.6 0.02 <0.01 <0.01
PCD 16-01-2018 8.7 196 1286 16 14 384 6 17 504 235 41.2 1.6 <0.01 <0.01 ,0.01
PCD 16-02-2018 8.9 176 1352 7 483 5 <0,002 15 517 375 46.7 11.7 <0,001 0.01 <0,004
PCD 16-03-2018 8.7 166 1171 14 8 360 9 15 393 0 41.6 1.2 <0.004 <0.001 0.00
PCD 01-05-2018 8.7 136 1054 20 10 337 4 10 380 253 28.3 1.1 <0.004 <0.001 0.11
PCD 01-06-2018 8.5 197 1677 44 21 460 6 14 764 271 42.8 1.0 <0.004 <0.001 <0.002
PCD 01-07-2018 8.6 227 1786 37 21 511 7 14 875 346 22.8 0.9 <0.004 <0.001 <0.002
PCD 01-08-2018 8.8 242 1453 29 19 423 7 14 639 245 36.1 1.1 <0.004 <0.001 0.07
PCD 01-09-2018 8.7 242 1799 25 19 582 7 16 732 428 32.3 1.0 <0.004 <0.001 0.01
PCD 01-10-2018 8.8 267 1805 20 20 574 7 21 785 383 30.2 1.1 <0.004 <0.001 0.16
PCD Q1 8.6 187 1506 34 17 436 6 12 673 290 31.3 1.0 <0.004 <0.001 0.11
PCD Q2 8.8 250 1686 25 19 526 7 17 719 352 32.9 1.1 <0.004 <0.001 0.08
PCD Drainage
08-06-2016 8.0 88 471 26 17 122 5 41 68 302 2.3 0.8 <0.01 0.01 0.03
PCD Drainage
14-10-2016 7.9 78 446 27 19 113 3 40 62 286 2.0 0.7 0.01 <0.01 0.05
PCD Drainage
14-11-2016 7.9 79 439 28 20 114 4 42 65 262 1.9 0.4 0.04 0.01 0.13
PCD Drainage
06-12-2016 7.9 81 420 26 18 104 4 39 56 273 1.8 0.6 0.06 0.01 0.21
PCD Drainage
20-02-2017 7.8 81 467 29 21 121 5 43 61 300 1.5 0.6 0.05 0.04 0.10
PCD Drainage
16-03-2017 7.8 80 443 28 20 118 3 39 55 291 1.3 0.5 0.04 0.03 0.10
PCD Drainage
16-04-2017 8.5 116 698 27 13 172 6 12 222 161 33.3 1.2 0.05 <0.01 0.17
PCD Drainage
17-05-2017 7.7 84 451 27 22 110 <0.03 35 58 315 1.1 0.5 0.26 0.11 0.52
PCD Drainage
17-06-2017 7.8 86 461 28 23 114 4 37 59 318 1.2 0.4 0.06 0.04 0.14
PCD Drainage
11-07-2017 7.7 86 489 33 25 112 3 39 78 317 1.8 0.5 0.13 0.03 0.26
PCD Drainage
17-08-2017 7.7 81 452 29 24 105 3 39 68 287 2.7 0.2 0.11 0.05 0.20
PCD Drainage
17-09-2017 7.4 80 426 32 21 99 3 39 50 280 3.3 0.6 0.02 0.02 0.03
PCD Drainage
16-10-2017 7.9 80 459 38 22 107 3 44 56 291 3.2 0.7 <0.01 21.70 <0.01
PCD Drainage
16-11-2017 8.1 76 424 31 20 99 2 37 51 279 3.6 0.6 0.08 0.02 0.18
PCD Drainage
16-12-2017 7.5 75 416 30 20 94 3 33 55 275 3.2 0.8 0.08 0.02 0.15
PCD Drainage
16-01-2018 8.0 77 454 41 25 14 3 34 70 278 3.2 0.8 0.78 <0.01 0.01
PCD Drainage
16-02-2018 8.9 96 592 21 181 4 <0,002 28 145 303 5.9 29.1 <0,001 0.01 <0,004
PCD Drainage
16-03-2018 8.4 67 519 34 25 118 4 32 87 <0.002 1.3 0.7 <0,004 <0,001 <0.002
PCD Drainage
01-05-2018 8.5 105 859 27 16 257 4 17 264 278 17.8 1.0 <0.004 <0.001 <0.002
PCD Drainage
01-06-2018 8.5 86 629 36 24 158 4 31 144 287 5.2 0.9 <0.004 <0.001 0.25
PCD Drainage
01-07-2018 8.6 75 564 37 26 135 4 29 116 296 1.8 0.7 <0.004 <0.001 <0.002
PCD Drainage
01-08-2018 8.7 90 640 33 25 155 3 26 118 408 1.1 0.8 <0.004 <0.001 <0.002
PCD Drainage
01-09-2018 8.4 85 636 43 30 145 4 29 124 362 1.1 0.9 <0.004 <0.001 <0.002

MANUNGU Colliery, Life of Mine: Groundwater Impact Assessment Ref:327e DRAFT2 Jul’ 2019
GROUNDWATER SQUARE
Site Name Date pH EC
(mS/m) TDS
(mg/L) Ca
(mg/L) Mg
(mg/L) Na
(mg/L) K
(mg/L) Cl
(mg/L) SO4
(mg/L) TALK (mg/L)
NO3 (as N) (mg/L)
F (mg/L)
Fe (mg/L)
Mn (mg/L)
Al (mg/L)
1 - Target Level (<) 5.5
2 - Target Level (>) 9.5 150 1000 150 70 200 50 200 400 10.0 1.0 0.20 0.10 0.30
3 - Critical Level (<) 4
4 - Critical Level (>) 11 370 2400 300 100 400 100 600 600 20.0 1.5 2.00 1.00 0.50
PCD Drainage
01-10-2018 8.4 91 571 37 29 138 4 36 74 351 0.7 0.8 <0.004 <0.001 0.90
PCD Drainage
Q1 8.6 89 684 33 22 183 4 26 175 287 8.3 0.9 <0.004 <0.001 0.25
PCD Drainage
Q2 8.5 88 616 38 28 146 3 30 105 374 1.0 0.8 <0.004 <0.001 0.90
Pit Area 08-06-2016 8.1 199 1255 24 14 319 9 14 235 198 116.0 1.0 0.21 <0.01 1.23
Pit Area 14-10-2016 8.4 187 1165 2 2 353 5 21 130 279 108.0 2.7 0.56 <0.01 0.08
Pit Area 14-11-2016 8.3 102 666 9 5 189 4 16 88 180 53.9 1.6 2.12 <0.01 5.12
Pit Area 06-12-2016 8.5 246 1717 20 9 453 11 11 266 219 181.0 1.9 1.05 0.03 5.80
Pit Area 20-02-2017 8.5 272 1887 38 26 534 10 19 727 332 73.7 1.6 0.06 0.01 0.31
Pit Area 16-03-2017 8.8 162 1075 5 5 318 9 10 273 251 64.4 3.3 3.95 <0.01 6.08
Pit Area 16-04-2017 8.7 211 1487 21 21 427 9 13 460 237 88.4 1.6 0.04 <0.01 0.11
Pit Area 17-06-2017 8.5 235 1523 10 10 412 9 15 110 256 178.0 2.6 0.15 <0.01 1.27
Pit Area 11-07-2017 8.6 164 1107 6 3 337 5 17 145 308 90.9 3.1 0.04 <0.01 0.12
Pit Area 16-08-2017 8.3 331 2236 94 73 688 10 21 1042 331 48.8 0.6 0.39 <0.01 0.75
Pit Area 17-08-2017 8.3 331 2236 94 73 688 10 21 1042 331 48.8 0.6 0.39 <0.01 0.75
Pit Area 17-09-2017 8.5 218 1403 22 16 426 9 22 521 442 26.2 1.5 0.38 <0.01 1.13
Pit Area 16-11-2017 8.3 221 1449 5 3 480 4 21 517 451 32.6 1.9 0.02 <0.01 0.06
Pit Area 16-12-2017 8.2 179 1155 17 5 348 5 9 341 61 90.2 2.1 0.05 <0.01 0.07
Pit Area 16-01-2018 6.9 34 226 25 10 19 <0.03 7 82 16 14.7 0.2 0.16 0.10 0.18
Pit Area 16-02-2018 8.8 124 800 2 274 2 <0,002 16 79 293 49.8 3.9 <0,001 0.00 <0,004
Pit Area 16-03-2018 8.2 136 1040 37 22 250 10 16 215 <0.004 68.1 1.1 <0,004 <0.001 <0.002
Pit Area 01-05-2018 8.5 74 598 40 26 109 8 16 69 223 37.7 1.3 <0.004 0.04 0.04
Pit Area 01-06-2018 8.4 105 808 51 30 149 9 17 95 180 73.8 1.5 <0.004 0.03 <0.002
Pit Area 01-09-2018 8.6 184 1293 8 5 441 5 18 324 554 29.8 1.5 <0.004 <0.001 0.29
Pit Area 01-10-2018 8.3 119 795 74 44 114 11 18 168 182 53.9 1.1 <0.004 0.01 0.32
Pit Area Q1 8.5 90 703 45 28 129 8 16 82 202 55.8 1.4 <0.004 0.03 0.04
Pit Area Q2 8.4 152 1044 41 25 278 8 18 246 368 41.9 1.3 <0.004 0.01 0.31
WRD-1 26-03-2018 7.8 145 984 134 48 108 9 23 491 109 23.5 0.3 0.03 <0.01 0.05

MANUNGU Colliery, Life of Mine: Groundwater Impact Assessment Ref:327e DRAFT2 Jul’ 2019
GROUNDWATER SQUARE
Site Name Date As
(mg/L) B
(mg/L) Ba
(mg/L) Be
(mg/L) Cd
(mg/L) CN
(mg/L) Co
(mg/L) Cr
(mg/L) Cr6+
(mg/L) Cu
(mg/L) Hg
(mg/L)
B2N073 13-03-2017 <0.005 <0.01 <0.01 <0.01 <0.01
KAM01 13-03-2017 0.010 <0.01 <0.01 <0.01 <0.01
KGA14 13-03-2017 <0.005 <0.01 <0.01 <0.01 <0.01
KGA15 13-03-2017 <0.005 <0.01 <0.01 <0.01 <0.01
MAN-BH1 16-07-2014 <0.005 <0.003 <0.01 <0.01 <0.01 <0.01
MAN-BH2D 23-05-2017 <0.005 <0.01 <0.01 <0.01 <0.01
MAN-BH2D-Pumptest
03-07-2017 <0.005 <0.01 <0.01 <0.01 <0.01
MAN-BH2M 23-05-2017 <0.005 <0.01 <0.01 <0.01 <0.01
MAN-BH2S 23-05-2017 <0.005 <0.01 <0.01 <0.01 <0.01
MAN-BH3D 23-05-2017 <0.005 <0.01 <0.01 <0.01 <0.01
MAN-BH3M 23-05-2017 <0.005 <0.01 <0.01 <0.01 <0.01
MAN-BH3S 23-05-2017 <0.005 <0.01 <0.01 <0.01 <0.01
MAN-BH4D 23-05-2017 <0.005 <0.01 <0.01 <0.01 <0.01
MAN-BH4M 23-05-2017 <0.005 <0.01 <0.01 <0.01 <0.01
MAN-BH4S 23-05-2017 <0.005 <0.01 <0.01 <0.01 <0.01
MAN-BH5M 23-05-2017 <0.005 <0.01 <0.01 <0.01 <0.01
MAN-BH6D 23-05-2017 <0.005 <0.01 <0.01 <0.01 <0.01
MAN-BH6D-Pumptest
29-06-2017 <0.005 <0.01 <0.01 <0.01 <0.01
MAN-BH6M 23-05-2017 <0.005 <0.01 <0.01 <0.01 <0.01
MAN-BH7M 22-08-2017 <0.005 <0.01 <0.01 <0.01
MAN-BH8M 22-08-2017 <0.005 <0.01 <0.01 <0.01
MAN-BH9D 15-09-2017 <0.005 <0.01 <0.01 <0.01 <0.01
MAN-BH9D-Pumptest
16-09-2017 <0.005 <0.01 <0.01 <0.01 <0.01
MAN-BH9M 23-08-2017 <0.005 <0.01 <0.01 <0.01
MAN-BH9S 23-08-2017 <0.005 <0.01 <0.01 <0.01
MAN-BH10M 22-08-2017 <0.005 <0.01 <0.01 <0.01
MAN-BH11D 23-08-2017 <0.005 <0.01 <0.01 <0.01
MAN-BH11D-Pumptest
15-08-2017 0.010 <0.01 <0.01 <0.01 <0.01
MAN-BH11S 23-08-2017 <0.005 <0.01 <0.01 <0.01
MAN-BH12D 22-08-2017 <0.005 <0.01 <0.01 <0.01
MAN-BH12M 22-08-2017 <0.005 <0.01 <0.01 <0.01
MAN-BH12S 22-08-2017 <0.005 <0.01 <0.01 <0.01
MAN-BH13D 22-08-2017 <0.005 <0.01 <0.01 <0.01
MAN-PCD 23-05-2017 <0.005 <0.01 <0.01 <0.01 <0.01
MBH01 08-06-2016 <0.002 <0.01 0.02
MBH01 06-12-2016 <0.002 <0.01 <0.02 0.01
MBH01 19-01-2017 <0.09 <0.01
MBH01 20-02-2017
MBH01 16-03-2017 <0.002 <0.01 <0.02 0.01
MBH01 22-03-2017 <0.005 0.01 <0.01 <0.01 <0.01
MBH01 21-09-2017 <0.01
MBH01-Office Tap 1
16-08-2017 27.20
MBH01-Office Tap 1
16-09-2017 <0.01 28.80
MBH01-Office Tap 1
16-10-2017 <0.002 <0.01 0.01
MBH01-Office Tap 1
16-11-2017 0.01 <0.01 28.90
MBH01-Office Tap 1
16-12-2017 <0.003 <0.01 27.50
MBH01-Office Tap 1
16-03-2018 <0.003
MBH01-Office Tap 2
16-03-2017 0.00 0.01 0.00
MBH01-Office Tap 2
16-06-2017 <0.002 <0.01 <0.003
MBH01-Office Tap 2
16-09-2017 <0.002 <0.01 <0.003
MBH01-Office Tap 2
16-12-2017 <0.002 <0.01 <0.003
MBH01-Office Tap 2
16-03-2018 <0.003
MBH05 14-09-2017 <0.002 <0.01 <0.003
MBH4 08-06-2016 <0.002 <0.01 0.02

MANUNGU Colliery, Life of Mine: Groundwater Impact Assessment Ref:327e DRAFT2 Jul’ 2019
GROUNDWATER SQUARE
Site Name Date As
(mg/L) B
(mg/L) Ba
(mg/L) Be
(mg/L) Cd
(mg/L) CN
(mg/L) Co
(mg/L) Cr
(mg/L) Cr6+
(mg/L) Cu
(mg/L) Hg
(mg/L)
MBH4 06-12-2016 <0.002 <0.01 <0.02 <0.003
MBH4 16-03-2017 <0.002 <0.01 <0.02 0.01
MBH4 16-06-2017 <0.002 <0.01 <0.003
MBH4 17-07-2017 <0.003
MBH4 21-09-2017 <0.002 <0.01 <0.003
MBH4 16-10-2017 <0.002 <0.01 <0.003
MBH4 16-11-2017 <0.002 <0.01 <0.003
MBH4 16-12-2017 <0.002 <0.01 <0.003
MBH4 16-03-2018 <0.003
MBH5 08-06-2016 <0.002 <0.01 <0.003
MBH5 06-12-2016 <0.002 <0.01 <0.02 <0.003
MBH5 16-03-2017 <0.002 <0.01 <0.02 <0.003
MBH6 13-03-2017 <0.005 0.01 <0.01 <0.01 <0.01
MBH12 14-03-2017 0.010 0.01 <0.01 <0.01 <0.01
MBH12 31-07-2018 <0.005 <0.01 <0.01 <0.01 <0.01
MBH13 14-03-2017 0.010 0.01 <0.01 <0.01 <0.01
MBH15 14-03-2017 0.010 0.01 <0.01 <0.01 <0.01
MBH17 08-06-2016 <0.002 <0.01 <0.003
MBH17 22-03-2017 0.020 0.01 <0.01 <0.01 <0.01
MBH18B 14-03-2017 0.010 0.01 <0.01 <0.01 <0.01
MBH20 15-03-2017 <0.005 <0.01 <0.01 <0.01 <0.01
MBH25 20-03-2017 0.010 <0.01 <0.01 <0.01 <0.01
MBH27 22-03-2017 0.010 0.01 <0.01 <0.01 <0.01
MBH29 20-03-2017 0.010 0.01 <0.01 <0.01 <0.01
MBH31 20-03-2017 0.010 <0.01 <0.01 <0.01 <0.01
MBH32 08-06-2016 <0.002 <0.01 0.01
MBH32 06-12-2016 <0.002 <0.01 <0.02 <0.003
MBH32 14-03-2017 0.010 0.02 <0.01 <0.01 <0.01
MBH32 16-03-2017 <0.002 <0.01 <0.02 0.01
MBH32 16-06-2017 <0.002 <0.01 <0.003
MBH32 16-09-2017 <0.002 <0.01 <0.003
MBH32 17-09-2017 <0.002 <0.01 <0.003
MBH32 16-12-2017 <0.01 <0.003
MBH35 20-03-2017 0.010 0.01 <0.01 <0.01 <0.01
MBH36A 20-03-2017 0.010 0.05 <0.01 <0.01 <0.01
MBH40 14-03-2017 0.010 0.01 <0.01 <0.01 <0.01
MBH41 15-03-2017 <0.005 <0.01 <0.01 <0.01 <0.01
MBH45 20-03-2017 0.010 <0.01 <0.01 <0.01 <0.01
MBH46 20-03-2017 0.010 <0.01 <0.01 <0.01 <0.01
MBH47 20-03-2017 0.010 <0.01 <0.01 <0.01 0.05
MWQ1 16-02-2018 2.54
MWQ3 16-02-2018 0.31
MWQ5 16-02-2018 2.35
MWQ6 16-02-2018 0.23
PCD 16-02-2018 0.58
PCD Drainage
16-02-2018 0.12
Pit Area 16-02-2018 0.51
WRD-1 26-03-2018 <0.005 0.110 0.030 <0.01 <0.002 <0.01 <0.01 <0.01 <0.01 <0.003

MANUNGU Colliery, Life of Mine: Groundwater Impact Assessment Ref:327e DRAFT2 Jul’ 2019
GROUNDWATER SQUARE
Site Name Date Li
(mg/L) Ni
(mg/L) Pb
(mg/L) Sb
(mg/L) Si
(mg/L) Sn
(mg/L) Sr
(mg/L) U
(mg/L) V
(mg/L) ZN
(mg/L)
1 - Target Level (<)
2 - Target Level (>) 0.07
3 - Critical Level (<)
4 - Critical Level (>) 0.28
B2N073 13-03-2017 <0.01 <0.01 4.56 <0.01 <0.01
KAM01 13-03-2017 <0.01 <0.01 13.70 <0.01 <0.01
KGA14 13-03-2017 <0.01 <0.01 19.20 <0.01 <0.01
KGA15 13-03-2017 <0.01 <0.01 19.30 <0.01 0.02
MAN-BH1 16-07-2014 <0.01 <0.01 15.29 <0.01 <0.01
MAN-BH2M 23-05-2017 <0.01 <0.01 5.38 <0.01 <0.01
MAN-BH2S 23-05-2017 <0.01 <0.01 0.14 <0.01 <0.01
MAN-BH3D 23-05-2017 <0.01 <0.01 4.92 <0.01 <0.01
MAN-BH3M 23-05-2017 <0.01 <0.01 14.60 <0.01 <0.01
MAN-BH3S 23-05-2017 <0.01 <0.01 1.21 <0.01 <0.01
MAN-BH4D 23-05-2017 <0.01 <0.01 10.80 <0.01 <0.01
MAN-BH4M 23-05-2017 <0.01 <0.01 15.90 <0.01 <0.01
MAN-BH4S 23-05-2017 <0.01 <0.01 1.24 <0.01 <0.01
MAN-BH5M 23-05-2017 <0.01 <0.01 1.44 <0.01 <0.01
MAN-BH6D 23-05-2017 <0.01 <0.01 14.30 <0.01 <0.01
MAN-BH6D-Pumptest
29-06-2017 <0.01 <0.01 10.40 <0.01 <0.01
MAN-BH6M 23-05-2017 <0.01 <0.01 23.40 <0.01 <0.01
MAN-BH7M 22-08-2017 <0.01 <0.01 1.19 <0.01 <0.01
MAN-BH8M 22-08-2017 <0.01 <0.01 6.01 <0.01 <0.01
MAN-BH9D 15-09-2017 <0.01 <0.01 6.50 <0.01 <0.01
MAN-BH9D-Pumptest
16-09-2017 <0.01 <0.01 0.23 <0.01 <0.01
MAN-BH9M 23-08-2017 <0.01 <0.01 10.66 <0.01 <0.01
MAN-BH9S 23-08-2017 <0.01 <0.01 2.81 <0.01 <0.01
MAN-BH10M 22-08-2017 <0.01 <0.01 10.30 <0.01 <0.01
MAN-BH11D 23-08-2017 <0.01 <0.01 1.95 <0.01 <0.01
MAN-BH11D-Pumptest
15-08-2017 <0.01 <0.01 3.52 <0.01 <0.01
MAN-BH11S 23-08-2017 <0.01 <0.01 6.02 <0.01 <0.01
MAN-BH12D 22-08-2017 <0.01 <0.01 4.35 <0.01 <0.01
MAN-BH12M 22-08-2017 <0.01 <0.01 2.69 <0.01 <0.01
MAN-BH12S 22-08-2017 <0.01 <0.01 2.90 <0.01 <0.01
MAN-BH13D 22-08-2017 <0.01 <0.01 26.18 <0.01 <0.01
MAN-BH2D 23-05-2017 <0.01 <0.01 0.34 <0.01 <0.01
MAN-BH2D-Pumptest
03-07-2017 <0.01 <0.01 9.60 <0.01 <0.01
MAN-PCD 23-05-2017 <0.01 <0.01 3.26 <0.01 <0.01
MBH01 08-06-2016 24.80 <0.01 <0.01
MBH01 14-10-2016 31.70
MBH01 14-11-2016 30.90
MBH01 06-12-2016 30.60 <0.01 <0.01
MBH01 19-01-2017 29.90
MBH01 20-02-2017 30.20
MBH01 16-03-2017 25.10 <0.01 <0.01
MBH01 22-03-2017 <0.01 <0.01 31.10 <0.01 <0.01
MBH01 11-07-2017 <0.4
MBH01 21-08-2017 27.20
MBH01 21-09-2017 28.80 <0.01 <0.01
MBH01-Office Tap 1
16-07-2017 15.70
MBH01-Office Tap 1
16-08-2017 <0.4
MBH01-Office Tap 1
16-09-2017 <0.4 <0.01 <0.01
MBH01-Office Tap 1
16-10-2017 29.00 <0.01 <0.01
MBH01-Office Tap 1
16-11-2017 6.00 <0.01 <0.01
MBH01-Office Tap 1
16-12-2017 <0.4 490.00 <0.01
MBH01-Office Tap 1
16-01-2018 25.70
MBH01-Office Tap 1
16-02-2018 0.21

MANUNGU Colliery, Life of Mine: Groundwater Impact Assessment Ref:327e DRAFT2 Jul’ 2019
GROUNDWATER SQUARE
Site Name Date Li
(mg/L) Ni
(mg/L) Pb
(mg/L) Sb
(mg/L) Si
(mg/L) Sn
(mg/L) Sr
(mg/L) U
(mg/L) V
(mg/L) ZN
(mg/L)
1 - Target Level (<)
2 - Target Level (>) 0.07
3 - Critical Level (<)
4 - Critical Level (>) 0.28
MBH01-Office Tap 1
16-03-2018 25.90 0.31
MBH01-Office Tap 2
16-03-2017 4.81 0.01 0.01
MBH01-Office Tap 2
16-06-2017 5.73 <0.01 <0.01
MBH01-Office Tap 2
16-09-2017 1.59 <0.01 <0.01
MBH01-Office Tap 2
16-12-2017 8.84 <382 <0.01
MBH01-Office Tap 2
16-02-2018 0.02
MBH01-Office Tap 2
16-03-2018 26.40 0.01
MBH05 14-09-2017 1.59 <0.01 <0.01
MBH4 08-06-2016 20.10 <0.01 <0.01
MBH4 14-10-2016 26.40
MBH4 14-11-2016 26.80
MBH4 06-12-2016 25.20 <0.01 <0.01
MBH4 20-02-2017 26.00
MBH4 16-03-2017 24.10 <0.01 0.08
MBH4 16-04-2017 23.60
MBH4 16-05-2017 24.10
MBH4 16-06-2017 26.30 <0.01 0.39
MBH4 17-07-2017 <0.4
MBH4 21-08-2017 23.60
MBH4 21-09-2017 24.60 <0.01 0.72
MBH4 16-10-2017 24.60 <0.01 0.40
MBH4 16-11-2017 23.20 <0.01 0.19
MBH4 16-12-2017 23.00 <0.01 0.15
MBH4 16-01-2018 9.57
MBH4 16-02-2018 0.02
MBH4 16-03-2018 7.48 0.06
MBH5 08-06-2016 9.07 <0.01 <0.01
MBH5 06-12-2016 9.76 <0.01 <0.01
MBH5 16-03-2017 4.81 <0.01 <0.01
MBH6 13-03-2017 <0.01 <0.01 22.00 <0.01 0.01
MBH12 14-03-2017 <0.01 <0.01 5.19 <0.01 0.02
MBH12 31-07-2018 <0.01 <0.01 5.21 <0.01 <0.01
MBH13 14-03-2017 <0.01 <0.01 22.30 <0.01 <0.01
MBH15 14-03-2017 <0.01 <0.01 15.80 <0.01 <0.01
MBH17 08-06-2016 11.90 <0.01 <0.01
MBH17 22-03-2017 <0.01 <0.01 7.58 <0.01 <0.01
MBH18B 14-03-2017 <0.01 <0.01 6.61 <0.01 <0.01
MBH20 15-03-2017 <0.01 <0.01 29.10 <0.01 0.02
MBH25 20-03-2017 <0.01 <0.01 11.50 <0.01 0.01
MBH27 22-03-2017 <0.01 <0.01 16.40 <0.01 <0.01
MBH29 20-03-2017 <0.01 <0.01 23.30 0.01 0.01
MBH31 20-03-2017 <0.01 <0.01 15.90 <0.01 0.01
MBH32 08-06-2016 21.40 <0.01 <0.01
MBH32 06-12-2016 23.60 <0.01 0.03
MBH32 14-03-2017 <0.01 <0.01 21.40 <0.01 <0.01
MBH32 16-03-2017 19.40 <0.01 <0.01
MBH32 16-06-2017 21.90 <382 <0.01
MBH32 16-09-2017 22.90 <382 <0.01
MBH32 17-09-2017 22.90 <0.01 <0.01
MBH32 16-12-2017 21.40 <382 <0.01
MBH35 20-03-2017 <0.01 <0.01 21.60 <0.01 <0.01
MBH36A 20-03-2017 <0.01 <0.01 9.53 <0.01 <0.01
MBH40 14-03-2017 <0.01 <0.01 12.30 <0.01 0.18
MBH41 15-03-2017 <0.01 <0.01 25.10 <0.01 <0.01
MBH45 20-03-2017 <0.01 <0.01 20.60 <0.01 <0.01
MBH46 20-03-2017 <0.01 <0.01 13.70 <0.01 <0.01
MBH47 20-03-2017 <0.01 <0.01 24.70 <0.01 0.01
MWQ1 08-06-2016 3.53
MWQ1 14-11-2016 10.70

MANUNGU Colliery, Life of Mine: Groundwater Impact Assessment Ref:327e DRAFT2 Jul’ 2019
GROUNDWATER SQUARE
Site Name Date Li
(mg/L) Ni
(mg/L) Pb
(mg/L) Sb
(mg/L) Si
(mg/L) Sn
(mg/L) Sr
(mg/L) U
(mg/L) V
(mg/L) ZN
(mg/L)
1 - Target Level (<)
2 - Target Level (>) 0.07
3 - Critical Level (<)
4 - Critical Level (>) 0.28
MWQ1 06-12-2016 10.00
MWQ1 19-01-2017 6.79
MWQ1 20-02-2017 5.75
MWQ1 16-03-2017 6.91
MWQ1 16-04-2017 5.65
MWQ1 17-05-2017 1.95
MWQ1 17-06-2017 0.74
MWQ1 11-07-2017 1.40
MWQ1 17-08-2017 <0.1
MWQ1 17-09-2017 1.63
MWQ1 16-11-2017 3.81
MWQ1 16-12-2017 13.40
MWQ1 16-01-2018 6.72
MWQ1 16-03-2018 5.17
MWQ3 08-06-2016 6.81
MWQ3 14-10-2016 7.03
MWQ3 14-11-2016 5.09
MWQ3 06-12-2016 4.71
MWQ3 19-01-2017 4.70
MWQ3 20-02-2017 4.27
MWQ3 16-03-2017 3.94
MWQ3 16-04-2017 4.06
MWQ3 17-05-2017 8.27
MWQ3 17-06-2017 3.91
MWQ3 11-07-2017 3.47
MWQ3 11-08-2017 2.93
MWQ3 11-09-2017 2.75
MWQ3 16-10-2017 2.73
MWQ3 16-11-2017 1.61
MWQ3 16-12-2017 9.23
MWQ3 16-01-2018 1.48
MWQ3 16-03-2018 0.22
MWQ4 08-06-2016 10.30
MWQ4 14-10-2016 16.10
MWQ4 14-11-2016 6.92
MWQ4 16-03-2017 17.90
MWQ4 17-05-2017 14.35
MWQ4 17-06-2017 11.30
MWQ4 11-07-2017 3.47
MWQ4 11-08-2017 2.93
MWQ4 11-09-2017 2.75
MWQ4 16-09-2017 11.60
MWQ5 08-06-2016 0.55
MWQ5 14-10-2016 <0.1
MWQ5 14-11-2016 13.20
MWQ5 06-12-2016 8.52
MWQ5 19-01-2017 5.98
MWQ5 20-02-2017 1.95
MWQ5 16-03-2017 5.91
MWQ5 16-04-2017 2.87
MWQ5 17-05-2017 4.14
MWQ5 17-06-2017 <0.1
MWQ5 11-07-2017 1.40
MWQ5 11-08-2017 0.34
MWQ5 11-09-2017 0.52
MWQ5 16-10-2017 1.59
MWQ5 16-11-2017 2.63
MWQ5 16-12-2017 13.40
MWQ5 16-01-2018 3.61
MWQ5 16-03-2018 2.32
MWQ6 08-06-2016 1.31
MWQ6 06-12-2016 4.02
MWQ6 19-01-2017 4.71
MWQ6 20-02-2017 3.37
MWQ6 16-04-2017 4.77
MWQ6 16-05-2017 2.88

MANUNGU Colliery, Life of Mine: Groundwater Impact Assessment Ref:327e DRAFT2 Jul’ 2019
GROUNDWATER SQUARE
Site Name Date Li
(mg/L) Ni
(mg/L) Pb
(mg/L) Sb
(mg/L) Si
(mg/L) Sn
(mg/L) Sr
(mg/L) U
(mg/L) V
(mg/L) ZN
(mg/L)
1 - Target Level (<)
2 - Target Level (>) 0.07
3 - Critical Level (<)
4 - Critical Level (>) 0.28
MWQ6 17-05-2017 4.77
MWQ6 17-06-2017 2.88
MWQ6 16-10-2017 4.96
MWQ6 16-11-2017 13.50
MWQ6 16-12-2017 1.06
MWQ6 16-03-2018 3.77
PCD 08-06-2016 1.12
PCD 14-10-2016 2.00
PCD 14-11-2016 1.43
PCD 06-12-2016 1.71
PCD 20-02-2017 1.52
PCD 16-03-2017 1.53
PCD 16-04-2017 11.70
PCD 17-05-2017 6.99
PCD 07-06-2017 3.45
PCD 11-07-2017 3.40
PCD 17-08-2017 3.22
PCD 17-09-2017 4.93
PCD 16-10-2017 12.70
PCD 16-11-2017 12.70
PCD 16-12-2017 5.19
PCD 16-01-2018 3.74
PCD 16-03-2018 2.18
PCD Drainage 08-06-2016 7.79
PCD Drainage 14-10-2016 11.30
PCD Drainage 14-11-2016 9.72
PCD Drainage 06-12-2016 12.00
PCD Drainage 20-02-2017 13.10
PCD Drainage 16-03-2017 11.00
PCD Drainage 16-04-2017 2.23
PCD Drainage 17-05-2017 13.60
PCD Drainage 17-06-2017 12.80
PCD Drainage 11-07-2017 12.40
PCD Drainage 17-08-2017 11.70
PCD Drainage 17-09-2017 13.00
PCD Drainage 16-10-2017 <0.1
PCD Drainage 16-11-2017 12.80
PCD Drainage 16-12-2017 14.10
PCD Drainage 16-01-2018 13.70
PCD Drainage 16-03-2018 11.10
Pit Area 08-06-2016 5.92
Pit Area 14-10-2016 16.10
Pit Area 14-11-2016 5.02
Pit Area 06-12-2016 12.50
Pit Area 20-02-2017 4.86
Pit Area 16-03-2017 6.66
Pit Area 16-04-2017 3.11
Pit Area 17-06-2017 4.81
Pit Area 11-07-2017 3.62
Pit Area 16-08-2017 4.54
Pit Area 17-08-2017 4.54
Pit Area 17-09-2017 7.83
Pit Area 16-11-2017 4.56
Pit Area 16-12-2017 4.38
Pit Area 16-01-2018 30.60
Pit Area 16-03-2018 2.02
WRD-1 26-03-2018 0.03 <0.01 <0.01 0.05 6.06 0.04 0.59 <0.01 <0.01 <0.01

MANUNGU Colliery, Life of Mine: Groundwater Impact Assessment Ref:327e DRAFT2 Jul’ 2019
GROUNDWATER SQUARE
Site Name Date
Chemical Oxygen Demand
O2 (mg/L)
Oxygen Absorbed O2 (mg/L)
Oxygen Dissolved O2 (mg/L)
Ortho Phosphate (P mg/L)
N_Ammonia (mg/L)
Suspended Solids (mg/L)
TPH (mg/L)
B2N073 13-03-2017 4.00 6.88 <0.03 <0.45 2.00
KAM01 13-03-2017 4.00 6.77 <0.03 <0.45 19.60
KGA14 13-03-2017 <1 6.73 <0.03 <0.45 <0.4
KGA15 13-03-2017 3.00 6.76 <0.03 <0.45 <0.4
MAN-BH1 16-07-2014 8.00 <0.2 8.21 0.02 0.27 29.20
MAN-BH2D 23-05-2017 4.00 1.36 5.82 <0.03 0.67 90.40
MAN-BH2D 01-06-2018 0.05 45.00
MAN-BH2D 01-09-2018 0.03 49.00
MAN-BH2D-Pumptest
03-07-2017 1.00 <0.02 6.88 <0.03 <0.45 <0.4
MAN-BH2M 23-05-2017 4.00 3.06 6.78 <0.03 2.30 85.20
MAN-BH2M 01-06-2018 0.03 30.00
MAN-BH2M 01-09-2018 0.01 39.00
MAN-BH2S 23-05-2017 4.00 0.30 6.84 0.18 3.19 36.00
MAN-BH2S 01-06-2018 0.03 189.00
MAN-BH2S 01-09-2018 0.01 329.00
MAN-BH3D 23-05-2017 2.00 1.40 5.91 <0.03 0.49 65.60
MAN-BH3D 01-06-2018 0.27 233.00
MAN-BH3D 01-09-2018 0.02 33.00
MAN-BH3M 23-05-2017 <1 <0.1 7.25 <0.03 <0.45 119.00
MAN-BH3M 01-06-2018 <0.005 67.00
MAN-BH3M 01-09-2018 <0.005 54.00
MAN-BH3S 23-05-2017 2.00 0.98 5.64 <0.03 0.67 106.40
MAN-BH3S 01-06-2018 <0.005 48.00
MAN-BH3S 01-09-2018 <0.005 1294.00
MAN-BH4D 23-05-2017 3.00 1.04 5.88 <0.03 <0.45 28.40
MAN-BH4D 01-06-2018 0.05 29.00
MAN-BH4D 01-09-2018 0.02 22.00
MAN-BH4M 23-05-2017 <1 0.08 5.24 <0.03 0.64 114.00
MAN-BH4M 01-06-2018 0.03 24.00
MAN-BH4M 01-09-2018 0.02 38.00
MAN-BH4S 23-05-2017 <1 <0.02 5.28 <0.03 2.52 62.00
MAN-BH4S 01-06-2018 0.03 41.00
MAN-BH4S 01-09-2018 0.02 27.00
MAN-BH5M 23-05-2017 <1 0.40 6.31 <0.03 4.45 72.00
MAN-BH6D 23-05-2017 <1 0.66 7.11 0.05 <0.45 85.60
MAN-BH6D 01-06-2018 0.03 732.00
MAN-BH6D 01-09-2018 0.02 9.00
MAN-BH6D-Pumptest
29-06-2017 <1 <0.02 6.94 <0.03 <0.45 <0.4
MAN-BH6M 23-05-2017 <1 1.58 6.99 <0.03 <0.45 65.20
MAN-BH6M 01-06-2018 0.04 8.00
MAN-BH6M 01-09-2018 0.02 62.00
MAN-BH7M 22-08-2017 34.00 6.10 <0.03 <0.45 65.20
MAN-BH8M 22-08-2017 3.00 6.02 <0.03 2.87 82.80
MAN-BH8M 01-06-2018 0.03 9.00
MAN-BH8M 01-09-2018 0.01 17.00
MAN-BH9D 15-09-2017 2.00 1.30 7.85 0.06 0.63 54.40
MAN-BH9D-Pumptest
16-09-2017 <1 <0.02 6.97 0.04 <0.4
MAN-BH9M 23-08-2017 4.00 6.41 <0.03 3.41 51.20
MAN-BH9S 23-08-2017 7.00 5.70 <0.03 <0.45 111.00
MAN-BH10M 22-08-2017 6.00 6.38 <0.03 1.67 346.00
MAN-BH11D 23-08-2017 0.00 6.02 <0.03 <0.45 <0.4
MAN-BH11D-Pumptest
15-08-2017 13.00 0.30 6.62 0.03 0.83 <0.4
MAN-BH11S 23-08-2017 85.00 4.74 <0.03 <0.45 293.00
MAN-BH12D 22-08-2017 8.00 6.68 <0.03 1.61 185.00
MAN-BH12M 22-08-2017 0.00 6.38 <0.03 1.62 52.40
MAN-BH12S 22-08-2017 11.00 6.15 <0.03 2.68 191.00
MAN-BH13D 22-08-2017 32.00 6.59 0.04 0.75 792.00
MAN-PCD 23-05-2017 171.00 29.84 7.44 <0.03 1.69 160.00
MBH01 08-06-2016 0.03 <0.45 <0.4 0.00
MBH01 14-10-2016 <0.03 <0.45 2.00
MBH01 14-11-2016 <0.03 <0.45 <0.4
MBH01 06-12-2016 <0.03 <0.45 <0.4 0.00
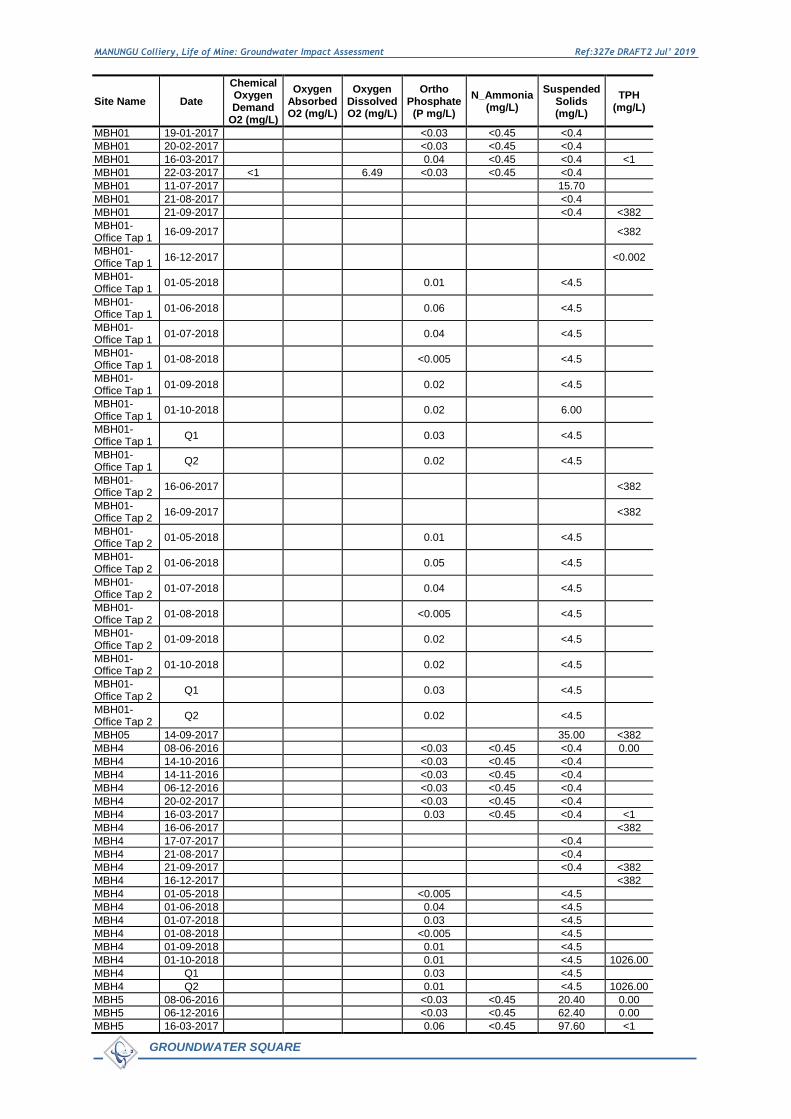
MANUNGU Colliery, Life of Mine: Groundwater Impact Assessment Ref:327e DRAFT2 Jul’ 2019
GROUNDWATER SQUARE
Site Name Date
Chemical Oxygen Demand
O2 (mg/L)
Oxygen Absorbed O2 (mg/L)
Oxygen Dissolved O2 (mg/L)
Ortho Phosphate (P mg/L)
N_Ammonia (mg/L)
Suspended Solids (mg/L)
TPH (mg/L)
MBH01 19-01-2017 <0.03 <0.45 <0.4
MBH01 20-02-2017 <0.03 <0.45 <0.4
MBH01 16-03-2017 0.04 <0.45 <0.4 <1
MBH01 22-03-2017 <1 6.49 <0.03 <0.45 <0.4
MBH01 11-07-2017 15.70
MBH01 21-08-2017 <0.4
MBH01 21-09-2017 <0.4 <382
MBH01-Office Tap 1
16-09-2017 <382
MBH01-Office Tap 1
16-12-2017 <0.002
MBH01-Office Tap 1
01-05-2018 0.01 <4.5
MBH01-Office Tap 1
01-06-2018 0.06 <4.5
MBH01-Office Tap 1
01-07-2018 0.04 <4.5
MBH01-Office Tap 1
01-08-2018 <0.005 <4.5
MBH01-Office Tap 1
01-09-2018 0.02 <4.5
MBH01-Office Tap 1
01-10-2018 0.02 6.00
MBH01-Office Tap 1
Q1 0.03 <4.5
MBH01-Office Tap 1
Q2 0.02 <4.5
MBH01-Office Tap 2
16-06-2017 <382
MBH01-Office Tap 2
16-09-2017 <382
MBH01-Office Tap 2
01-05-2018 0.01 <4.5
MBH01-Office Tap 2
01-06-2018 0.05 <4.5
MBH01-Office Tap 2
01-07-2018 0.04 <4.5
MBH01-Office Tap 2
01-08-2018 <0.005 <4.5
MBH01-Office Tap 2
01-09-2018 0.02 <4.5
MBH01-Office Tap 2
01-10-2018 0.02 <4.5
MBH01-Office Tap 2
Q1 0.03 <4.5
MBH01-Office Tap 2
Q2 0.02 <4.5
MBH05 14-09-2017 35.00 <382
MBH4 08-06-2016 <0.03 <0.45 <0.4 0.00
MBH4 14-10-2016 <0.03 <0.45 <0.4
MBH4 14-11-2016 <0.03 <0.45 <0.4
MBH4 06-12-2016 <0.03 <0.45 <0.4
MBH4 20-02-2017 <0.03 <0.45 <0.4
MBH4 16-03-2017 0.03 <0.45 <0.4 <1
MBH4 16-06-2017 <382
MBH4 17-07-2017 <0.4
MBH4 21-08-2017 <0.4
MBH4 21-09-2017 <0.4 <382
MBH4 16-12-2017 <382
MBH4 01-05-2018 <0.005 <4.5
MBH4 01-06-2018 0.04 <4.5
MBH4 01-07-2018 0.03 <4.5
MBH4 01-08-2018 <0.005 <4.5
MBH4 01-09-2018 0.01 <4.5
MBH4 01-10-2018 0.01 <4.5 1026.00
MBH4 Q1 0.03 <4.5
MBH4 Q2 0.01 <4.5 1026.00
MBH5 08-06-2016 <0.03 <0.45 20.40 0.00
MBH5 06-12-2016 <0.03 <0.45 62.40 0.00
MBH5 16-03-2017 0.06 <0.45 97.60 <1

MANUNGU Colliery, Life of Mine: Groundwater Impact Assessment Ref:327e DRAFT2 Jul’ 2019
GROUNDWATER SQUARE
Site Name Date
Chemical Oxygen Demand
O2 (mg/L)
Oxygen Absorbed O2 (mg/L)
Oxygen Dissolved O2 (mg/L)
Ortho Phosphate (P mg/L)
N_Ammonia (mg/L)
Suspended Solids (mg/L)
TPH (mg/L)
MBH6 13-03-2017 3.00 6.62 <0.03 <0.45 <0.4
MBH12 14-03-2017 3.00 6.64 <0.03 <0.45 <0.4
MBH12 31-07-2018 15.00 1.42 6.73 0.07 <0.45 41.20
MBH13 14-03-2017 <1 6.71 <0.03 <0.45 <0.4
MBH15 14-03-2017 6.00 6.83 <0.03 <0.45 <0.4
MBH17 08-06-2016 0.04 <0.45 <0.4 0.00
MBH17 22-03-2017 6.00 6.78 <0.03 <0.45 <0.4
MBH18B 14-03-2017 1.00 6.68 <0.03 <0.45 <0.4
MBH20 15-03-2017 <1 6.81 0.05 <0.45 <0.4
MBH25 20-03-2017 4.00 6.82 <0.03 <0.45 <0.4
MBH27 22-03-2017 <1 6.77 <0.03 <0.45 108.00
MBH29 20-03-2017 14.00 6.80 <0.03 <0.45 1.20
MBH31 20-03-2017 <1 6.81 <0.03 <0.45 <0.4
MBH32 08-06-2016 0.04 <0.45 <0.4 0.00
MBH32 06-12-2016 0.03 <0.45 <0.4 0.00
MBH32 14-03-2017 2.00 6.75 <0.03 <0.45 <0.4
MBH32 16-03-2017 0.06 <0.45 2.40 <1
MBH32 17-09-2017 <0.4 <382
MBH32 16-12-2017 <0.002
MBH35 20-03-2017 <1 6.60 <0.03 <0.45 <0.4
MBH36A 20-03-2017 1.00 6.82 <0.03 0.52 <0.4
MBH40 14-03-2017 2.00 6.71 <0.03 <0.45 <0.4
MBH41 15-03-2017 3.00 6.87 <0.03 <0.45 <0.4
MBH45 20-03-2017 2.00 6.81 <0.03 <0.45 <0.4
MBH46 20-03-2017 5.00 6.77 <0.03 <0.45 <0.4
MBH47 20-03-2017 4.00 6.88 <0.03 <0.45 <0.4
MWQ1 08-06-2016 <0.03 26.40
MWQ1 14-11-2016 0.15 <0.45 103.00
MWQ1 06-12-2016 0.07 <0.45 11.20
MWQ1 19-01-2017 <0.03 <0.45 429.00
MWQ1 20-02-2017 <0.03 <0.45 152.00
MWQ1 16-03-2017 0.35 6.59 116.00
MWQ1 17-05-2017 29.20
MWQ1 17-06-2017 3523.00
MWQ1 11-07-2017 782.00
MWQ1 17-08-2017 16.80
MWQ1 17-09-2017 759.00
MWQ1 16-02-2018 0.28
MWQ1 16-03-2018 0.04
MWQ1 01-05-2018 0.01 37.00
MWQ1 01-06-2018 0.04 226.00
MWQ1 01-07-2018 0.03 94.00
MWQ1 01-08-2018 <0.005 36.00
MWQ1 Q1 0.03 119.00
MWQ3 08-06-2016 <0.03 478.00
MWQ3 14-10-2016 0.07 <0.45 524.00
MWQ3 14-11-2016 0.17 0.90 451.00
MWQ3 06-12-2016 0.05 <0.45 544.00
MWQ3 19-01-2017 <0.03 <0.45 258.00
MWQ3 20-02-2017 <0.03 <0.45 614.00
MWQ3 16-03-2017 0.09 0.62 270.00
MWQ3 17-05-2017 156.00
MWQ3 17-06-2017 206.00
MWQ3 11-07-2017 168.00
MWQ3 11-08-2017 289.00
MWQ3 11-09-2017 302.00
MWQ3 16-02-2018 0.04
MWQ3 16-03-2018 0.01
MWQ3 01-06-2018 0.05 32.00
MWQ3 01-07-2018 0.03 115.00
MWQ3 Q1 0.04 73.50
MWQ4 08-06-2016 0.06 103.00
MWQ4 14-10-2016 2.89 4.82 12402.00
MWQ4 14-11-2016 <0.03 <0.45 15.20
MWQ4 16-03-2017 0.05 <0.45 64.80
MWQ4 17-05-2017 10.00
MWQ4 17-06-2017 3277.00
MWQ4 11-07-2017 168.00

MANUNGU Colliery, Life of Mine: Groundwater Impact Assessment Ref:327e DRAFT2 Jul’ 2019
GROUNDWATER SQUARE
Site Name Date
Chemical Oxygen Demand
O2 (mg/L)
Oxygen Absorbed O2 (mg/L)
Oxygen Dissolved O2 (mg/L)
Ortho Phosphate (P mg/L)
N_Ammonia (mg/L)
Suspended Solids (mg/L)
TPH (mg/L)
MWQ4 11-08-2017 289.00
MWQ4 11-09-2017 302.00
MWQ5 08-06-2016 <0.03 79.60
MWQ5 14-10-2016 0.13 <0.45 107.00
MWQ5 14-11-2016 0.31 <0.45 76.40
MWQ5 06-12-2016 0.05 <0.45 14.00
MWQ5 19-01-2017 <0.03 <0.45 12.80
MWQ5 20-02-2017 <0.03 <0.45 14.40
MWQ5 16-03-2017 0.12 <0.45 12.40
MWQ5 17-05-2017 19.20
MWQ5 17-06-2017 908.00
MWQ5 11-07-2017 782.00
MWQ5 11-08-2017 251.21
MWQ5 11-09-2017 516.00
MWQ5 16-02-2018 0.65
MWQ5 16-03-2018 0.01
MWQ5 01-05-2018 0.03 11.00
MWQ5 01-06-2018 0.07 30.00
MWQ5 01-07-2018 0.03 29.00
MWQ5 01-08-2018 <0.005 25.00
MWQ5 01-09-2018 0.01 50.00
MWQ5 01-10-2018 0.25 97.00
MWQ5 Q1 0.04 23.33
MWQ5 Q2 0.13 57.33
MWQ6 08-06-2016 <0.03 29.20
MWQ6 06-12-2016 <0.03 <0.45 205.00
MWQ6 19-01-2017 <0.03 <0.45 21.60
MWQ6 20-02-2017 0.51 0.69 477.00
MWQ6 17-05-2017 56.40
MWQ6 17-06-2017 38.00
MWQ6 16-02-2018 0.07
MWQ6 16-03-2018 0.01
MWQ6 01-05-2018 0.01 56.00
MWQ6 01-06-2018 0.06 100.00
MWQ6 Q1 0.03 78.00
OB2 01-06-2018 0.04 19.00
OB2 01-07-2018 0.03 19.00
OB2 01-08-2018 <0.005 11.00
OB2 01-09-2018 <0.005 22.00
OB2 01-10-2018 0.02 25.00
OB2 Q1 0.03 19.00
OB2 Q2 0.02 19.33
PCD 08-06-2016 <0.03 303.00
PCD 14-10-2016 <0.03 <0.45 609.00
PCD 14-11-2016 <0.03 <0.45 9.20
PCD 06-12-2016 <0.03 <0.45 0.80
PCD 20-02-2017 <0.03 <0.45 384.00
PCD 16-03-2017 <0.03 0.76 14.80
PCD 17-05-2017 371.00
PCD 07-06-2017 211.00
PCD 11-07-2017 7.20
PCD 17-08-2017 92.80
PCD 17-09-2017 25.40
PCD 16-02-2018 0.01
PCD 16-03-2018 0.01
PCD 01-05-2018 <0.005 218.00
PCD 01-06-2018 0.04 55.00
PCD 01-07-2018 0.03 64.00
PCD 01-08-2018 <0.005 70.00
PCD 01-09-2018 <0.005 59.00
PCD 01-10-2018 0.01 2824.00
PCD Q1 0.04 112.33
PCD Q2 0.01 984.33
PCD Drainage
08-06-2016 <0.03 <0.4
PCD Drainage
14-10-2016 0.04 <0.45 33.60

MANUNGU Colliery, Life of Mine: Groundwater Impact Assessment Ref:327e DRAFT2 Jul’ 2019
GROUNDWATER SQUARE
Site Name Date
Chemical Oxygen Demand
O2 (mg/L)
Oxygen Absorbed O2 (mg/L)
Oxygen Dissolved O2 (mg/L)
Ortho Phosphate (P mg/L)
N_Ammonia (mg/L)
Suspended Solids (mg/L)
TPH (mg/L)
PCD Drainage
14-11-2016 <0.03 <0.45 <0.4
PCD Drainage
06-12-2016 0.05 <0.45 <0.4
PCD Drainage
20-02-2017 <0.03 <0.45 6.40
PCD Drainage
16-03-2017 0.05 <0.45 2.44
PCD Drainage
17-05-2017 8.80
PCD Drainage
17-06-2017 4.40
PCD Drainage
11-07-2017 4.40
PCD Drainage
17-08-2017 3.20
PCD Drainage
17-09-2017 2.80
PCD Drainage
16-02-2018 0.01
PCD Drainage
16-03-2018 0.01
PCD Drainage
01-05-2018 <0.005 752.00
PCD Drainage
01-06-2018 0.05 1820.00
PCD Drainage
01-07-2018 0.03 23.00
PCD Drainage
01-08-2018 <0.005 18.00
PCD Drainage
01-09-2018 <0.005 <4.5
PCD Drainage
01-10-2018 0.03 3271.00
PCD Drainage
Q1 0.04 865.00
PCD Drainage
Q2 0.03 1644.50
Pit Area 08-06-2016 <0.03 36.80
Pit Area 14-10-2016 <0.03 1.17 32216.00
Pit Area 14-11-2016 <0.03 <0.45 321.00
Pit Area 06-12-2016 <0.03 4.24 104.00
Pit Area 20-02-2017 <0.03 4.11 10.00
Pit Area 16-03-2017 <0.03 4.70 186.00
Pit Area 17-06-2017 15.20
Pit Area 11-07-2017 217.00
Pit Area 17-08-2017 5.20
Pit Area 17-09-2017 33.60
Pit Area 16-02-2018 0.01
Pit Area 16-03-2018 0.01
Pit Area 01-05-2018 <0.005 1210.00
Pit Area 01-06-2018 0.04 530.00
Pit Area 01-09-2018 <0.005 1316.00
Pit Area 01-10-2018 0.01 430.00 <10
Pit Area Q1 0.04 870.00
Pit Area Q2 0.01 873.00 <10
WRD-1 26-03-2018 8.00 2.94 6.51 0.34 <0.45 <0.4

MANUNGU Colliery, Life of Mine: Groundwater Impact Assessment Ref:327e DRAFT2 Jul’ 2019
GROUNDWATER SQUARE
Appendix VII – Geochemical Evaluation
(By Geostratum)

MANUNGU Colliery, Life of Mine: Groundwater Impact Assessment Ref:327e DRAFT2 Jul’ 2019
GROUNDWATER SQUARE
Appendix VIII – Risk Assessment Tables
[---]

MANUNGU Colliery, Life of Mine: Groundwater Impact Assessment Ref:327e DRAFT2 Jul’ 2019
GROUNDWATER SQUARE

MANUNGU Colliery, Life of Mine: Groundwater Impact Assessment Ref:327e DRAFT2 Jul’ 2019
GROUNDWATER SQUARE

MANUNGU GROUNDWATER STUDY
ASSESSMENT
Vik Cogho Consulting
Submitted to Groundwater Square July 2019

Page | i
Contents
List of Figures ........................................................................................................................ii
List of Tables .........................................................................................................................ii
1.0 Project Introduction .................................................................................................... 1
2.0 Scope of Studies ........................................................................................................ 2
3.0 Investigation and Contents ......................................................................................... 3
4.0 Conclusions and Recommendations .......................................................................... 4
5.0 References ................................................................................................................. 8

Page | ii
List of Figures
FIGURE 1 LOCALITY PLAN OF THE STUDY AREA (BOTHA, 2018) .................................................. 1
List of Tables
TABLE 1 PROS AND CONS OF FLY ASH APPLICATION IN OPENCAST MINES (IGS, 2000)……6

Page | 1
1.0 Project Introduction
Vik Cogho Consulting (VCC) was appointed by Groundwater Square (GW2) to perform a
review on a groundwater assessment of the Manungu Colliery.
Groundwater Square was approached to perform an update of the existing Manungu
groundwater study, ensuring compliance with the WUL conditions, as well as to update the
existing study to cover the proposed extended LOM of 30 years. Manungu Colliery is situated
roughly 8 km south of the town of Delmas.
The Manungu Colliery is situated in quaternary catchments B20A and has a MAP of 661mm.
It is bounded by quaternary catchments B20B in the north, C21E in the west and C21A in the
south. The mean annual evaporation for the area varies between 1,600mm and 1,700mm.
Figure 1 depicts the study area and its surroundings.
Figure 1 Locality and geological plan of the study area (Botha, 2019)
From a geological perspective as depicted in Figure 1, the mining area is situated within the coal bearing formations of the Karoo sediments. Dolerite sills outcrop to the north and across the southern extent of the mining area. Further to the north of the mining area, dolomites of the Malmani Subgroup outcrop, while rocks of the West Rand Group’s Hospital Hill Subgroup outcrop to the northeast and southeast. Alluvium can be seen along the natural surface water drainage lines. Based on this it is important to evaluate and understand how the presence of the respective geological units will impact on the underlying and surrounding groundwater resource.

Page | 2
2.0 Scope of Studies
The following scope of work summarises the work to be performed by Groundwater Square to
update the earlier groundwater assessment:
• Desktop study to generate baseline infrastructure information and maps;
• Collect data relevant to the study, including:
o Geology;
o Geometry (XYZ) of coal seam floors;
o Current and LOM mine layouts;
o Relevant site information from visual inspection and discussions;
• Collect field data:
o Perform geophysical surveys (during two phases), in addition to Mine
aeromagnetic survey (magnetic, gravity and resistivity to investigate the
occurrence of dykes and preferential flow zones/cavities in critical areas);
o Drill hydrogeological boreholes (based on mine plan, geophysics, structural
geology and potential impacts) during two phases:
o Perform EC profiling on borehole water columns;
o Perform water sampling of boreholes, springs, surface water and private
boreholes;
o Perform aquifer and borehole hydraulic testing:
• Slug-tests on all newly drilled boreholes (surrounding boreholes might be included);
• A combination of yield tests, step-tests and long-term tests on a selection of borehole(s);
• Laboratory analysis of sampled water:
o Minimum pH, EC, TDS, Ca, Mg, Na, K, Cl, SO4, NO3, T.Alk, Si, F, Al, Fe, Mn;
• Evaluate data in the context of geological information provided by the mine:
o Computerise/analyse/interpret field test data;
o Interpret/describe aquifer conditions and hydraulic attributes;
• Review project objectives and modelling scenarios, and discuss with Mine Management;
• Geochemical assessment for opencast operation and Wash Plant:
o Analyse client database of mineralogical and elemental composition of the
rock/coal material;
o Perform laboratory analysis on core/pulp/drill samples for e.g.
ABA/XRD/XRF/NAG/%S;
o Determine the potential for acidic mine drainage over the long term;
o Specifically evaluate the option of placing discard from the planned Wash Plant
back into the pit;
o Perform oxygen diffusion and geochemical trend numerical modelling to determine
the expected variations in mine water quality during mining and at post-closure;
• Perform groundwater modelling assessment:
o Compile conceptual model;
o Compile and calibrate detailed numerical 3D model(s) to quantify/assess impacts;
o Incorporate geochemical assessment data in numerical models, to enable
prediction of contaminant movement;
• Groundwater impact calculations:
o Identify/describe/calculate impacts on the groundwater environment through
analytical equations and numerical modelling;
o Propose mitigation/management measures;
o Identify data gaps and focus areas for additional research if required;
• Provide guidance on:
o Water monitoring;

Page | 3
o Mitigation measures.
The proposed above activities adequately cover all aspects of a detailed investigation to
determine existing and potential groundwater impacts resulting from the current and proposed
extended mining operation.
3.0 Investigation and Contents
A substantial amount of investigative work was completed to understand the prevailing groundwater conditions within the mining rights area. The investigation commenced with a desktop study of all previous groundwater work done in the area. This was followed up by extensive geophysical investigations, including:
• Aeromagnetic and radiometric surveys;
• A gravimetric geophysical survey comprising a total of 310 stations; and
• A Stratagem Magneto Telluric (AMT) geophysical traverse line along the boundary between the existing mining area and the proposed extension to the south which also corresponds with the major central EW gravity survey lined performed during the initial investigation.
These geophysical surveys were done to identify preferential groundwater flow zones within the mining rights area, as well as to fully understand the underlying geohydrological conditions that would be used to construct a representative groundwater model for the mining area. This also included the drilling of numerous boreholes (shallow, medium and deep), evaluating the aquifer characteristics of the prevailing aquifers within the area.
Further to the geophysics a substantial amount of geohydrological information, covering a
number of years, as well as new information was processed and forms part of the report. The
scientific processing and evaluation of this information in the report is based on proven
geohydrological methodologies and is adequate. In addition to this the aquifer vulnerability of
the underlying and surrounding groundwater regime was satisfactorily evaluated
A conceptual groundwater model was compiled, based on the underlying and surrounding
geological and geohydrological conditions. The complex geohydrological regime of the area
is adequately addressed in the conceptual model and was used as the basis for the numerical
groundwater model.
The FEFLOW finite element numerical groundwater flow and transport software package was
used to determine the groundwater balance during and post mining, as well as an estimate
was made of the potential spread of affected groundwater over time. The numerical
groundwater model of the area was checked and comprises the following:
• The numerical model grid consisted of 9 layers and 2.1 million mesh elements to
accommodate the complex geometry of the coal seams and aquifer layers:
o Karoo-Ecca aquifers were incorporated as the top 4 model-layers;
o The underlying Dwyka was represented by model-layer-5;
o Intrusive rocks were represented by model-layer-6;
o A layer to minimum 70m deep, below the intrusive rocks was represented by
model-layer-7;
o The Black Reef was represented by model-layer-8;
o The bottom layer of the model, to a depth of 305m was represented in model-
layer-9;
o Model-layers were incorporated/adapted to reflect the expected changing aquifer
hydraulics with depth for both the Karoo- and non-Karoo geology;
Page | 4
o All underground mining areas were incorporated as discrete elements, which
enabled the simulation of free-flow;
• Post-mining aquifer parameters were incorporated as follows:
o Opencast mining was assumed to have an aquifer hydraulic conductivity of
100m/d;
o Recharge on all rehabilitated opencast mining was assumed 12% of MAP;
o The extent of the model grid and cell size are believed to be sufficient to simulate
groundwater flow accurately;
• Steady-state groundwater flow modelling was performed to simulate pre-mining and
post-mining groundwater level elevations and flow directions;
• Transient flow modelling was performed to determine:
o Groundwater base-flow volumes during mining/operation and post-mining;
o Dewatering impact zone;
o Time to decant;
o Contamination movement;
• Water balance calculations took cognisance of groundwater base-flow/inflow and
rainfall recharge.
The extent of the model domain was chosen along local non-perennial streams, rivers and
local topographical highs, which are located far enough from the Manungu mining area, to
have no influence on the model accuracy. The conceptual model developed includes a variety
of aquifers present within the area and is aligned with the geology of the bigger surrounding
area. This information was accurately transferred into the numerical model and adequately
covers the somewhat complex geohydrology of the area. This is viewed as good practice.
The groundwater quality and potential long-term water quality impacts were well covered,
including an in-depth geochemical evaluation of the mining area to predict the expected long-
term decant water qualities.
The large amount of data and scientifically processed information were well utilised to evaluate
possible impacts from the mining operation on the surrounding groundwater resource. This
was also used to recommend mitigatory measures to manage the potential impacts over the
LOM and post-mining.
The index and grouping of chapters is good. The language and style of the report is good. Some comments were made in the report that require attention in this regard. In general the size of the plans in the report are adequate to assist the reader with the interpretation thereof, however, there are some diagrams that require improvement, to ensure better readability.
4.0 Conclusions and Recommendations
With this assessment GW2 demonstrate their understanding and insight of the geohydrological
aspects/parameters associated with rather complex geology and its surroundings. The impact
the current and future mining activities will have on the surrounding groundwater regime are
well documented and should assist the operator to implement appropriate management
systems to limit their impact on the resource.
The model appears to adequately predict the dewatering cone of depression in groundwater
levels during and post mining. However, looking closely at the post-mining dewatering cone
of depression associated with the bigger underground mine, i.e. to the south of the mining

Page | 5
area, the water levels in this area do not seem to recover over time. This could negatively
impact on the vulnerability of the underlying/surrounding aquifers and requires additional
attention, i.e. to ensure the mechanisms driving this process are understood and that
appropriate mitigatory measures can be implemented during the operational phase.
Section 10.4 suggests that to mitigate the generation of AMD in opencast workings, fly ash
from close by power stations could be used. It is important to note that not all fly ash may be
effective neutralization agents, as the process of calcium carbonate crystallisation (pozzolanic
action) may be in an advanced stage within the ash dams and will thus restrict he release of
alkalinity when exposed to water percolating through the ash layer.
Detailed research was done on the use of fly ash in opencast mines by the Institute for
Groundwater Studies and a summary of the pros and cons are listed in Table 1, and should
be considered prior to the implementation thereof.
Managing the groundwater levels within the mined out and rehabilitated opencast area is a
good practice and will definitively assist to limit the spread of mine affected after closure.
However, suggesting that a tree plantation may assist in this regard is risky and not a proven
management alternative. Numerous trials with trees have been done on some of the larger
opencast mines in the region that were not successful. Furthermore, economically viable
plantations require large areas and in the case of the Manungu operation, this may not be an
effective alternative. If trees are considered to manage the groundwater levels post mining, it
is therefore suggested that the appropriate specialists are appointed to develop a sustainable
tree management strategy, yielding the required outcomes over the long-term.
Regarding the management of coal residues (coal discard and slurry), GW2 suggests that the
in-pit disposal of mine residues, well below the decant water level, should be considered rather
than the development of a surface mine residue storage facility. The GW2 suggestion is
deemed to be good practice and will definitively be more sustainable over the long-term,
especially after mine closure. Successfully maintaining surface mine residue facilities
sustainably post closure, will require continuous/ongoing management interventions, even if
a costly clay capping is applied to the mine residue facility.
With this groundwater assessment of the Manungu mining area, Groundwater Square clearly
demonstrate their good understanding and insight of all the groundwater issues related to the
current and proposed future mining operations within the area. Prediction of the long-term
decant volumes and water quality are well structured and based on sound science and are a
good estimated based on all the existing available data. It should be stressed that it is of the
utmost importance that the Colliery continues with regular monitoring of all the listed surface
and groundwater monitoring points. This will assist any future effort to predict and verify the
long-term water qualities and decant volumes that may emanate from the mined-out workings.
Based on the content of the report and recent discussions with Groundwater Square it can be
stated that the aims and objectives of the 2019 Manungu groundwater assessment were met
and adequately cover all requirements of the DWS WULA process.

Page | 6
Table 1 Pros and cons of fly ash application in opencast mines (IGS, 2000)
Application scenario
Advantages
Disadvantages
Recommendation
In-pit, below the final
decanting level.
• No long-term advantage. • Heavy metal mobilisation
from the ash after
acidification of the
mine water will present
a problem.
• The sporadic application
of the fly ash in ramps
and voids will not have
an overall beneficial
impact on the mine
water.
• This should not be
done unless the
whole of the pit is
to be covered
with sufficient ash
to eliminate
oxidation of the
pyrite in the mine.
• The Matla fly ash
disposal in and
on top of Kriel Pit
3N is a good
example of safe
disposal,
because the
whole pit will be
covered with fly
ash, thus
eliminating future
pyrite oxidation.
In-pit, above the final
decanting level.
• Fly ash could be applied
as a cover to minimise
rain-water and oxygen
ingress into the spoil.
• The fly ash could be
treated by addition of
cement or bentonite to
reduce rain-water and
oxygen penetration.
• The alkalinity to be
released from an ash
cover is insufficient to
neutralise acid
production in the spoil
below.
• The cost of ash
application could be
high because of the
undulating spoil
surface.
• Vegetation and
maintenance of the
ash surface will be
required.
• Perform trial
permeability and
leaching tests in
the field.
• Design the ash
cover to meet the
objectives.
• Implement as a
cover in high risk
areas, such as
above coal
discards.
Ash water introduction. • This will introduce
additional alkalinity into
the spoil.
• It will improve the mine
water quality through
gypsum and heavy
metal precipitation.
• Water is an easy medium
to work with and can be
introduced into the
spoil through
boreholes where and
when required.
• Ash water will have to be
tapped as soon as
possible from fresh ash
and injected through
boreholes into the spoil
to ensure maximum
efficiency.
• Ash water from the ash
dams has insufficient
alkalinity and will not
be an effective
neutralising medium.
• A trial investigation
should be done to
determine design
parameters.
Measurements
should be done
by experienced
individuals to
ensure that
definitive
answers are
obtained.

Page | 7
_______________________ DR VE COGHO Pr.Sci.Nat. (400019/93)

Page | 8
5.0 References
Botha, L., (2018). Manungu Colliery Life of Mine: Groundwater Impact Assessment.
Van der Berg, J.J., Cruywagen, L. and Hodgson, F.D.I., (2000). The suitability and impact
of power station fly ash in opencast mining rehabilitation. WRC Report.