mapping high conservation values d1.1 - cbd high conservation values... · 2 mapping high...
TRANSCRIPT

HCV landscape mapping draft discussion document d1 May 2009 1
1
Mapping High Conservation Values at large 2
scales for effective site-level management 3
4
Public consultation draft 1, May 2009 5
6
Note on this draft discussion document 7 8 The HCV Resource Network ran a workshop in December 2008 to discuss 9 methodologies for mapping HCVs, with an emphasis on understanding landscape-10 scale conservation values, and using the landscape context for effective HCV 11 management at the site scale. 12
The HCV Network Secretariat has prepared this document based on the workshop 13 debates. It is not intended as a comprehensive source document or definitive 14 guidance. Instead, we have tried to take the debate forward in a way which will help 15 land use managers to improve their HCV assessment and management, and to 16 highlight a number of key issues which still need to be resolved. 17
We hope that this document will be read carefully by conservationists, HCV 18 practitioners and land use managers responsible for implementing HCV 19 management, and we would welcome suggestions for improvements, and for 20 activities to clarify some of the key outstanding questions. Highlights in the text 21 indicate areas where we feel a particular need for further work, but we do not intend 22 to limit comments to these areas. 23
We invite comments, submissions and suggestions to be submitted by July 31st 2009. 24
We are deeply indebted to the workshop participants for the many excellent 25 presentations and case studies they prepared for this workshop, most of which are 26 available on the HCV Network website. We have liberally used these sources to 27 illustrate and enrich our document, and intend that the final document will 28 acknowledge the substantive contribution of all the materials used. However, any 29 errors in this document are our own. 30
31
32 Authors: 33 Christopher Stewart (HCV Resource Network) 34 Tim Rayden (ProForest) 35 36
Disclaimer: 37
The authors are responsible for the choice and presentation of the materials and 38 opinions contained in this draft document, which are not necessarily those of the 39 HCV Resource Network or of its Steering Group organisations. 40

HCV landscape mapping draft discussion document d1 May 2009 2
Table of Contents 1
2
1. Introduction ........................................................................................................... 3 3
2. HCV Resource Network mapping methodologies workshop.............................. 7 4
3. Outline of HCV mapping process ......................................................................... 8 5
4. How big should the 'wider landscape' be?........................................................... 9 6
4.1. Usefulness of landscape-level analysis for different HCVs............................. 9 7
4.2. Getting the scale right: ................................................................................... 10 8
5. Identification and large scale mapping of biological and ecological HCVs (HCV 9 1, 2, 3) .............................................................................................................................. 14 10
5.1. Mapping HCV 3 at large scales:...................................................................... 14 11
5.2. Mapping HCV 1 at large scales....................................................................... 20 12
5.2.1. Mapping HCV 1.1 - Protected areas....................................................... 20 13
5.2.2. Mapping HCV 1.2 - Threatened and endangered species, and HCV 1.3 14
- Endemic species:..................................................................................................... 20 15
5.2.3. Mapping HCV 1.4 - Critical temporal use.............................................. 23 16
5.3. Mapping HCV 2................................................................................................ 24 17
6. Identification and large scale mapping of social HCVs (HCV 4, 5, 6: ecosystem 18 services, social and cultural values) ............................................................................... 26 19
6.1. Mapping HCV 4 at large scales....................................................................... 26 20
6.2. Mapping HCV 5 and HCV 6 at large scales.................................................... 28 21
7. Mapping HCVs and HCV management areas at the site level .......................... 30 22
7.1. Mapping HCVs in detail at the site level ........................................................ 30 23
7.2. Delineating HCV management areas ............................................................. 30 24
7.3. HCV management areas and management targets for HCV 3..................... 31 25
7.4. HCV management areas and management targets for HCV 1..................... 34 26
7.5. HCV management areas and management targets for HCV 2..................... 36 27
7.6. HCV management areas for social HCVs (4, 5, 6)......................................... 37 28
Annex 1: Table of Workshop participants...................................................................... 38 29
Annex 2: Criteria for potential impact of operations .................................................... 39 30
Annex 3: HCV 3 and conservation offsets ..................................................................... 40 31
References ........................................................................................................................ 42 32

HCV landscape mapping draft discussion document d1 May 2009 3
1
1. Introduction 2
Why is it necessary to understand HCVs at large spatial scales? 3
Many major natural resource sustainability standards* currently require that 4
operations are planned and managed in a way that maintains or enhances High 5
Conservation Values (HCVs), i.e. outstandingly significant biodiversity, social and 6
cultural values, and ecosystem services. A basic requirement of HCV assessment (and 7
a guiding principle of the HCV Resource Network, Box 1) is that that the 8
identification of values should take account of the wider context. 9
Each management unit (MU) lies within a given 'wider landscape' containing a 10
particular configuration of topography, vegetation, geology, land use and human 11
settlement. This geographical context often determines whether or not a given 12
feature of the MU is a High Conservation Value, and effective HCV management at 13
the site level requires an appropriate understanding of the ‘wider landscape’ (Table 14
1). However, there has been little practical guidance on how to map HCVs at large 15
‘landscape’ scales or how to interpret large-scale maps for site-level decisions. 16
The HCV concept was originally designed to be used at the management unit level 17
for sustainable forest management. Significant and urgent new challenges arise from 18
the introduction of HCV as a tool for planning where large areas are zoned for 19
conversion of natural vegetation to tree plantations or agricultural crops. This is 20
especially challenging where government land use plans do not incorporate a 21
systematic conservation approach. 22
If land use plans do not take conservation needs into account, individual MUs may be 23
assessing HCVs and planning HCV management without the benefit of a coordinated 24
large-scale approach. This creates a clear risk that case by case HCV assessments, 25
using inconsistent methodologies, will result in conflicting maps and management 26
recommendations. This will lead to confusion, poor implementation, and damage to 27
conservation values, thus devaluing the HCV concept. 28
In order to minimise these risks, forest managers, plantation owners and other key 29
stakeholders (certification bodies, investors, supply chain organisations, social and 30
environmental NGOs, government planning offices and others) urgently need: 31
• shared maps and consistent information and guidance on HCVs at large spatial 32
scales (e.g.regional or landscape level), 33
• guidance on what these maps mean at the site or project level, and 34
• tools for conservation planning/management at the site level if HCVs are present. 35
* E.g. Forest Stewardship Council (FSC), Round Table on Sustainable Palm Oil (RSPO), Round
Table on Responsible Soil (RTRS), UK Renewable Transport Fuel Obligation (RTFO), Round
Table on Sustainable Biofuels (RSB), and Climate Community and Biodiversity Alliance CCBA.

HCV landscape mapping draft discussion document d1 May 2009 4
Table 1. The 6 generic HCVs (from the ‘Global’ HCVF Toolkit, 20031) and the 1
importance of the landscape context for HCV identification and management. 2
Importance of the
landscape context
for identification and
management High Conservation Value
High Med. Low
HCV 1.1 Protected areas X
HCV 1.2 Rare, threatened or
endangered species X
HCV 1.3 Endemic species X
HCV 1: Areas containing
globally, regionally or
nationally significant
concentrations of biodiversity
values
HCV 1.4 Critical temporal use X
HCV 2: Globally, regionally or
nationally significant large
landscape-level areas where
viable populations of most if
not all naturally occurring
species exist in natural
patterns of distribution and
abundance
No sub-criteria X
HCV 3: Areas that are in or
contain rare, threatened or
endangered ecosystems
No sub-criteria X
HCV 4.1 forest or ecosystems
critical to water catchments X
HCV 4.2 Forests or ecosystems
critical to erosion control X
HCV 4: Areas that provide
basic ecosystem services in
critical situations HCV 4.3: forests or ecosystems
providing barriers to destructive
fire
X
HCV 5: Natural Areas
fundamental to meeting
basic needs of local
communities
No sub-criteria X
HCV 6: Natural areas critical
to local communities’
traditional cultural identity
No sub-criteria X
3

HCV landscape mapping draft discussion document d1 May 2009 5
What is the purpose of this document? 1
This draft discussion document is the result of a workshop organised by the HCV 2
Resource Network in December 2008 (see Section 2) to examine interpretation and 3
mapping of HCVs at a range of spatial scales, and in particular to link very large or 4
‘landscape’-scale conservation priorities with site-level HCV management. 5
The aims of this document are: 6
• To promote a constructive debate amongst HCV stakeholders on HCV mapping 7
• To develop shared, knowledge based and participatory HCV mapping tools to 8
guide consistent HCV mapping, 9
• To promote efforts to integrate HCV in land use planning frameworks 10
This document is likely to be useful for anyone involved in HCV assessment and 11
management for large scale or high impact operations (defined in Annex 2), 12
particularly in situations where data is deficient, where national strategic 13
conservation planning assessments have not taken place, or where such an 14
assessment has not been integrated into the national land use planning framework. 15
Because of the relative importance of the landscape context for biological values (see 16
Table 1 and section 4.1), this document emphasises the biodiversity elements of HCV 17
assessment, but the HCV Network and the workshop participants recognise that 18
social elements are equally important and that further development of social 19
concepts and methodologies with HCV assessment is an urgent necessity. 20
This document assumes some familiarity with HCV concepts, the HCV assessment 21
process and site-level methodologies. Further HCV briefing notes and guidance 22
documents can be sourced from the HCV Network website, www.hcvnetwork.org. 23
How much effort will be required for understanding the landscape context? 24
Social and environmental impacts of plantations and forestry operations are usually 25
lowest where they are part of a planned landscape in which social, production and 26
conservation needs are balanced and zoned appropriately. Landscape HCV 27
assessment in such a context may be a relatively simple task, if the baseline data and 28
guidance are widely available. The level of effort which is necessary also depends on 29
the intended land use and potential impact within the management unit: 30
• Small to medium-scale, low-impact operations are likely to require a relatively 31
local, low-tech or qualitative analysis of the wider context. Appropriate guidance 32
at this scale needs to be kept as simple as possible, and context analysis should 33
require a minimal burden on managers’ resources and time. 34
• Large-scale, high or very high-impact operations are likely to need a larger frame 35
of reference, access to high-quality data (e.g. up-to-date satellite images or aerial 36
photography) and detailed quantitative analysis. This document provides 37
guidance on many of the key issues that will need to be addressed. 38
Guidance on the categories of impact of various types of operations has been 39
developed by the HCV Network Technical Panel for assessing HCV assessments 40

HCV landscape mapping draft discussion document d1 May 2009 6
(three categories of impact, Annex 2). It is unlikely that conservation management 1
for any Category 1 operations and some Category 2 operations as defined in Annex 2
2 would be credible or effective without some rigorous analysis of HCVs at the 3
landscape context as suggested in this document. 4
Box 1: Guiding Principles of the HCV Resource Network 5
(NB: The HCV Resource Network Charter text (see www.hcvnetwork.org) has been slightly 6
abridged and highlighted to indicate key points discussed in the workshop of December 2008. 7
High Conservation Value areas are critical areas in a landscape which need to be 8
appropriately managed in order to maintain or enhance High Conservation Values (HCVs). 9
There are six main types of HCV area (…): 10
HCV 1 Areas containing globally, regionally or nationally significant concentrations of 11
biodiversity values (e.g. endemism, endangered species, refugia). 12
HCV 2 Globally, regionally or nationally significant large landscape-level areas where viable 13
populations of most if not all naturally occurring species exist in natural patterns of 14
distribution and abundance. 15
HCV 3 Areas that are in or contain rare, threatened or endangered ecosystems. 16
HCV 4 Areas that provide basic ecosystem services in critical situations (e.g. watershed 17
protection, erosion control). 18
HCV 5 Areas fundamental to meeting basic needs of local communities (e.g. subsistence, 19
health). 20
HCV 6 Areas critical to local communities’ traditional cultural identity (areas of cultural, 21
ecological, economic or religious significance identified in cooperation with such local 22
communities). 23
The HCV approach (...) should always involve: 24
• Assessment of the presence or absence of all six HCVs 25
• Analysis of the context including existing protection of, and threats to, the identified 26
HCVs. 27
• Identification of the location and relevant management regimes for the HCV areas 28
required to maintain or enhance the identified HCVs. 29
• Development and implementation of a monitoring programme (...). 30
The assessment process to be followed should be: 31
• Knowledge-based, incorporating and using all relevant scientific data and local 32
knowledge. Where significant gaps in existing information are identified, data should be 33
collected or the precautionary approach, commensurate with the degree of risk, should be 34
followed. 35
• Participatory and inclusive, ensuring that relevant stakeholders are consulted and their 36
views or the information they provide is incorporated into the process and that 37
appropriate existing initiatives are engaged wherever possible. 38
• Open and transparent including peer reviews of findings and public reporting of 39
outcomes. 40
HCV landscape mapping draft discussion document d1 May 2009 7
2. HCV Resource Network mapping methodologies 1
workshop 2
In December 2008 the HCV Resource Network convened a workshop of international 3
HCV assessment experts, conservation biologists and other stakeholders (see 4
Appendix 1) to share their experience and discuss: 5
• The technical basis and range of appropriate methodologies for mapping HCVs at 6
a large 'landscape' or regional level with a particular emphasis on the landscape 7
context (Box 2) for biodiversity management. 8
• Incorporation of large-scale conservation priorities into site-level assessment and 9
planning decisions, consistent with sound principles of conservation science, 10
• Strengthening the links between HCV management plans developed by industry, 11
and existing conservation initiatives, such as national conservation strategies, 12
land use planning frameworks, and NGO-led conservation projects. 13
14
Box 2: Note on the meaning of 'landscape' 15
There have been many attempts to define what we mean by a 'landscape', which is not an 16
exact scientific term but rather a flexible way of defining a large land area with some defining 17
or coherent characteristics. Landscapes can be understood to be mosaics of different types of 18
habitats or ecosystems, defined by human conceptions and values, at a scale where different 19
land uses can be balanced. 20
'Conservation landscapes', as understood by conservation biologists, may be defined in terms 21
of maintaining viable populations of species, or defined species assemblages, and may contain 22
or overlap with a series of 'cultural landscapes' as understood by communities and social 23
groups. There is no single way of defining landscapes, as this depends on what the purpose of 24
the assessment is. 25
We use the phrase 'wider landscape' as a convenient shorthand for conveying the large-scale 26
context for HCV assessment, but remain aware that the ‘landscape’ concept means different 27
things in different places according to biological, geographical, political, economic and social 28
factors. 29
30
In drafting this document, we recognise that the input of conservation biologists is 31
just one of several important components of the wider HCV identification and 32
management process. Unlike many biodiversity values, social values cannot be 33
reliably identified at a landscape or regional level (see Box 3 and Table 1). For site 34
level identification and management of HCVs (including social and biological values), 35
local people and community representatives need to be directly involved in the 36
assessment process, and land use industry representatives have a vital role to play in 37
the development of design tools and management methodologies for economically 38
viable and sustainable forestry and plantation activities. It is hoped that this 39
document will stimulate debate amongst HCV stakeholders including community and 40
industry representatives as to how to integrate all of these strands of HCV 41
management. 42

HCV landscape mapping draft discussion document d1 May 2009 8
3. Outline of HCV mapping process 1
In existing sustainability standards and HCV toolkits, HCV areas have been defined in 2
two different ways: 3
Definition 1: HCV forests (or areas) are areas which possess one or more HCV 4
attributes. This definition describes a spatial boundary for the occurrence of one or 5
more HCVs. 6
Definition 2: HCV areas are critical areas in a landscape which need to be 7
managed appropriately to maintain or enhance one or more HCVs. This 8
definition describes a spatial boundary for the area where specific management is 9
required. 10
The second definition can be more explicitly described as an HCV management area 11
(an approach that has been adopted e.g. by the Indonesian HCV Toolkit revision of 12
20082). 13
Effective management of HCVs at the site level normally requires maps and/or 14
descriptions of HCV occurrence (definition 1), leading to maps of HCV management 15
areas (definition 2). 16
The HCV mapping process can be achieved by a number of separate but linked steps: 17
1. Deciding on the spatial extent of HCV assessment (i.e. how big is the 18
'wider landscape' within which HCV judgements are made? See section 4). 19
2. Large-scale identification and coarse mapping of potential HCVs within 20
this 'wider landscape' (see Sections 5 and 6) 21
3. Site level investigation and detailed mapping of HCVs, including: 22
a) ground-truthing and detailed site-level mapping of values identified 23
through the large-scale mapping process, 24
b) identification and detailed mapping of HCVs which are not apparent at 25
large scales. 26
4. Conservation target setting and mapping of HCV management areas 27
(areas which must be managed to maintain or enhance HCVs) (see Section 28
7). 29
This document covers some of the key issues associated with these steps. For further 30
information on site-level assessments (specifically step 3), see also the 'Good Practice 31
Guidelines for HCV assessment' (2008)3 in particular. 32

HCV landscape mapping draft discussion document d1 May 2009 9
4. How big should the 'wider landscape' be? 1
Purpose of analysis: To define the boundaries of the ‘wider landscape’ at a scale 2
which is appropriate for deciding whether the features of the MU are HCVs. 3
4.1. Usefulness of landscape-level analysis for different 4
HCVs 5
The boundaries of the assessment landscape are particularly important for defining 6
biological HCVs, and in particular for HCV 3 analysis, because thresholds of 7
significance (such as rarity and threat levels) for species and ecosystems are relative 8
and scale-dependent (see Table 1). 9
In contrast, an individual human community’s critical needs or cultural values are not 10
relative in the same way: they cannot be considered less significant if there are lots 11
of other examples of similar values being preserved in a wider context. Social and 12
cultural HCVs tend to be more localised and thresholds of significance can generally 13
only be determined by a bottom-up approach, including community-by-community 14
consultation. 15
Mapping and analysing the ‘wider landscape’ therefore has different implications and 16
different uses for different HCVs (Box 3). In each case the analysis provides a 17
preliminary identification of potential values, which will often need more detailed 18
analysis at the Management Unit level. 19
20
Social and cultural landscape concepts: 21
Much of this document concerns decision processes for assessing biological HCVs. 22
Conservation biologists are used to defining land units based on remote sensing 23
data, ecological parameters such as vegetation, climate, soil and elevation, and the 24
habitat requirements and population characteristics of key species. 25
Human communities often have very different perceptions of what landscapes mean 26
– based e.g. on ethnicity, religion and language, economic and cultural exchanges 27
with other communities, social history, and other characteristics. 28
Understanding the social and cultural context at a local level is critical not only for 29
maintaining HCVs 5 and 6, but also for effectively conserving biological HCVs. To 30
what extent, and how, do we need to understand or map social landscapes for HCV 31
management? Does the concept of social landscapes help us to understand social 32
HCVs, or to maintain and enhance social and cultural values? Does it help us to 33
maintain or enhance biological values? 34
Who and how do we need to consult in order to get a better understanding of these 35
issues, and to understand the interaction between social and biological values? 36

HCV landscape mapping draft discussion document d1 May 2009 10
1
Box 3 Some uses of the wider ‘landscape' analysis for different values 2
Context for HCV 1 analysis 3
• Position, extent and condition of protected areas relative to the management unit 4
• Position, extent and condition of suitable habitat (where suitability is known) for rare, 5
threatened and endangered species 6
• Existence of (large-scale) features which may support temporal concentrations of 7
biodiversity (e.g. mud flats, wetlands) 8
Context for HCV 2 analysis 9
• Existence of large, relatively intact ecosystems and their degree of 10
fragmentation/disturbance 11
• Potential for large-scale ecological functionality within the landscape 12
Context for HCV 3 analysis 13
• Identifying and categorising the range of different ecosystems present (see also following 14
section) 15
• Assessing which ecosystems are rare, and what the level of threat is (e.g. current and 16
predicted future loss) to different categories of ecosystems 17
Context for HCV 4 analysis 18
• Existence of potential ecosystem services provided e.g. by rivers and natural vegetation on 19
slopes 20
• Presence of communities and sensitive ecosystems that may be affected by Management 21
Unit operations (e.g. downstream communities) 22
• Large-scale environmental risks potentially affecting the management unit 23
Context for HCV 5 and HCV 6 analysis: 24
• Large scale patterns of land use, settlements, roads and other infrastructure 25
• Configuration and proximity of natural ecosystems to known settlements 26
Context for management decision-making: 27
• At the management decision stage, the landscape-level analysis provides a basis for 28
linking conservation measures within the MU to larger scale processes (see section 7) 29
30
4.2. Getting the scale right: 31
Drawing boundaries in different ways may alter the decision to classify a value as 32
HCV or not. 33
• If the boundaries of the landscape are drawn too small, many values within it may 34
be represented by a very few, poorly protected examples and be incorrectly 35
considered rare or threatened, when in fact they may be common and well 36
protected outside those boundaries. 37

HCV landscape mapping draft discussion document d1 May 2009 11
• If the boundaries are too large, the logical basis of the analysis may be lost. 1
Errors will be made by not comparing like with like, e.g. incorrectly lumping 2
together dissimilar habitats or ecosystems, and therefore failing to detect that 3
some are truly rare/threatened. The data may also be too coarse for good 4
decision making. 5
Defining boundaries of the ‘wider landscape’ 6
Conservation of threatened biodiversity values depends largely on the conservation 7
of natural ecosystems, including preserving sufficient suitable habitat for threatened 8
or endangered species (HCV 1) and preserving HCV 3 (rare or threatened 9
ecosystems). In many cases, assessment of biological HCVs should begin with 10
ecosystem analysis, based on a large-scale analysis of the vegetation types present 11
(see following section). 12
Ecosystems are hierarchical i.e. they can be defined at a range of scales from micro-13
habitats to biomes. Therefore, defining landscape boundaries is the top level of a 14
hierarchical process (illustrated in Fig 1): 15
• At a very large scale, a country or region can be subdivided into the major 16
physical and climatic units which govern ecosystem formation. 17
• The major subdivisions may need to be broken down into more manageable units 18
which encompass a consistent set of ecosystems and physical features such as 19
mountain ranges, watersheds and rivers. 20
• The ecosystem units making up the ‘wider landscape’ should themselves be 21
defined so that they are relevant to the scale of the management unit, and can be 22
used for site-level planning (see Section 5). 23
Assessors undertaking this type of analysis for understanding the biodiversity-24
related HCVs (HCVs 1, 2, 3) should be guided as far as possible by an existing 25
national conservation framework. The ideal option is to follow a widely accepted 26
scheme of biogeographic divisions, i.e. large areas characterised by repeating 27
patterns of ecosystems with common biological characteristics, which differ 28
substantially from neighbouring regions. These should be the upper scale limit of 29
any HCV analysis. 30
In most countries suitable analyses have been conducted of biogeographical zones 31
for the purposes of protected area selection or agricultural production, which can 32
serve as the basis for selecting ‘landscape’ boundaries. There may be major 33
geographical barriers between biogeographic regions (e.g. mountains or large 34
rivers); in other cases, change is gradual and boundaries are based on expert 35
consensus. 36
Other potential boundaries include political or administrative units – e.g. provincial 37
or district boundaries. This is the level at which land-use planning decisions are 38
made so the findings of the landscape analysis may need to be communicated using 39
these boundaries. However, if large-scale biogeographic patterns are very different 40

HCV landscape mapping draft discussion document d1 May 2009 12
from political boundaries, the analysis may need to cross political boundaries (see 1
Figure 2). 2
Whatever the scheme used, this needs to be justified and the assumptions that are 3
made by choosing a particular method should be explained. 4
EXAMPLES of helpful classification schemes 5
XX Need to compile a credibly complete regional lists of biogeographical classifications 6
through HCV Network expertise XX 7
Government-led ecological land classification schemes: 8
• Physiographic Regions system adopted in the Indonesian HCV Toolkit (see Fig 1) 9
• Bailey's ecoregions of the United States (US Forest Service)4 and the Commission for 10
Environmental Cooperation’s Ecoregions of North America5 11
• Ecological Land Classification of Canada6 12
• European Environment Agency’s Biogeographical Regions of Europe 2008 (these are 13
extremely broad – of limited use?)7 14
NGO-led programmes: 15
WWF's ecoregions and their national subdivisions – XXX NB where are these done to a suitable 16
level of accuracy for HCV work? XXX. 17
18
19
20
Fig 1: Biogeographic subdivisions of the island of Borneo, showing major subdivisions 21
(Biounits a-I of Mackinnon 1996) and smaller Physiographic Regions (e.g. Western Plains 22
and Mountains, highlighted in pink) based on the Indonesian Government’s land 23
classification study (‘RePPPRoT’). 24
HCV landscape mapping draft discussion document d1 May 2009 13
1
2
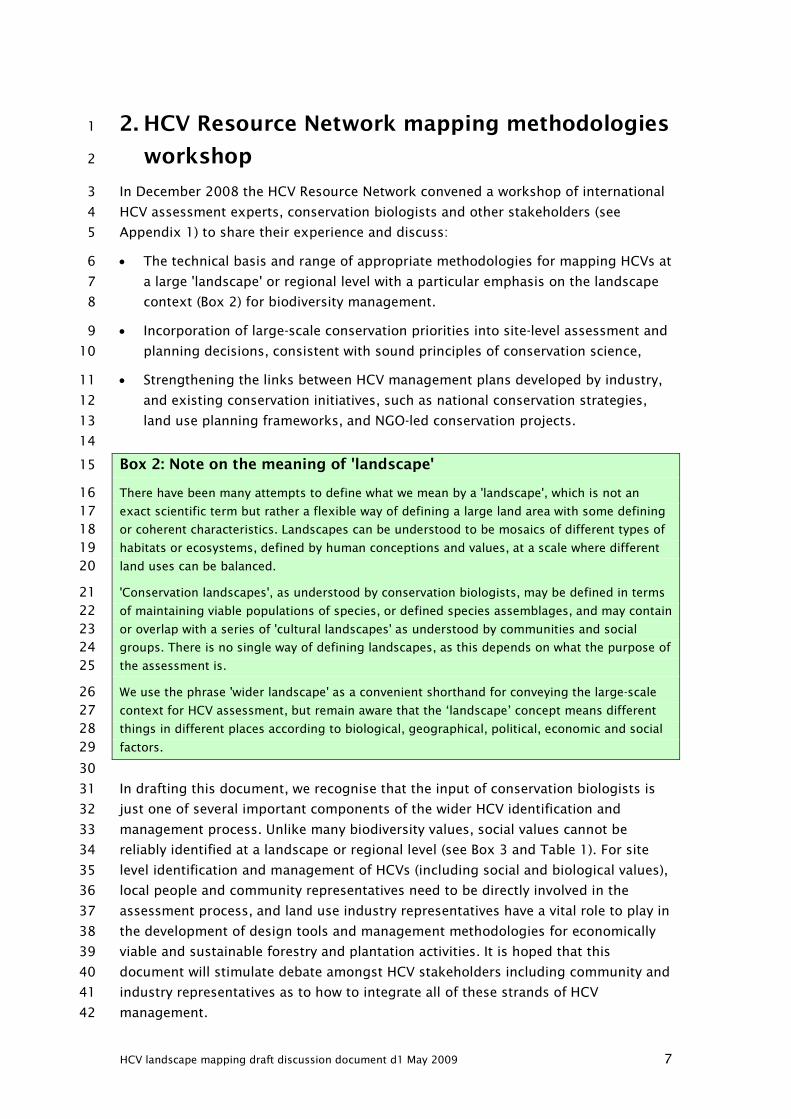
Figure 2: Deciding on appropriate limits for the ‘wider landscape’: the ideal scientific 3
context for an ecosystem analysis centred on the Management Unit is ‘Bioregion A’ (itself 4
made up of a repeating pattern of ecosystem units, not shown). If a political boundary is 5
chosen for practical purposes, this should broadly coincide with the ecological reality e.g. 6
political boundary ‘X’ is too small, ‘Y’ is the right order of scale, ‘Z’ is too large. 7
8

HCV landscape mapping draft discussion document d1 May 2009 14
5. Identification and large scale mapping of 1
biological and ecological HCVs (HCV 1, 2, 3) 2
Starting with the range of existing data, assessors need to decide what is significant 3
or critical at a regional, national or global level (i.e. what is HCV) and use these 4
criteria to map HCVs. 5
For biodiversity values (HCV 1, 2, 3), in the absence of detailed and up to date 6
species distribution data, a sensible approach is to start with the identification of 7
HCV 3 (ecosystems) and then identify gaps relating to species-specific conservation 8
targets (HCV 1). This is the approach followed in this document. However, this is for 9
guidance only and there may be circumstances where it makes sense to look at HCV 10
species and their critical needs first (especially if ecosystem data is poor or does not 11
correlate well with known HCV 1 species distributions). 12
Does the document’s structure help or hinder understanding the approach to 13
landscape level HCVs? 14
5.1. Mapping HCV 3 at large scales: 15
HCV 3: Areas that are in or contain rare, threatened or endangered ecosystems. 16
Purpose of analysis: 17
• To identify which ecosystems exist within the ‘wider landscape’ containing the 18
management unit (see Box 4 for ecosystem definition for HCV management), 19
• To identify which ecosystems are under critical threat, 20
• To identify which ecosystems are potentially present in the management unit. 21
Output: 22
Indicative maps of HCV 3 in the wider landscape, providing context for Management 23
Unit-level assessment. 24
Suggested process for HCV 3 mapping: 25
• Map existing ecosystem diversity (e.g. maps of vegetation classifications 26
based on best available evidence (Fig 3)) 27
• Map current land cover & remaining natural ecosystems (Fig 3 and 4) 28
• Measure actual threats to ecosystems (e.g. calculate actual loss of extent 29
based on a known historical extent and current distribution of ecosystems)* 30
• Estimate potential future threats to ecosystems (e.g. calculating 31
potential/probable loss of extent based on current land use plans and trends) 32
* NB: Assessing HCV 3 requires maps of protected areas, which are dealt with under HCV 1.1.
HCV landscape mapping draft discussion document d1 May 2009 15
• Apply rarity and threat selection criteria (see Box 5) 1
• Produce indicative, large scale HCV 3 ecosystem maps and information 2
Box 4 Defining ecosystems for HCV 3 analysis 3
For mapping HCV 3, a definition of ecosystems needs to be chosen at a relevant 4
scale for decisions in forest or plantation management. The criteria used for defining 5
ecosystems are likely to vary according to the location, level of knowledge, and the 6
scale of normal operations in a region. 7
The Convention on Biological Diversity (CBD) defines an ecosystem as a "dynamic 8
complex of plant, animal and micro-organism communities and their non-living 9
environment interacting as a functional unit". This definition highlights the fact that 10
ecosystems can be defined at a range of scales from the micro scale (e.g. a puddle, a 11
rotting log) to the macro scale (e.g. the Amazon Basin). Neither of these extremes is 12
useful for managing HCV ecosystems in forestry or plantations. 13
A practical and widespread approach is to base the ecosystem definition on 14
vegetation classifications which are easily recognizable in the field as well as on 15
satellite images. This sets the ecosystem definition at the scale of relatively 16
homogeneous natural (or traditionally managed) vegetational units with distinct 17
structural or functional attributes, which are defined by an interaction of biotic 18
factors (e.g. species composition) and abiotic factors (e.g. soil, altitude, rainfall etc.). 19
How this is applied in practice is dependent on the available data and local 20
knowledge or understanding. Where little is known about the species composition of 21
ecosystems, several biophysical factors can be combined to give suitable proxies for 22
vegetational units e.g.: 23
• Land cover type (forest, grassland, wetland etc) 24
• Rainfall and temperature 25
• Altitude and slope 26
• Geology and soils 27
• Hydrology 28
Many countries or have developed vegetational classifications which are useful at the 29
scale of HCV identification and planning e.g.: 30
• The modified RePPPRoT land classification system used in Indonesia 31
• Ecosystems of Central America (interactive mapping resource, Vreugdenhil et al 32
2002 and World Bank) and updated national maps 33
• Provincial-level ecological land classifications of Canada (see Canadian Forest 34
Service) 35
• European Environment Agency: European Forest Types8 and EU Habitats Directive 36
definition of European Union Habitats9 37
• OTHERS ? 38
HCV landscape mapping draft discussion document d1 May 2009 16
1
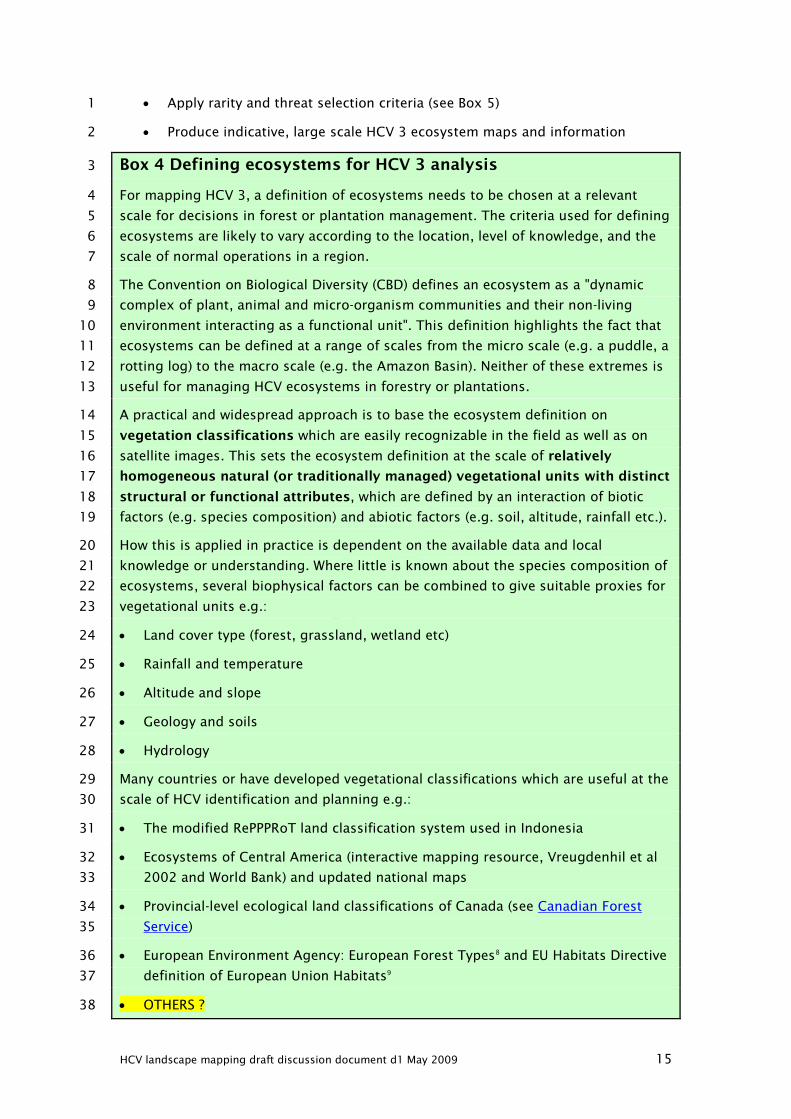
Fig 3: Key data for HCV 3 mapping in the Western Plains and Mountains of West 2
Kalimantan, Indonesia (the area highlighted in pink in Fig 1). Left, Forest cover: Past 3
(earliest Landsat images, 1973); – light and medium green. Present (2008) – dark green. 4
(For projected future cover, see Fig 4). Right, the region’s ecosystems mapped following 5
the government’s RePPProt classification, modified for the Indonesian Toolkit. 6
7
8
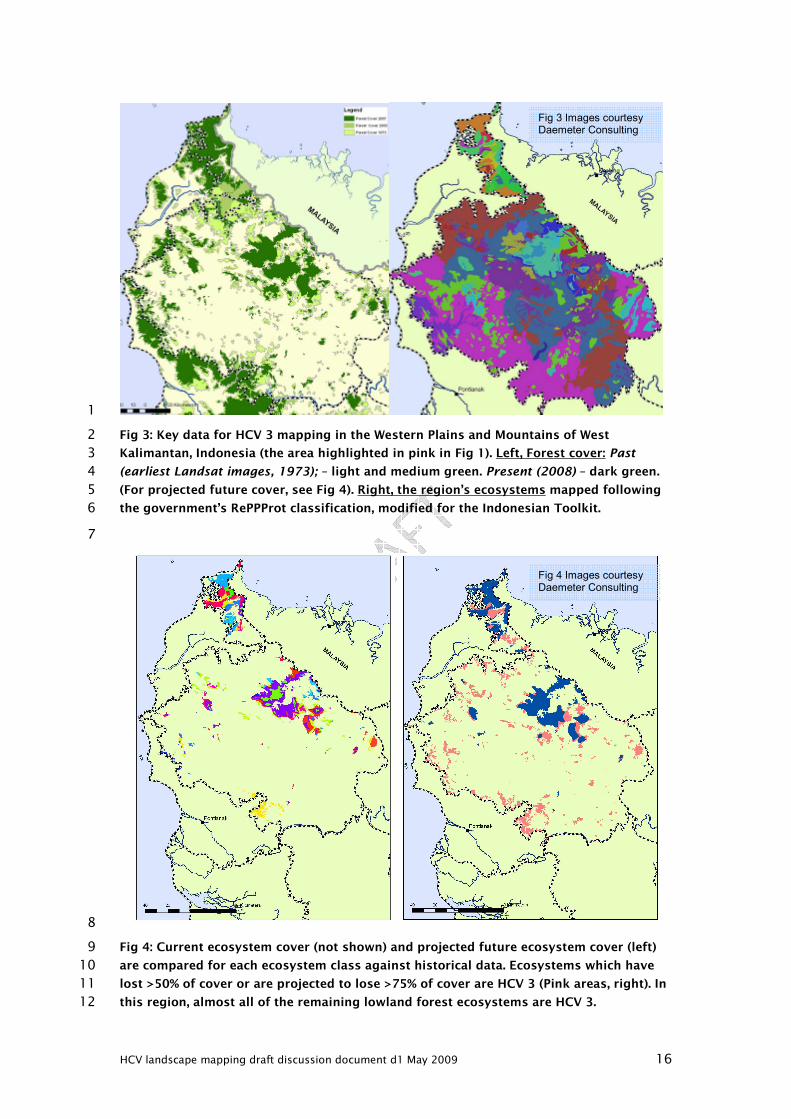
Fig 4: Current ecosystem cover (not shown) and projected future ecosystem cover (left) 9
are compared for each ecosystem class against historical data. Ecosystems which have 10
lost >50% of cover or are projected to lose >75% of cover are HCV 3 (Pink areas, right). In 11
this region, almost all of the remaining lowland forest ecosystems are HCV 3. 12
Fig 3 Images courtesy Daemeter Consulting
Fig 4 Images courtesy Daemeter Consulting

HCV landscape mapping draft discussion document d1 May 2009 17
1
Box 5 Possible criteria for identifying HCV 3 ecosystems 2
• Pre-existing definitions of priority ecosystems: explicit identification and 3
descriptions of endangered ecosystems in an existing, nationally or regionally 4
supported priority list/map. 5
• HCV3 rarity criteria: irrespective of threats or losses, HCV classification based 6
on an agreed critical threshold of extent (e.g. ecosystems constituting < 5% of 7
remaining natural vegetation are considered rare in the Indonesian National HCV 8
toolkit). 9
• HCV 3 threat criteria: A range of possible criteria may be used for defining 10
endangered ecosystems including: 11
- Actual, area-based loss of cover against an agreed baseline, with critical 12
thresholds set by % losses (e.g. 70% loss against pre-industrial extent) 13
- Actual extent being less than a given representational target (e.g. one set by 14
a systematic conservation plan – see Box 6) 15
- Combination of rarity/threat, quality of remaining examples, and existing 16
levels of protection within protected area network: a) quantitative measures or b) 17
qualitative e.g. a simple matrix of habitat vs. protection levels. 18
- Trend for rapid loss in recent years (e.g. 10 years) 19
- OTHER 20
21
Notes on the decision process for HCV 3 identification: 22
Factors which tend to raise the importance of individual ecosystems and make them 23
more likely to be considered HCV 3 include: 24
• Poor or partial representation within protected areas in the ‘wider landscape’ 25
• Representation within ineffectively managed protected areas (‘paper parks’) i.e. 26
where habitat loss is continuing 27
• High degree of fragmentation relative to original extent 28
• Uniqueness or low replication in the landscape (i.e. ecosystem is known from one 29
or a very few examples) 30
• Known land development plans threatening future large losses 31

HCV landscape mapping draft discussion document d1 May 2009 18
Frequently asked questions on HCV 3 mapping: 1
Is the aim to provide a definitive map at this stage? 2
The aim at this stage is to provide an indicative map of potential HCVs. The 3
resolution available for large-scale mapping is usually too coarse for site level 4
planning. Once you know what the critical ecosystems are within the wider 5
landscape, these can be mapped more accurately within the management unit. 6
How accurate does the landscape mapping of an HCV 3 ecosystem need to be? 7
The scale for such mapping should ideally be 1:250,000 or better (resolution of 8
125m). A scale of 1:20,000 (10m resolution) or better is more appropriate for 9
management unit planning (Mapping should have sufficient accuracy that ecosystem 10
boundaries can be recognised at the scale of the management unit). 11
How should we deal with highly fragmented examples of a threatened 12
ecosystem at the mapping stage? Can we eliminate non-viable fragments e.g. 13
below a minimum size threshold? 14
All identified fragments of HCV 3 ecosystems should be mapped. Ecosystem viability 15
or functionality should be considered at the management stage, and management 16
prescriptions for fragmented ecosystems fragments will be context dependent (see 17
section 7). 18
Can we directly use existing bioregional conservation plans, and if so, what are 19
the minimum quality requirements? 20
Many countries have conducted formal systematic conservation assessments (see 21
Box 6) either to design protected area networks from scratch, or to complement 22
existing national parks with additional reserves and other conservation measures. 23
Building on bioregional conservation plans is highly encouraged, where these plans 24
remain up to date and relevant. It is important to use plans that deliver detailed 25
recommendations at the right sort of scale (see section 4) and have widespread 26
support from national institutions, and to integrate biodiversity recommendations 27
generated by such plans with community engagement processes. 28
How do you proceed in the absence of comprehensive supporting data or a 29
recognized national process? 30
Regional systematic conservation assessments are usually beyond the scope of land 31
management companies acting alone. However, it is important to remember that 32
whatever assessment is carried out, it must provide a robust justification for why a 33
given feature has, or has not been considered HCV. This must be done with 34
relevance to the landscape context as described here. By using up to date maps and 35
current knowledge, consulting widely on outputs and management plans, and 36
employing a precautionary approach, it is possible to ensure that HCVs are managed 37
effectively within land management units. 38
39
40

HCV landscape mapping draft discussion document d1 May 2009 19
Box 6 Links between HCV management and national conservation 1
strategies 2
National parks, wildlife reserves and other protected areas are principal tools for 3
implementing national biodiversity conservation strategies. In theory, protected area 4
networks should be designed using a systematic conservation assessment process. 5
Conservation assessment (also called systematic conservation planning - SCP) is the 6
scientific discipline of selecting reserves in such a way that they represent or sample 7
the full variety of biodiversity (the principle of representativeness), and ensure the 8
long-term survival of species (the principle of persistence) by maintaining natural 9
processes and viable populations and by excluding threats. There is a large scientific 10
literature on conservation assessment, some of which may be very useful for land 11
use planners and HCV assessment teams. 12
Protected area networks in fact were often planned in an ad-hoc way and often do 13
not adequately protect the full range of species and ecosystems, which is one reason 14
that sustainability standards require HCVs to be maintained within production areas. 15
The purpose of the HCV process is not to set up protected areas (although set-asides 16
are an important part of many HCV management plans); however, identifying and 17
managing HCVs at the Management Unit with due regard for the basic principles of 18
conservation planning can allow industry to contribute to provincial or national 19
conservation ambitions, in a way that complements the national protected area 20
network. 21
22

HCV landscape mapping draft discussion document d1 May 2009 20
5.2. Mapping HCV 1 at large scales 1
HCV 1: Areas containing globally, regionally or nationally significant concentrations 2
of biodiversity values (e.g. endemism, endangered species, refugia) 3
Purpose of analysis: 4
• To identify which areas potentially support ‘concentrations of biodiversity 5
values’. 6
• To assess which species are not adequately protected by maintaining HCV 3 7
(rare/threatened ecosystems) 8
• To identify key additional sites which need to be managed to preserve these 9
biodiversity values 10
Output: 11
Maps and supporting descriptions of suitable habitat for significant biodiversity 12
values not captured by HCV 3 ecosystem analysis. 13
Suggested process for HCV1 mapping: 14
• Map concentrations of biodiversity (HCV 1.2, 1.3, 1.4 – see below) 15
• Overlay HCV3 (ecosystems) and protected areas (HCV 1.1) 16
• Gap analysis for area-based species conservation priorities. 17
Sections below deal with HCV 1 mapping, numbered as in the HCV Toolkits. 18
5.2.1. Mapping HCV 1.1 - Protected areas 19
Process: Mapping of Protected Area boundaries should be relatively straightforward; 20
consideration should also be given to mapping legally mandated buffer zones (where 21
certain activities are prohibited). 22
Protected areas include any area designated by national or international law primarily 23
for conservation; categories of protected areas are normally listed in national 24
interpretations of HCV toolkits. 25
5.2.2. Mapping HCV 1.2 - Threatened and endangered species, 26
and HCV 1.3 - Endemic species: 27
The aim of mapping at the large scale should be to identify areas of habitat which 28
could potentially support individuals or populations of HCV species, or which are 29
potentially required for a part of wide-ranging species’ lifecycle. 30
It is important to remember that HCV 1 is concerned with significant 31
concentrations of biodiversity. In some cases this may mean the presence of a 32
single, nationally iconic species (see Figure 5), but in most cases it means areas 33
where there are several or many rare or threatened species. Most Toolkits give some 34
guidance as to how to interpret 'concentrations'; in practice, mapping HCV 1.2 and 35

HCV landscape mapping draft discussion document d1 May 2009 21
1.3 results in a habitat prioritisation exercise (usually highlighting areas where RTE 1
species distributions overlap), supported by a reasoned argument for the 2
prioritisation process (see Box 7). 3
Most HCV Toolkits consider that rare, threatened or endangered (RTE) species are 4
those which are listed as Vulnerable, Endangered or Critical on the IUCN international 5
or regional Red Lists, or which are protected under national law. Some toolkits (e.g. 6
Indonesia) consider Critically Endangered species separately from Endangered or 7
endemic species. The majority of rare or endangered species are associated with rare 8
or threatened ecosystems (HCV 3), and protecting these will normally protect most 9
HCV 1 species. Exceptions are mentioned below. 10
If habitats suitable for concentrations of biodiversity are thought to be present within 11
the Management Unit, these areas of habitat will need to be ground-truthed at the 12
site level. 13
Suggested process for mapping HCV 1.2 and HCV 1.3: 14
• Map known locations/distributions of a selection of well known endangered 15
species (e.g. umbrella species and iconic species), and endemic species of 16
restricted range. 17
• Map land cover and existing areas of natural vegetation (as for HCV 3) 18
• Identify suitable habitat for key species of concern, as far as is known 19
• Apply prioritisation criteria (see box 7) 20
• Produce indicative, large scale maps of habitat supporting HCV 1 species. 21
22
In practice, species distribution data may not be sufficient to map or prioritise 23
potential HCV 1 habitat with any real accuracy. In that case, a reasonable proxy 24
would be to do it through expert discussion, supported by appropriate existing 25
initiatives e.g.: 26
• pre-defined site selection criteria (e.g. AZE sites, Important Bird Areas, Important 27
Plant Areas, Key Biodiversity Areas... other useful schemes?) 28
• Work of regional conservation priority setting workshops 29
30
It is important to note that mapping RTE species distributions and potential HCV 1 31
habitats is NOT the same as identifying the area needed to maintain or enhance that 32
value. For that you need to set conservation targets to support viable populations 33
(see section 7). 34

HCV landscape mapping draft discussion document d1 May 2009 22
1
Box 7: Possible criteria for identifying 'concentrations of 2
biodiversity' (HCV 1.2, 1.3): 3
Numerical criticality thresholds as per National HCV Toolkits – e.g.: 4
• Presence of one or more individuals of IUCN red list critical (CR) species 5
• Presence of X nationally protected, red-listed or endemic species 6
• Presence of Y% or more of the nationally red-listed forest-dependent primates 7
Habitat types/features specifically identified in National HCV Toolkits 8
Area-based population viability criteria (combined with the above): 9
• How do we apply this in practice? 10
Habitat threat criteria as per HCV 3 analysis e.g.: 11
• Current area-based % habitat losses relative to a defined baseline 12
• Potential future % habitat losses based on land use plans and/or current trends 13
14
15
Fig 5: Woodland Caribou distribution and habitat quality in the Western Alberta Upland 16
Ecoregion. Canada's forest-dwelling woodland caribou are classed as threatened under 17
the federal Species At Risk Act (SARA). This emblematic species depends on intact 18
forested ecosystems and is a key indicator of the health of Canada's boreal forest. 19
Distribution of caribou herds (cross-hatched area, left) is overlain with suitable habitat 20
indicators (right), to inform decisions on areas suitable to support viable populations 21
(see also section 7). 22
Fig 5 Images courtesy Conservation Biology Institute
HCV landscape mapping draft discussion document d1 May 2009 23
HCV 1 species requiring specific additional analysis 1
There are two broad types of HCV 1 species which may not be adequately be 2
protected by maintaining threatened ecosystems (HCV 3), and which may therefore 3
need additional management: 4
Wide ranging-species with broad habitat requirements 5
Some species (such as many large carnivores) roam over large areas and can utilize 6
or travel through many types of habitat including good quality or degraded natural 7
vegetation, plantations, and agricultural areas. Threats to these species may come 8
from other sources than habitat loss (e.g. hunting and poaching, egg collection). 9
Some of these species do have certain habitat requirements for part of their life-cycle 10
(e.g. undisturbed areas required to breed successfully, or particular preferred 11
hunting grounds). 12
Where such species are likely to occur, their presence should be indicated across the 13
whole area, and critical habitat e.g. feeding or breeding should be mapped. It is 14
likely that such species will require other conservation measures for their continued 15
survival e.g. community-based management or initiatives to reduce hunting 16
pressure. 17
Species requiring habitats that are too localized to be detected at the landscape 18
level: 19
This category may include e.g. endemic species, occurring in habitats of very 20
restricted extent. Habitat suitable to support populations of such species should be 21
assessed at the site level. 22
5.2.3. Mapping HCV 1.4 - Critical temporal use 23
Many species congregate in specific resting or feeding areas either on a daily basis 24
(e.g. roosting caves for bats), on a regular, seasonal or annual basis (e.g. wetlands 25
and other key feeding areas for migrating birds, salt licks for elephants), or at 26
irregular intervals (unpredictable but vital fruiting trees and groves for many 27
primates in tropical rainforest). Migration routes and wetlands are usually well-known 28
and can be mapped at large scales, but other key areas such as bat caves or 29
keystone fruiting trees should be identified though expert input, local consultation 30
and/or traditional knowledge, and mapped at the site level. 31

HCV landscape mapping draft discussion document d1 May 2009 24
1
5.3. Mapping HCV 2 2
HCV 2: Globally, regionally or nationally significant large landscape-level areas 3
where viable populations of most if not all naturally occurring species exist in 4
natural patterns of distribution and abundance. 5
HCV 2 is the only HCV that is defined as a landscape level value in itself. Guidelines 6
on identifying/mapping HCV 2 have been given in the original HCV Toolkit (2003) 7
and the ‘Good Practice Guidelines for practitioners and assessors’ (2008). 8
Feedback from the HCV Resource Network members is needed to clarify the 9
application the HCV 2 concept for effective conservation management. Clearly, large 10
landscape level forests are amongst the most important, relatively undisturbed 11
natural ecosystems on the planet. However, there is some debate about how to use 12
the HCV 2 concept within sustainable forest management/land use planning, as it 13
remains unclear whether its function is to protect: 14
• wilderness ‘intactness’ values (are these strictly speaking social rather than 15
biological values?), 16
• large scale functionality of vast natural ecosystems, or 17
• sensitive and wide ranging species (should this be handled under HCV 1)? 18
There is also an ongoing debate about what management operations are compatible 19
with HCV2. Several conservation groups advocate no operations whatsoever in large, 20
landscape forests. In some tropical forests, it has been argued that well managed, 21
low impact logging combined with good hunting controls are compatible with 22
maintaining HCV2 values. In many boreal forests, where clear-felling over areas of 23
many hectares is the norm, there are valid arguments for strong restrictions on 24
logging operations in HCV 2 forests, but some have argued that operations 25
mimicking the large scale natural disturbance regime (e.g. large fires) of boreal 26
forests are in fact compatible with this value. 27
HCV 2 has sometimes been used within HCV assessments as a “pigeonhole” for a 28
landscape-level assessment. In this context, it does serve an extremely useful 29
purpose i.e. it obliges the assessor to consider the wider landscape. However, the 30
approach argued here is that a landscape analysis underpins all the detailed HCV 31
assessments. 32
Within a forest management context, has the identification of HCV 2 been used 33
effectively to reduce the impact of logging operations and forest fragmentation 34
effects? 35
If HCV 2 is intended to protect ecosystems which are undisturbed by human beings, 36
does the concept make sense outside of forest ecosystems? For example, many large 37
ecosystems such as highly biodiverse grasslands have been moulded by centuries or 38
millennia of human intervention, including fire-setting. 39

HCV landscape mapping draft discussion document d1 May 2009 25
Has the practical application of the HCV 2 concept by land use managers yielded 1
good examples of actual conservation benefits, which would not have occurred 2
otherwise or been covered by the other HCV categories? 3
Is it likely that this concept will yield actual conservation benefits if it is applied in 4
areas which have been zoned for conversion to plantations, rather than that of 5
sustainable forest management? 6

HCV landscape mapping draft discussion document d1 May 2009 26
6. Identification and large scale mapping of social 1
HCVs (HCV 4, 5, 6: ecosystem services, social 2
and cultural values) 3
Recognising that much of the mapping for social/cultural HCV management, 4
especially HCVs 5 and 6, must be done at the site level through participatory 5
processes, this section considers what elements of social HCVs have a landscape 6
component or can be mapped usefully at a landscape level. 7
6.1. Mapping HCV 4 at large scales 8
HCV 4: Areas that provide basic ecosystem services in critical situations 9
• HCV 4.1 Areas critical to water catchments 10
• HCV 4.2 Areas critical to erosion control 11
• HCV 4.3 Areas providing critical barriers to destructive fire. 12
• …Other (e.g. pollination services, fisheries, destructive wind…) 13
14
HCV 4 is considered a part of the human or social conservation values as it carries an 15
implication that the services are critical to someone – a village, community or social 16
group. In some cases, the ecosystem service may be considered critical for the long-17
term sustainable commercial use of the land, e.g. erosion of soils due to 18
inappropriately sited plantations may not necessarily directly or critically impact 19
human populations, but may severely damage the economic viability of the operation 20
and preclude further productive land use if the operator abandons the area, 21
including preventing a return to traditional use by local communities, or effective 22
ecosystem restoration. 23
Purpose of analysis: 24
• To identify potential ecosystem services existing in the regional context 25
• To identify which of these services are potentially present in the management 26
unit, and which may be shared across the ‘wider landscape’ containing the 27
management unit. 28
Output: 29
Indicative maps of HCV 4 in the wider landscape, providing context for Management 30
Unit-level assessment. 31

HCV landscape mapping draft discussion document d1 May 2009 27
Suggested process for mapping HCV 4: 1
• Establish critical risk criteria (e.g. fragile soil types, slope limits for operations, 2
watershed protection legislation) based on national standards, local consultation 3
and expert knowledge. 4
• Map the factors defining potential HCV 4 areas: 5
− Geophysical, topographic and landcover data as per HCV 3 6
− National critical watershed maps, indicators and guidance 7
− National erosion risk maps, indicators and guidance 8
− National fire risk/fire incidence maps 9
− Other natural hazards 10
− Villages and other settlements 11
− Critical infrastructure (such as major transport routes, reservoirs, 12
hydroelectric dams etc) 13
• Establish area-based management requirements for critical risks 14
• Mapping: combined risk factors and area-based management requirements. 15
HCV 4 areas tend to be localized. In practice, mapping of erosion risk (HCV 4.2), 16
should be done at the scale of the management unit, and HCV 4.1 and 4.3 at a 17
slightly larger scale and with due consideration for communities downstream of the 18
management unit, in particular those whose drinking water may be affected by 19
pollution, sedimentation or other consequences of careless waste and water 20
management. 21

HCV landscape mapping draft discussion document d1 May 2009 28
1
6.2. Mapping HCV 5 and HCV 6 at large scales 2
HCV 5: Areas fundamental to meeting basic needs of local communities 3
and 4
HCV 6: Areas critical to local communities’ traditional cultural identity (areas of 5
cultural, ecological, economic or religious significance identified in cooperation with 6
such local communities) 7
8
Purpose of analysis: 9
• To identify large-scale patterns of human settlement and land use in the regional 10
context 11
• To identify groups and local communities which are present in the management 12
unit, or may potentially be affected by containing the management unit 13
• To aid assessors in preparing a local consultation plan including preliminary 14
selection of key communities likely to be affected by management operations 15
and team selection for the necessary social assessment and engagement process. 16
Output: 17
Indicative maps of communities, social group characteristics, and land use, providing 18
context for Management Unit-level assessment. 19
20
Suggested process for mapping HCV 5 and 6 at large scales: 21
• Preliminary or exploratory mapping of large-scale data (see Box 8) , specifically to 22
aid community sampling decisions 23
• Site-level sampling of a subset of representative communities for understanding 24
typical land use patterns, livelihoods, areas of activity and culturally important 25
features 26
• Indicative mapping of potential HCV 5 and 6 (using e.g. land use radii and key 27
landscape features such as natural ecosystems used to provide goods and 28
services) based on explicit assumptions gained from community sampling 29
Social HCV maps developed in this way should be seen as tools for communication 30
and negotiation between land managers and local stakeholders, for developing 31
participatory management schemes, and for ongoing social engagement processes. 32
These maps should also be linked to HCV 1, 2, 3, 4 to identify areas and values 33
which are likely to come under pressure either from existing activities or from 34
potential displacement of activities due to development. 35
36

HCV landscape mapping draft discussion document d1 May 2009 29
Box 8 large scale data for HCV 5 and 6 preliminary mapping. 1
The information that can be gathered about social and cultural HCVs at the large scale is very 2
limited and should only be considered a preliminary step to a full local consultation process. 3
Useful data may include: 4
Populations and infrastructure: 5
Settlements 6
Population density indicators 7
Roads, bridges etc. 8
Political and administrative boundaries 9
Land ownership? 10
Population characteristics: 11
Ethnicity/language groups 12
Traditional cultural/land use practices? 13
Income and livelihoods (indicators?) 14
Indicative community land use radii? 15

HCV landscape mapping draft discussion document d1 May 2009 30
7. Mapping HCVs and HCV management areas at 1
the site level 2
7.1. Mapping HCVs in detail at the site level 3
What processes are needed to verify the presence of HCVs identified at the 4
landscape level? 5
Site-level assessment techniques have been discussed in detail in recent guidance 6
(i.e. Good Practice Guidance 2008) and in a number of national HCV toolkits. Do we 7
need to improve or update this guidance to take account of conceptual progress or 8
insufficient coverage of some HCVs? Does the HCV Network need to produce, adopt 9
or endorse a site-level assessment guidance documentation? 10
What does landscape-level data tell us about the actual presence of HCVs? 11
A landscape-level analysis usually gives indications of potential HCVs at a coarse 12
level of resolution, which may be insufficient for management unit level planning. 13
Depending on the quality of data and existing knowledge available, it is usually 14
necessary to conduct a site-level investigation to determine the actual presence and 15
location of HCVs. This may involve further desk studies and discussion of higher-16
resolution data at the site level, and an element of fieldwork. 17
Even if excellent biological or ecological data are necessary at the right spatial scale 18
within the management unit, if social HCVs are likely to occur, site level assessment 19
to determine those values and map the associated management areas will usually be 20
necessary. 21
What data resolution is required to delineate different HCVs at the site level? 22
23
How do we communicate the outcomes? 24
Maps should be understood to be tools for communication, negotiation and 25
planning, rather than an end goal. How do we ensure that maps of potential HCVs 26
are clearly identified as such and are not misused? 27
Do the answers to these questions differ between land use scenarios? 28
29
7.2. Delineating HCV management areas 30
The aim of an HCV management plan should be to maintain or enhance all the HCVs 31
identified within the Management Unit, and within the wider landscape so far as 32
management influence allows. This normally requires maps of the areas which need 33
to be managed in specific ways. 34
HCV management prescriptions, and HCV management areas where these 35
prescriptions are applied, will depend on a combination of the HCVs present, the 36
HCV landscape mapping draft discussion document d1 May 2009 31
threats to the values (determined by the landscape and local contexts), and the 1
ability and responsibility of the land manager to manage and mitigate these threats. 2
Some values are widespread, whilst others are very localised, and managers will need 3
to consider whether special measures must be applied across the management unit 4
as a whole, or be focused on specific areas. 5
In the following discussion we have treated biological and social HCV separately, in 6
the order previously used. However, effective management of biological values 7
ultimately needs to be integrated with social values. 8
Setting HCV management objectives: 9
For each HCV identified at the landscape and site scale, the land manager needs to 10
set a management objective which fulfils the requirement to maintain or enhance 11
the value. 12
For biological HCVs, this process is a familiar one, corresponding to target setting 13
in systematic conservation assessment, but the principle applies both to social and 14
biological HCVs. Examples of targets include: 15
• Numbers of breeding pairs of a critical species to be maintained in the MU 16
• Number or quality of critical resources (e.g. fruit trees, salt licks, microhabitat 17
patches etc.) required to support healthy populations of dependent species 18
• Area of minimally disturbed ecosystem required to maintain healthy ecosystem 19
functions 20
• Habitat or ecosystem area required to protect watersheds and rivers 21
• Yield of timber products from community-managed forests for domestic use 22
• Area required for village subsistence collection of food, medicines etc. 23
These targets must then be translated into HCV management areas, which may be 24
larger or smaller than the total area within which the HCV actually occurs – e.g. it 25
may be necessary to create buffer zones for fragile habitats (HCV management area 26
larger than the habitat itself) – or simply to manage key resources (e.g. roosting 27
sites) for wide ranging animals (HCV management area smaller than the range of the 28
species); 29
30
7.3. HCV management areas and management targets 31
for HCV 3 32
Management objectives for HCV 3 should bear in mind the CBD definition of an 33
ecosystem as a dynamic complex of plant, animal and micro-organism communities 34
and their non-living environment interacting as a functional unit. The objective of 35
HCV 3 management should therefore be 36
• to preserve the range of species which characterise that ecosystem, and 37
• to maintain or restore the ecosystem’s functionality (Box 9). 38

HCV landscape mapping draft discussion document d1 May 2009 32
If an ecosystem is identified as HCV 3, by definition every remaining area is of great 1
significance. The default management target should be that 100% of HCV 3 areas are 2
preserved (see examples below of how to proceed if this is not a viable strategy). 3
4
Box 9: What do we mean by ecosystem functionality in a 5
management context? 6
Ecosystems are characterised by communities of species and their physical environment. 7
Ecosystem functions are the higher-order processes which result from the complex 8
interactions of the living and non-living components, for example: 9
• regulation of the water and nutrient cycles, 10
• soil fertility, 11
• primary production (related to timber yield in forests), 12
• secondary production (related to the regenerative capacity of animal populations), 13
• mutual dependencies between species (e.g. pollination and fruit dispersal mechanisms), 14
• species composition and successional patterns. 15
Depending on its characteristics (e.g. fragility or resilience) and if responsibly managed, a 16
healthy ecosystem may be exploited to provide a sustainable flow of goods and services whilst 17
maintaining its functionality. 18
19
HCV 3 management areas for natural forest management: 20
In the context of forestry, some HCV 3 ecosystems may be subject to extractive 21
management, so long as operations do not threaten the viability of the constituent 22
species populations or the functionality of the assemblage as a whole (see box). In 23
practice this often means that representative areas of HCV 3 ecosystems should be 24
set aside for complete protection (representational conservation is also a 25
requirement of FSC Principle 6), and that if any operations are carried out in HCV 3 26
ecosystems these should be low-impact, and carefully monitored for adverse effects. 27
If HCV 3 ecosystems within a forestry context are believed to be fragile or 28
particularly susceptible to disturbance (E.g. some aquatic ecosystems are particularly 29
susceptible to siltation and pollution), extractive uses may not be appropriate, and it 30
may be necessary to create and appropriately manage buffers, in which case the HCV 31
management area will be larger than the HCV 3 ecosystem. 32
HCV 3 management areas in the context of conversion 33
If HCV 3 ecosystems are identified within an area of existing natural or traditionally 34
managed vegetation which is scheduled for conversion, the appropriate management 35
area for HCV 3 ecosystems may need to extend beyond the boundaries of the 36
identified ecosystem e.g. include a buffer zone of natural vegetation or managed 37
forest, as ecosystem functionality may be compromised by edge effects. The extent 38
and configuration of appropriate buffer zones needs to be defined in consultation 39

HCV landscape mapping draft discussion document d1 May 2009 33
with appropriate experts and should consider opportunities for community activities 1
within the buffer zones and the HCV ecosystem itself, which are compatible with the 2
conservation objectives. 3
Conservation of degraded or fragmented HCV 3 ecosystems 4
In many cases HCV 3 ecosystems within existing landscapes occur as highly 5
degraded and/or fragmented remnants of a previously much more extensive 6
ecosystem, which has been converted through decades or centuries of human 7
activities. The ecosystem functionality in this case may already have been severely 8
compromised by fragmentation. However, these fragments are often extremely 9
significant for biodiversity: for example, the Atlantic Forest of Brazil is extremely 10
fragmented and covers only 7% of its historical range; the remaining fragments 11
support 8,000 species of endemic plants (40% of the total species), 567 species of 12
endemic vertebrates (42% of the total species), and nearly ¾ of Brazil’s recognized 13
threatened species in total. 14
When planning plantations in an area where HCV 3 fragments exist, the baseline 15
policy should be not to convert any fragments of HCV 3 ecosystem of any size, 16
mapped to the best available resolution. A holistic conservation plan should be 17
developed to preserve the fragments, halt the processes leading to their degradation 18
or destruction, and aim to restore or the functionality of the ecosystem so that its 19
long-term persistence is assured (see also Annex 3). This is likely to require the 20
specialist skills of a trained landscape ecologist and the voluntary and long-term 21
participation of local communities, obtained and maintained through a community 22
engagement process. 23

HCV landscape mapping draft discussion document d1 May 2009 34
7.4. HCV management areas and management targets 1
for HCV 1 2
Species-specific conservation measures should be aim to maintain or enhance the 3
population viability of the species in question. Targets for habitat conservation 4
should be set with this objective in mind. Management of HCV 1 is strongly linked to 5
HCV 3 and should be planned in conjunction with the HCV 3 approach previously 6
outlined. 7
• The default assumption should be that 100% of the suitable habitat for HCV 1 8
species should be preserved, including suitable buffer zones if management is 9
likely to create disturbance. 10
• Where this is not feasible, a quantitative target for suitable habitat should be 11
produced, based on an understanding of minimum viable populations (see Box 12
10) and with a precautionary safety margin to ensure persistence of the species. 13
• Any decision to convert habitat suitable for HCV 1 species should be taken as a 14
last resort when other options are demonstrably not feasible. Opportunities 15
should be sought to restore and safeguard other areas which will maintain or 16
enhance the species (see Fig 6 and Annex 3), and these should be documented 17
and justified as part of a knowledge-based, integrated conservation plan, 18
Within FSC certification for forest management, these HCV 1 management areas may 19
be combined with the FSC’s requirement for preserving representative areas of 20
natural ecosystems. 21
Special cases of HCV 1 management 22
Additional consideration should be given to managing species which are not closely 23
tied to HCV 3 habitats i.e.: 24
• wide ranging species with broad habitat requirements, 25
• species associated with small scale ecosystems (‘micro-habitats’). 26
Wide ranging species: 27
HCV management for wide-ranging species will likely rest on the conservation of 28
suitable key resources and habitat areas, using the HCV 3 conservation areas as a 29
core (if HCV 3 is present in the Management Unit) and supplementing these with 30
areas of representative natural vegetation which are managed for conservation 31
purposes (e.g. as set-asides, low-impact harvesting areas or for carefully managed 32
community use). 33
Where typical management units are not large enough to support viable populations 34
of large, wide-ranging animals, effective conservation of such populations depends 35
on the actions of the MU’s neighbours in the landscape. Managers should seek to 36
cooperate with their neighbours in coordinating management measures for such 37
species. If there is a regional or national conservation plan for the species of 38

HCV landscape mapping draft discussion document d1 May 2009 35
concern, managers should seek to integrate management measures with the 1
recommendations of that plan. 2
Species associated with ‘micro-habitats’ in the management unit. 3
Many species have specific, small scale habitat requirements and low dispersal rates, 4
which makes them vulnerable to being overlooked in HCV assessments which focus 5
on broad habitat types. Often these species are endemic or range restricted – many 6
frogs, freshwater fish and invertebrates fall into this category. Microhabitats may be 7
associated with HCV 3 ecosystems or may occur sporadically throughout more 8
widespread habitat types. 9
Conservation of these species depends on their recognition and an understanding of 10
the suitable microhabitats. These should be identified by competent biologists 11
during site level investigation. In the context of forestry, suitable habitat for localised 12
or range-restricted species can be added to representative areas for conservation (as 13
required by FSC). 14
15
Box 10: Maintaining viable populations of species in a production 16
landscape matrix 17
Conservationists have devoted great effort to understanding how to define and maintain viable 18
populations of threatened species. The question for conservation management often boils 19
down to ‘how much is enough’ i.e., what is the minimum area of natural habitat required to 20
ensure that a population persists indefinitely? Ideally, an indication of the population that the 21
management unit can support may be obtained from existing literature or through 22
consultation with an expert, in order to make a scientifically justified selection of HCV 1 areas. 23
Individual management units may not support viable populations of larger animals, but may 24
play a vital role as part of a larger habitat matrix. The appropriate question for land use 25
managers is then ‘how much suitable habitat should be managed specifically for threatened 26
species within the management unit, so that they can persist across the wider landscape’? In 27
this case targets should be set based on the total viable population, and what proportion of 28
that should be maintained in the MU: for example, if the entire landscape can support an 29
estimated 400 individuals and the management unit corresponds to 5% of the area, then the 30
MU should aim to support 20 individuals. 31
Setting area targets to maintain viable populations requires a good understanding of species 32
characteristics, and so can only be applied rigorously for a few well-studied species. Managers 33
need to consult the appropriate species specialists and use a precautionary approach 34
35
36
37
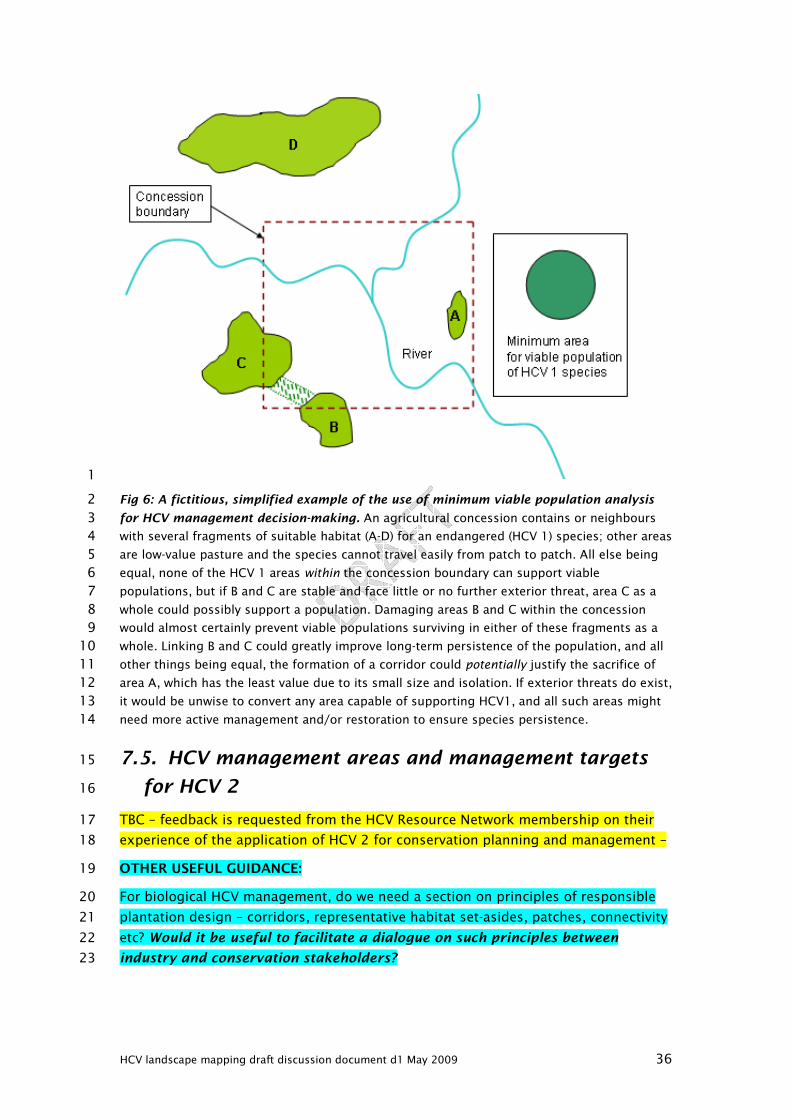
HCV landscape mapping draft discussion document d1 May 2009 36
1
Fig 6: A fictitious, simplified example of the use of minimum viable population analysis 2
for HCV management decision-making. An agricultural concession contains or neighbours 3
with several fragments of suitable habitat (A-D) for an endangered (HCV 1) species; other areas 4
are low-value pasture and the species cannot travel easily from patch to patch. All else being 5
equal, none of the HCV 1 areas within the concession boundary can support viable 6
populations, but if B and C are stable and face little or no further exterior threat, area C as a 7
whole could possibly support a population. Damaging areas B and C within the concession 8
would almost certainly prevent viable populations surviving in either of these fragments as a 9
whole. Linking B and C could greatly improve long-term persistence of the population, and all 10
other things being equal, the formation of a corridor could potentially justify the sacrifice of 11
area A, which has the least value due to its small size and isolation. If exterior threats do exist, 12
it would be unwise to convert any area capable of supporting HCV1, and all such areas might 13
need more active management and/or restoration to ensure species persistence. 14
7.5. HCV management areas and management targets 15
for HCV 2 16
TBC – feedback is requested from the HCV Resource Network membership on their 17
experience of the application of HCV 2 for conservation planning and management – 18
OTHER USEFUL GUIDANCE: 19
For biological HCV management, do we need a section on principles of responsible 20
plantation design – corridors, representative habitat set-asides, patches, connectivity 21
etc? Would it be useful to facilitate a dialogue on such principles between 22
industry and conservation stakeholders? 23
HCV landscape mapping draft discussion document d1 May 2009 37
7.6. HCV management areas for social HCVs (4, 5, 6) 1
For social HCVs and especially HCVs 5 and 6, management decisions should be 2
discussed with the affected communities, and maps of potential community use 3
areas or cultural sites should be drawn up and agreed using participatory field 4
methods. Any decisions should be made with the free, prior and informed consent 5
(FPIC) of parties involved. 6
The issues to consider in regards to management options of HCV 5 & 6 include: 7
• Reversibility – This not only includes physical reversibility of the operations, but 8
also with regards to potential changes in responsibility for managed areas. E.g. 9
what happens if the company sells or abandons a concession? Whose 10
responsibility will it be to ensure that what is agreed as a management decision 11
is continued? 12
• Dependency – Will the management options put forward cause the communities 13
to become dependent on the management organisation or company to fulfil their 14
basic needs? This is particularly critical when scheduled conversion is likely to 15
change the landscape significantly. 16
• Appropriate substitution – If a management prescription is to substitute the 17
HCV identified with other options – these need be appropriate. E.g.: is it 18
appropriate to substitute the provision of medicinal plants for traditional healing 19
with free medicine? With a local clinic? With cash payments? 20
• Mitigation – management options only specify what needs to be done to ensure 21
that identified HCVs are maintained – what happens when the agreed 22
management options is not sufficient (especially HCV 5)? E.g. a management 23
prescription to leave a corridor for wildlife, theoretically meaning that sources of 24
bush meat are maintained – what happens if even with the corridor, the wildlife 25
all but disappears from the area? 26
27
What further sources do we need to include for appropriate social 28
methodologies? Do we need to promote a stakeholder dialogue on the issue of 29
social HCV management? If so, what process should we follow? 30
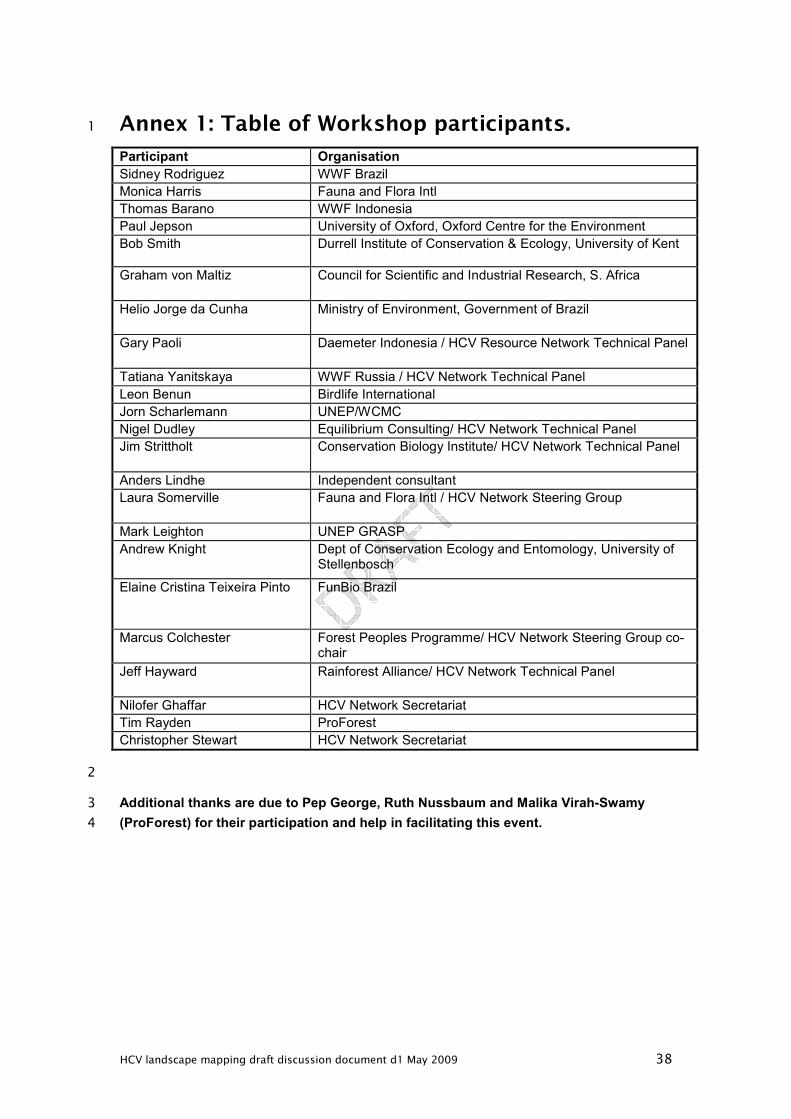
HCV landscape mapping draft discussion document d1 May 2009 38
Annex 1: Table of Workshop participants. 1
Participant Organisation
Sidney Rodriguez WWF Brazil
Monica Harris Fauna and Flora Intl
Thomas Barano WWF Indonesia
Paul Jepson University of Oxford, Oxford Centre for the Environment
Bob Smith Durrell Institute of Conservation & Ecology, University of Kent
Graham von Maltiz Council for Scientific and Industrial Research, S. Africa
Helio Jorge da Cunha Ministry of Environment, Government of Brazil
Gary Paoli Daemeter Indonesia / HCV Resource Network Technical Panel
Tatiana Yanitskaya WWF Russia / HCV Network Technical Panel
Leon Benun Birdlife International
Jorn Scharlemann UNEP/WCMC
Nigel Dudley Equilibrium Consulting/ HCV Network Technical Panel
Jim Strittholt Conservation Biology Institute/ HCV Network Technical Panel
Anders Lindhe Independent consultant
Laura Somerville Fauna and Flora Intl / HCV Network Steering Group
Mark Leighton UNEP GRASP
Andrew Knight Dept of Conservation Ecology and Entomology, University of Stellenbosch
Elaine Cristina Teixeira Pinto FunBio Brazil
Marcus Colchester Forest Peoples Programme/ HCV Network Steering Group co-chair
Jeff Hayward Rainforest Alliance/ HCV Network Technical Panel
Nilofer Ghaffar HCV Network Secretariat
Tim Rayden ProForest
Christopher Stewart HCV Network Secretariat
2
Additional thanks are due to Pep George, Ruth Nussbaum and Malika Virah-Swamy 3
(ProForest) for their participation and help in facilitating this event. 4

HCV landscape mapping draft discussion document d1 May 2009 39
Annex 2: Criteria for potential impact of 1
operations 2
Criteria are taken from the HCV Resource Network Technical 3
guidance for peer reviews of HCV assessment reports.10 4
Category 1: 5
Large-scale land-use planning (e.g. regional or national level); very high impact 6
operations, involving complete, irreversible alteration of ecosystems/natural 7
vegetation, and potentially very severe impacts to, or even elimination of, any HCVs 8
in the area, e.g.: 9
• Large-scale conversion of natural ecosystems to agriculture or plantations 10
• Large scale operations in highly sensitive/vulnerable ecosystems (e.g. peat 11
swamps) 12
• Operations likely to have an irreversible and damaging impact on vulnerable 13
communities 14
Category 2: 15
High impact operations, involving extensive alterations of the ecosystem or 16
potentially severe impacts on HCVs, which are reversible in the medium to long term 17
and can be mitigated by good management, e.g.: 18
• Small to medium scale conversion of semi-natural/highly degraded ecosystems to 19
agriculture or plantations 20
• Large-scale forest management 21
• Medium-large scale plantations operations in largely agricultural landscapes 22
• Operations likely to affect substantially the livelihoods of communities. 23
Category 3 24
Medium or low impact operations, where alterations to the ecosystems are likely to 25
be minimal, or moderate and localised, and reversible in the medium to short term, 26
e.g.: 27
• Small to medium scale forestry operations in resilient/common forest ecosystems 28
• Small-scale and low intensity community forestry operations 29
• Small scale changes in crops in largely agricultural landscapes 30
31
Note: these examples are not exhaustive and are intended to provide an indication of 32
the likely category of impact. Each case should be considered on its individual 33
characteristics. 34

HCV landscape mapping draft discussion document d1 May 2009 40
Annex 3: HCV 3 and conservation offsets* 1
Conserving, managing and monitoring multiple fragments of HCV 3 ecosystems in a 2
production landscape is likely to present major challenges for land use managers. It 3
may be the case that preserving small, outlying or highly vulnerable HCV fragments 4
is beyond the management capability or resources of the manager. 5
Within the context of a holistic HCV management plan, and if it becomes clear that 6
the cost and effort of managing some HCV 3 fragments outweigh the conservation 7
gains of investing that effort elsewhere, it may be defensible to simplify the 8
management burden by exchanging outlying or very degraded areas for legitimate 9
conservation gains of equal or greater value (i.e. a legitimate conservation offset). 10
Any such process should take into account basic principles of conservation biology, 11
threat considerations and available resources. It should be stressed that 12
‘conservation offsets’ are a last resort, if all other conservation efforts have failed or 13
are irretrievably flawed, and should in no case substitute actions which the manager 14
should undertake as a matter of course as part of HCV management. 15
A legitimate conservation offsetting process might rank the conservation priority of 16
fragmented ecosystems according to the following criteria: 17
• Size 18
• Shape 19
• Ecosystem quality or degradation index 20
• The matrix of neighbouring vegetation 21
• Connection to other fragments via riparian or other natural corridors 22
• Distance to nearest remnant HCV fragment or other natural vegetation areas 23
• Distance to roads, villages or other sources of potential disturbance 24
• To the maximum extent possible, presence and population density of HCV 1 25
species (rare, threatened or endangered species, ranked e.g. in order of their 26
IUCN threat status or their actual threat status in the landscape) 27
Lowest conservation priority should be given to smaller, more disturbed fragments 28
that are isolated from other remnants and embedded in a highly disturbed matrix 29
with little or no possibility for direct or ‘permeable’ connections to other suitable 30
habitat types. Highest conservation priority should be given to larger more intact 31
fragments, especially where there is a possibility for connectivity with other such 32
fragments within or bordering the Management Unit. If a fragment identified under 33
HCV 3 is proposed for conversion on grounds that the conservation value does not 34
justify the effort required, then a specific plan for offsetting this loss by equal or 35
* with thanks to G. Paoli for much of the content of this section.

HCV landscape mapping draft discussion document d1 May 2009 41
greater gains elsewhere in the estate should be developed, and preliminary steps 1
taken to implement the offset prior to converting the fragment. 2
3
Both the proposed conversion of ‘lower-priority’ or ‘un-conservable’ fragments and 4
the process of securing management rights to the proposed offset should follow a 5
process of Free, Prior and Informed Consent (FPIC) with any communities or 6
individuals holding legal or customary rights to that land. The documented 7
justification of this swap should be made publicly available on request. Ideally any 8
proposed swap would be reviewed by an independent third party prior to 9
implementation. 10
Legitimate conservation gains may include one or more of the following: 11
• Increased size of HCV 3 fragments under management 12
• Increased connectivity (e.g. corridors) between higher-priority fragments 13
• Restoration of degraded habitat 14
• Conservation beyond the MU boundaries? 15
…. 16

HCV landscape mapping draft discussion document d1 May 2009 42
References 1
1 Jennings, S. et al. (2003): The High Conservation Value Forest Toolkit. Proforest,
Oxford. http://www.hcvnetwork.org/resources/global-hcv-toolkits
2 A National Interpretation of the High Conservation Value Forest Toolkit for Indonesia
2008. English language version to be available from www.hcvnetwork.org from May
2009.
3 Stewart C. et al. (2008): Good practice guidelines for High Conservation Value
assessments: a practical guide for practitioners and auditors. ProForest, Oxford.
http://www.hcvnetwork.org/resources/folder.2006-09-29.6584228415
4 US Forest Service ecoregions portal: http://www.fs.fed.us/rm/ecoregions/
5 US Environmental Protection Agency Ecoregions Portal:
http://www.epa.gov/wed/pages/ecoregions.htm
6 Canadian Forest Service: Ecological Land Classification of Canada:
http://ecosys.cfl.scf.rncan.gc.ca/classification/intro-classification-eng.asp
7 European Environment Agency: biogeographical regions 2008:
http://dataservice.eea.europa.eu/atlas/viewdata/viewpub.asp?id=3641
8 European Environment Agency classification of European Forest Types:
http://www.eea.europa.eu/publications/technical_report_2006_9
9 EU Habitats Directive portal:
http://ec.europa.eu/environment/nature/legislation/habitatsdirective/index_en.htm
#interpretation . See especially the Interpretation Manual of European Union Habitats
- EU 27, July 2007 10 Reviewing High Conservation Value reports: HCV Resource Network guidance for
peer reviews of HCV assessment reports - Version 1- October 2008.
http://www.hcvnetwork.org/resources/folder.2006-09-29.6584228415