mapping our way - university interscholastic league · mapping our way through ... using scale and...
TRANSCRIPT
Mapping Our Way
through
Maps, Graphs, and Charts Nancy Randolph Morton ISD July 12, 2013 Capital Conference

Overview to Contest The maps, graphs & charts contest is
designed to help students learn to get information from a variety of maps, graphs and charts including world maps, pie charts, bar charts and local area maps. The objective test will measure skills such as using a reference book to locate information, making comparisons, estimating and approximating, using scale and interpreting grid systems, legends and keys.
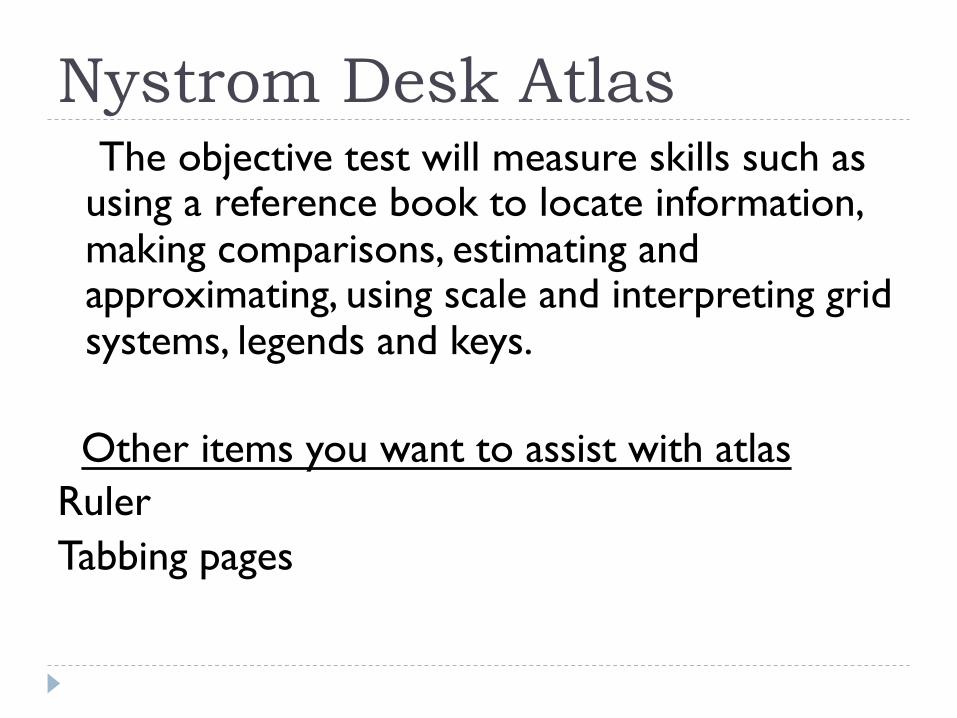
Nystrom Desk Atlas The objective test will measure skills such as
using a reference book to locate information, making comparisons, estimating and approximating, using scale and interpreting grid systems, legends and keys.
Other items you want to assist with atlas Ruler Tabbing pages

Contest Information 1. This contest will consist of two divisions, one for grades 5
and 6 and one for grades 7 and 8.( With the approval of the district executive committee, a district may have separate divisions for each grade.)
2. Students will be given an objective test containing approximately 75 multiple choice, true/false, and fill-in-the-blank questions which must be answered in 45 minutes.
3. Award three points for each correct answer. Deduct two points for each incorrect answer. There shall be no
deduction of points for unanswered questions.

TEKS } (13) Reading/Comprehension of Informational Text/Procedural Texts. Students understand
how to glean and use information in procedural texts and documents. Students are expected to:
} (A) interpret details from procedural text to complete a task, solve a problem, or perform procedures; and } (B) interpret factual or quantitative information presented in maps, charts, illustrations, graphs, timelines, tables, and diagrams.
} (24) Research/Gathering Sources. Students determine, locate, and explore the full range of relevant sources addressing a research question and systematically record the information they gather. Students are expected to:
} (A) follow the research plan to collect data from a range of print and electronic resources (e.g., reference texts, periodicals, web pages, online sources) and data from experts;
} (C) record data, utilizing available technology (e.g., word processors) in order to see the relationships between ideas, and convert graphic/visual data (e.g., charts, diagrams, timelines) into written notes;
} (5.5) Patterns, relationships, and algebraic thinking. The student makes generalizations based on observed patterns and relationships. The student is expected to: } (A) describe the relationship between sets of data in graphic organizers such as lists, tables, charts, and
diagrams; and } (6) Geography. The student uses geographic tools to collect, analyze, and interpret data. The
student is expected to: } (A) apply geographic tools, including grid systems, legends, symbols, scales, and compass roses, to construct and interpret
maps; and
} (B) translate geographic data into a variety of formats such as raw data to graphs and maps. } (7) Geography. The student understands the concept of regions in the United States. The
student is expected to: } (A) describe a variety of regions in the United States such as political, population, and economic regions that result from
patterns of human activity; } (B) describe a variety of regions in the United States such as landform, climate, and vegetation regions that result from physical
characteristics such as the Great Plains, Rocky Mountains, and Coastal Plains;
} (C) locate on a map important political features such as the ten largest urban areas in the United States, the 50 states and their capitals, and regions such as the Northeast, the Midwest, and the Southwest; and
} (D) locate on a map important physical features such as the Rocky Mountains, Mississippi River, and Great Plains.
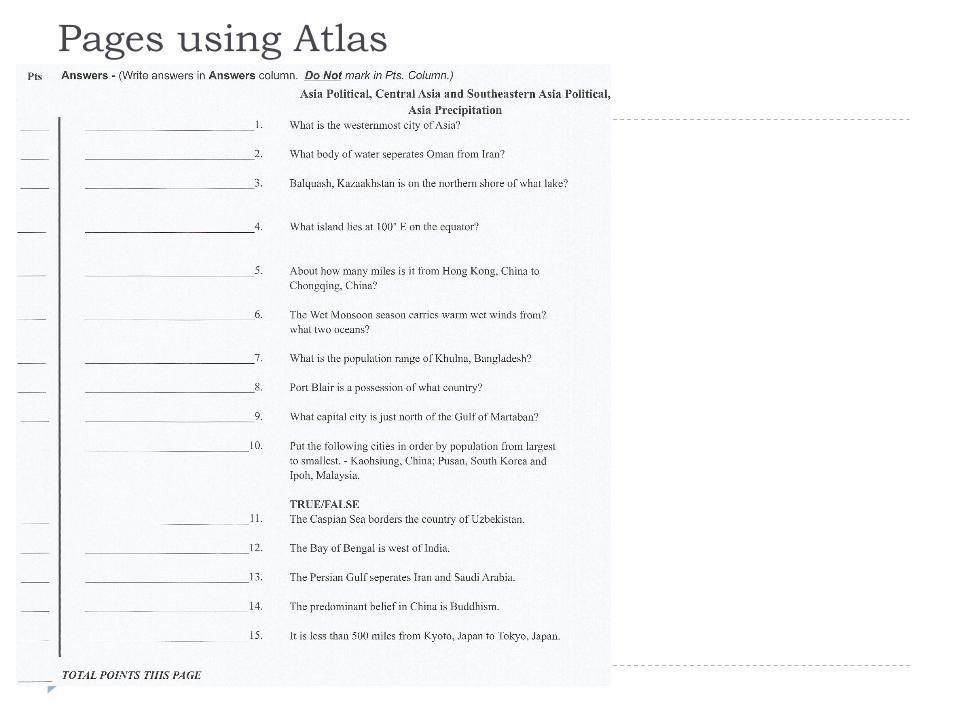
Pages using Atlas
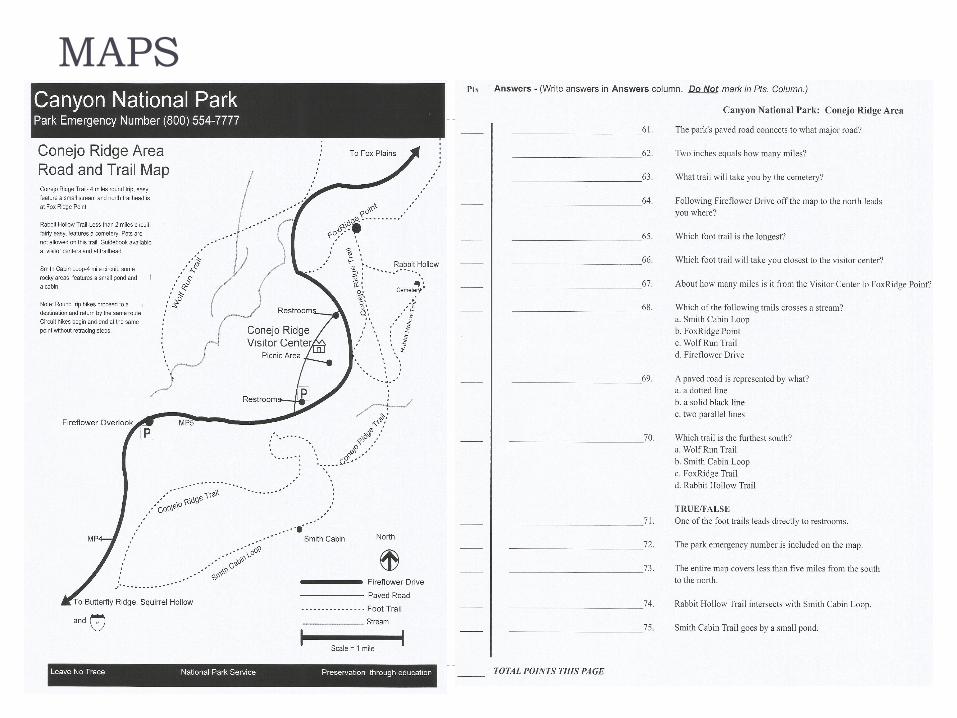
MAPS
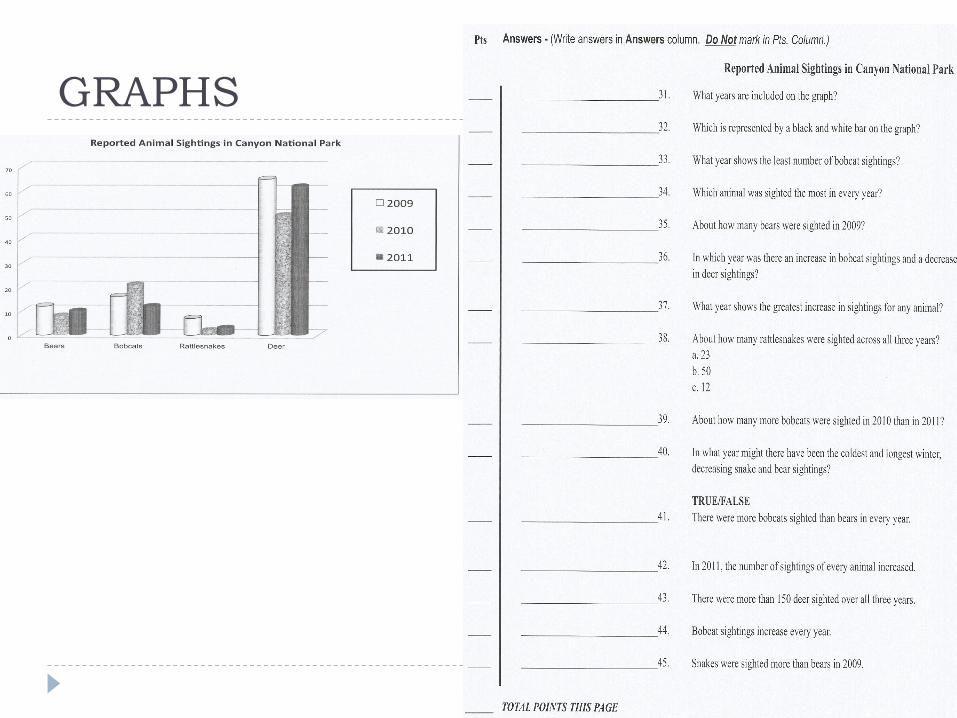
GRAPHS
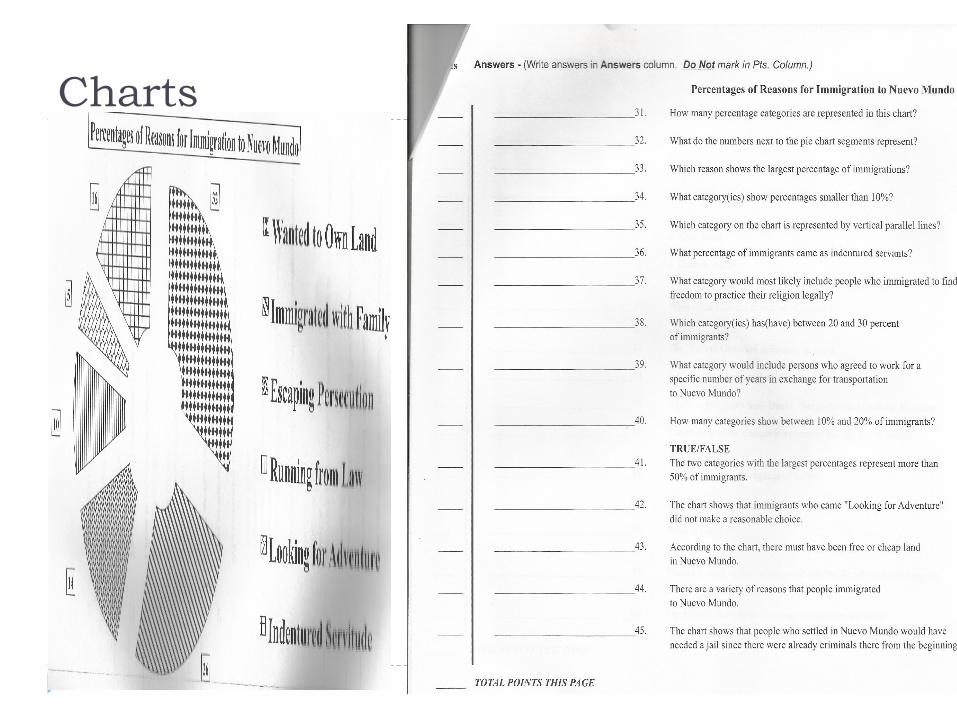
Charts
