march 3, 2021 economic review meeting - wa
TRANSCRIPT

Economic Review
March 3, 2021
Washington State Economic and Revenue Forecast Council

This page left intentionally blank.

WASHINGTON STATE
ECONOMIC AND REVENUE FORECAST COUNCIL
AGENDA
ECONOMIC REVIEW MEETING
March 3, 2021 8:00 a.m.
Approval of meeting minutes from January 28, 2021
Presentation of economic outlook and revenue collection experience

This page left intentionally blank.
-
STATE OF WASHINGTON
ECONOMIC AND REVENUE FORECAST COUNCIL PO Box 40912 Olympia, Washington 98504-0912 (360) 534-1560
Meeting Minutes Budget Outlook Adoption
January 28, 2021 Conference Call
Economic and Revenue Forecast Council Staff
Tim Ormsby, House of Representatives, Chair Christine Rolfes, Senate Lynda Wilson, Senate Ed Orcutt, House Mike Pellicciotti, Treasurer Vikki Smith, Department of Revenue David Schumacher, Office of Financial Management
Steve Lerch, Executive Director Rachel Knutson, OFM Sarian Scott, Senate Ways and Means Andy Toulon, House Appropriations
Call to Order Representative Ormsby called the meeting to order at 10:03 a.m.
Approval of the Minutes Representative Orcutt moved, seconded by Representative Ormsby to adopt the meeting minutes from November 18, 2020. Motion passed unanimously at 10:05 a.m.
Council business Introduction to new council members Treasurer Pellicciotti and Senator Wilson 10:05 a.m.
Budget Adoption The Budget Outlook Work Group members presented.
Motion Representative Orcutt moved, seconded by Representative Ormsby, to adopt budget outlook. Council approved the motion unanimously at 10:28 a.m.
Adjournment With no further business, the meeting adjourned at 10:29 a.m.
1

This page left intentionally blank.
Economic & Revenue Forecast Council State of Washington
Economic Review: March 3, 2021
Executive Summary
United States
This forecast is based on a modified version of IHS Markit's February 2021Control forecast for the U.S. economy. We have adjusted real gross domesticproduct (GDP) to match the Blue Chip “Consensus” GDP forecast for 2021 and2022. We expect real GDP to increase 4.9% in 2021 and 3.8% in 2022 whichis much stronger than the 4.0% and 2.9% growth rates assumed in theNovember forecast. For 2023-25, we used the long term growth ratespublished in October 2020 which are the most recent available. We expectgrowth rates of 2.3%, 2.1%, and 2.0% in 2023 through 2025 compared tothe November forecast of 2.1%, 2.0%, and 1.9%. Blue Chip will release newlong term forecasts in March which we will incorporate in the final forecast.
Our oil price forecast reflects the futures markets, primarily the Brent (NorthSea) oil price but also the West Texas Intermediate (WTI) benchmark. Thisforecast was based on the Wednesday, February 25, 2021 closing prices forBrent and WTI futures. Oil prices are significantly higher than expected in theNovember forecast but are expected to decline over the forecast rather thanincrease as in November. The latest futures prices indicate that the refineracquisition price of crude will average $62 per barrel in the second quarter of2021 compared to $42 in the November forecast. By the fourth quarter of2025 the refiner acquisition price of crude is expected to average $51 perbarrel compared to $46 per barrel in the November forecast.
The fiscal policy assumptions in this forecast are radically different from thoseembedded in the November forecast. In November, we assumed there wouldbe no new stimulus beyond the four pandemic relief measures that hadalready been enacted in 2020. The new forecast incorporates the $900 billionCOVID-19 relief package enacted in December as well as major elements of a$1.9 trillion stimulus package evolving in Congress, including a third round ofstimulus checks, an extension of emergency unemployment programs andbenefits, major funding for COVID-19 mitigation efforts, and significant aid tostate and local governments and schools. The assumed total is approximately$1.5 trillion.
National employment in January increased by 49,000 net jobs. Employmentdata for November and December were revised down by 159,000 jobs.Sectors with the largest job gains in January included employment services(+81,000), local government education (+49,000), professional and technicalservices (+40,000), state government education (+36,000), educationalservices (+34,000), information (+16,000) and wholesale trade (+14,000).Sectors with declining employment in January included retail trade (-38,000),health care (-30,000), amusements, gambling and recreation (-27,000),Federal government (-24,000), food services and drinking places (-19,000),warehousing and storage (-17,000), accommodation (-18,000) and couriersand messengers (-14,000).
3
Executive Summary March 3, 2021 Economic Review
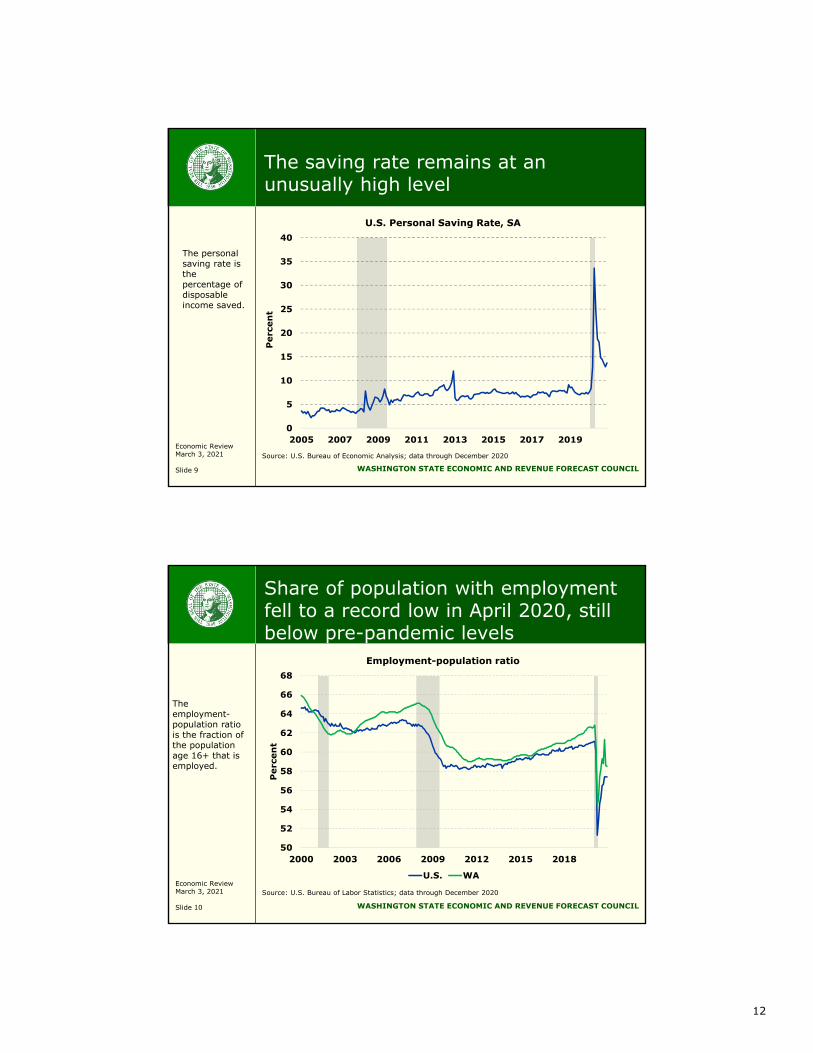
Two key measures of consumer confidence moved in opposite directions thismonth but both remained well below their pre-pandemic levels. TheUniversity of Michigan (UM) consumer sentiment survey decreased by 2.2points to 76.8 in February. Future economic prospects remained the topconcern of survey respondents. The Conference Board index of consumerconfidence increased by 2.4 points in February to 91.3. Survey resultssuggest that consumers were slightly more optimistic about current economicconditions than in January but remain concerned about the outlook over thenext six months.
Initial claims for unemployment insurance decreased by 111,000 to 730,000(SA) in the week ending February 20th. The four-week moving average ofinitial claims decreased by 20,500 to 807,750.
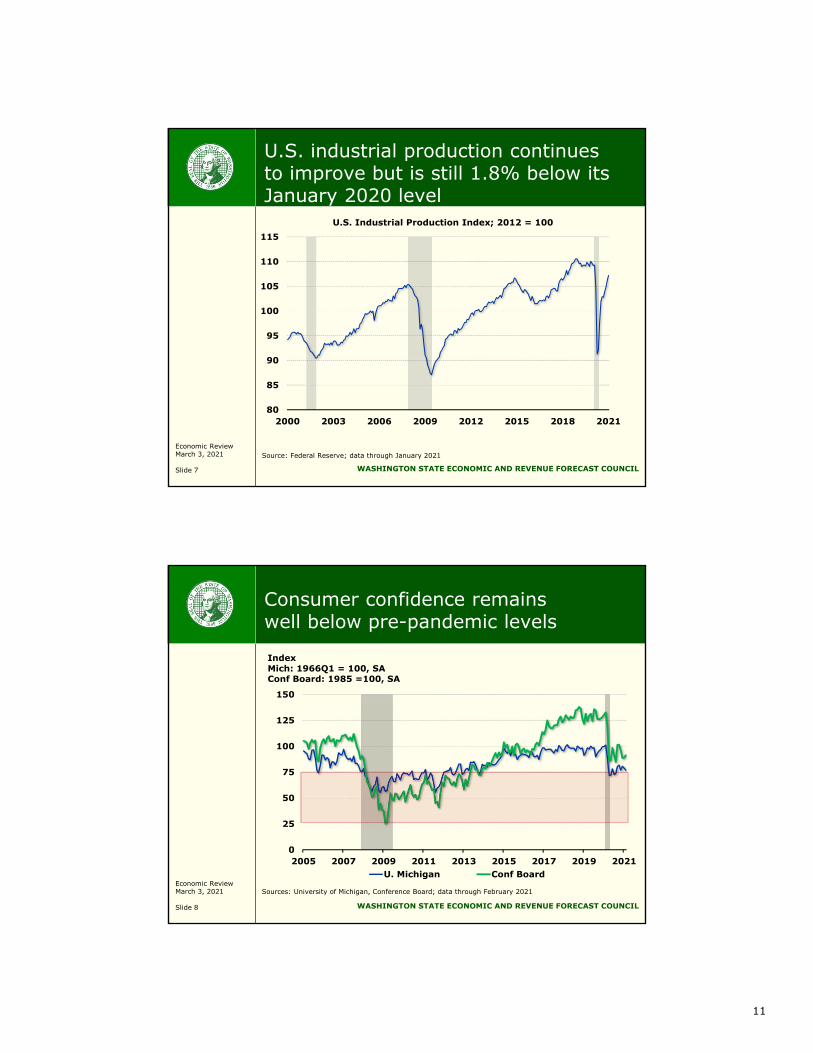
Industrial production in January increased by 0.9% (SA) following a revised1.3% increase in December. Industrial production is down by 1.8% (SA)compared to January 2020. New orders for core capital goods (i.e., durablesexcluding aircraft and military), which is a proxy for business investment,increased by 0.5% (SA) in January following a revised 1.5% increase inDecember according to advanced U.S. Census Bureau data.
Residential construction activity slowed in January but the number of buildingpermits authorized suggests this lull will be temporary. January housingstarts decreased by 6.0% (SA) compared to December and were 2.3% belowtheir January 2020 level. Housing units authorized by building permits inJanuary were 10.4% (SA) above their December level and 22.5% above theiryear-ago level. New home sales in January increased by 4.3% (SA)compared to December and were 19.3% above their year-ago level. Existinghome sales in January increased by 0.6% (SA) compared to December andwere up 23.7% compared to January 2020. The seasonally adjusted Case-Shiller national home price index for December was 1.3% above its Januarylevel and 10.4% above its year-ago level.
The major threat to the U.S. and Washington economies is the uncertainimpact of COVID-19. Concerns about international trade policy andgeopolitical risks remain.
Washington
We have three months of new Washington employment data since theNovember forecast was released. Over the three-month period, employmentdeclined 1,100 which was a 66,300 worse outcome than the increase of65,200 expected in the forecast. Private services-providing sectors lost 7,400jobs in November, December, and January, weighed down by the loss of19,900 jobs in leisure and hospitality. The manufacturing sector managed anincrease of 1,200 jobs in spite of the loss of 1,300 aerospace jobs.Construction employment increased by 4,300 jobs and state and localgovernment employment increased by 3,900 jobs. Federal governmentemployment declined by 3,200 jobs.
We have also incorporated another quarter of benchmark employment datafrom the Quarterly Census of Employment and Wages (QCEW). The newQCEW data and other revisions subtracted 20,900 (0.6%) from the estimatedlevel of total employment in October 2020. Because of the lower-than-expected employment growth in November, December, and January in
4
Executive Summary March 3, 2021 Economic Review
addition to the downward revision to the October estimate, employment is 87,200 (2.6%) lower in January than expected in the November forecast.
Washington’s unemployment rate increased to 7.1% in December from 5.7%in November. This was the first increase in the state’s jobless rate since July.Despite the increase in December, the unemployment rate is downsignificantly from the 16.3% rate reached in April which was an all-time highin the series that dates back to 1976.
As in November, we expect deep cuts in aerospace employment during 2021as Boeing’s overall production is curtailed and 787 production is consolidatedin South Carolina.
In December, after the forecast was complete, the U.S. Department ofCommerce, Bureau of Economic Analysis (BEA) released state personalincome estimates for the third quarter of 2020. According to these estimates,Washington personal income fell from $544.4 in the second quarter to $534.2billion (SAAR) in the third quarter of 2020. The reported 7.3% decline(SAAR) in Washington personal income was the 10th lowest among the statesand District of Columbia and was significantly better than the 10.0% rate ofdecline for the U.S. as a whole. Personal income declined in every state andthe District of Columbia in the third quarter as a result of huge reductions intransfer payments. Without the withdrawal of transfer payments, alljurisdictions would have experienced an increase in personal income.Virtually all of the above average income growth in Washington was due toabove average earnings growth. Washington earnings growth in construction,retail trade (including electronic shopping), and information (predominantlysoftware publishing and other IT services such as internet publishing and websearch portals) all significantly outperformed the U.S. average. At theopposite extreme, durable manufacturing, which includes aerospace, was amajor drag on Washington earnings growth in the third quarter.
Washington housing construction improved in the fourth quarter of 2020 andslightly exceeded the forecast. The number of housing units authorized bybuilding permits increased to 45,600 (SAAR) from 42,600 in the third quarter.The November 2020 forecast expected 45,500 units. Single-family permitsaveraged 26,600 units in the fourth quarter and multi-family permitsaveraged 19,100 units. Single-family construction has fully recovered to pre-recession levels but multi-family construction remains lower. Housingconstruction got off to a very strong start in the first quarter of 2021.January permits totaled 66,700 units (SAAR) of which 30,800 were single-family units and 35,900 were multi-family units.
Seattle-area home prices increased rapidly for a sixth consecutive monthafter three consecutive monthly declines. According to the S&P/Case-ShillerHome Price Indices, seasonally adjusted Seattle home prices increased 1.5%in December compared to a 1.3% increase in the composite-20 index.December Seattle home prices were up 13.6% over the year. In comparison,the composite-20 index was up 10.1% over the year. December Seattlehome prices were up 123% since the December 2011 trough and exceededthe May 2007 peak by 55%.
Seattle-area consumer price inflation was close to the national average in theyear ending in December 2020. From December 2019 to December 2020, theSeattle CPI rose 1.4% compared to a 1.3% increase in the U.S. City Averageindex. Core prices, which exclude food and energy, increased 1.4% over the
5
Executive Summary March 3, 2021 Economic Review
year in Seattle compared to 1.6% for the U.S. City Average. Seattle shelter cost exceeded the national average at 2.5% compared to 1.8%. Seattle inflation excluding shelter slightly trailed the national average at 0.8% compared to 1.0%.
Washington exports declined over the year for a ninth consecutive quarterdespite a large increase in agricultural exports. Year-over-year exportsdecreased 18.1% in the fourth quarter of 2020. Fourth quarter exports ofagricultural products increased 69.6% over the year but this is misleading asit was largely due to soybeans which receive only minimal processing inWashington. Transportation equipment exports (mostly Boeing planes) fell63.7% over the year. Year-over-year exports from all other sectors (mostlymanufacturing) declined 8.3%.
Washington car and truck sales surged in January to their highest level inmore than two years. The seasonally adjusted number of new vehicleregistrations increased 15.6% in January to 312, 600 which was the highestlevel since November 2018. The number of new vehicle registrationsincreased 11.8% over the year in January.
We expect a 1.3% increase in Washington employment this year which isdown from the 3.5% increase in the November forecast. We expect above-average growth through the remainder of the forecast as the economyrecovers from this deep recession. We expect employment growth to average2.2% per year in 2022 through 2025 compared to the 1.7% average rateexpected in November. Our forecast for nominal personal income growth thisyear is 3.9%, up from a 1.1% decline in the November forecast. Theimprovement in personal income growth is the result of additional fiscalstimulus in 2021 which was not expected in November. Personal incomegrowth will slow next year as the stimulus is withdrawn. We expect personalincome growth of only 0.1% in 2022 compared to 3.7% in the Novemberforecast. Our new forecast for nominal personal income growth in 2023through 2025 averages 5.0% per year compared to the 4.6% rate in theNovember forecast.
6

WASHINGTON STATEECONOMIC AND REVENUE FORECAST COUNCIL
Washington State Economic Outlook & Revenue Collection Experience
Presented toThe Economic & Revenue Forecast Council
Steve LerchExecutive Director
March 3, 2021Olympia, Washington
Economic ReviewMarch 3, 2021
Slide 1 WASHINGTON STATE ECONOMIC AND REVENUE FORECAST COUNCIL
Summary
• The preliminary economic forecast incorporates the stimulus bill passed in December 2020 and assumes the major elements of the $1.9 trillion stimulus bill currently working its way through Congress
• U.S. GDP growth in the fourth quarter of 2020 was stronger than expected and growth forecasts for 2021 have increased
• WA housing construction in the fourth quarter was slightly stronger than in the November forecast
• Revenue collections since the November forecast are$593 million (9.0%) above expectations
Economic ReviewMarch 3, 2021
Slide 2 WASHINGTON STATE ECONOMIC AND REVENUE FORECAST COUNCIL
Forecast risks
Upside• Faster than expected COVID vaccine distribution
leads to greater consumer confidence, a return tomore typical spending patterns and increasedemployment
Downside• COVID vaccine distribution slows and infection
rates increase, leading to slower pace of economicreopening, reduced consumer spending andemployment
• Congress does not pass additional fiscal stimuluslegislation
8
Economic ReviewMarch 3, 2021
Slide 3 WASHINGTON STATE ECONOMIC AND REVENUE FORECAST COUNCIL
250
300
350
400
450
500
550
600
2005 2007 2009 2011 2013 2015 2017 2019 2021
$ b
illio
ns
U.S. retail and food service sales, SA
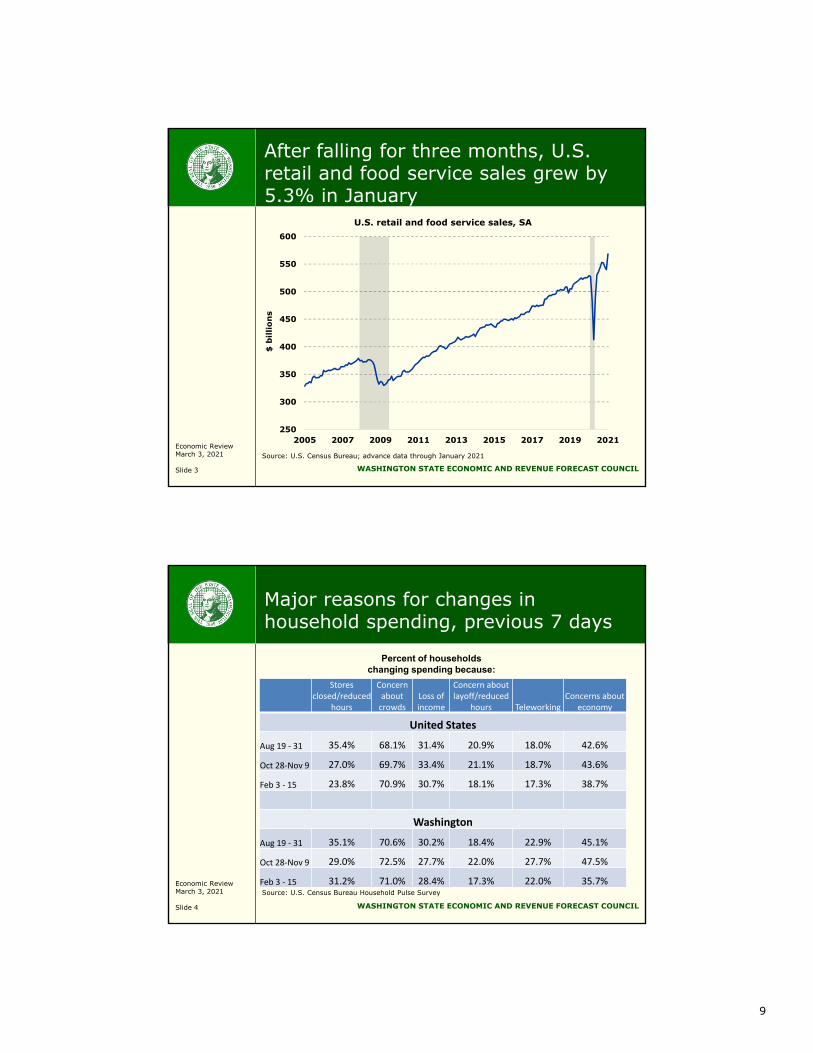
After falling for three months, U.S. retail and food service sales grew by 5.3% in January
Source: U.S. Census Bureau; advance data through January 2021
Economic ReviewMarch 3, 2021
Slide 4 WASHINGTON STATE ECONOMIC AND REVENUE FORECAST COUNCIL
Major reasons for changes in household spending, previous 7 days
Stores closed/reduced
hours
Concern about crowds
Loss of income
Concern about layoff/reduced
hours TeleworkingConcerns about
economy
United States
Aug 19 ‐ 31 35.4% 68.1% 31.4% 20.9% 18.0% 42.6%
Oct 28‐Nov 9 27.0% 69.7% 33.4% 21.1% 18.7% 43.6%
Feb 3 ‐ 15 23.8% 70.9% 30.7% 18.1% 17.3% 38.7%
Washington
Aug 19 ‐ 31 35.1% 70.6% 30.2% 18.4% 22.9% 45.1%
Oct 28‐Nov 9 29.0% 72.5% 27.7% 22.0% 27.7% 47.5%
Feb 3 ‐ 15 31.2% 71.0% 28.4% 17.3% 22.0% 35.7%Source: U.S. Census Bureau Household Pulse Survey
Percent of households changing spending because:
9
Economic ReviewMarch 3, 2021
Slide 5 WASHINGTON STATE ECONOMIC AND REVENUE FORECAST COUNCIL
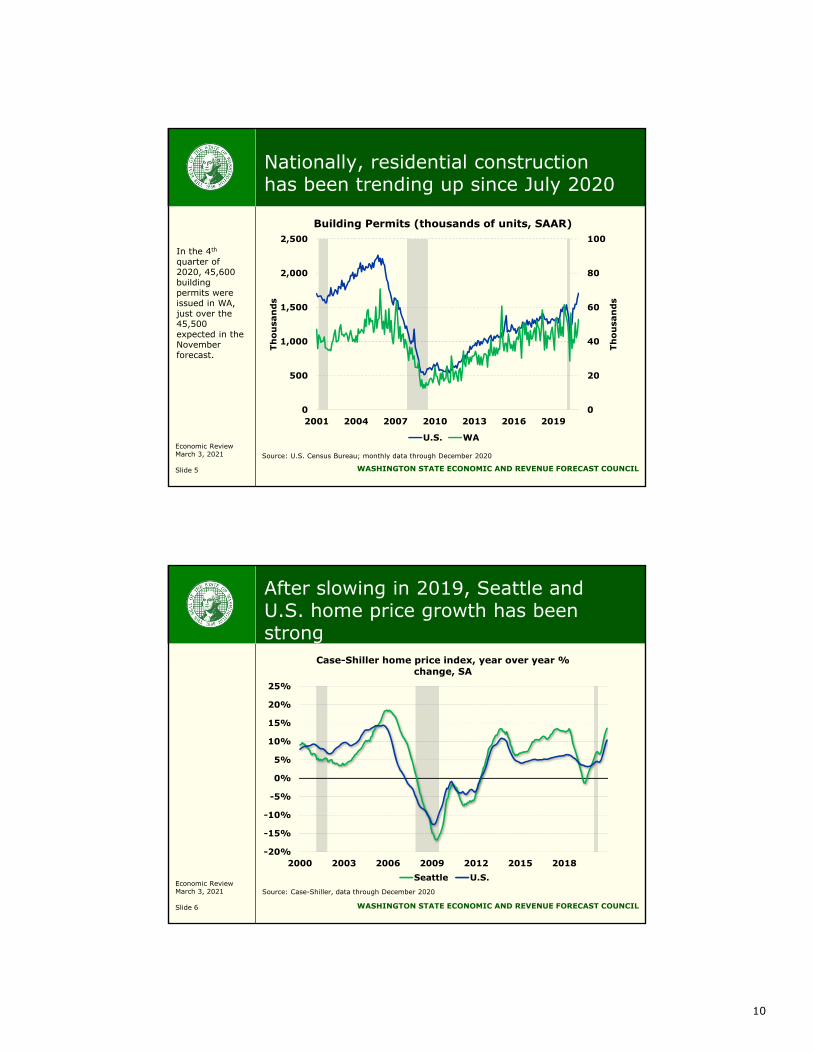
Nationally, residential construction has been trending up since July 2020
0
20
40
60
80
100
0
500
1,000
1,500
2,000
2,500
2001 2004 2007 2010 2013 2016 2019
Tho
usa
nd
s
Tho
usa
nd
s
Building Permits (thousands of units, SAAR)
U.S. WA
Source: U.S. Census Bureau; monthly data through December 2020
In the 4th
quarter of 2020, 45,600 building permits were issued in WA, just over the 45,500 expected in the November forecast.
Economic ReviewMarch 3, 2021
Slide 6 WASHINGTON STATE ECONOMIC AND REVENUE FORECAST COUNCIL
After slowing in 2019, Seattle and U.S. home price growth has been strong
-20%
-15%
-10%
-5%
0%
5%
10%
15%
20%
25%
2000 2003 2006 2009 2012 2015 2018
Case-Shiller home price index, year over year % change, SA
Seattle U.S.Source: Case-Shiller, data through December 2020
10
Economic ReviewMarch 3, 2021
Slide 7 WASHINGTON STATE ECONOMIC AND REVENUE FORECAST COUNCIL
U.S. industrial production continues to improve but is still 1.8% below its January 2020 level
80
85
90
95
100
105
110
115
2000 2003 2006 2009 2012 2015 2018 2021
U.S. Industrial Production Index; 2012 = 100
Source: Federal Reserve; data through January 2021
Economic ReviewMarch 3, 2021
Slide 8 WASHINGTON STATE ECONOMIC AND REVENUE FORECAST COUNCIL
Consumer confidence remains well below pre-pandemic levels
0
25
50
75
100
125
150
2005 2007 2009 2011 2013 2015 2017 2019 2021
Index Mich: 1966Q1 = 100, SAConf Board: 1985 =100, SA
U. Michigan Conf Board
Sources: University of Michigan, Conference Board; data through February 2021
11
Economic ReviewMarch 3, 2021
Slide 9 WASHINGTON STATE ECONOMIC AND REVENUE FORECAST COUNCIL
0
5
10
15
20
25
30
35
40
2005 2007 2009 2011 2013 2015 2017 2019
Per
cen
t
U.S. Personal Saving Rate, SA
The saving rate remains at an unusually high level
Source: U.S. Bureau of Economic Analysis; data through December 2020
The personal saving rate is the percentage of disposable income saved.
Economic ReviewMarch 3, 2021
Slide 10 WASHINGTON STATE ECONOMIC AND REVENUE FORECAST COUNCIL
Share of population with employment fell to a record low in April 2020, still below pre-pandemic levels
50
52
54
56
58
60
62
64
66
68
2000 2003 2006 2009 2012 2015 2018
Per
cen
t
Employment-population ratio
U.S. WA
The employment-population ratio is the fraction of the population age 16+ that is employed.
Source: U.S. Bureau of Labor Statistics; data through December 2020
12

Economic ReviewMarch 3, 2021
Slide 11 WASHINGTON STATE ECONOMIC AND REVENUE FORECAST COUNCIL
One-third of U.S, one-quarter of WA households indicate somewhat or very difficult to pay usual expenses
0%
5%
10%
15%
20%
25%
30%
35%
40%
Aug. 19-31 Oct. 28 - Nov. 9 Feb. 3-15
% households with difficulty paying usual expenses
U.S. WA
Source: U.S. Census Bureau Household Pulse Survey
Economic ReviewMarch 3, 2021
Slide 12 WASHINGTON STATE ECONOMIC AND REVENUE FORECAST COUNCIL
Most respondents to WSJ Economic Forecasting Survey see forecast risks to the upside
0%
25%
50%
75%
Downside Balanced Upside
U.S. GDP forecast risks, next 12 months
Source: Wall Street Journal, February 2021 Economic Forecasting Survey
13

Economic ReviewMarch 3, 2021
Slide 13 WASHINGTON STATE ECONOMIC AND REVENUE FORECAST COUNCIL
Blue Chip GDP forecasts for 2021: November 2020 vs February 2021
0%
1%
2%
3%
4%
5%
6%
7%
8%
Nov. 2020 Feb. 2021
U.S. real GDP growth forecast
High Average Low
Source: Blue Chip Economic Indicators, Nov. 2020 and Feb. 2021
Economic ReviewMarch 3, 2021
Slide 14 WASHINGTON STATE ECONOMIC AND REVENUE FORECAST COUNCIL
GDP growth is expected to be stronger through 2025 compared to November
$14,000
$15,000
$16,000
$17,000
$18,000
$19,000
$20,000
$21,000
$22,000
2007 2010 2013 2016 2019 2022 2025
Quarterly real GDP, 2012 $ billions
March preliminary November
Source: IHS Markit, ERFC March 2021 preliminary forecast; data through 2020 Q4
Forecast
GDP is now expected to return to pre-pandemic levels in the 3rd
quarter of 2021.
14

Economic ReviewMarch 3, 2021
Slide 15 WASHINGTON STATE ECONOMIC AND REVENUE FORECAST COUNCIL
Oil prices are higher than in the November forecast but are expected to gradually decline after mid-2021
20
30
40
50
60
70
80
90
100
110
120
2007 2009 2011 2013 2015 2017 2019 2021 2023 2025
Dol
lars
Per
Bar
rel
March preliminary November
Source: Energy Information Administration, IHS Markit, ERFC; data through Q4 2020Note: Vertical black line indicates last actual
Forecast
Economic ReviewMarch 3, 2021
Slide 16 WASHINGTON STATE ECONOMIC AND REVENUE FORECAST COUNCIL
Compared to November, U.S. nonfarm employment growth is weaker this year, stronger in 2022
115
120
125
130
135
140
145
150
155
160
2007 2009 2011 2013 2015 2017 2019 2021 2023 2025
Mill
ion
s
U.S. Nonfarm Payroll Employment
March preliminary November
Forecast
Source: IHS Markit, ERFC March 2021 preliminary forecast; data through 2020 Q4
15
Economic ReviewMarch 3, 2021
Slide 17 WASHINGTON STATE ECONOMIC AND REVENUE FORECAST COUNCIL
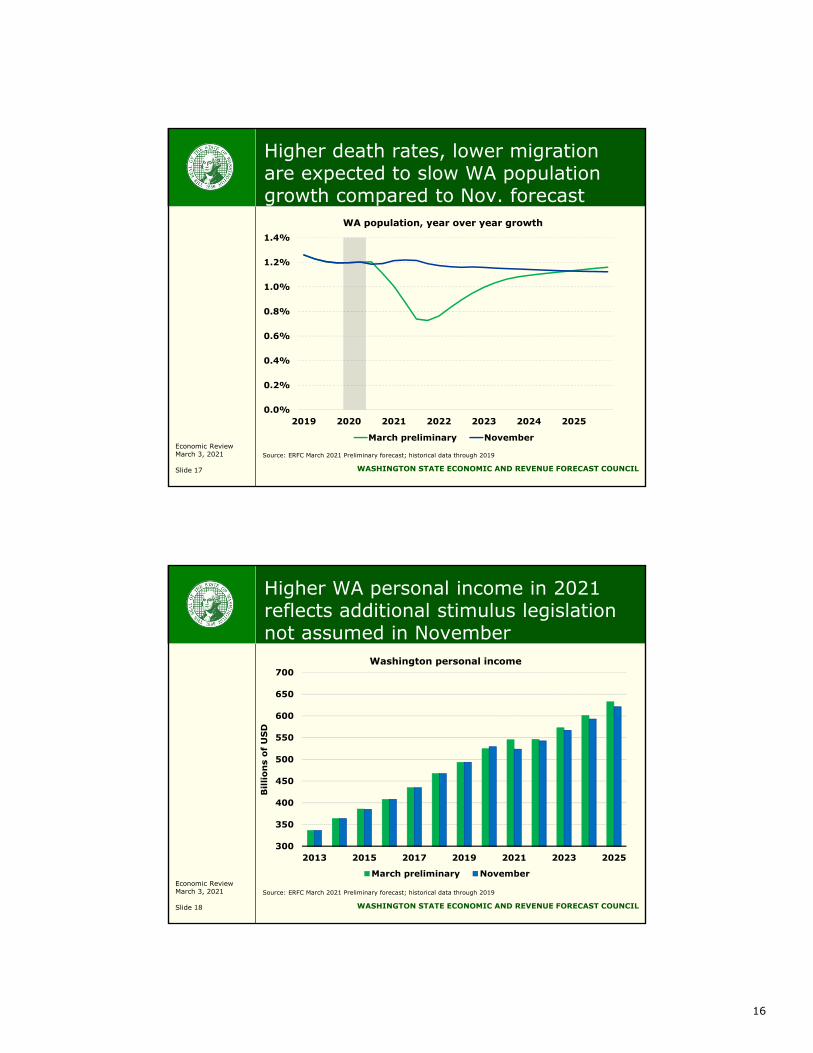
Higher death rates, lower migration are expected to slow WA population growth compared to Nov. forecast
0.0%
0.2%
0.4%
0.6%
0.8%
1.0%
1.2%
1.4%
2019 2020 2021 2022 2023 2024 2025
WA population, year over year growth
March preliminary November
Source: ERFC March 2021 Preliminary forecast; historical data through 2019
Economic ReviewMarch 3, 2021
Slide 18 WASHINGTON STATE ECONOMIC AND REVENUE FORECAST COUNCIL
Higher WA personal income in 2021 reflects additional stimulus legislation not assumed in November
300
350
400
450
500
550
600
650
700
2013 2015 2017 2019 2021 2023 2025
Bill
ion
s o
f U
SD
Washington personal income
March preliminary November
Source: ERFC March 2021 Preliminary forecast; historical data through 2019
16
Economic ReviewMarch 3, 2021
Slide 19 WASHINGTON STATE ECONOMIC AND REVENUE FORECAST COUNCIL
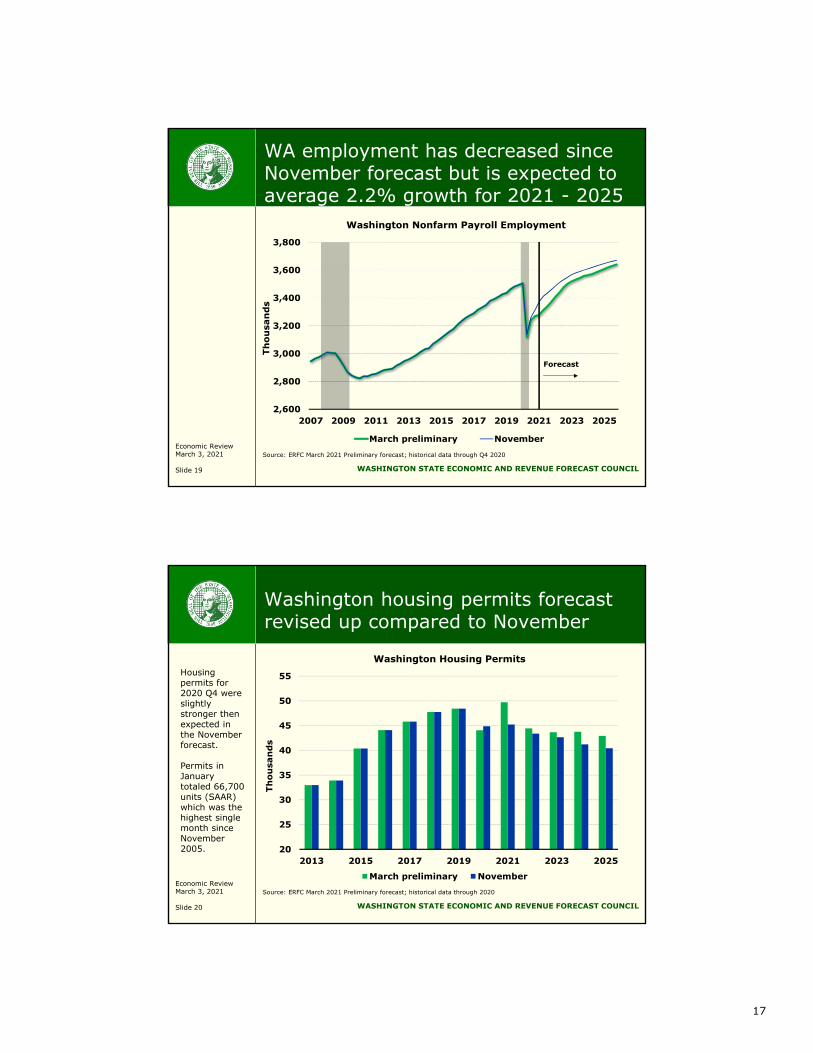
WA employment has decreased since November forecast but is expected to average 2.2% growth for 2021 - 2025
2,600
2,800
3,000
3,200
3,400
3,600
3,800
2007 2009 2011 2013 2015 2017 2019 2021 2023 2025
Thou
san
ds
Washington Nonfarm Payroll Employment
March preliminary November
Source: ERFC March 2021 Preliminary forecast; historical data through Q4 2020
Forecast
Economic ReviewMarch 3, 2021
Slide 20 WASHINGTON STATE ECONOMIC AND REVENUE FORECAST COUNCIL
Washington housing permits forecast revised up compared to November
20
25
30
35
40
45
50
55
2013 2015 2017 2019 2021 2023 2025
Tho
usa
nd
s
Washington Housing Permits
March preliminary November
Source: ERFC March 2021 Preliminary forecast; historical data through 2020
Housing permits for 2020 Q4 were slightly stronger then expected in the November forecast.
Permits in January totaled 66,700 units (SAAR) which was the highest single month since November 2005.
17

Economic ReviewMarch 3, 2021
Slide 21 WASHINGTON STATE ECONOMIC AND REVENUE FORECAST COUNCIL
Revenue Act collections (SA) have surpassed previous peak of January 2020
0.6
0.7
0.8
0.9
1.0
1.1
1.2
1.3
1.4
1.5
1.6
2002 2004 2006 2008 2010 2012 2014 2016 2018 2020
$billions SA
Revenue Act Collections 3-Month Moving Average
Source: DOR and ERFC; monthly data through December 2020 activity
* Adjusted for large one-time transactions, amnesty payments, reporting frequency change and deferred 2020 payments, current definition of Revenue Act
Seasonally adjusted Rev Act collections for October and November 2020 activity were higher than the previous peak reached for January 2020 activity; December activity was slightly lower.
Economic ReviewMarch 3, 2021
Slide 22 WASHINGTON STATE ECONOMIC AND REVENUE FORECAST COUNCIL
Taxable REET activity jumped to a near-record high in December, remained strong in January 2021
0
2
4
6
8
10
12
14
1996 1999 2002 2005 2008 2011 2014 2017 2020
$Billions
Seasonally Adjusted Taxable Real Estate Excise Activity
Total Total excl. sales >$10M
Source: ERFC; Monthly data through January 2021 estimate
December sales reflected the highest level of large commercial transactions since December 2019. Large commercial transactions slowed in January but residential sales remained high.
18
Economic ReviewMarch 3, 2021
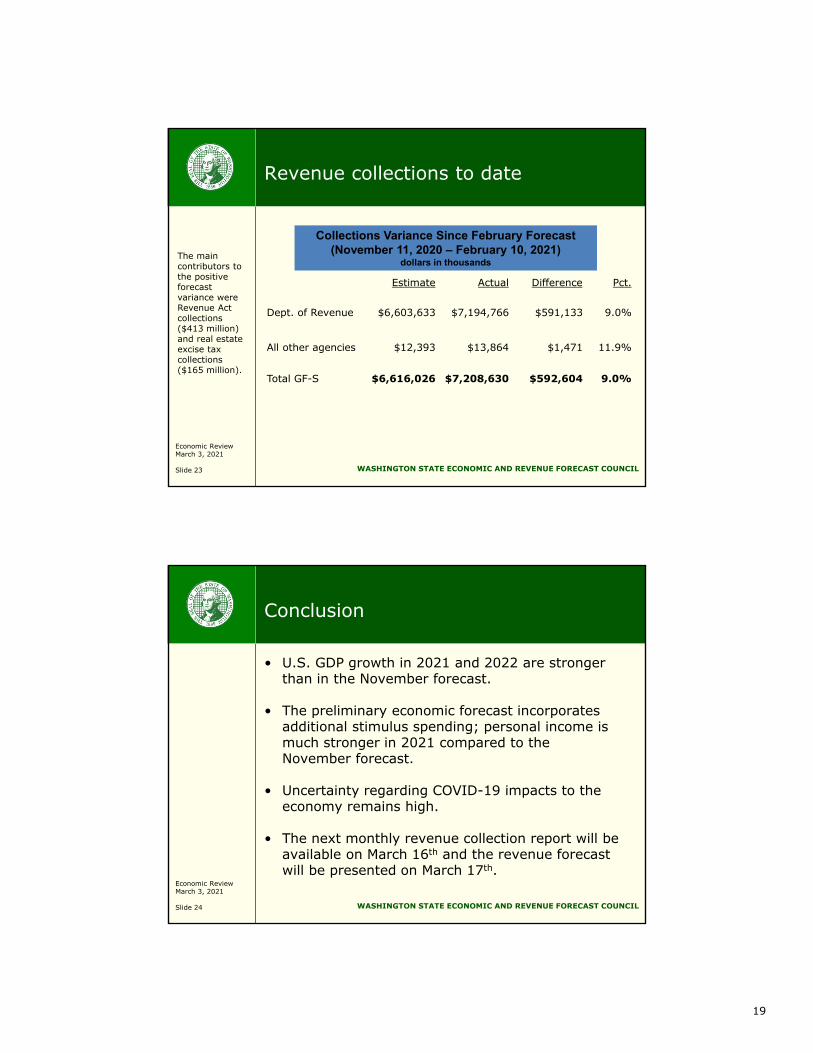
Slide 23 WASHINGTON STATE ECONOMIC AND REVENUE FORECAST COUNCIL
Revenue collections to date
Estimate Actual Difference Pct.
Dept. of Revenue $6,603,633 $7,194,766 $591,133 9.0%
All other agencies $12,393 $13,864 $1,471 11.9%
Total GF-S $6,616,026 $7,208,630 $592,604 9.0%
Collections Variance Since February Forecast (November 11, 2020 – February 10, 2021)
dollars in thousandsThe main contributors to the positive forecast variance were Revenue Act collections ($413 million) and real estate excise tax collections ($165 million).
Economic ReviewMarch 3, 2021
Slide 24 WASHINGTON STATE ECONOMIC AND REVENUE FORECAST COUNCIL
Conclusion
• U.S. GDP growth in 2021 and 2022 are strongerthan in the November forecast.
• The preliminary economic forecast incorporatesadditional stimulus spending; personal income ismuch stronger in 2021 compared to theNovember forecast.
• Uncertainty regarding COVID-19 impacts to theeconomy remains high.
• The next monthly revenue collection report will beavailable on March 16th and the revenue forecastwill be presented on March 17th.
19

Economic ReviewMarch 3, 2021
Slide 25 WASHINGTON STATE ECONOMIC AND REVENUE FORECAST COUNCIL
Questions
Economic & Revenue Forecast CouncilPO BOX 40912Olympia WA 98504-0912
www.erfc.wa.gov360-534-1560
20
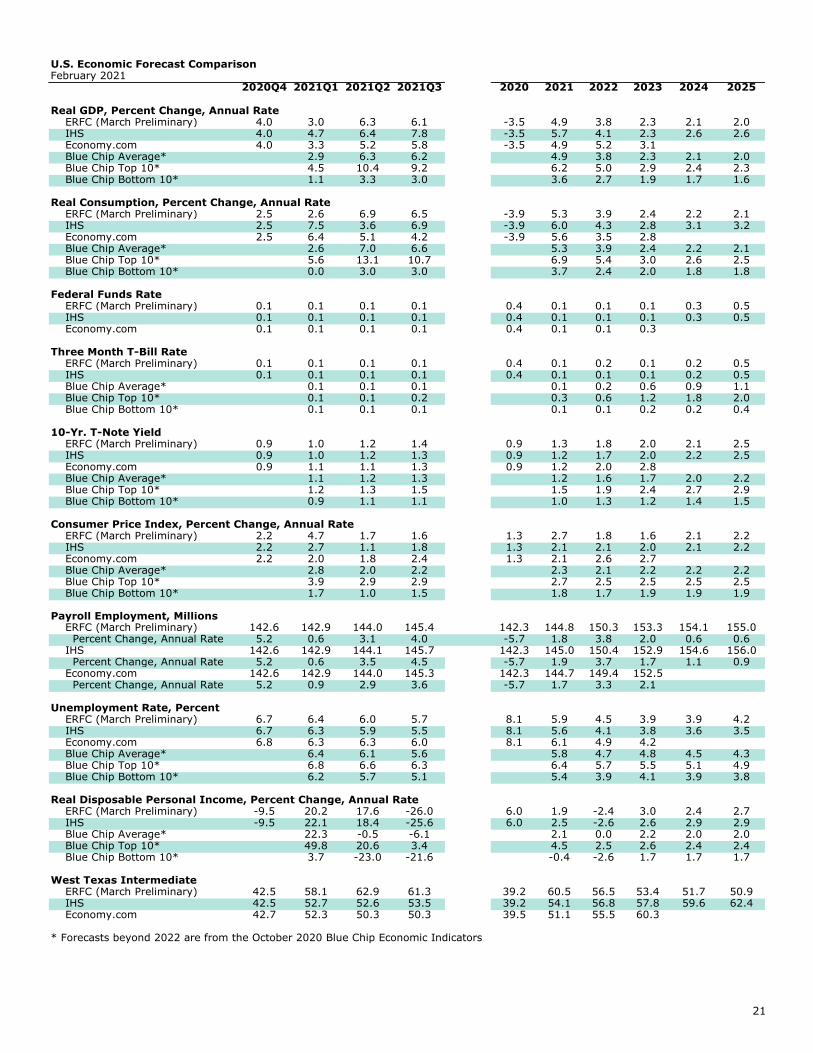
U.S. Economic Forecast ComparisonFebruary 2021
2020Q4 2021Q1 2021Q2 2021Q3 2020 2021 2022 2023 2024 2025
Real GDP, Percent Change, Annual Rate ERFC (March Preliminary) 4.0 3.0 6.3 6.1 -3.5 4.9 3.8 2.3 2.1 2.0 IHS 4.0 4.7 6.4 7.8 -3.5 5.7 4.1 2.3 2.6 2.6 Economy.com 4.0 3.3 5.2 5.8 -3.5 4.9 5.2 3.1 Blue Chip Average* 2.9 6.3 6.2 4.9 3.8 2.3 2.1 2.0 Blue Chip Top 10* 4.5 10.4 9.2 6.2 5.0 2.9 2.4 2.3 Blue Chip Bottom 10* 1.1 3.3 3.0 3.6 2.7 1.9 1.7 1.6
Real Consumption, Percent Change, Annual Rate ERFC (March Preliminary) 2.5 2.6 6.9 6.5 -3.9 5.3 3.9 2.4 2.2 2.1 IHS 2.5 7.5 3.6 6.9 -3.9 6.0 4.3 2.8 3.1 3.2 Economy.com 2.5 6.4 5.1 4.2 -3.9 5.6 3.5 2.8 Blue Chip Average* 2.6 7.0 6.6 5.3 3.9 2.4 2.2 2.1 Blue Chip Top 10* 5.6 13.1 10.7 6.9 5.4 3.0 2.6 2.5 Blue Chip Bottom 10* 0.0 3.0 3.0 3.7 2.4 2.0 1.8 1.8
Federal Funds Rate ERFC (March Preliminary) 0.1 0.1 0.1 0.1 0.4 0.1 0.1 0.1 0.3 0.5 IHS 0.1 0.1 0.1 0.1 0.4 0.1 0.1 0.1 0.3 0.5 Economy.com 0.1 0.1 0.1 0.1 0.4 0.1 0.1 0.3
Three Month T-Bill Rate ERFC (March Preliminary) 0.1 0.1 0.1 0.1 0.4 0.1 0.2 0.1 0.2 0.5 IHS 0.1 0.1 0.1 0.1 0.4 0.1 0.1 0.1 0.2 0.5 Blue Chip Average* 0.1 0.1 0.1 0.1 0.2 0.6 0.9 1.1 Blue Chip Top 10* 0.1 0.1 0.2 0.3 0.6 1.2 1.8 2.0 Blue Chip Bottom 10* 0.1 0.1 0.1 0.1 0.1 0.2 0.2 0.4
10-Yr. T-Note Yield ERFC (March Preliminary) 0.9 1.0 1.2 1.4 0.9 1.3 1.8 2.0 2.1 2.5 IHS 0.9 1.0 1.2 1.3 0.9 1.2 1.7 2.0 2.2 2.5 Economy.com 0.9 1.1 1.1 1.3 0.9 1.2 2.0 2.8 Blue Chip Average* 1.1 1.2 1.3 1.2 1.6 1.7 2.0 2.2 Blue Chip Top 10* 1.2 1.3 1.5 1.5 1.9 2.4 2.7 2.9 Blue Chip Bottom 10* 0.9 1.1 1.1 1.0 1.3 1.2 1.4 1.5
Consumer Price Index, Percent Change, Annual Rate ERFC (March Preliminary) 2.2 4.7 1.7 1.6 1.3 2.7 1.8 1.6 2.1 2.2 IHS 2.2 2.7 1.1 1.8 1.3 2.1 2.1 2.0 2.1 2.2 Economy.com 2.2 2.0 1.8 2.4 1.3 2.1 2.6 2.7 Blue Chip Average* 2.8 2.0 2.2 2.3 2.1 2.2 2.2 2.2 Blue Chip Top 10* 3.9 2.9 2.9 2.7 2.5 2.5 2.5 2.5 Blue Chip Bottom 10* 1.7 1.0 1.5 1.8 1.7 1.9 1.9 1.9
Payroll Employment, Millions ERFC (March Preliminary) 142.6 142.9 144.0 145.4 142.3 144.8 150.3 153.3 154.1 155.0 Percent Change, Annual Rate 5.2 0.6 3.1 4.0 -5.7 1.8 3.8 2.0 0.6 0.6 IHS 142.6 142.9 144.1 145.7 142.3 145.0 150.4 152.9 154.6 156.0 Percent Change, Annual Rate 5.2 0.6 3.5 4.5 -5.7 1.9 3.7 1.7 1.1 0.9 Economy.com 142.6 142.9 144.0 145.3 142.3 144.7 149.4 152.5 Percent Change, Annual Rate 5.2 0.9 2.9 3.6 -5.7 1.7 3.3 2.1
Unemployment Rate, Percent ERFC (March Preliminary) 6.7 6.4 6.0 5.7 8.1 5.9 4.5 3.9 3.9 4.2 IHS 6.7 6.3 5.9 5.5 8.1 5.6 4.1 3.8 3.6 3.5 Economy.com 6.8 6.3 6.3 6.0 8.1 6.1 4.9 4.2 Blue Chip Average* 6.4 6.1 5.6 5.8 4.7 4.8 4.5 4.3 Blue Chip Top 10* 6.8 6.6 6.3 6.4 5.7 5.5 5.1 4.9 Blue Chip Bottom 10* 6.2 5.7 5.1 5.4 3.9 4.1 3.9 3.8
Real Disposable Personal Income, Percent Change, Annual Rate ERFC (March Preliminary) -9.5 20.2 17.6 -26.0 6.0 1.9 -2.4 3.0 2.4 2.7 IHS -9.5 22.1 18.4 -25.6 6.0 2.5 -2.6 2.6 2.9 2.9 Blue Chip Average* 22.3 -0.5 -6.1 2.1 0.0 2.2 2.0 2.0 Blue Chip Top 10* 49.8 20.6 3.4 4.5 2.5 2.6 2.4 2.4 Blue Chip Bottom 10* 3.7 -23.0 -21.6 -0.4 -2.6 1.7 1.7 1.7
West Texas Intermediate ERFC (March Preliminary) 42.5 58.1 62.9 61.3 39.2 60.5 56.5 53.4 51.7 50.9 IHS 42.5 52.7 52.6 53.5 39.2 54.1 56.8 57.8 59.6 62.4 Economy.com 42.7 52.3 50.3 50.3 39.5 51.1 55.5 60.3 CME Group (10/12/2016) #REF! #REF! #REF! #REF! #REF! #REF! #REF! 60.5* Forecasts beyond 2022 are from the October 2020 Blue Chip Economic Indicators
21
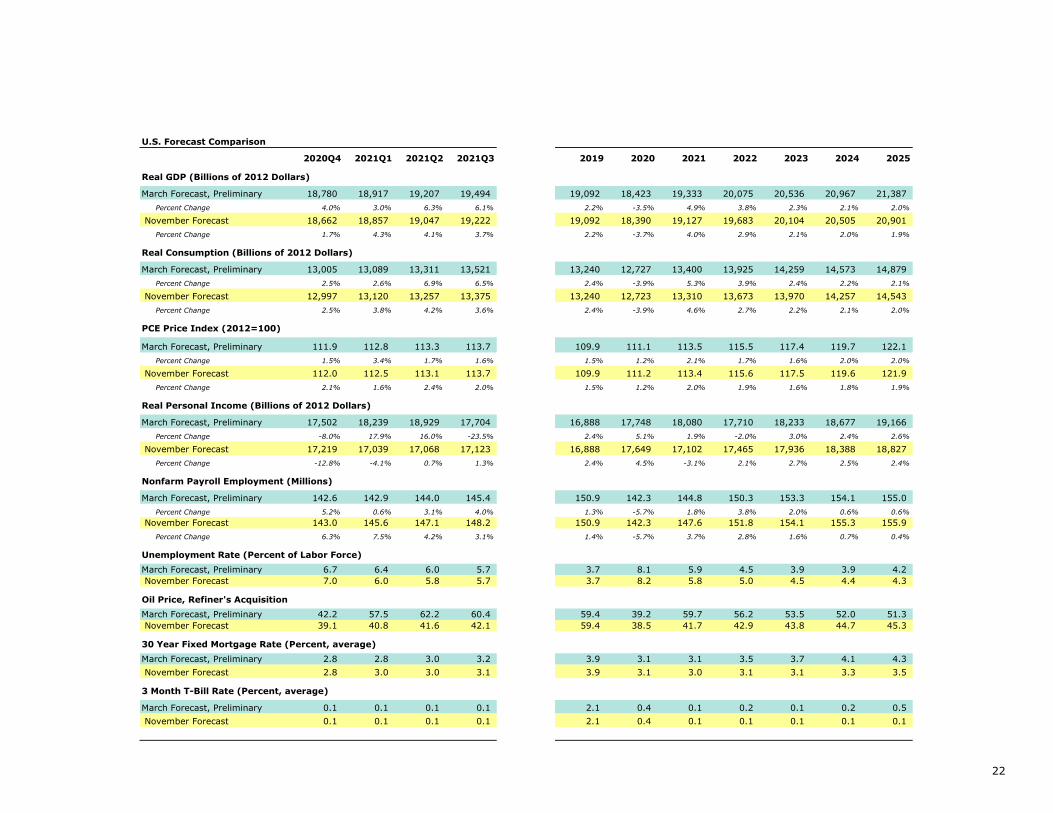
U.S. Forecast Comparison
2020Q4 2021Q1 2021Q2 2021Q3 2019 2020 2021 2022 2023 2024 2025
Real GDP (Billions of 2012 Dollars)
March Forecast, Preliminary 18,780 18,917 19,207 19,494 19,092 18,423 19,333 20,075 20,536 20,967 21,387
Percent Change 4.0% 3.0% 6.3% 6.1% 2.2% -3.5% 4.9% 3.8% 2.3% 2.1% 2.0%
November Forecast 18,662 18,857 19,047 19,222 19,092 18,390 19,127 19,683 20,104 20,505 20,901
Percent Change 1.7% 4.3% 4.1% 3.7% 2.2% -3.7% 4.0% 2.9% 2.1% 2.0% 1.9%
Real Consumption (Billions of 2012 Dollars)
March Forecast, Preliminary 13,005 13,089 13,311 13,521 13,240 12,727 13,400 13,925 14,259 14,573 14,879
Percent Change 2.5% 2.6% 6.9% 6.5% 2.4% -3.9% 5.3% 3.9% 2.4% 2.2% 2.1%
November Forecast 12,997 13,120 13,257 13,375 13,240 12,723 13,310 13,673 13,970 14,257 14,543
Percent Change 2.5% 3.8% 4.2% 3.6% 2.4% -3.9% 4.6% 2.7% 2.2% 2.1% 2.0%
PCE Price Index (2012=100)
March Forecast, Preliminary 111.9 112.8 113.3 113.7 109.9 111.1 113.5 115.5 117.4 119.7 122.1
Percent Change 1.5% 3.4% 1.7% 1.6% 1.5% 1.2% 2.1% 1.7% 1.6% 2.0% 2.0%
November Forecast 112.0 112.5 113.1 113.7 109.9 111.2 113.4 115.6 117.5 119.6 121.9
Percent Change 2.1% 1.6% 2.4% 2.0% 1.5% 1.2% 2.0% 1.9% 1.6% 1.8% 1.9%
Real Personal Income (Billions of 2012 Dollars)
March Forecast, Preliminary 17,502 18,239 18,929 17,704 16,888 17,748 18,080 17,710 18,233 18,677 19,166
Percent Change -8.0% 17.9% 16.0% -23.5% 2.4% 5.1% 1.9% -2.0% 3.0% 2.4% 2.6%
November Forecast 17,219 17,039 17,068 17,123 16,888 17,649 17,102 17,465 17,936 18,388 18,827
Percent Change -12.8% -4.1% 0.7% 1.3% 2.4% 4.5% -3.1% 2.1% 2.7% 2.5% 2.4%
Nonfarm Payroll Employment (Millions)
March Forecast, Preliminary 142.6 142.9 144.0 145.4 150.9 142.3 144.8 150.3 153.3 154.1 155.0
Percent Change 5.2% 0.6% 3.1% 4.0% 1.3% -5.7% 1.8% 3.8% 2.0% 0.6% 0.6%
November Forecast 143.0 145.6 147.1 148.2 150.9 142.3 147.6 151.8 154.1 155.3 155.9
Percent Change 6.3% 7.5% 4.2% 3.1% 1.4% -5.7% 3.7% 2.8% 1.6% 0.7% 0.4%
Unemployment Rate (Percent of Labor Force)
March Forecast, Preliminary 6.7 6.4 6.0 5.7 3.7 8.1 5.9 4.5 3.9 3.9 4.2
November Forecast 7.0 6.0 5.8 5.7 3.7 8.2 5.8 5.0 4.5 4.4 4.3
Oil Price, Refiner's Acquisition
March Forecast, Preliminary 42.2 57.5 62.2 60.4 59.4 39.2 59.7 56.2 53.5 52.0 51.3
November Forecast 39.1 40.8 41.6 42.1 59.4 38.5 41.7 42.9 43.8 44.7 45.3
30 Year Fixed Mortgage Rate (Percent, average)
March Forecast, Preliminary 2.8 2.8 3.0 3.2 3.9 3.1 3.1 3.5 3.7 4.1 4.3
November Forecast 2.8 3.0 3.0 3.1 3.9 3.1 3.0 3.1 3.1 3.3 3.5
3 Month T-Bill Rate (Percent, average)
March Forecast, Preliminary 0.1 0.1 0.1 0.1 2.1 0.4 0.1 0.2 0.1 0.2 0.5
November Forecast 0.1 0.1 0.1 0.1 2.1 0.4 0.1 0.1 0.1 0.1 0.1
22
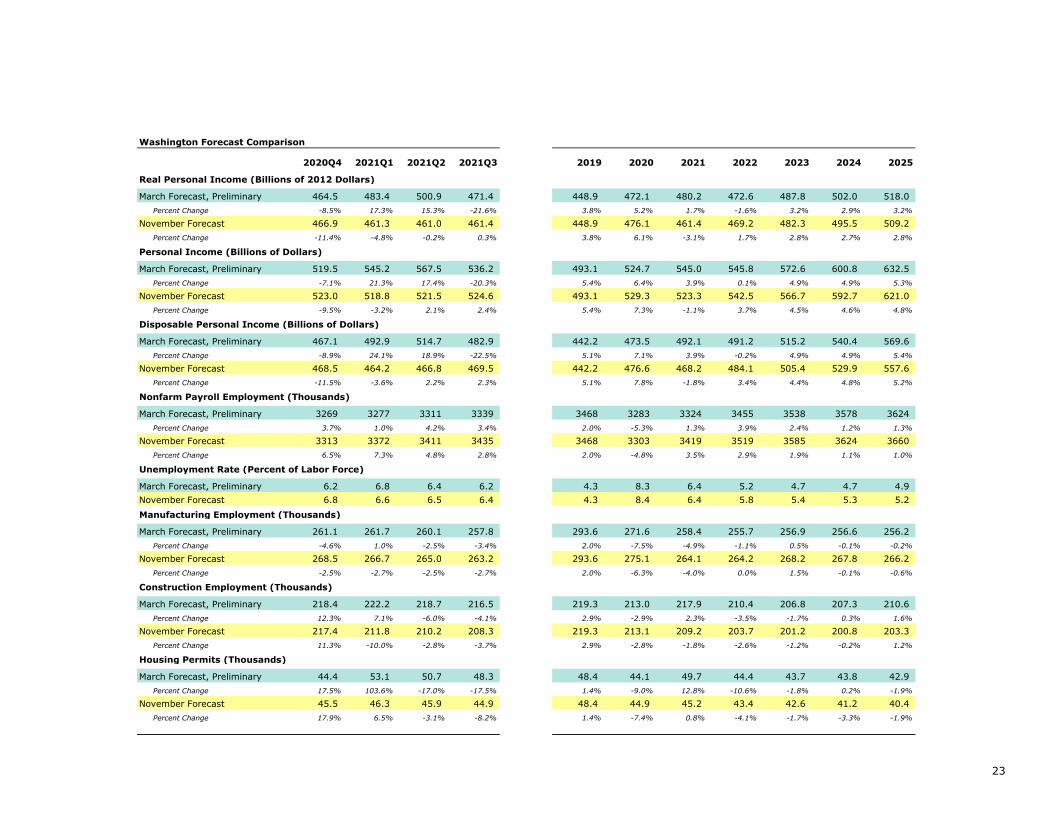
Washington Forecast Comparison
2020Q4 2021Q1 2021Q2 2021Q3 2019 2020 2021 2022 2023 2024 2025
Real Personal Income (Billions of 2012 Dollars)
March Forecast, Preliminary 464.5 483.4 500.9 471.4 448.9 472.1 480.2 472.6 487.8 502.0 518.0
Percent Change -8.5% 17.3% 15.3% -21.6% 3.8% 5.2% 1.7% -1.6% 3.2% 2.9% 3.2%
November Forecast 466.9 461.3 461.0 461.4 448.9 476.1 461.4 469.2 482.3 495.5 509.2
Percent Change -11.4% -4.8% -0.2% 0.3% 3.8% 6.1% -3.1% 1.7% 2.8% 2.7% 2.8%
Personal Income (Billions of Dollars)
March Forecast, Preliminary 519.5 545.2 567.5 536.2 493.1 524.7 545.0 545.8 572.6 600.8 632.5
Percent Change -7.1% 21.3% 17.4% -20.3% 5.4% 6.4% 3.9% 0.1% 4.9% 4.9% 5.3%
November Forecast 523.0 518.8 521.5 524.6 493.1 529.3 523.3 542.5 566.7 592.7 621.0
Percent Change -9.5% -3.2% 2.1% 2.4% 5.4% 7.3% -1.1% 3.7% 4.5% 4.6% 4.8%
Disposable Personal Income (Billions of Dollars)
March Forecast, Preliminary 467.1 492.9 514.7 482.9 442.2 473.5 492.1 491.2 515.2 540.4 569.6
Percent Change -8.9% 24.1% 18.9% -22.5% 5.1% 7.1% 3.9% -0.2% 4.9% 4.9% 5.4%
November Forecast 468.5 464.2 466.8 469.5 442.2 476.6 468.2 484.1 505.4 529.9 557.6
Percent Change -11.5% -3.6% 2.2% 2.3% 5.1% 7.8% -1.8% 3.4% 4.4% 4.8% 5.2%
Nonfarm Payroll Employment (Thousands)
March Forecast, Preliminary 3269 3277 3311 3339 3468 3283 3324 3455 3538 3578 3624
Percent Change 3.7% 1.0% 4.2% 3.4% 2.0% -5.3% 1.3% 3.9% 2.4% 1.2% 1.3%
November Forecast 3313 3372 3411 3435 3468 3303 3419 3519 3585 3624 3660
Percent Change 6.5% 7.3% 4.8% 2.8% 2.0% -4.8% 3.5% 2.9% 1.9% 1.1% 1.0%
Unemployment Rate (Percent of Labor Force)
March Forecast, Preliminary 6.2 6.8 6.4 6.2 4.3 8.3 6.4 5.2 4.7 4.7 4.9
November Forecast 6.8 6.6 6.5 6.4 4.3 8.4 6.4 5.8 5.4 5.3 5.2
Manufacturing Employment (Thousands)
March Forecast, Preliminary 261.1 261.7 260.1 257.8 293.6 271.6 258.4 255.7 256.9 256.6 256.2
Percent Change -4.6% 1.0% -2.5% -3.4% 2.0% -7.5% -4.9% -1.1% 0.5% -0.1% -0.2%
November Forecast 268.5 266.7 265.0 263.2 293.6 275.1 264.1 264.2 268.2 267.8 266.2
Percent Change -2.5% -2.7% -2.5% -2.7% 2.0% -6.3% -4.0% 0.0% 1.5% -0.1% -0.6%
Construction Employment (Thousands)
March Forecast, Preliminary 218.4 222.2 218.7 216.5 219.3 213.0 217.9 210.4 206.8 207.3 210.6
Percent Change 12.3% 7.1% -6.0% -4.1% 2.9% -2.9% 2.3% -3.5% -1.7% 0.3% 1.6%
November Forecast 217.4 211.8 210.2 208.3 219.3 213.1 209.2 203.7 201.2 200.8 203.3
Percent Change 11.3% -10.0% -2.8% -3.7% 2.9% -2.8% -1.8% -2.6% -1.2% -0.2% 1.2%
Housing Permits (Thousands)
March Forecast, Preliminary 44.4 53.1 50.7 48.3 48.4 44.1 49.7 44.4 43.7 43.8 42.9
Percent Change 17.5% 103.6% -17.0% -17.5% 1.4% -9.0% 12.8% -10.6% -1.8% 0.2% -1.9%
November Forecast 45.5 46.3 45.9 44.9 48.4 44.9 45.2 43.4 42.6 41.2 40.4
Percent Change 17.9% 6.5% -3.1% -8.2% 1.4% -7.4% 0.8% -4.1% -1.7% -3.3% -1.9%
23

U.S. Forecast Comparison Fiscal Years
2020 2021 2022 2023 2024 2025
Real GDP
Billions of 2012 dollars
March Preliminary Forecast 18,677 18,875 19,775 20,313 20,757 21,175
Growth -1.1% 1.1% 4.8% 2.7% 2.2% 2.0%
November Forecast 18,677 18,787 19,435 19,900 20,307 20,702
Growth -1.1% 0.6% 3.4% 2.4% 2.0% 1.9%
Difference in level 0 88 340 412 450 472
Difference in growth forecast 0.0% 0.5% 1.3% 0.3% 0.1% 0.1%
Real Consumption
Billions of 2012 dollars
March Preliminary Forecast 12,908 13,082 13,721 14,091 14,420 14,724
Growth -1.3% 1.3% 4.9% 2.7% 2.3% 2.1%
November Forecast 12,908 13,073 13,515 13,821 14,115 14,398
Growth -1.3% 1.3% 3.4% 2.3% 2.1% 2.0%
Difference in level 0 10 206 270 304 326
Difference in growth forecast 0.0% 0.1% 1.5% 0.4% 0.2% 0.1%
PCE Price Index
2012 = 100
March Preliminary Forecast 110.5 112.3 114.5 116.4 118.5 120.9
Growth 1.3% 1.7% 1.9% 1.6% 1.8% 2.0%
November Forecast 110.5 112.3 114.6 116.5 118.5 120.8
Growth 1.3% 1.6% 2.1% 1.7% 1.7% 1.9%
Difference in level 0.0 0.1 -0.1 -0.2 0.0 0.1
Difference in growth forecast 0.0% 0.1% -0.1% -0.1% 0.1% 0.1%
Unemployment Rate
Percent of Labor Force
March Preliminary Forecast 6.0% 7.0% 5.2% 4.1% 3.9% 4.0%
November Forecast 6.0% 6.9% 5.4% 4.7% 4.5% 4.3%
Difference in forecast 0.0% 0.1% -0.2% -0.6% -0.6% -0.3%
30 Year Fixed Mortgage Rate
Annual Average
March Preliminary Forecast 3.5% 2.9% 3.4% 3.6% 3.9% 4.2%
November Forecast 3.5% 2.9% 3.1% 3.1% 3.2% 3.4%
Difference in forecast 0.0% -0.1% 0.3% 0.5% 0.7% 0.8%
3 Month T-Bill Rate
Annual Average
March Preliminary Forecast 1.2% 0.1% 0.1% 0.2% 0.1% 0.3%
November Forecast 1.2% 0.1% 0.1% 0.1% 0.1% 0.1%
Difference in forecast 0.0% 0.0% -0.1% 0.1% 0.0% 0.2%
24

Washington Forecast Comparison Fiscal Years
2020 2021 2022 2023 2024 2025
Real Personal Income
Billions of 2012 dollars
March Preliminary Forecast 462.9 480.9 468.6 480.1 495.0 509.9
Growth 4.8% 3.9% -2.6% 2.5% 3.1% 3.0%
November Forecast 464.6 467.6 464.0 475.5 488.9 502.3
Growth 5.2% 0.6% -0.8% 2.5% 2.8% 2.7%
Difference in level -1.8 13.3 4.5 4.6 6.1 7.6
Difference in growth forecast -0.4% 3.3% -1.8% 0.0% 0.3% 0.3%
Nominal Personal Income
Billions of dollars
March Preliminary Forecast 511.4 540.3 536.6 558.8 586.5 616.4
Growth 6.2% 5.7% -0.7% 4.1% 4.9% 5.1%
November Forecast 513.4 524.9 531.7 554.3 579.5 606.6
Growth 6.6% 2.3% 1.3% 4.2% 4.5% 4.7%
Difference in level -2.0 15.4 4.9 4.6 7.0 9.8
Difference in growth forecast -0.4% 3.4% -2.0% -0.1% 0.4% 0.4%
Nonfarm Payroll Employment
Thousands
March Preliminary Forecast 3,399.5 3,274.1 3,388.6 3,506.5 3,558.6 3,601.6
Growth -1.0% -3.7% 3.5% 3.5% 1.5% 1.2%
November Forecast 3,403.5 3,339.4 3,472.6 3,556.9 3,604.9 3,642.8
Growth -0.9% -1.9% 4.0% 2.4% 1.3% 1.1%
Difference in level -4.0 -65.3 -84.0 -50.4 -46.3 -41.2
Difference in growth forecast -0.1% -1.8% -0.5% 1.1% 0.1% 0.2%
Housing Permits
Units Authorized, Thousands
March Preliminary Forecast 47.5 47.7 46.3 43.6 44.0 43.2
Growth 3.3% 0.4% -3.0% -5.7% 0.8% -1.8%
November Forecast 48.1 45.4 44.0 42.9 42.0 40.8
Growth 4.7% -5.8% -2.9% -2.6% -2.1% -2.8%
Difference in level -0.6 2.4 2.2 0.7 2.0 2.4
Difference in growth forecast -1.4% 6.1% -0.1% -3.1% 2.9% 1.0%
25
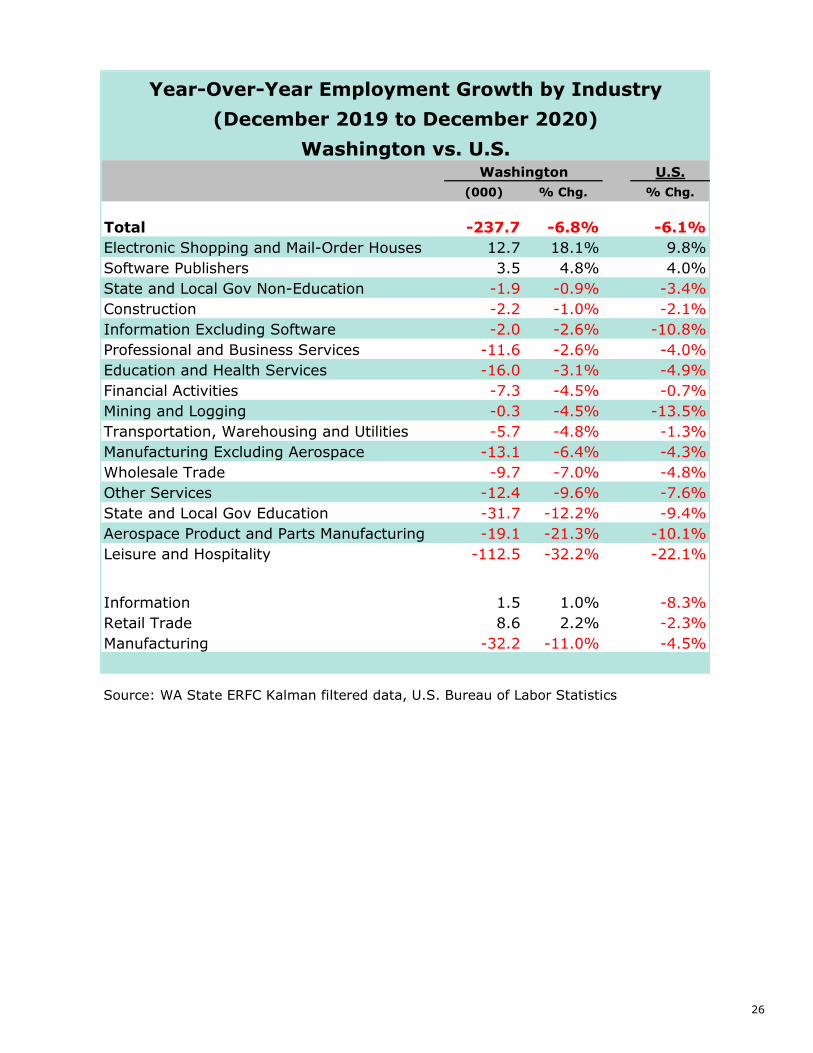
U.S.(000) % Chg. % Chg.
Total -237.7 -6.8% -6.1%Electronic Shopping and Mail-Order Houses 12.7 18.1% 9.8%Software Publishers 3.5 4.8% 4.0%State and Local Gov Non-Education -1.9 -0.9% -3.4%Construction -2.2 -1.0% -2.1%Information Excluding Software -2.0 -2.6% -10.8%Professional and Business Services -11.6 -2.6% -4.0%Education and Health Services -16.0 -3.1% -4.9%Financial Activities -7.3 -4.5% -0.7%Mining and Logging -0.3 -4.5% -13.5%Transportation, Warehousing and Utilities -5.7 -4.8% -1.3%Manufacturing Excluding Aerospace -13.1 -6.4% -4.3%Wholesale Trade -9.7 -7.0% -4.8%Other Services -12.4 -9.6% -7.6%State and Local Gov Education -31.7 -12.2% -9.4%Aerospace Product and Parts Manufacturing -19.1 -21.3% -10.1%Leisure and Hospitality -112.5 -32.2% -22.1%
Information 1.5 1.0% -8.3%Retail Trade 8.6 2.2% -2.3%Manufacturing -32.2 -11.0% -4.5%
Source: WA State ERFC Kalman filtered data, U.S. Bureau of Labor Statistics
Year-Over-Year Employment Growth by Industry(December 2019 to December 2020)
Washington vs. U.S.Washington
26