march 8, 2012 massbio state of the industry biotechnology 2012: the new normal?
TRANSCRIPT

J ohnst on Bl akel y& Company
J ohnst on Bl akel y
& CompanyJ ohnst on Bl akel y
& CompanyJ ohnst on Bl akel y
& Company
J ohnst on Bl akel y
& Company, LLCJ ohnst on Bl akel y
& Company
J ohnst on Bl akel y
& CompanyJ ohnst on Bl akel y
& CompanyJ ohnst on Bl akel y
& Company
J ohnst on Bl akel y
& Company, LLC
March 8, 2012
MassBio State of the Industry
Biotechnology 2012: The New Normal?
Copyright © 2012 All Rights Reserved
J ohnst on Bl akel y& Company
J ohnst on Bl akel y& Company
J ohnst on Bl akel y& Company
J ohnst on Bl akel y& Company
J ohnst on Bl akel y& Company, LLC
J ohnst on Bl akel y& Company
J ohnst on Bl akel y& Company
J ohnst on Bl akel y& Company
J ohnst on Bl akel y& Company
J ohnst on Bl akel y& Company, LLC
2
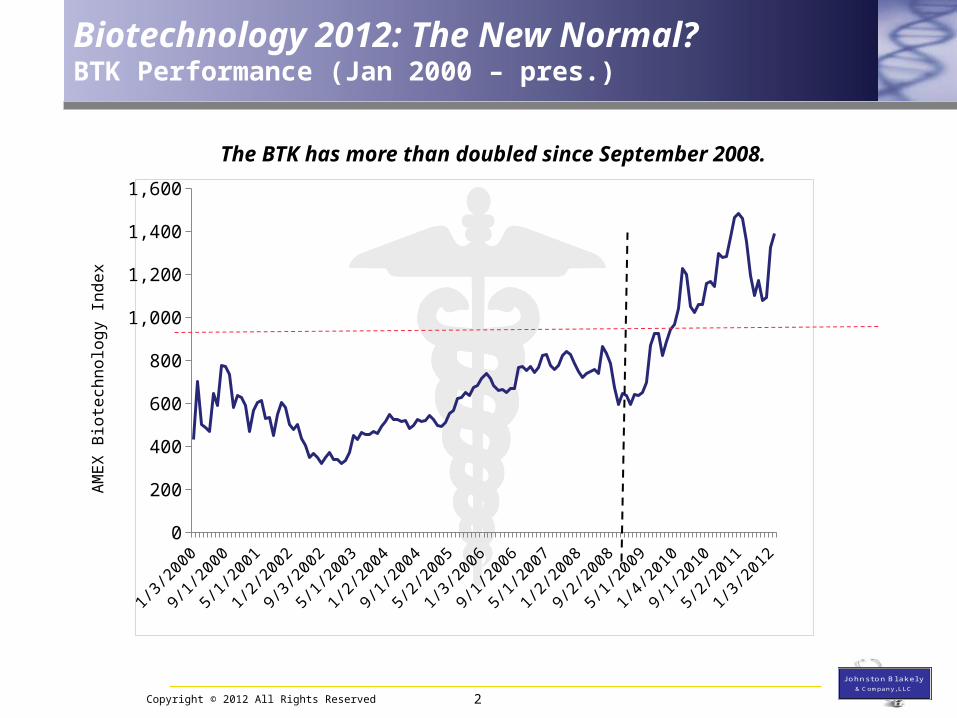
Biotechnology 2012: The New Normal?BTK Performance (Jan 2000 – pres.)
1-Ja
n-00
1-Ju
l-00
1-Ja
n-01
1-Ju
l-01
1-Ja
n-02
1-Ju
l-02
1-Ja
n-03
1-Ju
l-03
1-Ja
n-04
1-Ju
l-04
1-Ja
n-05
1-Ju
l-05
1-Ja
n-06
1-Ju
l-06
1-Ja
n-07
1-Ju
l-07
1-Ja
n-08
1-Ju
l-08
1-Ja
n-09
1-Ju
l-09
1-Ja
n-10
1-Ju
l-10
1-Ja
n-11
1-Ju
l-11
1-Ja
n-12
0
200
400
600
800
1,000
1,200
1,400
1,600
AM
EX
Bio
tech
nolo
gy I
ndex
The BTK has more than doubled since September 2008.

Copyright © 2012 All Rights Reserved
J ohnst on Bl akel y& Company
J ohnst on Bl akel y& Company
J ohnst on Bl akel y& Company
J ohnst on Bl akel y& Company
J ohnst on Bl akel y& Company, LLC
J ohnst on Bl akel y& Company
J ohnst on Bl akel y& Company
J ohnst on Bl akel y& Company
J ohnst on Bl akel y& Company
J ohnst on Bl akel y& Company, LLC
1-Ja
n-01
1-Ju
l-01
1-Ja
n-02
1-Ju
l-02
1-Ja
n-03
1-Ju
l-03
1-Ja
n-04
1-Ju
l-04
1-Ja
n-05
1-Ju
l-05
1-Ja
n-06
1-Ju
l-06
1-Ja
n-07
1-Ju
l-07
1-Ja
n-08
1-Ju
l-08
1-Ja
n-09
1-Ju
l-09
1-Ja
n-10
1-Ju
l-10
1-Ja
n-11
1-Ju
l-11
1-Ja
n-12
0
200
400
600
800
1,000
1,200
1,400
Nas
daq
Bio
tech
nolo
gy I
ndex
Biotechnology 2012: The New Normal?NBI Performance (Jan 2001 – pres.)
The NBI is at its all-time high.

Copyright © 2012 All Rights Reserved
J ohnst on Bl akel y& Company
J ohnst on Bl akel y& Company
J ohnst on Bl akel y& Company
J ohnst on Bl akel y& Company
J ohnst on Bl akel y& Company, LLC
J ohnst on Bl akel y& Company
J ohnst on Bl akel y& Company
J ohnst on Bl akel y& Company
J ohnst on Bl akel y& Company
J ohnst on Bl akel y& Company, LLC
1/1/20
08
3/1/20
08
5/1/20
08
7/1/20
08
9/1/20
08
11/1/
2008
1/1/20
09
3/1/20
09
5/1/20
09
7/1/20
09
9/1/20
09
11/1/
2009
1/1/20
10
3/1/20
10
5/1/20
10
7/1/20
10
9/1/20
10
11/1/
2010
1/1/20
11
3/1/20
11
5/1/20
11
7/1/20
11
9/1/20
11
11/1/
2011
1/1/20
1240.0%
60.0%
80.0%
100.0%
120.0%
140.0%
160.0% NBINasdaqS&P 500
Performance (1/1/11 – pres.)
28.6%
8.0%
4.4%
Biotechnology 2012: The New Normal?Index Performance (Jan 2008 – pres.)
Over the past 12+ months, the biotech sector has outperformed both the technology sector and the broader market.

Copyright © 2012 All Rights Reserved
J ohnst on Bl akel y& Company
J ohnst on Bl akel y& Company
J ohnst on Bl akel y& Company
J ohnst on Bl akel y& Company
J ohnst on Bl akel y& Company, LLC
J ohnst on Bl akel y& Company
J ohnst on Bl akel y& Company
J ohnst on Bl akel y& Company
J ohnst on Bl akel y& Company
J ohnst on Bl akel y& Company, LLC
Biotechnology 2012: The New Normal?Recent Headlines
“Ambit Withdraws IPO, Cites Market Conditions”
“Biotech IPO Forecast for 2012 Expected to Remain Chilly”
“Biotech funding hits four-year high as startups suffer”
“Prospect Venture Dumps Latest Fund, Won’t Make New Biotech Bets”
- Bloomberg (Jan 2012)
- Xconomy (June 2011)
- GEN (Jan 2012)
- Fierce Biotech (Oct 2011)
Despite the sector’s performance, indications of troubled times abound.
Biotechnology 2012: The New Normal?
Pharma Industry Perspectives
Copyright © 2012 All Rights Reserved
J ohnst on Bl akel y& Company
J ohnst on Bl akel y& Company
J ohnst on Bl akel y& Company
J ohnst on Bl akel y& Company
J ohnst on Bl akel y& Company, LLC
J ohnst on Bl akel y& Company
J ohnst on Bl akel y& Company
J ohnst on Bl akel y& Company
J ohnst on Bl akel y& Company
J ohnst on Bl akel y& Company, LLC
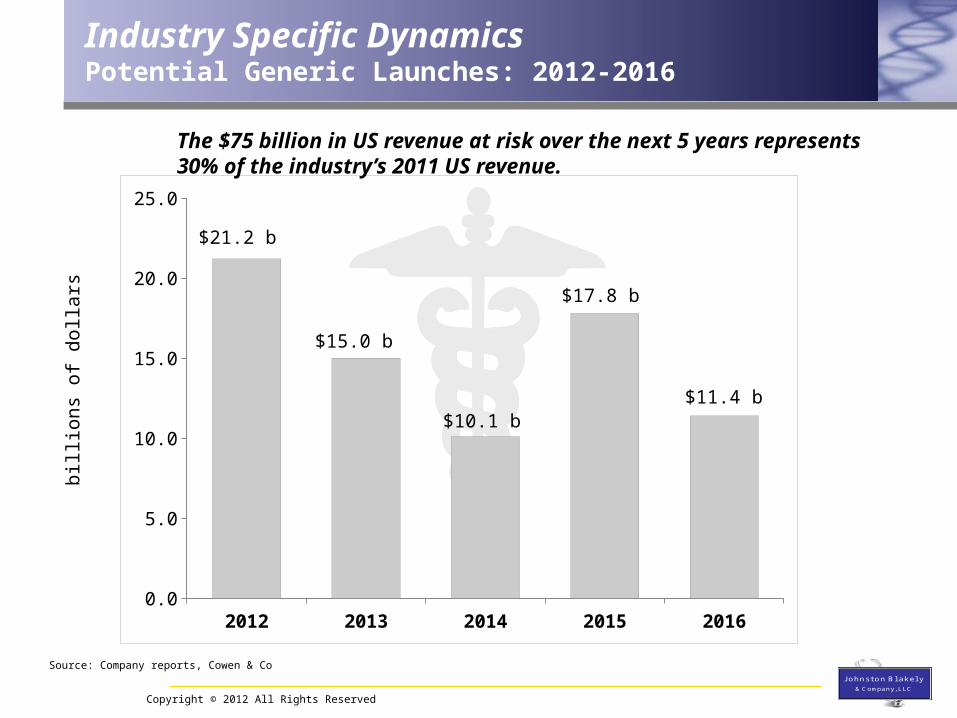
Industry Specific DynamicsPotential Generic Launches: 2012-2016
2012 2013 2014 2015 20160.0
5.0
10.0
15.0
20.0
25.0
bill
ions
of
doll
ars
$21.2 b
Source: Company reports, Cowen & Co
$10.1 b
$15.0 b
$17.8 b
$11.4 b
The $75 billion in US revenue at risk over the next 5 years represents 30% of the industry’s 2011 US revenue.
Copyright © 2012 All Rights Reserved
J ohnst on Bl akel y& Company
J ohnst on Bl akel y& Company
J ohnst on Bl akel y& Company
J ohnst on Bl akel y& Company
J ohnst on Bl akel y& Company, LLC
J ohnst on Bl akel y& Company
J ohnst on Bl akel y& Company
J ohnst on Bl akel y& Company
J ohnst on Bl akel y& Company
J ohnst on Bl akel y& Company, LLC
1999 2000 2001 2002 2003 2004 2004 2006 2007 2008 2009 20100.0
10.0
20.0
30.0
40.0
50.0$
tota
l R&
D e
xpen
ditu
re s
(b$
)
$3,000
$2,500
$2.000
$1,500
$1.000
$500
$0
R&
D cost per N
ME
($mm
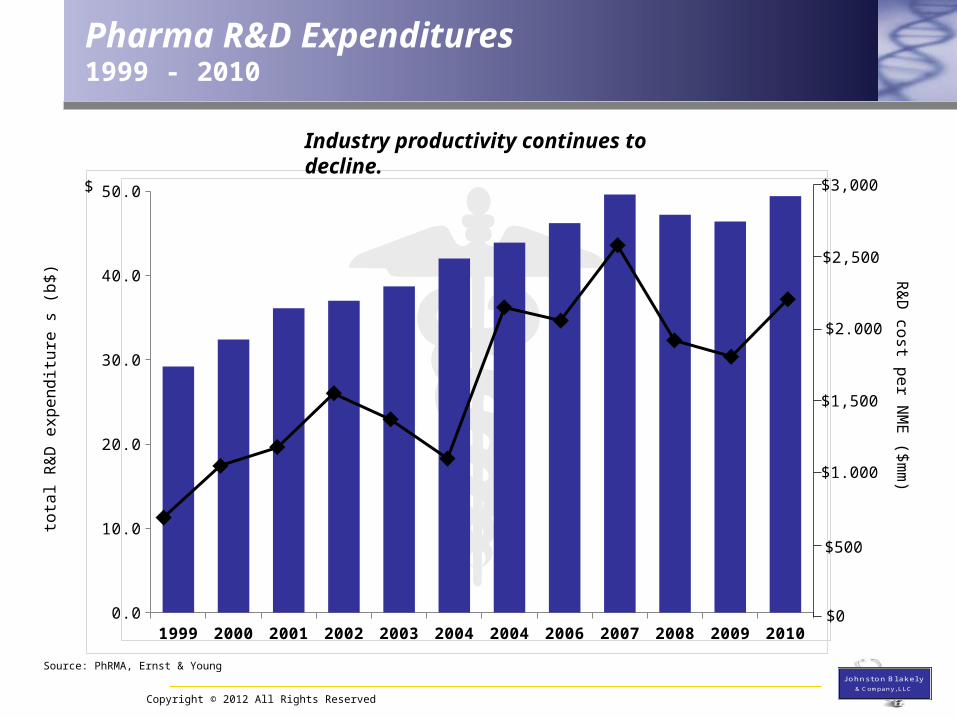
)Pharma R&D Expenditures1999 - 2010
Industry productivity continues to decline.
Source: PhRMA, Ernst & Young

Copyright © 2012 All Rights Reserved
J ohnst on Bl akel y& Company
J ohnst on Bl akel y& Company
J ohnst on Bl akel y& Company
J ohnst on Bl akel y& Company
J ohnst on Bl akel y& Company, LLC
J ohnst on Bl akel y& Company
J ohnst on Bl akel y& Company
J ohnst on Bl akel y& Company
J ohnst on Bl akel y& Company
J ohnst on Bl akel y& Company, LLC
1989 1999 2000 2001 2002 2003 2004 2005 2006 2007 2008 2009 2010E
0.0%
20.0%
40.0%
60.0%
80.0%
100.0%
Pre/non clinical %: 51.0% 44.0% 39.0% 32.0% 25.9% 25.7% 27.2%
Pe
rce
nt
of
tota
l R&
D e
xpen
ditu
res
Pharma R&D Expenditures1989 – 2010E (by function)
• Pre/non clinical
• Ph I – III clinicals
• Post-approval studies
• Regulatory/ other
Source: PhRMA,Note: Pre/non-clinical category includes process development, QC and formulation related expenditures.
32.5% 31.9% 27.3% 27.0%
$29.2 B $32.4 B $36.1 B $37.0 B $38.7 B $42.0 B $43.8 B $46.2 B $49.6 B $47.2 B $46.4 B $49.4 B
25.2% 24.3%

Copyright © 2012 All Rights Reserved
J ohnst on Bl akel y& Company
J ohnst on Bl akel y& Company
J ohnst on Bl akel y& Company
J ohnst on Bl akel y& Company
J ohnst on Bl akel y& Company, LLC
J ohnst on Bl akel y& Company
J ohnst on Bl akel y& Company
J ohnst on Bl akel y& Company
J ohnst on Bl akel y& Company
J ohnst on Bl akel y& Company, LLC
1997 1998 1999 2000 2001 2002 2003 2004 2005 2006 2007 2008 2009 2010 20110.0%
20.0%
40.0%
60.0%
80.0%
100.0%
Per
cent
of a
nnua
l new
dru
g ap
prov
al
21 3949 40 43 38 33 31 41 45
Bio/Specialty Pharma:Large Pharma:
66.7%33.3%
74.4%25.6%
40.8%59.2%
42.5%57.5%
51.2%48.8%
57.9%42.1%
39.4%60.6%
48.4%51.6%
70.7%29.3%
84.4%15.6%
Source: PhRMA, BIO, FDALarge Pharma Bio/specialty pharma
35 4335
80.0%20.0%
76.7%23.3%
60.0%40.0%
31 36
74.2%25.8%
58.3%41.7%
Pharmaceutical InnovationRelative New Therapeutic Contributions (1997 – 2011)
Copyright © 2012 All Rights Reserved
J ohnst on Bl akel y& Company
J ohnst on Bl akel y& Company
J ohnst on Bl akel y& Company
J ohnst on Bl akel y& Company
J ohnst on Bl akel y& Company, LLC
J ohnst on Bl akel y& Company
J ohnst on Bl akel y& Company
J ohnst on Bl akel y& Company
J ohnst on Bl akel y& Company
J ohnst on Bl akel y& Company, LLC
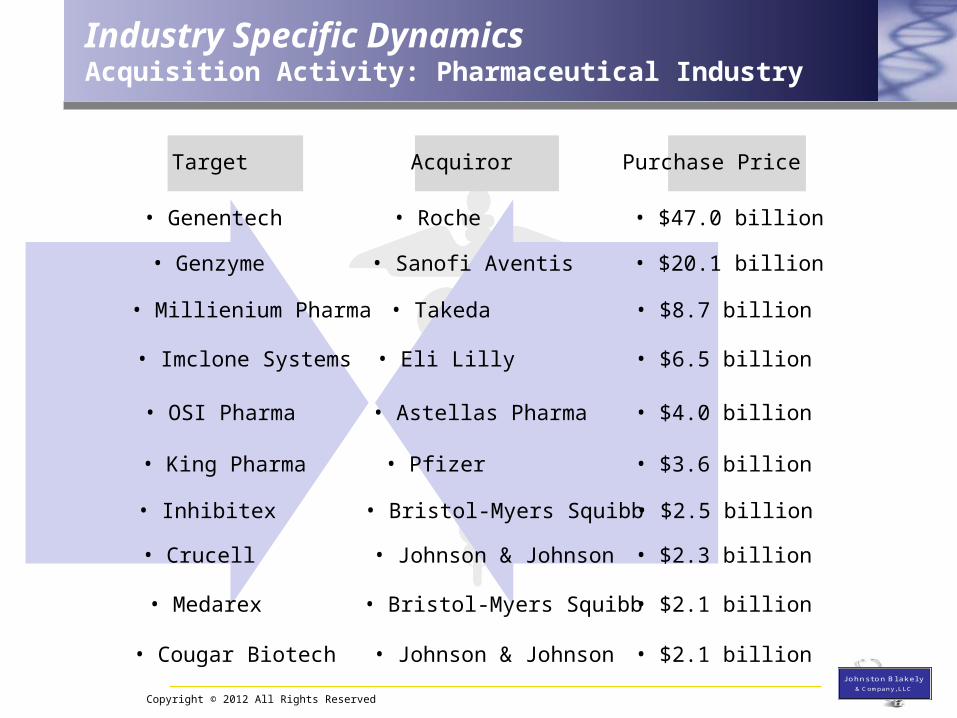
Target Acquiror Purchase Price
• Genentech • Roche • $47.0 billion
• Genzyme • Sanofi Aventis • $20.1 billion
• Millienium Pharma • Takeda • $8.7 billion
• OSI Pharma • Astellas Pharma • $4.0 billion
• King Pharma • Pfizer • $3.6 billion
• Crucell • Johnson & Johnson • $2.3 billion
• Medarex • Bristol-Myers Squibb • $2.1 billion
• Imclone Systems • Eli Lilly • $6.5 billion
• Cougar Biotech • Johnson & Johnson • $2.1 billion
Industry Specific DynamicsAcquisition Activity: Pharmaceutical Industry
• Inhibitex • Bristol-Myers Squibb • $2.5 billion
Copyright © 2012 All Rights Reserved
J ohnst on Bl akel y& Company
J ohnst on Bl akel y& Company
J ohnst on Bl akel y& Company
J ohnst on Bl akel y& Company
J ohnst on Bl akel y& Company, LLC
J ohnst on Bl akel y& Company
J ohnst on Bl akel y& Company
J ohnst on Bl akel y& Company
J ohnst on Bl akel y& Company
J ohnst on Bl akel y& Company, LLC
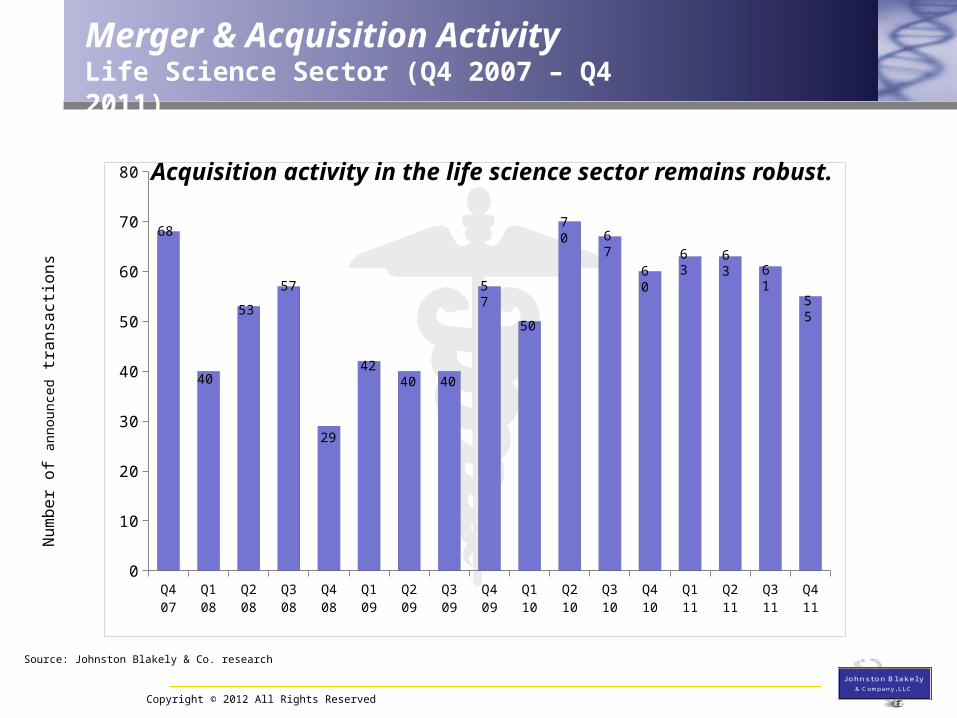
Q4 07 Q1 08 Q2 08 Q3 08 Q4 08 Q1 09 Q2 09 Q3 09 Q4 09 Q1 10 Q2 10 Q3 10 Q4 10 Q1 11 Q2 11 Q3 11 Q4 110
10
20
30
40
50
60
70
80
Num
ber
of a
nnou
nced
tran
sact
ions
Source: Johnston Blakely & Co. research
68
40
53
57
4240 40
57
50
70
29
Merger & Acquisition ActivityLife Science Sector (Q4 2007 – Q4 2011)
67
6063 63
61
55
Acquisition activity in the life science sector remains robust.

Copyright © 2012 All Rights Reserved
J ohnst on Bl akel y& Company
J ohnst on Bl akel y& Company
J ohnst on Bl akel y& Company
J ohnst on Bl akel y& Company
J ohnst on Bl akel y& Company, LLC
J ohnst on Bl akel y& Company
J ohnst on Bl akel y& Company
J ohnst on Bl akel y& Company
J ohnst on Bl akel y& Company
J ohnst on Bl akel y& Company, LLC
Pharmaceutical InnovationEscalating Risk Profiles
Clinical Risk
Regulatory RiskReimbursement
Risk• outcomes-based pricing• comparative effectiveness
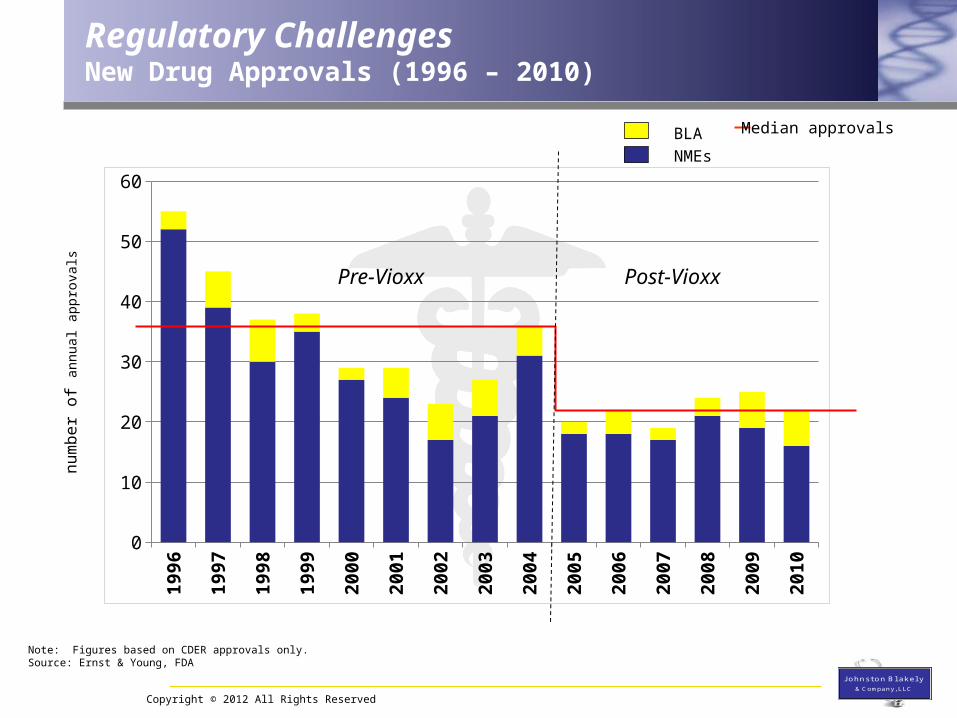
• significant drop in post Vioxx approvals
• increasing approval times
ReimbursementDevelopment Costs
Copyright © 2012 All Rights Reserved
J ohnst on Bl akel y& Company
J ohnst on Bl akel y& Company
J ohnst on Bl akel y& Company
J ohnst on Bl akel y& Company
J ohnst on Bl akel y& Company, LLC
J ohnst on Bl akel y& Company
J ohnst on Bl akel y& Company
J ohnst on Bl akel y& Company
J ohnst on Bl akel y& Company
J ohnst on Bl akel y& Company, LLC
Regulatory ChallengesNew Drug Approvals (1996 – 2010)
1996
1997
1998
1999
2000
2001
2002
2003
2004
2005
2006
2007
2008
2009
2010
0
10
20
30
40
50
60NMEs
BLA Median approvals
Post-VioxxPre-Vioxx
Note: Figures based on CDER approvals only.Source: Ernst & Young, FDA
num
ber
of a
nnua
l app
rova
ls

Copyright © 2012 All Rights Reserved
J ohnst on Bl akel y& Company
J ohnst on Bl akel y& Company
J ohnst on Bl akel y& Company
J ohnst on Bl akel y& Company
J ohnst on Bl akel y& Company, LLC
J ohnst on Bl akel y& Company
J ohnst on Bl akel y& Company
J ohnst on Bl akel y& Company
J ohnst on Bl akel y& Company
J ohnst on Bl akel y& Company, LLC
Reimbursement ChallengesCase Study: Dendreon
1-Ju
n-11
13-Ju
n-11
25-Ju
n-11
7-Ju
l-11
19-Ju
l-11
31-Ju
l-11
12-A
ug-1
1
24-A
ug-1
1
5-Sep
-11
17-S
ep-1
1
29-S
ep-1
1
11-O
ct-11
23-O
ct-11
4-Nov
-11
16-N
ov-1
1
28-N
ov-1
1
10-D
ec-1
1
22-D
ec-1
1
3-Ja
n-12
15-Ja
n-12
27-Ja
n-12
8-Feb
-12
20-F
eb-1
2
3-M
ar-12
$0.00
$5.00
$10.00
$15.00
$20.00
$25.00
$30.00
$35.00
$40.00
$45.00
pric
e pe
r sh
are
• Provenge sales guidance withdrawn• reimbursement concerns• inability to identify eligible patients

Biotechnology 2012: The New Normal?
Capital Markets Perspectives
Copyright © 2012 All Rights Reserved
J ohnst on Bl akel y& Company
J ohnst on Bl akel y& Company
J ohnst on Bl akel y& Company
J ohnst on Bl akel y& Company
J ohnst on Bl akel y& Company, LLC
J ohnst on Bl akel y& Company
J ohnst on Bl akel y& Company
J ohnst on Bl akel y& Company
J ohnst on Bl akel y& Company
J ohnst on Bl akel y& Company, LLC
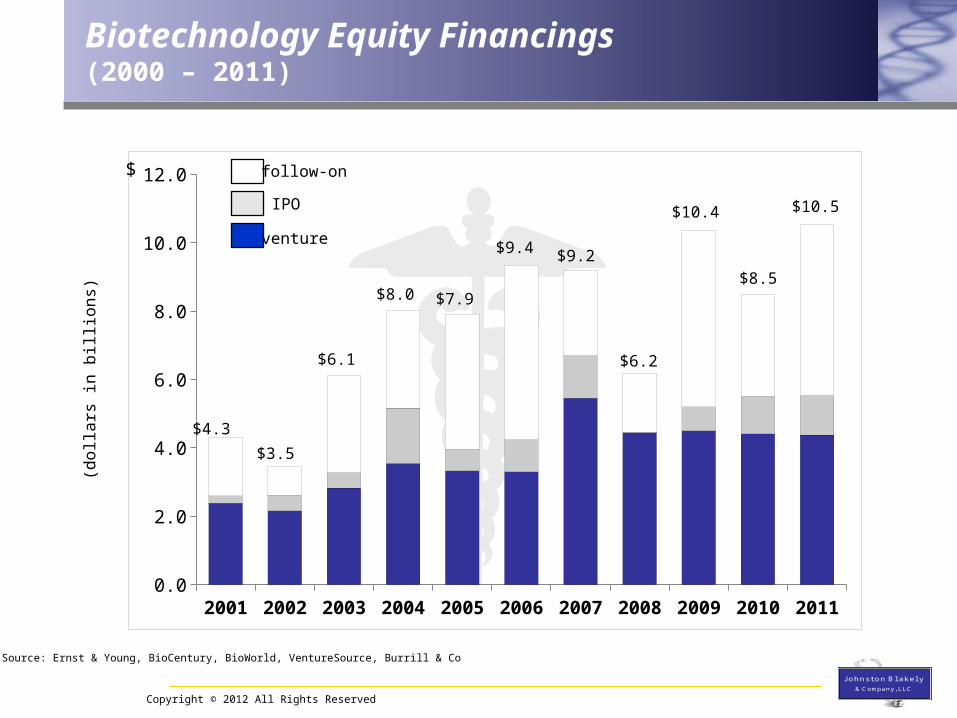
Biotechnology Equity Financings(2000 – 2011)
2001 2002 2003 2004 2005 2006 2007 2008 2009 2010 20110.0
2.0
4.0
6.0
8.0
10.0
12.0$
(dol
lars
in b
illi
ons)
venture
follow-on
IPO
$4.3
$3.5
$6.1
$8.0 $7.9
$9.4 $9.2
$6.2
$10.4
$8.5
Source: Ernst & Young, BioCentury, BioWorld, VentureSource, Burrill & Co
$10.5

Copyright © 2012 All Rights Reserved
J ohnst on Bl akel y& Company
J ohnst on Bl akel y& Company
J ohnst on Bl akel y& Company
J ohnst on Bl akel y& Company
J ohnst on Bl akel y& Company, LLC
J ohnst on Bl akel y& Company
J ohnst on Bl akel y& Company
J ohnst on Bl akel y& Company
J ohnst on Bl akel y& Company
J ohnst on Bl akel y& Company, LLC
2000 2001 2002 2003 2004 2005 2006 2007 2008 2009 2010 2011$0
$1,000
$2,000
$3,000
$4,000
$5,000
$6,000
$7,000
Capital Market ReviewVenture Investment: Biotechnology (2000 – 2011)
Note: Dollar amounts adjusted to reflect 2011 dollarSource: Thomson Reuters; PwC Moneyytree
(dol
lars
in m
illi
ons)
$5.2b
$4.1b$4.0b
$4.4b$4.3b
$5.0b $5.0b
$6.2b
$3.9b $3.9b
$4.7b$4.8b $4.6 billion
Measured in constant dollar terms, venture investment in biotechnology has remained relatively consistent for more than a decade.
Copyright © 2012 All Rights Reserved
J ohnst on Bl akel y& Company
J ohnst on Bl akel y& Company
J ohnst on Bl akel y& Company
J ohnst on Bl akel y& Company
J ohnst on Bl akel y& Company, LLC
J ohnst on Bl akel y& Company
J ohnst on Bl akel y& Company
J ohnst on Bl akel y& Company
J ohnst on Bl akel y& Company
J ohnst on Bl akel y& Company, LLC
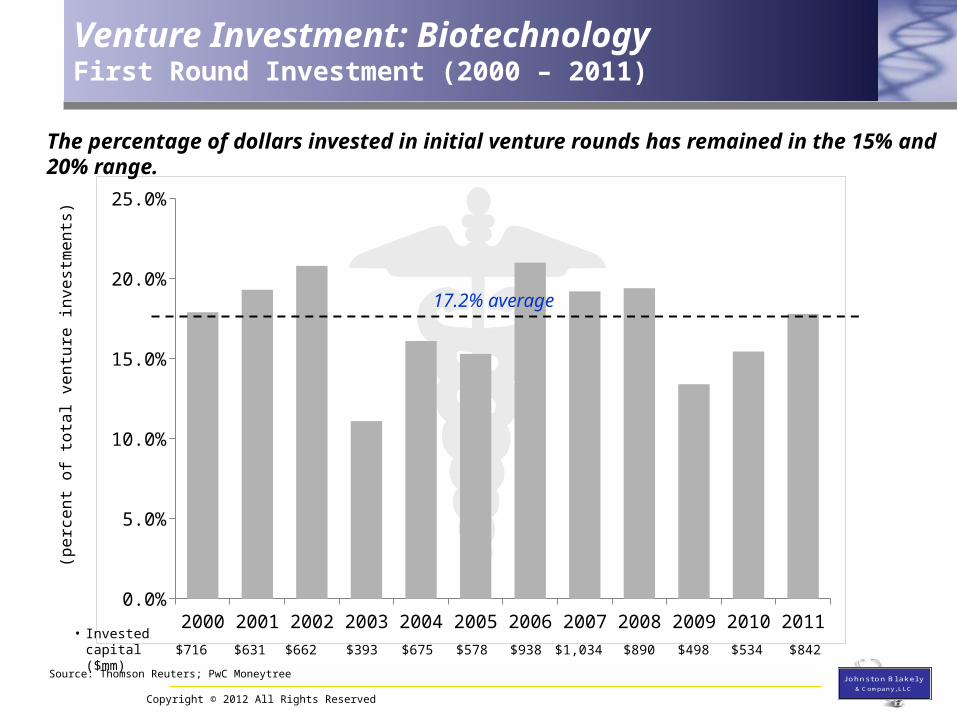
Venture Investment: BiotechnologyFirst Round Investment (2000 – 2011)
2000 2001 2002 2003 2004 2005 2006 2007 2008 2009 2010 20110.0%
5.0%
10.0%
15.0%
20.0%
25.0%
17.2% average
(per
cent
of
tota
l ven
ture
inve
stm
ents
)
$716 $631 $662 $393 $675 $578 $938 $1,034 $890 $498 $534 $842
Source: Thomson Reuters; PwC Moneytree
The percentage of dollars invested in initial venture rounds has remained in the 15% and 20% range.
• Invested capital ($mm)
Copyright © 2012 All Rights Reserved
J ohnst on Bl akel y& Company
J ohnst on Bl akel y& Company
J ohnst on Bl akel y& Company
J ohnst on Bl akel y& Company
J ohnst on Bl akel y& Company, LLC
J ohnst on Bl akel y& Company
J ohnst on Bl akel y& Company
J ohnst on Bl akel y& Company
J ohnst on Bl akel y& Company
J ohnst on Bl akel y& Company, LLC
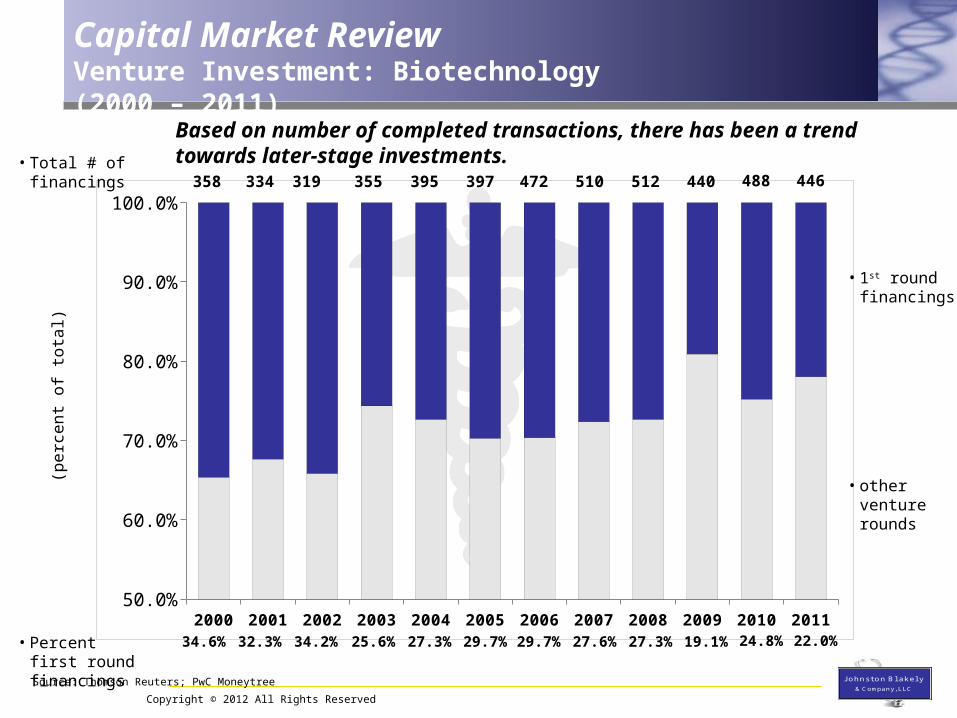
Capital Market ReviewVenture Investment: Biotechnology (2000 – 2011)
2000 2001 2002 2003 2004 2005 2006 2007 2008 2009 2010 201150.0%
60.0%
70.0%
80.0%
90.0%
100.0%
(per
cent
of
tota
l)
512 440358 334 319 355 395 397 472 510 446488
• Percent first round financings
27.3% 19.1%34.6% 32.3% 34.2% 25.6% 27.3% 29.7% 29.7% 27.6% 22.0%24.8%
• Total # of financings
Source: Thomson Reuters; PwC Moneytree
Based on number of completed transactions, there has been a trend towards later-stage investments.
• 1st round financings
• other venture rounds
Copyright © 2012 All Rights Reserved
J ohnst on Bl akel y& Company
J ohnst on Bl akel y& Company
J ohnst on Bl akel y& Company
J ohnst on Bl akel y& Company
J ohnst on Bl akel y& Company, LLC
J ohnst on Bl akel y& Company
J ohnst on Bl akel y& Company
J ohnst on Bl akel y& Company
J ohnst on Bl akel y& Company
J ohnst on Bl akel y& Company, LLC
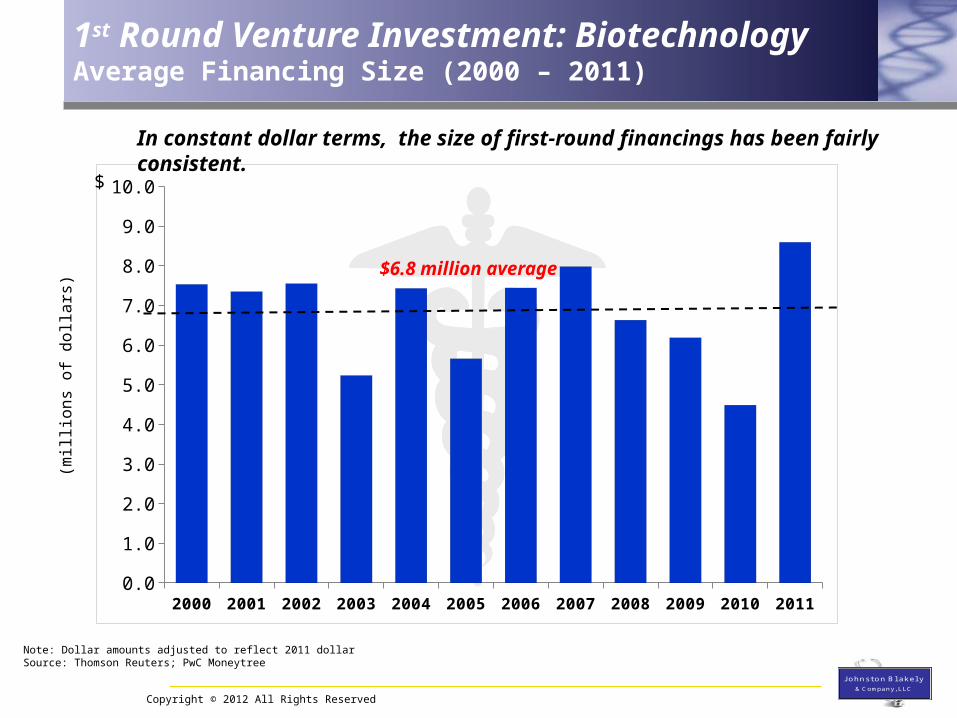
1st Round Venture Investment: BiotechnologyAverage Financing Size (2000 – 2011)
Note: Dollar amounts adjusted to reflect 2011 dollarSource: Thomson Reuters; PwC Moneytree
2000 2001 2002 2003 2004 2005 2006 2007 2008 2009 2010 20110.0
1.0
2.0
3.0
4.0
5.0
6.0
7.0
8.0
9.0
10.0$
$6.8 million average
(mil
lion
s of
dol
lars
)
In constant dollar terms, the size of first-round financings has been fairly consistent.

Copyright © 2012 All Rights Reserved
J ohnst on Bl akel y& Company
J ohnst on Bl akel y& Company
J ohnst on Bl akel y& Company
J ohnst on Bl akel y& Company
J ohnst on Bl akel y& Company, LLC
J ohnst on Bl akel y& Company
J ohnst on Bl akel y& Company
J ohnst on Bl akel y& Company
J ohnst on Bl akel y& Company
J ohnst on Bl akel y& Company, LLC
Venture Investment: BiotechnologyNet Cash Flows (2005 – 2011)
Series1
-$5,000
-$4,000
-$3,000
-$2,000
-$1,000
$0
$1,000
$2,000
(dol
lars
in m
illi
ons)
2005 2006 2007 2008 2009 2010 2011
Ven
ture
Exi
tsV
entu
re I
nve
stm
ents
$0.3b $1.1b
($3.8b) ($4.5b) ($5.8b) ($3.7b)($4.6b)
More recently, venture realizations have outpaced dollars invested.
Note: Venture exit totals include dollars from IPO and disclosed M&A activity.Source: Thomson Reuters; NVCA
Copyright © 2012 All Rights Reserved
J ohnst on Bl akel y& Company
J ohnst on Bl akel y& Company
J ohnst on Bl akel y& Company
J ohnst on Bl akel y& Company
J ohnst on Bl akel y& Company, LLC
J ohnst on Bl akel y& Company
J ohnst on Bl akel y& Company
J ohnst on Bl akel y& Company
J ohnst on Bl akel y& Company
J ohnst on Bl akel y& Company, LLC
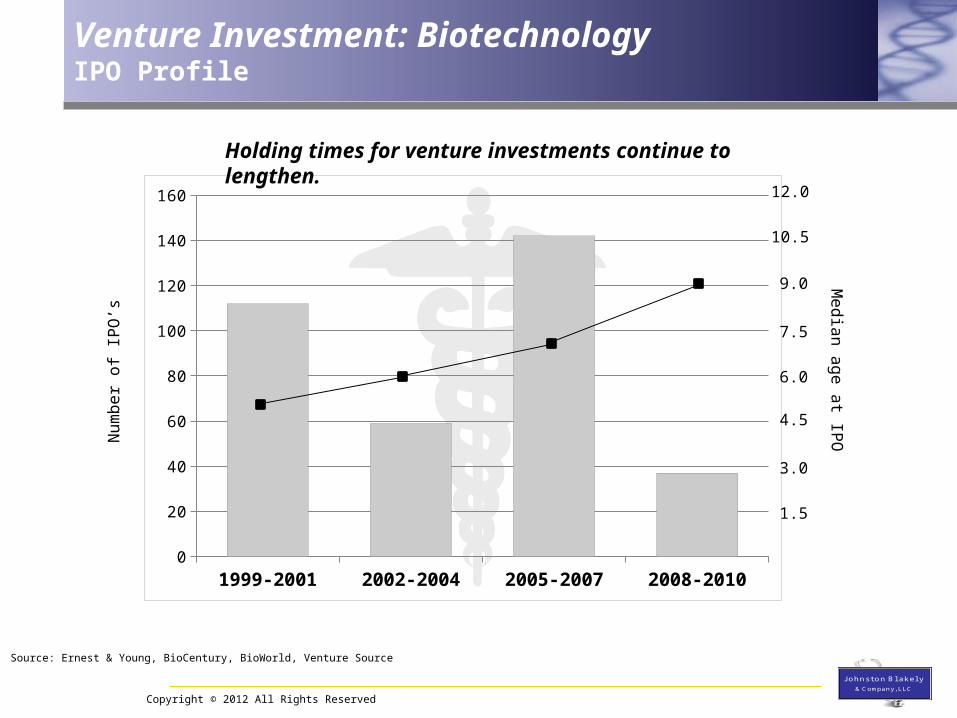
Venture Investment: BiotechnologyIPO Profile
1999-2001 2002-2004 2005-2007 2008-20100
20
40
60
80
100
120
140
160
1.5
3.0
4.5
6.0
7.5
9.0
10.5
12.0
Num
ber
of I
PO
’sM
edian age at IPO
Source: Ernest & Young, BioCentury, BioWorld, Venture Source
Holding times for venture investments continue to lengthen.
Copyright © 2012 All Rights Reserved
J ohnst on Bl akel y& Company
J ohnst on Bl akel y& Company
J ohnst on Bl akel y& Company
J ohnst on Bl akel y& Company
J ohnst on Bl akel y& Company, LLC
J ohnst on Bl akel y& Company
J ohnst on Bl akel y& Company
J ohnst on Bl akel y& Company
J ohnst on Bl akel y& Company
J ohnst on Bl akel y& Company, LLC
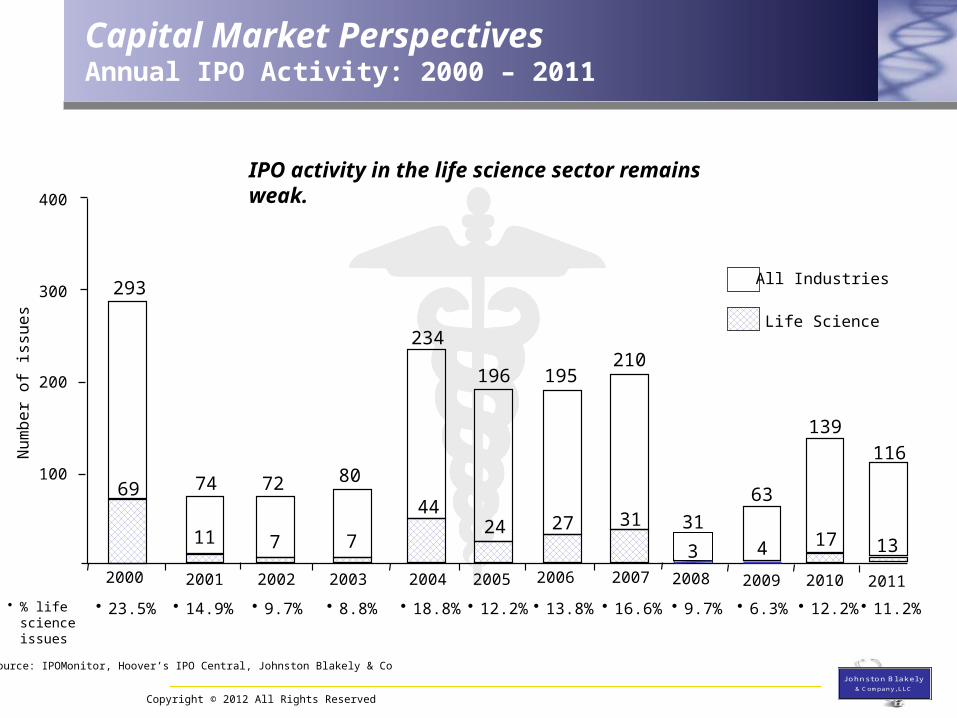
Nu
mb
er
of
issu
es
• % life science issues
• 23.5% • 14.9% • 9.7% • 8.8%
All Industries
Life Science
Capital Market PerspectivesAnnual IPO Activity: 2000 – 2011
293
74 72 8069
11 7 7
234
44
• 18.8%
Source: IPOMonitor, Hoover’s IPO Central, Johnston Blakely & Co
100
200
300
400
2000 2001 2002 2003 2004
196
• 12.2%
2005
24
195
27
• 13.8%
2006
210
• 16.6%
2007
31 31
2008
3
• 9.7% • 6.3% • 12.2%
139
17
2010
4
2009
63
2011
116
13
• 11.2%
IPO activity in the life science sector remains weak.
Copyright © 2012 All Rights Reserved
J ohnst on Bl akel y& Company
J ohnst on Bl akel y& Company
J ohnst on Bl akel y& Company
J ohnst on Bl akel y& Company
J ohnst on Bl akel y& Company, LLC
J ohnst on Bl akel y& Company
J ohnst on Bl akel y& Company
J ohnst on Bl akel y& Company
J ohnst on Bl akel y& Company
J ohnst on Bl akel y& Company, LLC
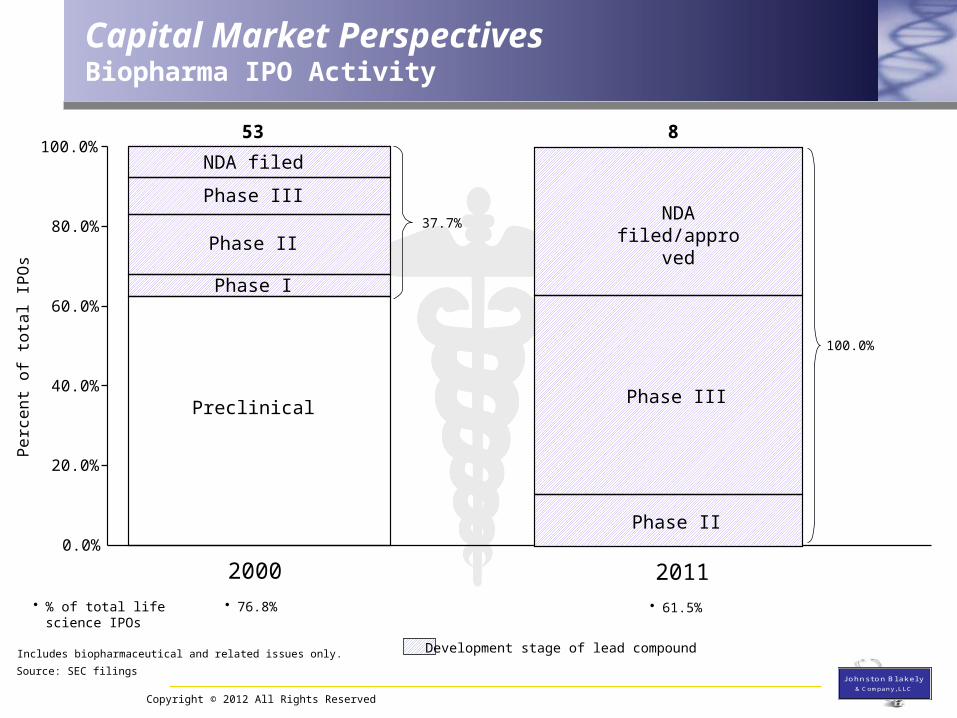
Capital Market PerspectivesBiopharma IPO Activity
0.0%
20.0%
40.0%
60.0%
80.0%
100.0%
2000
53
Preclinical
Phase I
Phase II
Phase III
NDA filed
37.7%
Pe
rce
nt
of
tota
l IP
Os
Source: SEC filings
Note: Includes biopharmaceutical and related issues only. Development stage of lead compound
• % of total life science IPOs
• 76.8%
100.0%
2011
Phase II
Phase III
• 61.5%
8
NDA filed/approved
Copyright © 2012 All Rights Reserved
J ohnst on Bl akel y& Company
J ohnst on Bl akel y& Company
J ohnst on Bl akel y& Company
J ohnst on Bl akel y& Company
J ohnst on Bl akel y& Company, LLC
J ohnst on Bl akel y& Company
J ohnst on Bl akel y& Company
J ohnst on Bl akel y& Company
J ohnst on Bl akel y& Company
J ohnst on Bl akel y& Company, LLC
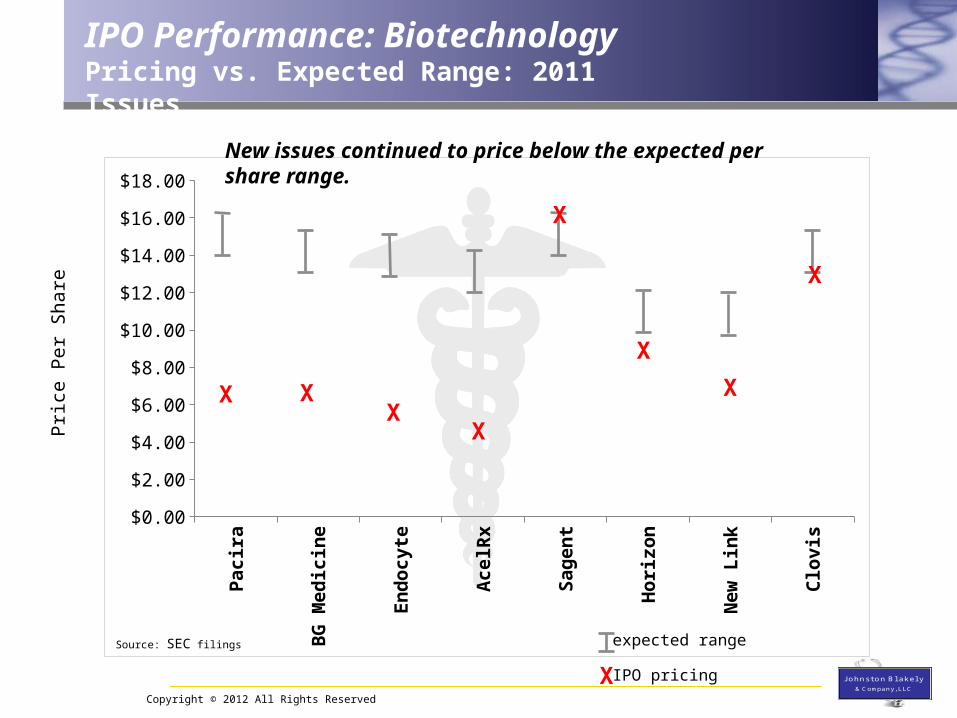
IPO Performance: BiotechnologyPricing vs. Expected Range: 2011 Issues
Pac
ira
BG
Med
icin
e
En
doc
yte
Ace
lRx
Sag
ent
Hor
izon
New
Lin
k
Clo
vis$0.00
$2.00
$4.00
$6.00
$8.00
$10.00
$12.00
$14.00
$16.00
$18.00
XX
X
X
X
X
X
X
Source: SEC filings
Pri
ce P
er S
hare
X
expected range
IPO pricing
New issues continued to price below the expected per share range.
Copyright © 2012 All Rights Reserved
J ohnst on Bl akel y& Company
J ohnst on Bl akel y& Company
J ohnst on Bl akel y& Company
J ohnst on Bl akel y& Company
J ohnst on Bl akel y& Company, LLC
J ohnst on Bl akel y& Company
J ohnst on Bl akel y& Company
J ohnst on Bl akel y& Company
J ohnst on Bl akel y& Company
J ohnst on Bl akel y& Company, LLC
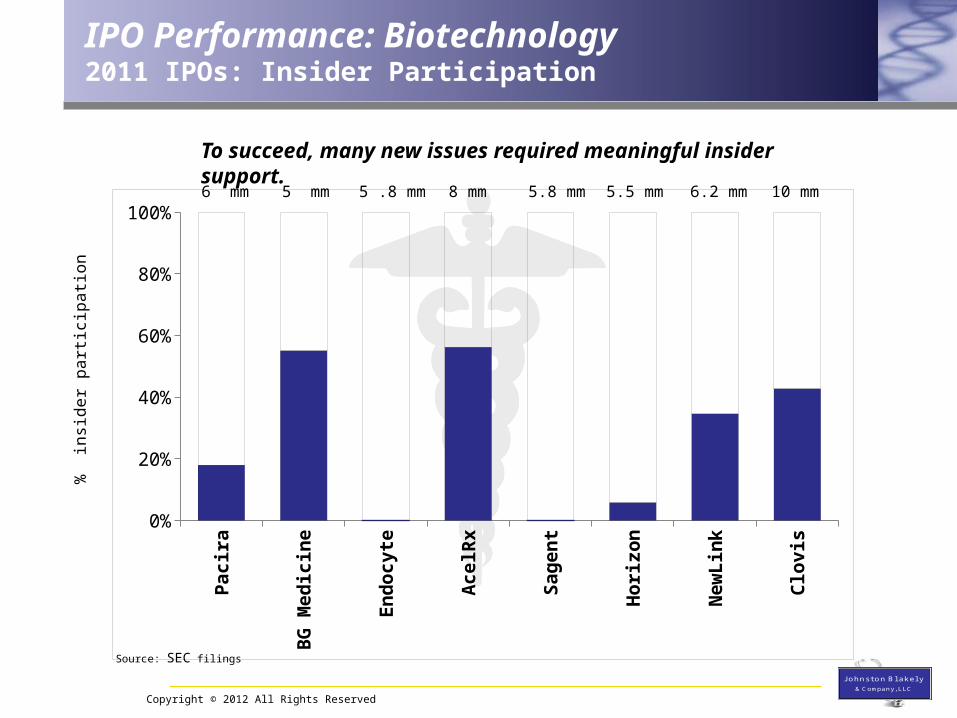
IPO Performance: Biotechnology2011 IPOs: Insider Participation
Pac
ira
BG
Med
icin
e
En
doc
yte
Ace
lRx
Sag
ent
Hor
izon
New
Lin
k
Clo
vis0%
20%
40%
60%
80%
100%
% i
nsid
er p
arti
cipa
tion
6 mm 5 mm 5 .8 mm 8 mm 5.8 mm 5.5 mm 6.2 mm 10 mm
Source: SEC filings
To succeed, many new issues required meaningful insider support.

Copyright © 2012 All Rights Reserved
J ohnst on Bl akel y& Company
J ohnst on Bl akel y& Company
J ohnst on Bl akel y& Company
J ohnst on Bl akel y& Company
J ohnst on Bl akel y& Company, LLC
J ohnst on Bl akel y& Company
J ohnst on Bl akel y& Company
J ohnst on Bl akel y& Company
J ohnst on Bl akel y& Company
J ohnst on Bl akel y& Company, LLC
IPO Performance: Biotechnology2010 – 2011 Issues
CL
VS
PC
RX
SGN
T
TZ
YM
NL
NK
BG
MD
EC
YT
HZ
NP
AE
GR
AN
AC
AV
EO
IRW
D
TSR
X
AN
TH
ZG
NX
GN
OM
AL
IM
PA
CB
TN
GN
CR
MD
-100.0%
-75.0%
-50.0%
-25.0%
0.0%
25.0%
50.0%
75.0%
100.0%
Per
Shar
e Pe
rfor
man
ce P
ost I
PO
Class of 2011 Class of 2010
• Aggregate return 17.4 % (19.0 %)
Note: Aggregate return represents collective return from one share of each new issue.

Biotechnology 2012: The New Normal?
The New Normal?
Copyright © 2012 All Rights Reserved
J ohnst on Bl akel y& Company
J ohnst on Bl akel y& Company
J ohnst on Bl akel y& Company
J ohnst on Bl akel y& Company
J ohnst on Bl akel y& Company, LLC
J ohnst on Bl akel y& Company
J ohnst on Bl akel y& Company
J ohnst on Bl akel y& Company
J ohnst on Bl akel y& Company
J ohnst on Bl akel y& Company, LLC
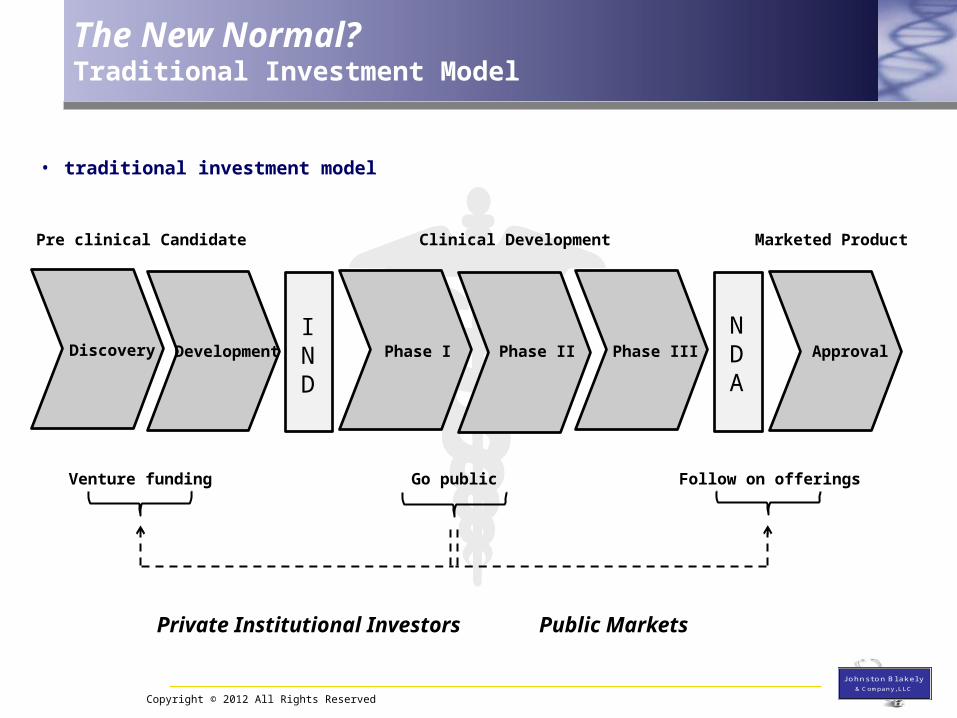
The New Normal?Traditional Investment Model
IND
NDA
Discovery Development Phase I Phase II Phase III Approval
Pre clinical Candidate Clinical Development Marketed Product
Go publicVenture funding
• traditional investment model
Follow on offerings
Private Institutional Investors Public Markets

Copyright © 2012 All Rights Reserved
J ohnst on Bl akel y& Company
J ohnst on Bl akel y& Company
J ohnst on Bl akel y& Company
J ohnst on Bl akel y& Company
J ohnst on Bl akel y& Company, LLC
J ohnst on Bl akel y& Company
J ohnst on Bl akel y& Company
J ohnst on Bl akel y& Company
J ohnst on Bl akel y& Company
J ohnst on Bl akel y& Company, LLC
The New Normal?Sector Influences
Transitioning from revolutionary advances to evolutionary advances− sign of continuing maturation of the industry
− M&A activity blurs of sector boundaries
Less public market enthusiasm for hope/hype.− increasing attention on products and profits
Primary interest of big pharma is ability to leverage downstream capabilities.
− biopharma sector continued to be viewed as outsourced R&D function.
− resource allocation (of necessity) skewed towards later stage candidates.
Venture investors required to adjust their investment horizon – and their exit strategy - accordingly.

Copyright © 2012 All Rights Reserved
J ohnst on Bl akel y& Company
J ohnst on Bl akel y& Company
J ohnst on Bl akel y& Company
J ohnst on Bl akel y& Company
J ohnst on Bl akel y& Company, LLC
J ohnst on Bl akel y& Company
J ohnst on Bl akel y& Company
J ohnst on Bl akel y& Company
J ohnst on Bl akel y& Company
J ohnst on Bl akel y& Company, LLC
The New Normal?Shifting Investment Dynamics
IND
NDA
Discovery Development Phase I Phase II Phase III Approval
Pre clinical Candidate Clinical Development Market
Go publicVenture funding
• traditional investment model
Acquisition/ go publicVenture funding
• current investment model
Follow on offerings
Private Institutional Investors Public Markets
Private Institutional InvestorsThe Financial Abyss?
J ohnst on Bl akel y& Company
J ohnst on Bl akel y
& CompanyJ ohnst on Bl akel y
& CompanyJ ohnst on Bl akel y
& Company
J ohnst on Bl akel y
& Company, LLCJ ohnst on Bl akel y
& Company
J ohnst on Bl akel y
& CompanyJ ohnst on Bl akel y
& CompanyJ ohnst on Bl akel y
& Company
J ohnst on Bl akel y
& Company, LLC
March 8, 2012
MassBio State of the Industry
Biotechnology 2012: The New Normal?
Benjamin Conway
978-526-4014617-834-8482