marine and coastal photographs and videos: their availability, … · 2018-03-02 · curating and...
TRANSCRIPT
Report for the Marine Environmental Data Action Group of the Inter-Agency Committee on Marine Science and Technology (IACMST)
Prepared by Dr M E Charlesworth
Marine and Coastal Photographs and Videos: their availability, uses and curation
The Marine Environmental Data Action GroupBritish Oceanographic Data Centre6 Brownlow StreetLiverpoolL3 5DAwww.oceannet.orgE-mail: [email protected]
IACMST Information Document No. 13November 2006 The Marine Environmental Data Action Group sponsors include:
● Natural Environmental Research Council
● The Environment Agency
● Department for Environment, Food and Rural Affairs
● Fishery Research Services
● The Met Offi ce
● UK Hydrographic Offi ce
Cover and banner images are copyright Mills Media and Tom Reid
PrefaceThese proceedings are based on a Marine Environmental Data Forum organised by the Government’s Inter-Agency Committee on Marine Science and Technology. IACMST is chaired by Professor Howard Dalton and formally reports to the Chief Scientific Adviser. Its existence is in recognition of the highly disparate nature of marine science and technology across departments and agencies. One of its aims is to promote coordination where appropriate, placing particular emphasis on identifying those issues where a cross-departmental view should be taken. A recent example is underwater sound and marine life. IACMST commissioned a working group to address the topic from the perspective of all who inject sound into the sea. Its findings have been published in the IACMST report series.
Within IACMST there are two complementary action groups addressing key long-term issues in observing marine regions and the data produced. One effectively functions as the national committee for the international Global Ocean Observing System (GOOS) programme; the other, focused on Marine Environmental Data, spans cataloguing and inventories through to linkage with European and international data exchange. The views of these groups in particular are sought as part of the briefing process for UK inputs to intergovernmental programmes. A recent addition to IACMST responsibilities is its hosting of the Marine Data and Information Partnership (MDIP). This has a specific focus on enabling easier exchanges of data between participating organisations including interoperability and accessibility for example. It arose out of a study by IACMST for Defra on future directions for marine data and information management.
Much of IACMST’s data activities have been focused on numerical data. In 2001 consideration was also given to Marine Samples (Report No. 8) and in the present report the focus has shifted to photographic and video data. Often such information has been dealt with in a project-specific way with little thought given to wider dissemination and the need for standardisation. The aims of the Forum were to gain a better understanding of the types of information available and their use for different purposes, of techniques for extracting information, and of new initiatives for increasing accessibility and improving curation. The Forum also provided an opportunity for participants to contribute ideas for future developments and these are captured later in the report. I would like to thank the presenters for their inputs and Mark Charlesworth for organising a very successful meeting.
Trevor GuymerSecretary, IACMST
ContentsIntroduction p 4
SERPENT: Video and Images from Global Oil and Gas Operations p 6-8 Ian Hudson and Daniel Jones, National Oceanography Centre, Southampton.
Using Images to Support Marine Stewardship – MarLIN and the MBA p 9-13Harvey Tyler-Walters and Keith Hiscock, Marine Biological Association.
Curating and Using Historic Aerial Photography at English Heritage p 14-17Mike Evans, English Heritage.
The Use of Remotely Sensed Imagery in Support of Admiralty Charting p 18-20Robert Wills, United Kingdom Hydrographic Office.
Video Images of the Coastline Reveal All p 21-22Mark Davidson, University of Plymouth.
ISSIA and Beyond: Lessons Following from the Irish Sea Archive Example p 23-24Ivor Rees, University of Wales, Bangor.
Library Image Collections - an Untapped Resource p 25-26Pauline Simpson, National Oceanography Centre, Southampton.
EUROPHLUKES: Initiating a European Network to Develop a European p 27-31 Cetacean Photo-ID System and Database Peter Thijsse, Marine Information Service (MARIS).
Archiving ‘Video’ and ‘Stills’ for Marine Habitat Mapping Initiatives p 32-33Neil Golding, Joint Nature Conservation Committee.
A Brief Introduction to the Digital Curation Centre p 34-35Liz Lyon, Digital Curation Centre.
Practical Applications of Deep-sea Video Mapping with a Remotely p 36 Operated Vehicle (ROV)Janine Guinan, Margaret Wilson, Anthony Grehan and Colin Brown, National University of Ireland.
Emerging Metadata Standards Relevant to Marine Photograph Curation p 37Mark Charlesworth, Gaynor Evans and Lesley Rickards, Marine Environmental Data Action Group.
DC-UK: Deep-Sea Conservation for the UK p 37Maria Baker, Brian Bett and Tammy Horton National Oceanography Centre, Southampton.
The UK Marine Environmental Data Action Group p 38Mark Charlesworth, Gaynor Evans and Lesley Rickards, Marine Environmental Data Action Group.
Digital Imaging – Interpolation, Compression and Artifacts p 39-40Mike Conquer, National Oceanography Centre, Southampton.
Scuba Divers: Tapping into a Growing Library p 41Jon Bramley and Stefanie Buell, Bramley Associates.
Summary and Recommendations p 42-43Mark Charlesworth, Marine Environmental Data Action Group.
3

IntroductionMarine and coastal photographs and videos are important resources for research and monitoring, and if properly curated may be of use to researchers long after they were fi rst obtained, or used for other purposes beyond which they were specifi cally collected. Collecting photographs or videos by ship, air and underwater remains expensive and widening access to these would ensure that they are collected once and used many times, thus leading to an effi cient use of resources. Issues such as metadata standards, copyright and available technology need to be identifi ed and discussed before a strategy for the curation of marine and coastal photographs and videos can be developed.
On the 23rd November 2005, 52 researchers and curators met at the Institute of Marine Engineering Science and Technology (IMarEST) to discuss current issues associated with the use, availability and curation of marine and coastal photographs and videos. The meeting originated from a recommendation in a similar workshop held by IACMST in 2001 titled ‘Marine sample collections: their value, use and future’. The meeting was used as a forum to describe uses of marine and coastal photographs and videos and discuss common problems of providing wider community access. A series of presentations and posters were made giving an overview of the:
● uses of photographs and videos of marine ecology● uses of photographs and images of coastal morphology● curation of photographs and videos● technological capacity and ongoing initiatives for curation
This report provides an account of the presentations, posters, and a summary of the discussions and recommendations from the workshop.
Marine and Coastal Photographs and Videos: their availability, uses and curation
© Mills Media4 5

2
Marine Science and TechnologySERPENT: Video and Images from Global Oil and Gas OperationsIan Hudson and Daniel Jones
SERPENT Project, National Oceanography Centre, Southampton. European Way, Southampton, S014 3ZH. E-mail: [email protected] Website: www.serpentproject.com
IntroductionThe SERPENT Project (www.serpentproject.com) (Scientifi c & Environmental ROV Partnership using Existing INdustrial Technology) is a collaborative programme between scientifi c institutions and companies associated with the oil and gas industry. SERPENT is hosted at the National Oceanography Centre, Southampton (NOCS), one of the world’s largest research and teaching organisations specialising in deep-sea science and oceanography. SERPENT encompasses a scientifi c network of academic partners across the world linked to a network of major oil and gas operators and contractors. The project centers around the opportunistic
and ad-hoc use of ROVs (Remotely Operated Vehicle) in operational settings during periods of non-essential use (Stand-by time) and the utilisation of data collected as part of routine offshore work and previous environmental assessments.
Our misson statement is that through novel collaborations between major players in the oil and gas industry, SERPENT aims to increase access to cutting edge ROV technology and data for the world’s science community, to progress knowledge and techniques of in situ experimentation, interaction with research and conservation communities worldwide and to increase the general public’s awareness of our fragile marine resources.
Current estimates of ROVs used in the energy sector currently number over 1000 systems, made up of 435 work-class units, 500 eyeball units, 100 cable layers and trenchers and 50 mineral extraction systems (Hudson et al. 2005). Each system is capable of collecting video footage and in many cases digital still images down to a depth of over 5000m. ROVs have been described as a ticket to scientifi c discovery (Rechnitzer, 1985). (Figure 1).
Examining the location of major oil and gas exploration zones operating now and in the future, reveals a distinct overlap
with areas of the ocean designated “biodiversity hotspots”. These hotspots are so called as they are likely to feature unique habitats, species or seafl oor features that promote species diversity and as yet they are poorly researched. Areas such as margins off West Africa, canyon features or chemosynthetic environments are all considered hotspots. (Figure 2). If data collected from ROVs operating in these areas and from routine environmental surveys continue to be collated, many new species, habitats and behaviours will be documented, some of which may be new to science (Hudson et al. 2003, Hudson et al. 2004).
How is data collected and where is it stored ?Data is collected from two primary sources, one passive and one active. The passive process is simple. ROV pilots offshore retain their own video and image records from each work task, sometimes over years and are encouraged to send them into the SERPENT Project for analysis and feedback. This virtual van approach allows a constant stream of data from a range of localities. In return SERPENT Project sends out requests and information packs to stimulate further submissions and also to raise awareness and knowledge of the staff working offshore. Active data collection involves missions to working rigs and vessels offshore. A scientifi c team member from NOCS or one of our partner institutions is trained to work offshore with the ROV team on more specifi c projects or experiments. To date we have placed over 20 scientists on rigs and vessels worldwide and the project continued to grow.
All the video footage that is collected is fi rst digitized from a range of different formats. Video is often collected in VHS, SVHS, DVD and Mini DV formats, and as such a standard digital conversion is used for storage. Each clip or piece of footage is given a unique identifi er for region, rig/vessel and ROV and a comment tag to describe in more detail the specifi c observation or data set. These fi les are stored on a RAID enabled hard disk systems and backed up centrally. All the original tapes are then retained and archived. In the case of still images taken using high resolution underwater stills, the same system is applied. The fi les are copied to the RAID system and added to the database under the same
identifi er system used for video. Samples of the footage and images are also placed onto the website for outreach and communication processes. This database is available on-line for all project partners through password access and a limited access is provided to science institutions and the public on request.
Many of the images captured are unique and may never have been documented previously, and in many cases the supporting video evidence can be used to describe new behaviours (Laurenson et al. 2004, Vecchione, 2001), species and habitats (Figure 3). To increase the importance of each observation recorded supplementary data from the offshore locations are also collected when available. This is normally in the form of ocean metadata (Current Profi les, Temperature, Tides). This data is also captured along with the image or video providing further in situ evidence. Image and ocean metadata are also stored into a GIS (Geographical Information System), where bathymetric information and sampling locations can be plotted and archived along with the corresponding imagery.
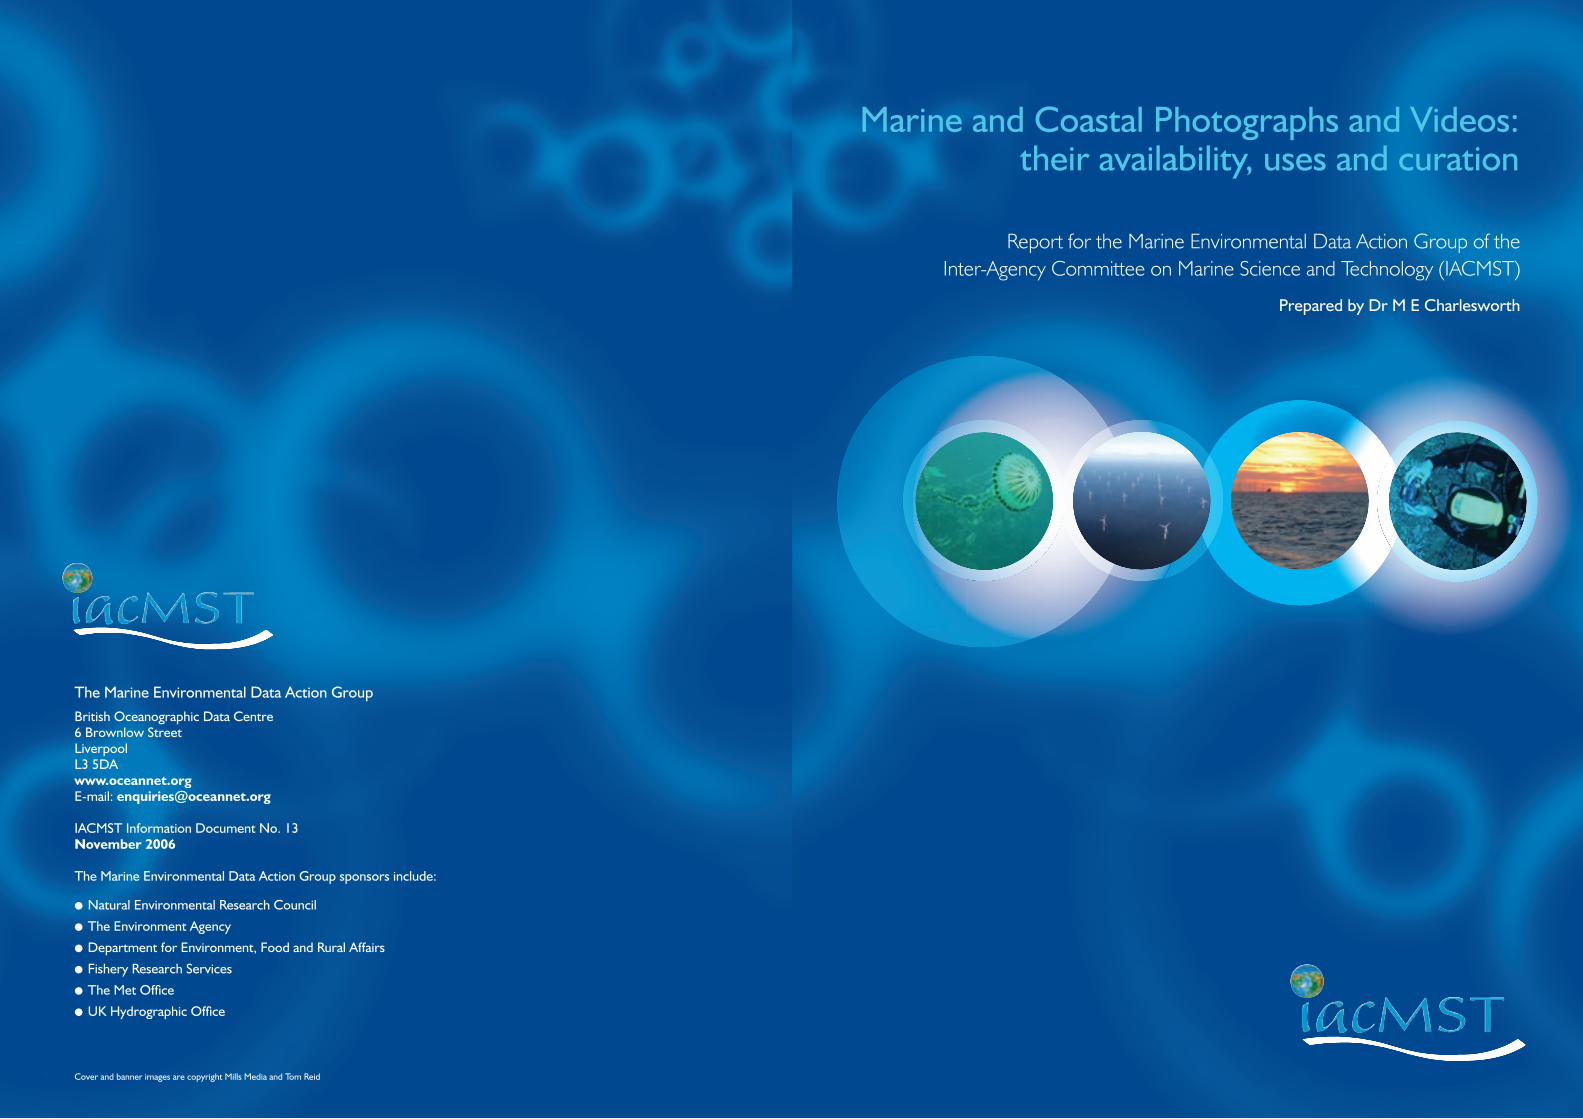
Why is this resource important ?Images and video are powerful learning tools, moving images are easier to explain simply by watching and as such more complex messages are easier to convey. The transfer of knowledge has been recognised as an important step in forming new policy, leading to changes in legislation for offshore exploration and also focusing our attentions on important environmental issues. Transferring the most up to date scientifi c research with visual material is becoming a more popular communication medium and set to rise with ability to place material on-line for wider distribution, it is therefore important that as much material is made available to all stakeholders of the marine environment. SERPENT has a project called DIEPS (Deep-Water Industry Environment, Policy and Science) that aims to communicate all these messages in a coordinated way to all stakeholders to complete the circle of learning and collaboration (Figure 4).
Figure 1. A Hercules Work-Class ROV situated on the deck of an offshore ROV installation vessel (MSV Regalia) working off the coast of the Shetland Isles.
Figure 2. Current and Future Biodiversity hotspots and areas of oil and gas exploration offshore. Around 90% of these zones match in their locality.
Figure 3. A Monkfi sh (Lophius piscatorius) catching a cod. B) An Eelpout (Lycodes sp) found living in water temperatures of -1oC in the Faroe-Shetland Channel. C) A rare image of a giant sea spider (Pycnogonidae). D) A Grey Reef Shark living close to an offshore drilling rig off the coast of Australia.
marine photographs and videosmarine photographs and videosmarine photographs and videos
6 7
2
Marine Science and TechnologyUsing Images to Support Marine Stewardship – MarLIN and the MBAHarvey Tyler-Walters and Keith HiscockMarine Life Information Network, Marine Biological Association of the United Kingdom, Plymouth, PL1 2PB. (www.mba.ac.uk) (www.marlin.ac.uk)E-mail: [email protected]
The Marine Biological Association (MBA) of the United Kingdom was established in 1884 as a charitable learned society to study the seas and marine life, and to disseminate the information for the public good. The MBA has run a Laboratory in Plymouth since 1888, which has contributed many fundamental studies of marine ecosystems. The MBA’s valuable long-term data sets, recently restarted, have charted the way that marine ecosystems fl uctuate, focusing on changes in plankton, fi sh, benthos and intertidal species, plus the recovery of impacted ecosystems (see Southward et al., 2005).
The MBA initiated the Marine Life Information Network (MarLIN) programme in 1998. The MarLIN programme provides information to support marine environmental management, protection and education through three separate sub-programmes.
1. The Biology and Sensitivity Key Information sub- programme provides basic information on over 620 marine species, including detailed information (e.g. autoecology, distribution, life history characteristics and sensitivity to human activities and natural events) for 152 species and 130 habitats (as biotopes).
2. The Data Access sub-programme collates marine benthic survey datasets and provides on-line access to over 250,000 species records from 376 separate surveys.
3. The Education and Recording sub-programme provides educational resources on ca 175 marine species, an interactive underwater tour, marine life topic notes, and hosts an on-line recording scheme for benthic species, especially UK BAP species, non-native species and species likely to be affected by climate change.
The MBA has been active in library and information systems and publishes a journal. The MBA hosts the National Marine Biological Library (NMBL), which is a national reference library and a major resource for research and education in marine biology. The MBA archives hold a variety of data collected by research staff over the life of the Association, and include long-term datasets, personal notebooks and collections of images.
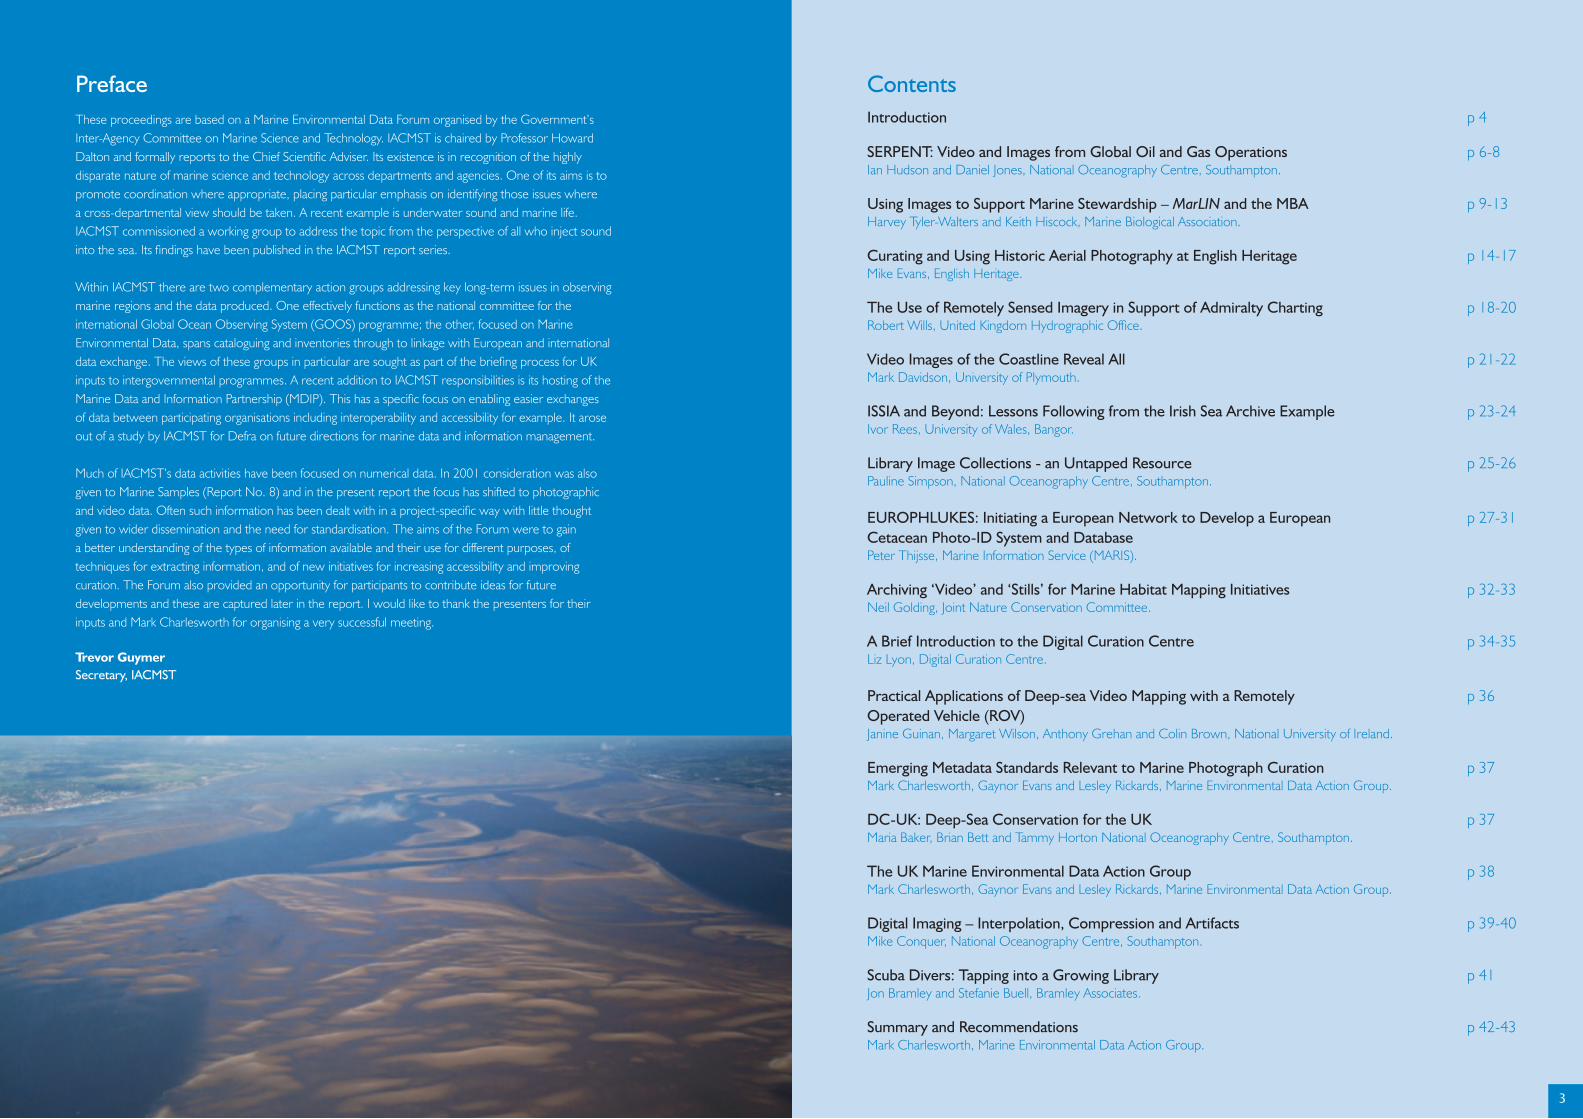
Use of images by the MarLIN programmeImages are essential illustrative tools for our Web pages. The Biology and Sensitivity Key Information pages (Figure 1) (Tyler-Walters & Hiscock, 2005; www.marlin.ac.uk) incorporate one or more images of the species or habitat to illustrate the review wherever possible. The image reinforces the written description of the species or habitat and, in the case of species, may illustrate many of the key identifi cation characteristics.
The Education and Recording sub-programme uses images extensively to engage a wider audience, who are likely to respond to images better than scientifi c descriptive text alone. Species images illustrate pages designed to encourage and support public participation in recording marine life (Figure 2) via the LearningZone (www.marlin.ac.uk/LearningZone). The images are also used to illustrate bespoke waterproof ID guides, designed to be used by amateur naturalists, members of the public and school children in the fi eld (Figure 3).
Figure 1. Part of the Biology and Sensitivity Key Information review of maerl with supporting image of the biotope.
Figure 2. Thumb-nailed gallery of images to support the MarLIN on-line recording scheme.
The Future....The image and video library grows each day the project continues to run. As oil and gas operations explore deeper and further offshore the level of prior scientifi c background knowledge decreases almost exponentially in some areas of the worlds oceans. If data collected in these areas continues to be shared and collaboration becomes a routine part of the work-scope a large amount of important data on the distributions and abundances of a whole range of species will be documented and communicated. One part of this communication process is to use these resources as educational tools aimed at bringing marine science into classrooms and science centres. SERPENT is engaged in a new outreach programme working with the National Marine Aquarium in Plymouth and schools around the world providing on-line teaching resources, live seminars and interactive displays. If important messages about the marine environment are to make a lasting impression we will not go far wrong using images and video to communicate with the next generation of stakeholders in the marine environment.
References Hudson I.R, Jones D.O.B, & Wigham, B.D. 2005. A review of the uses of work-class remotely operated vehicles for the benefi ts of science: Lessons learned from the SERPENT Project. Underwater Technology
Hudson, I.R., & Wigham, B.D. 2003. In situ observations of the predatory feeding behaviour of the galatheid squat lobster Munida sarsi using a remotely operated vehicle. Journal of the Marine Biological Association of the United Kingdom. 83, 463-464.
Hudson, I.R, Wigham, B.D. & Tyler P.A. 2004. The feeding behaviour of deep-sea holothurians based on in situ observations and experiments using a Remotely Operated Vehicle. Journal of Experimental Marine Biology and Ecology, 301, 75-91.
Laurenson, C., Hudson, I.R., Jones, D.O.B. & Priede, I.G. 2004. Deepwater observations of monkfi sh, Lophius piscatorius, in the Northeastern Atlantic Ocean by means of a remotely operated vehicle. Journal of Fish Biology, 65, 947-960.
Rechnitzer, A. 1985. ROV Technology - a Ticket to Scientifi c Discovery. Sea Technology, 26, 65-65.
Vecchione, M., Young, R. E., Guerra, A., Lindsay, D. J., Clague, D. A., Bernhard, J. M. Sager, W. W., Gonzalez, A. F., Rocha, F. J. & Segonzac M. 2001. Worldwide Observations of Remarkable Deep-Sea Squids. Science, 294, 2505.
Figure 4. A Knowledge Transfer Diagram showing the fl ow of information that needs to be generated for effective communication between science, industry and policy (DIEPS Project).
marine photographs and videosmarine photographs and videosmarine photographs and videos
8 9

2
Marine Science and TechnologyThe MarLIN Web site also hosts an interactive underwater tour of a local dive site, Firestone Bay in Plymouth Sound. Images are essential to document the nature of habitats that divers may encounter, together with the wide array of typical species present (Figure 4).
Image thumbnails are used in indices of species and habitats and on the Web pages themselves, to allow rapid browsing of the site but ‘pop-up’ to give full sized images on request. The entire collection of images of species and habitats can also be viewed via a dedicated gallery that demonstrates the wide biodiversity of marine life to our users.
How images are stored and cataloguedAt present, the MarLIN catalogues images by category (Table 1). The coverage of species (Figure 5) includes the major groups of marine invertebrates and vertebrates listed in UK Species Directory (Howson & Picton, 1997). The image catalogue continues to grow.
Table 1. Image categories presently used by MarLIN.
The image catalogue is maintained in a simple database that records the image category (above), image subject (e.g. species names, habitat, biotope), fi lename, image description, image scale, date and location (where available), and the photographer and/or copyright holder. The database is used to populate the image information on the Web site using in-house Visual Basic scripts.
The majority of images are scanned from transparencies, although an increasing number are received digitally. Images are stored as high resolution TIFF or JPEG fi les (1200 dpi at 35x25 mm), which are then optimized to 72 dpi (800x600 pixels) for use on the Web site.
The images are stored in a fi le structure that mirrors the categories shown in Table 1. We use a simple fi le name convention for species images, in which the species name is replaced by a ‘3 and 3’ code, e.g. Mytilus edulis becomes ‘mytedu’, and multiple images are simply numbered. Biotopes are equally simple, and the biotope codes within the national marine biotope classifi cation (Connor et al., 1997a,b; Connor et al., 2004) provide a simple fi le name convention. Other images pose more of a problem as no fi le naming convention is easily obvious. However, the database entries ensure that every image and the image provider can be identifi ed.
Figure 3. MarLIN bespoke waterproof ID guides use photographic images.
Figure 4. Firestone Bay interactive underwater tour. Clicking on the named habitats takes the user to a gallery of photographs.
Figure 5. Representation of species within the MarLIN image catalogue.
MBA Image archivesThe MBA holds extensive collections of images of research, of the activities of the Association, of staff, of species and of events (some of which have recently been catalogued by MarLIN, others by the NMBL). For instance:
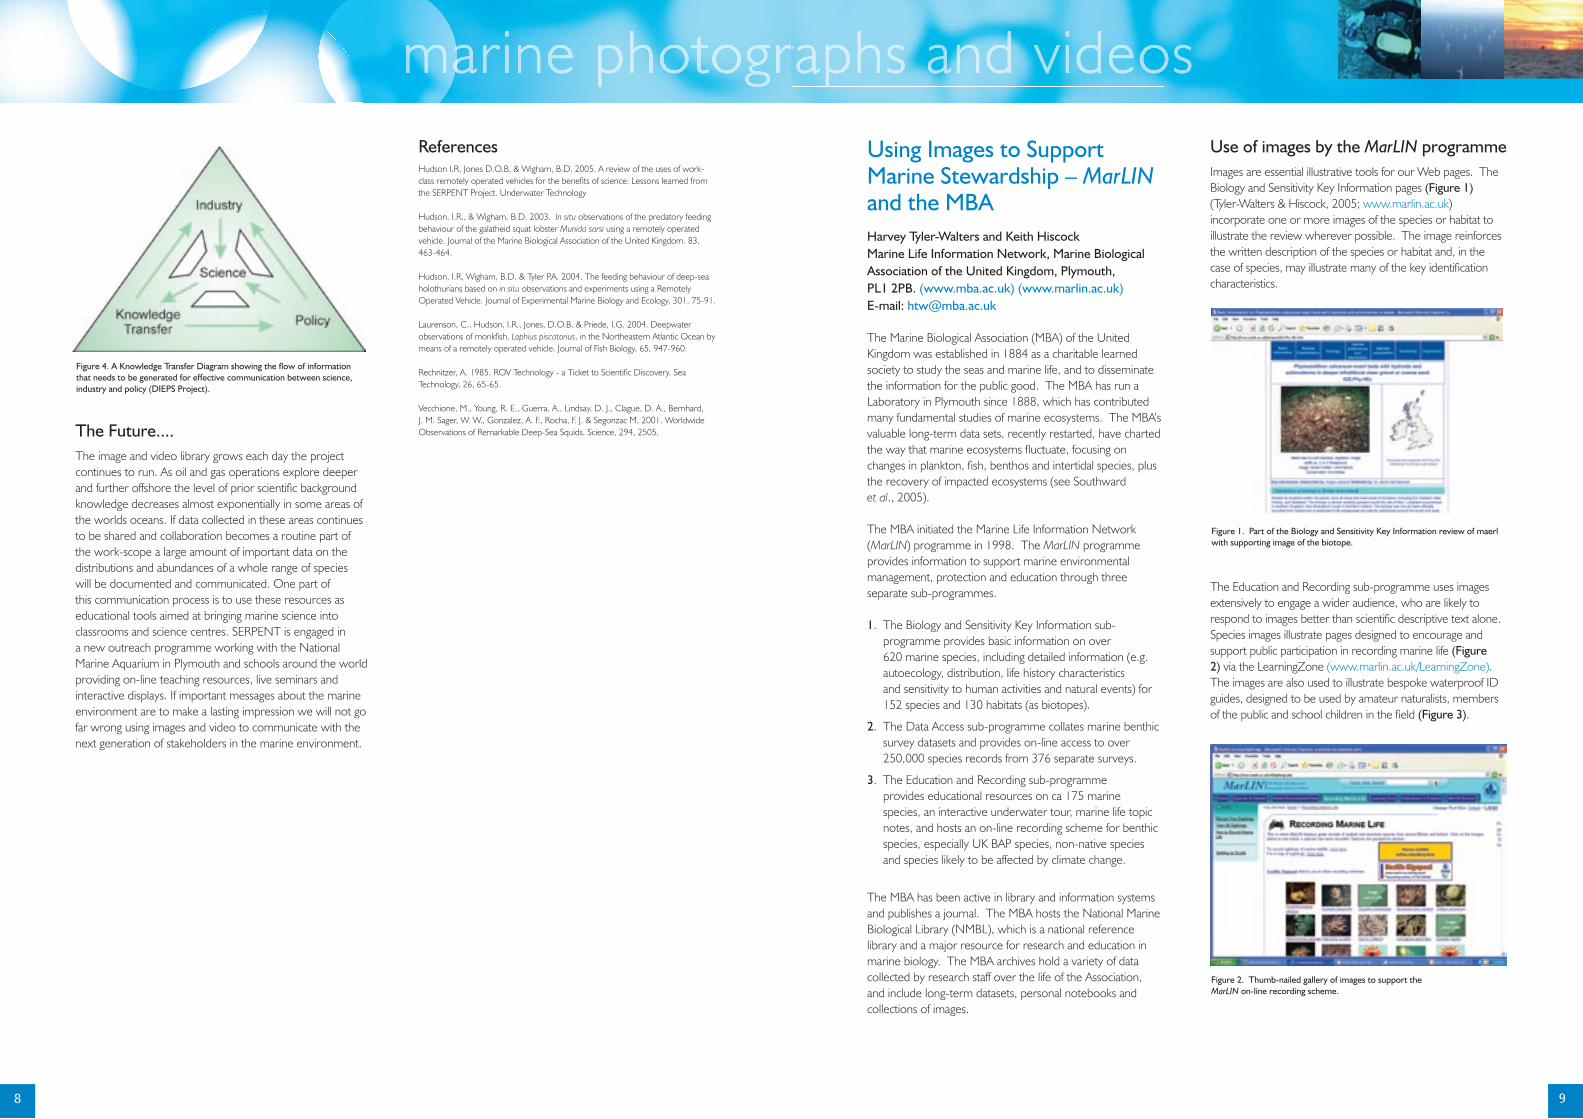
● towed sledge photographic surveys (videos & 35 mm transparencies);● the standard trawl and fi sh sampling, and● staff members at work ranging from laboratory images to early diving surveys at Wembury (Figure 6).
Using archive images to study long-term changeImages gathered during fi eld surveys (e.g. images of quadrats, transects) are more than just illustrative. They are data in their own right. Images of quadrats in particular allow other researchers to re-analyze past data, perhaps to reinterpret the data in line with advances in survey techniques or to re-interpret data in using abundance scales. Images taken in the past allow researchers of today to compare past and present surveys in order to detect change.
The ‘Holme’ archive - the state of the English Channel in 1975-85During the 1970s and 1980s, the late Dr Norman Holme undertook extensive towed sledge surveys in the English Channel and some in the Irish Sea. Only a minority of the resulting images were analysed and reported before his death in 1989 but logbooks, video and fi lm material has been archived in the NMBL. The scientifi c value of the archive was recently investigated by Oakley & Hiscock (2005) and images from selected tows examined to identify, where possible, the habitats and species present (Hiscock & Oakley, 2005).
The NMBL Archive includes:
● Norman Holme’s original notebooks for all 104 tows in the English Channel;● 106 videotapes (reel-to-reel Sony HD format) and 59 video cassettes (including 15 from the Irish Sea) in VHS format; 90 rolls of 35 mm colour transparency fi lm (various lengths up to about 240 frames per fi lm), and ● numerous 35 mm mounted transparencies (Figure 7).
Hiscock & Oakley (2005) were able to match three out of the four habitats identifi ed in the vicinity of Plymouth (between Rame Head and the Eddystone) to the national marine biotope classifi cation (ver. 04.05; Connor et al., 2004).
The re-survey of Colman’s 1933 transects at Wembury in 1973John Colman set up a series of transects at Wembury, Devon to investigate the zonation of intertidal fauna and fl ora in 1933 (Colman, 1933). The same transects were located and re-surveyed by Dr Gerald Boalch and others at the MBA in 1973. One of the most notable fi ndings was the reduction in brown algal cover, which the authors suggested resulted from trampling. The images from the 1973 transects and quadrats were recently placed in the MBA archive (Figure 8). We are now in a position to re-survey the site again and perhaps detect further changes in what is now a Voluntary Marine Nature Reserve and part of a marine Special Area of Conservation.
Maintaining ‘today’s’ images for surveys ‘tomorrow’Past and present survey datasets provide the closest approximation to ‘baselines’ against which marine scientists can measure future change or detect long-term change. Images are a vital part of this dataset. Therefore, there is an urgent need to safeguard ‘legacy’ datasets that would otherwise be lost as scientists retire and institutions change, and a priority to improve the management of, and access
Figure 6. Example of the images from MBA archives.
Towed sledge image, English Channel, 1977. Sampling fi sh populations in the English Channel, 1963.
Early diving surveys at Wembury, Devon.
marine photographs and videosmarine photographs and videosmarine photographs and videos
Category Number of images
held (Nov 2005)
Species 1297
Biotopes 275
Marine scenic 62
Activity / impacts 53
Larvae 11
Others (inc. Teaching, Recording, Restricted) 32
10 11
2
Marine Science and Technology
to, the marine environmental data that the marine science community has already collected. Such priorities have been recently recognized by UK Government in its ‘Marine Stewardship’ and ‘Charting Progress’ reports (Defra, 2002, 2005).
Defra have recognized the need to develop marine data archive centres and have set up the Marine Data Information Partnership (MDIP) (http://www.oceannet.org/MDIP/), which aims to harmonize stewardship of and access to marine data and information, and to facilitate improved management of the seas around the UK.
In particular, Defra is funding the development of the Data Archive for Seabed Species and Habitats (DASSH) at the MBA. The DASSH will build on the existing extensive data and dissemination skills of the Marine Life Information Network (MarLIN) alongside the library skills experience of the NMBL and the MBA’s historical role in marine science. DASSH will:
● provide a digital archive for marine benthic survey datasets of both species and habitats;● provide a digital repository for marine benthic images and video, ROV image data and side scan sonar image data;
● provide facilities to transfer benthic survey data into a standard format, and progress the data to the archive and the National Biodiversity Network (NBN);● provide access to datasets via an on-line catalogue of both metadata and data via a dedicated Web site (www.dassh.ac.uk) and the NBN;● collaborate with international biological data portals including Ocean Biogeographic Information System (OBIS) and Global Biodiversity Information Facility (GBIF), and● provide a ‘National’ marine data archive for marine benthic survey datasets.
In due course, DASSH will also:
● develop an archive for the long-term storage of physical datasets, e.g. scientist or expedition note-books, slides, video or fi lm footage, and other ‘at-risk’ legacy materials within the NMBL ● DASSH will work in collaboration with the Marine Data and Information Partnership (MDIP) and existing data archive centres to develop and comply with national metadata and data standards.
Figure 7. Dr Norman Holmes’ towed photographic sledge and example image from a 35 mm transparency.
Figure 8. Images of transect and quadrat from the re-survey of Colman’s 1933 transects at Wembury in 1973.
AcknowledgementsThe MarLIN programme continues to be indebted to a large number of image providers who kindly allow their images to be used free of charge.
ReferencesBoalch, G.T. & Jephson, N.A., 1981. A re-examination of the seaweeds on Colman’s traverses at Wembury. Proceedings of the International Seaweed Symposium, 8, 290-293.
Boalch, G.T., Holme, N.A., Jephson, N.A. & Sidwell, J.M.C., 1974. A resurvey of Colman’s intertidal traverses at Wembury, South Devon. Journal of the Marine Biological Association of the United Kingdom, 5, 551-553.
Colman, J., 1933. The nature of the intertidal zonation of plants and animals. Journal of the Marine Biological Association of the United Kingdom, 18, 435-476.
Connor, D.W., Brazier, D.P., Hill, T.O. & Northen, K.O, 1997a. Marine Nature Conservation Review: marine biotope classifi cation for Britain and Ireland. Volume 1. Littoral biotopes. Version 97.06. Joint Nature Conservation Committee, Peterborough, JNCC Report, no. 229.
Connor, D.W., Dalkin, M.J., Hill, T.O., Holt, R.H.F. & Sanderson, W.G., 1997b. Marine Nature Conservation Review: marine biotope classifi cation for Britain and Ireland. Volume 2. Sub-littoral biotopes. Version 97.06. Joint Nature Conservation Committee, Peterborough, JNCC Report, no. 230.
Connor, D.W., Allen, J.H., Golding, N., Howell, K.L., Lieberknecht, L.M., Northen, K.O. & Reker, J.B., 2004. The Marine Habitat Classifi cation for Britain and Ireland. Version 04.05. Joint Nature Conservation Committee, Peterborough. Available from: <www.jncc.gov.uk/MarineHabitatClassifi cation>
Defra (Department for Environment, Food and Rural affairs), 2002. Safeguarding our seas. A strategy for the conservation and sustainable development of our marine environment. London: Department for Environment, Food and Rural affairs.
Defra (Department for Environment, Food and Rural affairs), 2005. Charting progress: an integrated assessment of the state of UK seas. London: Department for Environment, Food and Rural affairs.
Hiscock, K. & Oakley, J., 2005. English Channel towed sledge seabed images. Phase 2: Analysis of selected tow images. Report to the Joint Nature Conservation Committee from the Marine Biological Association. Plymouth: Marine Biological Association. JNCC. Contract F90-01-784.
Oakley, J. & Hiscock, K., 2005. English Channel towed sledge seabed images. Phase 1: scoping study and example analysis. Report to the Joint Nature Conservation Committee from the Marine Biological Association. Plymouth: Marine Biological Association. [JNCC Contract F90-01-784]. 39 pp.
Southward, A.J., Langmead, O., Hardman-Mountford, N.J., Aiken, J., Boalch, G.T., Dando, P.R., Genner, M.J., Joint, I., Kendall, M.A., Halliday, N.C., Harris, R.P., Laper, R., Mieszkowska, N., Pingree, R.D., Richardson, A.J., Sims, D.W., Smith, T., Walne, A.W. & Hawkins, S.J., 2005. Long-term Oceanographic and Ecological Research in the Western English Channel. Advances in Marine Biology, 47, 1-105.
Tyler-Walters, H. & Hiscock, K., 2005. Impact of human activities on benthic biotopes and species. Report to Department for Environment, Food and Rural Affairs from the Marine Life Information Network (MarLIN). Plymouth: Marine Biological Association of the UK. [Contract no. CDEP 84/5/244].
marine photographs and videosmarine photographs and videosmarine photographs and videos
12 13
© Mills Media

2
Marine Science and TechnologyCurating and using Historic Aerial Photography at English HeritageMike EvansNational Monuments Record, English Heritage, Kemble Drive, Swindon SN2 2GZE-mail: [email protected]
1. English Heritage and the National Monuments RecordEnglish Heritage is the lead public body for the conservation of the historic environment in England, and advises national, regional and local government on heritage issues. The National Monuments Record (NMR) is the public archive of English Heritage, with a role to be a national archive of the historic environment. Although no single archive can provide a comprehensive record of something as ubiquitous as the historic environment, in its scope and focus the NMR is unique in England.
The geographic scope of the NMR covers all of England, including territorial waters up to the 12 mile limit. However it excludes the Channel Islands and the Isle of Man. Our remit covers standing structures, below ground archaeology and landscape history. It includes the context in which the historic environment has been created – the why and the how of human interaction with that environment, as well as the description of the traces which remain. In terms of period we range from prehistory to the Cold War and beyond.
2. The holdings of the NMRThe National Monuments Record has been sited in Swindon since 1994, when we brought a number of resources together in one place in order to provide a more coherent service to our users. We hold over ten million items of archive material. This includes measured drawings, plans, reports, fi les and the whole gamut of archival formats – and increasingly including digital formats. However, the greatest proportion of our holdings are photographs, dating from the middle of the nineteenth century onwards, and it is as a photographic record that we are probably best known.
2.1. The Maritime RecordAs well as the archive proper the NMR also maintains and disseminates a series of datasets which describe aspects of the historic environment. These are described in more detail on our website, but include a maritime record, which is a subset of a wider inventory of the English historic environment. This contains over 45,000 records of wrecks, aircraft crash sites, maritime infrastructure such as lighthouses and drowned terrestrial archaeology in the costal zone, the inter-tidal area and beyond. It is accessible through our own Pastscape front end and via the Archaeology Data Service1.
2.2. Aerial photography at the NMR: Oblique photographyThe NMR holds approximately 565,000 oblique aerial photographs. Our collection originated in the 1960s and was initially a product of cropmark reconnaissance by aerial archaeologists. Since that period it is no exaggeration to say that aerial archaeology has rewritten the historical map of Britain. It has demonstrated just how intensive human use of many areas has been and how much of a palimpsest the landscape represents.
English Heritage carries out its own programs of aerial reconnaissance, and also funds programs undertaken by local specialists, and the products of these are all included in the NMR’s holdings.
We estimate that over two-thirds of the kilometre squares in England are covered by some oblique photography though of course not all of the square will be covered in useful detail – these images are site focussed. The coastal strip, and in particular, the inter-tidal zone is probably under-represented in this, but in the last few years dedicated reconnaissance has been undertaken on these areas in support of work on rapid costal-zone surveys (Figure 1). In addition to this the RAF displayed a particular interest during the second world war and afterwards in photographing coastal areas, creating a particularly valuable historic record (Figure 2).
2.3. Aerial photography at the NMR: Vertical photographyThe collections of vertical photography held by the NMR derive from a different source: prior to 1984 the Department of the Environment and its predecessors had maintained a national library of air photos comprising primarily material taken by the RAF and the Ordnance Survey. In that year the prints for England were transferred to the National Monuments Record. To these core collections we have subsequently added others described below. The collection now contains over 2 million frames.
RAF and USAAF photographyThis represents our largest single holding of aerial photography.
● 1,150,000 frames● Dates: 1939 - 1974● Film formats: 5x5 in, 8x7 in, 9x9 in● Scales: 1:2,500 and 1:5000 (urban) 1:10,000 (rural) 1:27,000
80,000 of these frames represent wartime photography, often carried out for training purposes. However the heart of the collection is the post-war RAF material, which is over 1 million frames, and in particular the survey of England carried out in 1945-54. This unfortunately was not quite fi nished, and there are some gaps, but even so it represents an invaluable resource, which is increasingly being used as a benchmark against which to measure subsequent environmental change (Figure 3).
Ordnance Survey photographyThis is primarily photography taken to inform the OS mapping programmes (Figure 4).
● 532,000 frames● Dates: 1951 – 1979 (fi lms) 1951 – 2000 (prints)● Film formats: 9x9 in● Scales: from 1:5,000 to 1:20,000 (most commonly 1:7,500 and 1:20,000)
Meridian Air PhotosThis commercial company, which started fl ying in 1952, went into liquidation in 1984 and the NMR was able to rescue the library. The sorties we hold range from coverage of whole counties to that of specifi c sites.
● 298,000 frames● Dates: 1952 – 1984● Format: 9x9 in● Scales: from 1:2,000 to 1:10,000
Environment AgencyThe NMR holds this more recent collection from the Environment Agency which focuses on documenting river fl ood plains. Where almost all of the previous collections have been b/w fi lms and prints, this group are colour diapositives.
● 54,000 frames● Dates: 1990s● Format: 9x9 in● Scales: 1:3,000
3. Managing air photosManaging an archive of this nature and scale provides particular challenges in terms of conservation and cataloguing.
3.1. StoragePhotographic images decay. By their nature they are unstable and liable to degrade over time. The speed with which this happens will depend on the materials which make up the fi lm or print, the way in which they were originally processed and the conditions under which they are stored and accessed.
The NMR is fortunate in being able to hold its collections in a purpose designed archive store, constructed in 1994. This allows our aerial photographic fi lms to be stored in cold dry conditions: 8 deg C and 32% RH. As Figure 5 shows, the fi lms are stored in original cans where practical, but without lids. This allows any products of decomposition to be removed by the air conditioning and fi ltering system, rather than creating a harmful microenvironment within the can.
The prints are held at 18 deg C and 45% relative humidity which refl ects their particular make-up and chemistry. We estimate that by holding prints and fi lms in this way we are
marine photographs and videosmarine photographs and videosmarine photographs and videos
14 15
Figure 2. RAF photography of the coast at Walcott, Norfolk in August 1941, showing anti-invasion defences. Ref RAF_1416_S378H50_PO_67Reproduced by permission of English Heritage (NMR). RAF photography
Figure 4. Ordnance Survey photography of Orford Ness, Suffolk, in 1972. The image shows the Cobra Mist over-the-horizon radar. Ref OS_72057_v_010. © Crown copyright. All rights reserved.
Figure 3. RAF vertical photography showing low tide at Weston Super Mare in January 1946. Ref RAF_36_TUD_U_21_V_5014. Reproduced by permission of English Heritage (NMR). RAF photography
Figure 1. A wreck site in a salt marsh on the River Medway, 1995. Ref NMR_15382_12. © Crown copyright (NMR).

2
Marine Science and Technologyextending their lifespan by a very signifi cant factor. However there are implications for access to the holdings resulting from this. For example because of the conditions in which we hold the fi lms we cannot simply produce them instantly for printing or viewing, but have to acclimatise them slowly – usually overnight – to the ambient conditions. Otherwise we risk damage to the fi lms.
3.2. CataloguingWe manage and provide access to all this material using a comparatively simple database and GIS system called Photonet, which was designed for us in 1986. We catalogue oblique photographs as individual items, defi ned by the centre point of what is visible on the photograph (to within 100m). Note that we are not recording the location of either the site which is the nominal subject of the photograph or where the plane was when the photo was taken. This gives us a more consistent approach to recording just what may appear in a particular photograph. We do index the images by subject area or theme, but our primary emphasis is upon supporting retrieval by grid reference.
We catalogue the vertical aerial photographs from fl ight plots, and log key points along the path of the sortie. The Photonet system will then create a footprint for the photographs taken by the sortie based on the altitude of the fl ight and the focal length of the camera. We aim for a margin of error which is within 5% of the width of the photographic frame.
We therefore end with a dataset which can be queried to provide details of all the images which are likely to show a particular site or to cover a particular area. It is through this system that we provide access to our users.
3.3. Use and AccessWhen we receive an enquiry staff in our enquiry and research section will carry out a cover search using Photonet. One of our key problems is that the volume of material we hold means that generally the system will retrieve an extremely large number of hits, even for a single site. So staff use their knowledge of our holdings and their understanding of the customers enquiry to weed out various sorties on the basis of period, scale and quality. They will then generate a listing which can be printed out and sent to the enquirer. The user can ask for photocopies, laser copies or prints to be produced and set to him or her, or they can visit our offi ce in Swindon to view the material. We currently withdraw over 130,000 prints per annum from the archive for internal and external users.
It is important to note some of the limitations on the use of what we hold, particularly in respect of vertical photography. For our more recent holdings we will have details of the time the individual frame was taken, the altitude and focal length of the camera; an indication of the attitude of the plane – to what degree was it fl ying horizontally – and fi ducial marks. What we will not have is camera calibration certifi cates to permit the kind of precise registration you might be able to do with
contemporary aerial photography. As one goes further back in time this data can become more ambiguous or disappears altogether. For example not all the earlier material has fi ducials present, while the angle at which photography was taken may not be truly vertical. The RAF on many sorties employed fanned arrays of cameras, using two or more cameras slightly diverging to left and right of the fl ight path in order to produce overlapping runs of images. These factors will vary from source to source and indeed from sortie to sortie, but will obviously need to be taken into account when assessing just how useful historic imagery might be in any particular context.
Future use and conservation of these collections is likely to be very much enhanced by their digitisation. However, there are a number of issues with which we are wrestling at the moment.● the sheer scale of the collections and the resource required. While an incremental approach to the collections is inevitable, it will also be necessary to ensure digitisation is carried out consistently and cost effectively.● the archival and conservation issues surrounding the prints and fi lms restrict capture mechanisms: the fragility of some records means that automated fi lm feeders may not be appropriate for example.● we need to know what is going to be the most appropriate standard for digital capture. Does the scanning need to be done to a full photogrammetric standard? If not just which resolutions are appropriate?● and fi nally how do we address and resource the major issue of digital archiving which such a programme creates?
Having said all that we are taking forward the question of digital access in as pragmatic a way as possible. We have supplied scanned copies of selected holdings to a range of other agencies, including English Nature, for use in specifi c projects. We also intend to move on from enhancing the Photonet system as an internal tool to making it available online so that users can carry out searches for themselves.
4. Use of aerial photography in the context of English Heritage policyThis fi nal section will look briefl y at how some of the resources described above are used to support EH research activity and to input into overall coastal strategy.
4.1. English Heritage and coastal policyEnglish Heritage advises government on the implications of costal zone management and costal defence policy on the historic environment at both strategic and scheme specifi c levels. With the passing of the National Heritage Act in 2002 EH has also assumed front-line responsibility for maritime archaeology within England’s territorial waters.
One of the fi rst fruits of EH’s engagement with the coastal heritage was the commissioning of England’s Coastal Heritage in 19972. This was a desk-based nationwide assessment which examined coastal archaeology. It established a
benchmark in terms of what was known about the nature of the resource at the time and a framework for the future prioritisation of research. Most of the subsequent EH initiatives, such as the Rapid Coastal Zone Assessment Surveys, derive from this project.
One of the most helpful parts of the volume for those considering the use of aerial photographs as a research tool is a short appendix by Simon Crutchley on the use of aerial photographs of the inter-tidal zones.This summarised the collections that were likely to contain relevant existing photographs, and assessed their potential usefulness. While this survey is now almost 10 years out of date, and the situation in some repositories will undoubtedly have moved on, it does remain a useful starting point and outline.
The appendix also noted some of the diffi culties of using such material for archaeological analysis, for example:
● Much coverage may show the tide at an unhelpful point. Indeed it may be diffi cult to establish just where the tide was within its range at the time the photograph was taken. While many vertical photographs will include a time taken as well as a date, and so the state of the tide can be established using historic tide tables, many oblique images will only record a date taken and not a specifi c time.● The majority of vertical photography tends to run east- west. If one is examining a portion of the coast which runs north-south it can be necessary to identify and examine the output from a lot of different sorties.
4.2. Rapid coastal-zone surveysFollowing on from this work English Heritage, in partnership with the relevant local authorities, has been supporting several rapid coastal zone assessments for example in Essex, Scilly and Norfolk. The intention is that we should build an evidence base which can feed into Defra’s overall shoreline management plan process, and will allow us to develop mitigation strategies for aspects of the historic environment which are most under threat3.
The most recent assessment has been carried out in Suffolk. This was funded by EH and undertaken by the Suffolk County Council Archaeological Service. The aims of the survey were to:
● Provide an overview of coastal changes from the late Palaeolithic onwards● Provide an assessment of the degree and nature of threats to coastal historic assets● Provide a broad assessment of the likely archaeological potential and vulnerability of all stretches of the coast● Provide a sound basis for developing management and research priorities in respect of specifi c sites and areas of potential inclusion● Enhance public understanding and enjoyment of the coastal heritage.
The survey was carried out on several levels
● An analysis of holdings in major photographic collections. These were primarily the NMR, records held by Suffolk Historic Environment Record; the relevant holdings of Cambridge University Collection of Aerial Photography; and Environment Agency photography from the period 1999-2000. As well as the inter-tidal zone proper this part of the survey included investigation of a 1-2km strip inland from the coast to help provide a context for the inter-tidal zone and also to deliver the maximum archaeological benefi t.● A study of map and documentary evidence● A fi eld survey of the inter-tidal zone of the Suffolk coast and estuaries.
The survey has identifi ed a large number of new sites, with the various strands proving complementary: some sites could only be identifi ed on aerial photos and some could only be picked up by fi eld survey. In total 1465 new records were added to the NMRs inventory and existing records for 300 sites amended. The sites revealed or elucidated by the survey range from fi sh traps and duck decoys to shipwrecks.However 65% of the sites documented were twentieth century in origin, indicating how much of a mark second world war anti invasion defences left on this area.
1 For further details of NMR online resources see the English Heritage web site http://www.english-heritage.org.uk/nmr
2 Michael Fulford; Timothy Champion; Antony Long England’s Coastal Heritage: a survey for English Heritage and the RCHME English Heritage, 1997
3 For further details see the English Heritage web sitehttp://www.english-heritage.org.uk/researchand follow the headings belowPublic policyCoastal policy
marine photographs and videosmarine photographs and videosmarine photographs and videos
16 17
Figure 5. The interior of the NMR archive building, showing the storage of vertical aerial fi lms. © English Heritage (NMR)
2
Marine Science and TechnologyThe Use of Remotely Sensed Imagery in Support of Admiralty ChartingRobert WillsUK Hydrographic Offi ce, Taunton, UK. TA1 2DN E-mail: [email protected]
IntroductonThe United Kingdom Hydrographic Offi ce (UKHO) is a Defence Agency tasked with meeting “national, defence and civil needs for navigational charts and hydrographic information in support of safety at sea while embracing the opportunities provided by a Trading Fund status”. It has been protecting safety of life at sea since 1795. It charts the world, producing not only paper navigational charts but supporting publications and digital products (eg Admiralty Raster Chart Series, ARCS, and Electronic Navigation Charts, ENCs).
To support this, the Imagery Centre of the UKHO provides advice and navigationally signifi cant information from both aerial photography and remotely sensed imagery.
Since the 1950s aerial photography has been used in the UKHO to update charts, with remotely sensed imagery being used from the 1970s. (Henceforward in this paper aerial photography and satellite imagery will simply be called ‘imagery’ unless otherwise specifi ed). With the advent of cheap, easily available imagery, the Internet and the development of powerful software processing tools, the Imagery Centre now routinely uses digital means to acquire and process imagery in timescales unimaginable only a decade ago.
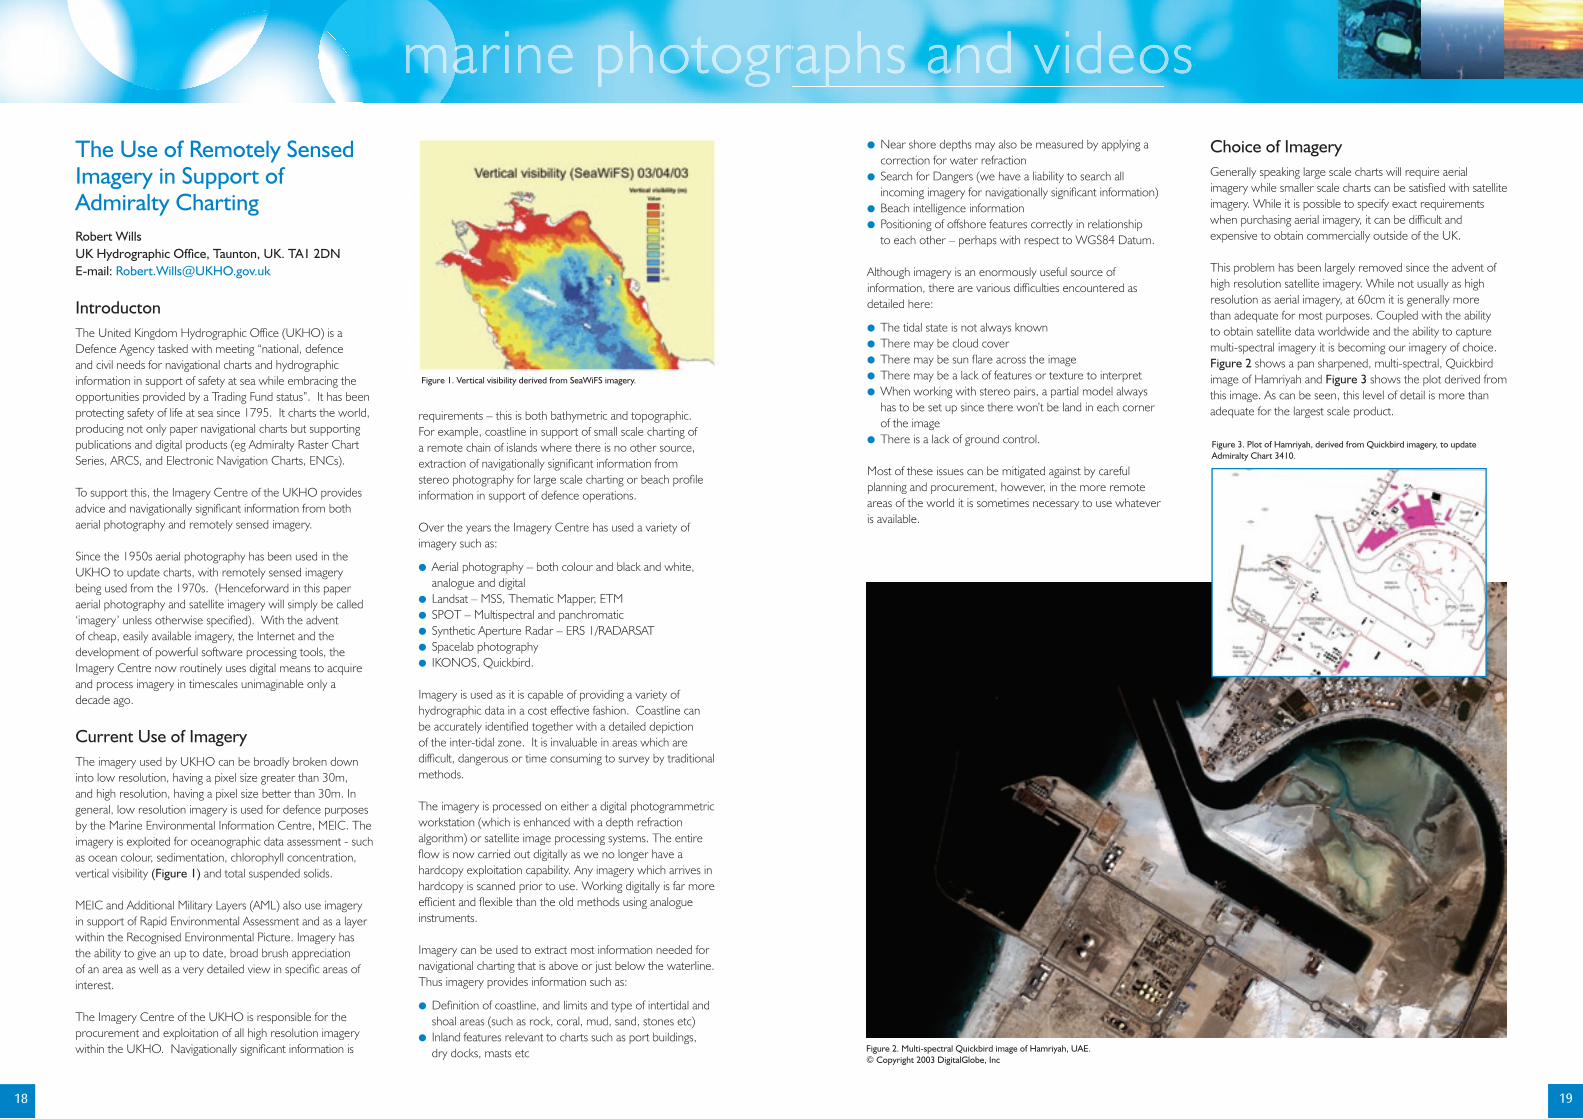
Current Use of ImageryThe imagery used by UKHO can be broadly broken down into low resolution, having a pixel size greater than 30m, and high resolution, having a pixel size better than 30m. In general, low resolution imagery is used for defence purposes by the Marine Environmental Information Centre, MEIC. The imagery is exploited for oceanographic data assessment - such as ocean colour, sedimentation, chlorophyll concentration, vertical visibility (Figure 1) and total suspended solids.
MEIC and Additional Military Layers (AML) also use imagery in support of Rapid Environmental Assessment and as a layer within the Recognised Environmental Picture. Imagery has the ability to give an up to date, broad brush appreciation of an area as well as a very detailed view in specifi c areas of interest.
The Imagery Centre of the UKHO is responsible for the procurement and exploitation of all high resolution imagery within the UKHO. Navigationally signifi cant information is
derived from the imagery in support of charting and defence
requirements – this is both bathymetric and topographic. For example, coastline in support of small scale charting of a remote chain of islands where there is no other source, extraction of navigationally signifi cant information from stereo photography for large scale charting or beach profi le information in support of defence operations.
Over the years the Imagery Centre has used a variety of imagery such as:
● Aerial photography – both colour and black and white, analogue and digital● Landsat – MSS, Thematic Mapper, ETM● SPOT – Multispectral and panchromatic● Synthetic Aperture Radar – ERS 1/RADARSAT● Spacelab photography● IKONOS, Quickbird.
Imagery is used as it is capable of providing a variety of hydrographic data in a cost effective fashion. Coastline can be accurately identifi ed together with a detailed depiction of the inter-tidal zone. It is invaluable in areas which are diffi cult, dangerous or time consuming to survey by traditional methods.
The imagery is processed on either a digital photogrammetric workstation (which is enhanced with a depth refraction algorithm) or satellite image processing systems. The entire fl ow is now carried out digitally as we no longer have a hardcopy exploitation capability. Any imagery which arrives in hardcopy is scanned prior to use. Working digitally is far more effi cient and fl exible than the old methods using analogue instruments.
Imagery can be used to extract most information needed for navigational charting that is above or just below the waterline. Thus imagery provides information such as:
● Defi nition of coastline, and limits and type of intertidal and shoal areas (such as rock, coral, mud, sand, stones etc)● Inland features relevant to charts such as port buildings, dry docks, masts etc
● Near shore depths may also be measured by applying a correction for water refraction● Search for Dangers (we have a liability to search all incoming imagery for navigationally signifi cant information)● Beach intelligence information● Positioning of offshore features correctly in relationship to each other – perhaps with respect to WGS84 Datum.
Although imagery is an enormously useful source of information, there are various diffi culties encountered as detailed here:
● The tidal state is not always known● There may be cloud cover● There may be sun fl are across the image● There may be a lack of features or texture to interpret● When working with stereo pairs, a partial model always has to be set up since there won’t be land in each corner of the image● There is a lack of ground control.
Most of these issues can be mitigated against by careful planning and procurement, however, in the more remote areas of the world it is sometimes necessary to use whatever is available.
Choice of ImageryGenerally speaking large scale charts will require aerial imagery while smaller scale charts can be satisfi ed with satellite imagery. While it is possible to specify exact requirements when purchasing aerial imagery, it can be diffi cult and expensive to obtain commercially outside of the UK.
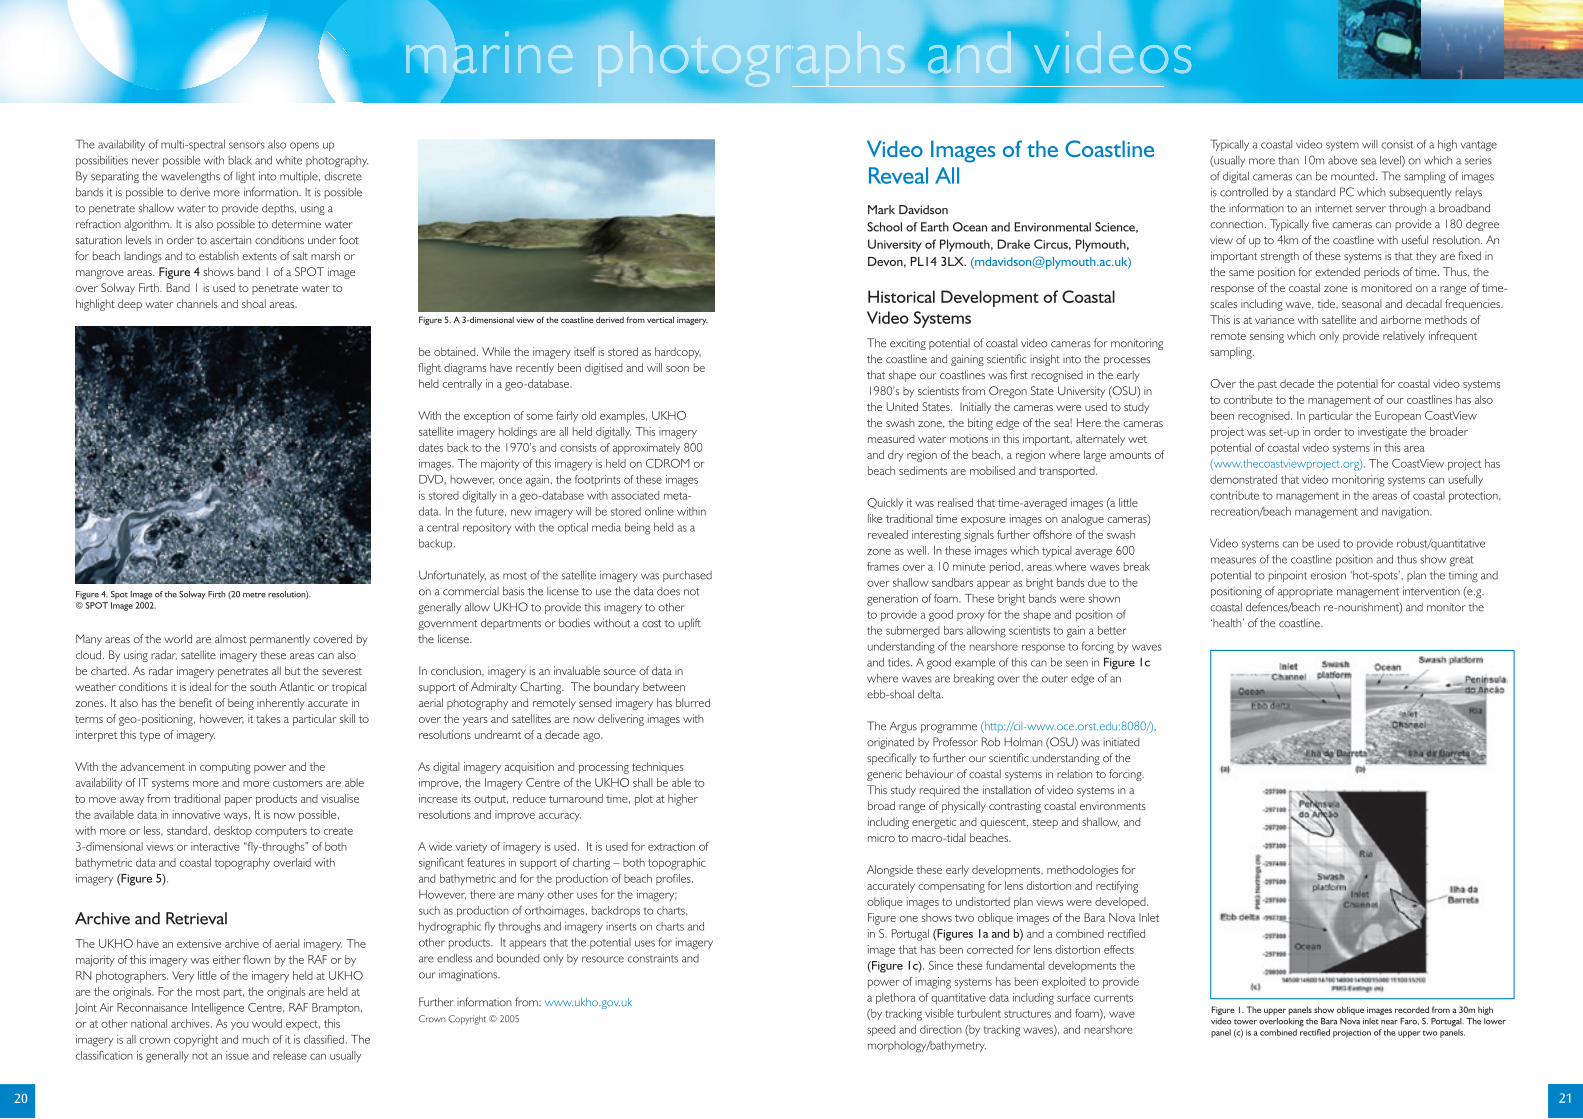
This problem has been largely removed since the advent of high resolution satellite imagery. While not usually as high resolution as aerial imagery, at 60cm it is generally more than adequate for most purposes. Coupled with the ability to obtain satellite data worldwide and the ability to capture multi-spectral imagery it is becoming our imagery of choice. Figure 2 shows a pan sharpened, multi-spectral, Quickbird image of Hamriyah and Figure 3 shows the plot derived from this image. As can be seen, this level of detail is more than adequate for the largest scale product.
Figure 1. Vertical visibility derived from SeaWiFS imagery.
Figure 2. Multi-spectral Quickbird image of Hamriyah, UAE. © Copyright 2003 DigitalGlobe, Inc
Figure 3. Plot of Hamriyah, derived from Quickbird imagery, to update Admiralty Chart 3410.
marine photographs and videosmarine photographs and videosmarine photographs and videos
18 19
2
Marine Science and TechnologyThe availability of multi-spectral sensors also opens up possibilities never possible with black and white photography. By separating the wavelengths of light into multiple, discrete bands it is possible to derive more information. It is possible to penetrate shallow water to provide depths, using a refraction algorithm. It is also possible to determine water saturation levels in order to ascertain conditions under foot for beach landings and to establish extents of salt marsh or mangrove areas. Figure 4 shows band 1 of a SPOT image over Solway Firth. Band 1 is used to penetrate water to highlight deep water channels and shoal areas.
Many areas of the world are almost permanently covered by cloud. By using radar, satellite imagery these areas can also be charted. As radar imagery penetrates all but the severest weather conditions it is ideal for the south Atlantic or tropical zones. It also has the benefi t of being inherently accurate in terms of geo-positioning, however, it takes a particular skill to interpret this type of imagery.
With the advancement in computing power and the availability of IT systems more and more customers are able to move away from traditional paper products and visualise the available data in innovative ways. It is now possible, with more or less, standard, desktop computers to create 3-dimensional views or interactive “fl y-throughs” of both bathymetric data and coastal topography overlaid with imagery (Figure 5).
Archive and RetrievalThe UKHO have an extensive archive of aerial imagery. The majority of this imagery was either fl own by the RAF or by RN photographers. Very little of the imagery held at UKHO are the originals. For the most part, the originals are held at Joint Air Reconnaisance Intelligence Centre, RAF Brampton, or at other national archives. As you would expect, this imagery is all crown copyright and much of it is classifi ed. The classifi cation is generally not an issue and release can usually
be obtained. While the imagery itself is stored as hardcopy, fl ight diagrams have recently been digitised and will soon be held centrally in a geo-database.
With the exception of some fairly old examples, UKHO satellite imagery holdings are all held digitally. This imagery dates back to the 1970’s and consists of approximately 800 images. The majority of this imagery is held on CDROM or DVD, however, once again, the footprints of these images is stored digitally in a geo-database with associated meta-data. In the future, new imagery will be stored online within a central repository with the optical media being held as a backup.
Unfortunately, as most of the satellite imagery was purchased on a commercial basis the license to use the data does not generally allow UKHO to provide this imagery to other government departments or bodies without a cost to uplift the license.
In conclusion, imagery is an invaluable source of data in support of Admiralty Charting. The boundary between aerial photography and remotely sensed imagery has blurred over the years and satellites are now delivering images with resolutions undreamt of a decade ago.
As digital imagery acquisition and processing techniques improve, the Imagery Centre of the UKHO shall be able to increase its output, reduce turnaround time, plot at higher resolutions and improve accuracy.
A wide variety of imagery is used. It is used for extraction of signifi cant features in support of charting – both topographic and bathymetric and for the production of beach profi les. However, there are many other uses for the imagery; such as production of orthoimages, backdrops to charts, hydrographic fl y throughs and imagery inserts on charts and other products. It appears that the potential uses for imagery are endless and bounded only by resource constraints and our imaginations.
Further information from: www.ukho.gov.ukCrown Copyright © 2005
Video Images of the Coastline Reveal AllMark DavidsonSchool of Earth Ocean and Environmental Science, University of Plymouth, Drake Circus, Plymouth, Devon, PL14 3LX. ([email protected])
Historical Development of Coastal Video SystemsThe exciting potential of coastal video cameras for monitoring the coastline and gaining scientifi c insight into the processes that shape our coastlines was fi rst recognised in the early 1980’s by scientists from Oregon State University (OSU) in the United States. Initially the cameras were used to study the swash zone, the biting edge of the sea! Here the cameras measured water motions in this important, alternately wet and dry region of the beach, a region where large amounts of beach sediments are mobilised and transported.
Quickly it was realised that time-averaged images (a little like traditional time exposure images on analogue cameras) revealed interesting signals further offshore of the swash zone as well. In these images which typical average 600 frames over a 10 minute period, areas where waves break over shallow sandbars appear as bright bands due to the generation of foam. These bright bands were shown to provide a good proxy for the shape and position of the submerged bars allowing scientists to gain a better understanding of the nearshore response to forcing by waves and tides. A good example of this can be seen in Figure 1c where waves are breaking over the outer edge of an ebb-shoal delta.
The Argus programme (http://cil-www.oce.orst.edu:8080/), originated by Professor Rob Holman (OSU) was initiated specifi cally to further our scientifi c understanding of the generic behaviour of coastal systems in relation to forcing. This study required the installation of video systems in a broad range of physically contrasting coastal environments including energetic and quiescent, steep and shallow, and micro to macro-tidal beaches.
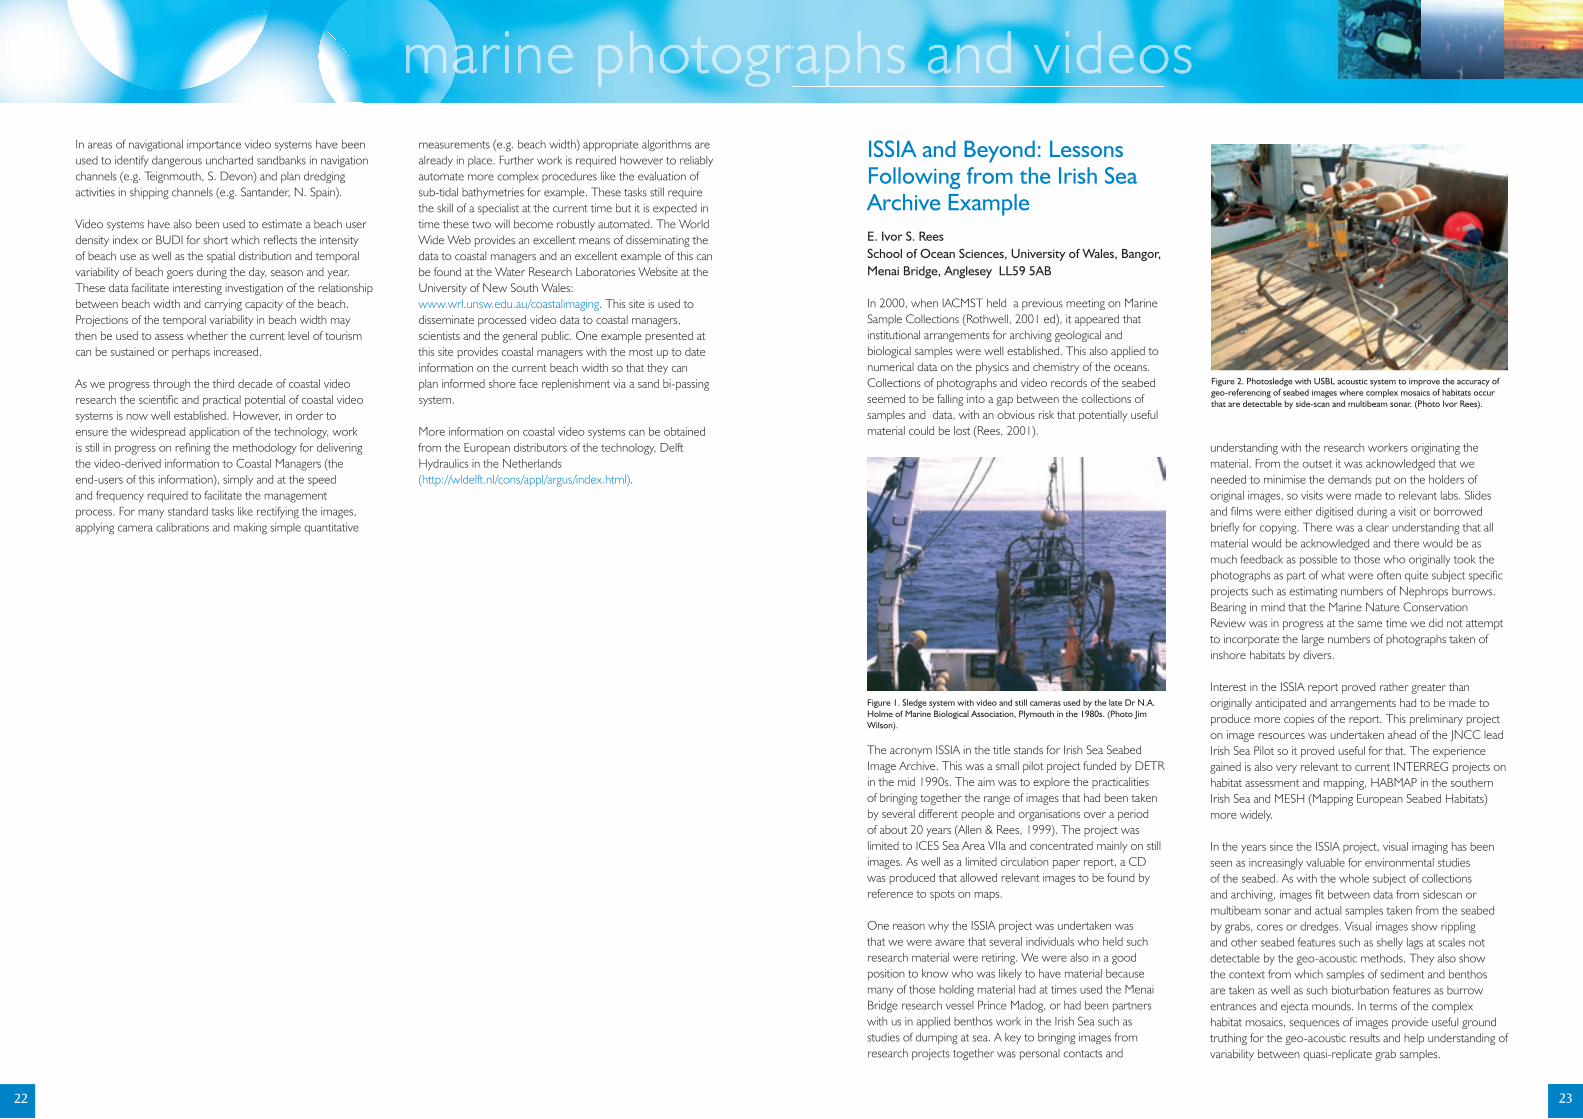
Alongside these early developments, methodologies for accurately compensating for lens distortion and rectifying oblique images to undistorted plan views were developed. Figure one shows two oblique images of the Bara Nova Inlet in S. Portugal (Figures 1a and b) and a combined rectifi ed image that has been corrected for lens distortion effects (Figure 1c). Since these fundamental developments the power of imaging systems has been exploited to provide a plethora of quantitative data including surface currents (by tracking visible turbulent structures and foam), wave speed and direction (by tracking waves), and nearshore morphology/bathymetry.
Typically a coastal video system will consist of a high vantage (usually more than 10m above sea level) on which a series of digital cameras can be mounted. The sampling of images is controlled by a standard PC which subsequently relays the information to an internet server through a broadband connection. Typically fi ve cameras can provide a 180 degree view of up to 4km of the coastline with useful resolution. An important strength of these systems is that they are fi xed in the same position for extended periods of time. Thus, the response of the coastal zone is monitored on a range of time-scales including wave, tide, seasonal and decadal frequencies. This is at variance with satellite and airborne methods of remote sensing which only provide relatively infrequent sampling.
Over the past decade the potential for coastal video systems to contribute to the management of our coastlines has also been recognised. In particular the European CoastView project was set-up in order to investigate the broader potential of coastal video systems in this area (www.thecoastviewproject.org). The CoastView project has demonstrated that video monitoring systems can usefully contribute to management in the areas of coastal protection, recreation/beach management and navigation.
Video systems can be used to provide robust/quantitative measures of the coastline position and thus show great potential to pinpoint erosion ‘hot-spots’, plan the timing and positioning of appropriate management intervention (e.g. coastal defences/beach re-nourishment) and monitor the ‘health’ of the coastline.
Figure 5. A 3-dimensional view of the coastline derived from vertical imagery.
Figure 1. The upper panels show oblique images recorded from a 30m high video tower overlooking the Bara Nova inlet near Faro, S. Portugal. The lower panel (c) is a combined rectifi ed projection of the upper two panels.
marine photographs and videosmarine photographs and videosmarine photographs and videos
20 21
Figure 4. Spot Image of the Solway Firth (20 metre resolution).© SPOT Image 2002.
2
Marine Science and TechnologyIn areas of navigational importance video systems have been used to identify dangerous uncharted sandbanks in navigation channels (e.g. Teignmouth, S. Devon) and plan dredging activities in shipping channels (e.g. Santander, N. Spain).
Video systems have also been used to estimate a beach user density index or BUDI for short which refl ects the intensity of beach use as well as the spatial distribution and temporal variability of beach goers during the day, season and year. These data facilitate interesting investigation of the relationship between beach width and carrying capacity of the beach. Projections of the temporal variability in beach width may then be used to assess whether the current level of tourism can be sustained or perhaps increased.
As we progress through the third decade of coastal video research the scientifi c and practical potential of coastal video systems is now well established. However, in order to ensure the widespread application of the technology, work is still in progress on refi ning the methodology for delivering the video-derived information to Coastal Managers (the end-users of this information), simply and at the speed and frequency required to facilitate the management process. For many standard tasks like rectifying the images, applying camera calibrations and making simple quantitative
measurements (e.g. beach width) appropriate algorithms are already in place. Further work is required however to reliably automate more complex procedures like the evaluation of sub-tidal bathymetries for example. These tasks still require the skill of a specialist at the current time but it is expected in time these two will become robustly automated. The World Wide Web provides an excellent means of disseminating the data to coastal managers and an excellent example of this can be found at the Water Research Laboratories Website at the University of New South Wales: www.wrl.unsw.edu.au/coastalimaging. This site is used to disseminate processed video data to coastal managers, scientists and the general public. One example presented at this site provides coastal managers with the most up to date information on the current beach width so that they can plan informed shore face replenishment via a sand bi-passing system.
More information on coastal video systems can be obtained from the European distributors of the technology, Delft Hydraulics in the Netherlands (http://wldelft.nl/cons/appl/argus/index.html).
ISSIA and Beyond: Lessons Following from the Irish Sea Archive ExampleE. Ivor S. ReesSchool of Ocean Sciences, University of Wales, Bangor, Menai Bridge, Anglesey LL59 5AB
In 2000, when IACMST held a previous meeting on Marine Sample Collections (Rothwell, 2001 ed), it appeared that institutional arrangements for archiving geological and biological samples were well established. This also applied to numerical data on the physics and chemistry of the oceans. Collections of photographs and video records of the seabed seemed to be falling into a gap between the collections of samples and data, with an obvious risk that potentially useful material could be lost (Rees, 2001).
The acronym ISSIA in the title stands for Irish Sea Seabed Image Archive. This was a small pilot project funded by DETR in the mid 1990s. The aim was to explore the practicalities of bringing together the range of images that had been taken by several different people and organisations over a period of about 20 years (Allen & Rees, 1999). The project was limited to ICES Sea Area VIIa and concentrated mainly on still images. As well as a limited circulation paper report, a CD was produced that allowed relevant images to be found by reference to spots on maps.
One reason why the ISSIA project was undertaken was that we were aware that several individuals who held such research material were retiring. We were also in a good position to know who was likely to have material because many of those holding material had at times used the Menai Bridge research vessel Prince Madog, or had been partners with us in applied benthos work in the Irish Sea such as studies of dumping at sea. A key to bringing images from research projects together was personal contacts and
understanding with the research workers originating the material. From the outset it was acknowledged that we needed to minimise the demands put on the holders of original images, so visits were made to relevant labs. Slides and fi lms were either digitised during a visit or borrowed briefl y for copying. There was a clear understanding that all material would be acknowledged and there would be as much feedback as possible to those who originally took the photographs as part of what were often quite subject specifi c projects such as estimating numbers of Nephrops burrows. Bearing in mind that the Marine Nature Conservation Review was in progress at the same time we did not attempt to incorporate the large numbers of photographs taken of inshore habitats by divers.
Interest in the ISSIA report proved rather greater than originally anticipated and arrangements had to be made to produce more copies of the report. This preliminary project on image resources was undertaken ahead of the JNCC lead Irish Sea Pilot so it proved useful for that. The experience gained is also very relevant to current INTERREG projects on habitat assessment and mapping, HABMAP in the southern Irish Sea and MESH (Mapping European Seabed Habitats) more widely.
In the years since the ISSIA project, visual imaging has been seen as increasingly valuable for environmental studies of the seabed. As with the whole subject of collections and archiving, images fi t between data from sidescan or multibeam sonar and actual samples taken from the seabed by grabs, cores or dredges. Visual images show rippling and other seabed features such as shelly lags at scales not detectable by the geo-acoustic methods. They also show the context from which samples of sediment and benthos are taken as well as such bioturbation features as burrow entrances and ejecta mounds. In terms of the complex habitat mosaics, sequences of images provide useful ground truthing for the geo-acoustic results and help understanding of variability between quasi-replicate grab samples.
Figure 1. Sledge system with video and still cameras used by the late Dr N.A. Holme of Marine Biological Association, Plymouth in the 1980s. (Photo Jim Wilson).
Figure 2. Photosledge with USBL acoustic system to improve the accuracy of geo-referencing of seabed images where complex mosaics of habitats occur that are detectable by side-scan and multibeam sonar. (Photo Ivor Rees).
marine photographs and videosmarine photographs and videosmarine photographs and videos
22 23

2
Marine Science and TechnologyAn example of recent uses of video and photographic methods to support both benthic biology and geological interpretation of bedforms has been work for the Outer Bristol Marine Habitat Study (Mackie et al, 2006). Here there was a complex of large sand waves with plains between with gravel shelly lag on the bed surface and some bedrock exposures. Linking between results from acoustic surveys of habitat mosaics and photographic surveys of the same ground requires more detailed geo-referencing than has previously been the case. As cameras are often on sledges towed slowly over the seabed the location of the sledge relative to GPS aerials on the ship increasingly needs to be determined. This requires the use of acoustic devices such as USBL, since merely making allowance for layback is not always adequate even where cameras are being used in the context of generalised habitat assessment.
ISSIA was a pilot project of limited duration done by a university based team. It showed that there was much material that was worth collecting. It was not in the remit to recommend what organisation should act as a repository for seabed photographs. In 2006 there are issues still to resolve on such matters as the lead agency, the standards for linking with metadata, technical issues concerning long-term curation and copyright.
ReferencesMackie, A.S.Y., James, J.W.C., Rees, E.I.S., Darbyshire, T., Philpott, S., Mortimer, K. & Jenkins, G. 2006. The Outer Bristol Channel Marine Habitat Study. Biomor , 4, National Museums of Wales.
Rees, E.I.S. 2001. Archiving seafl oor photographs and video. In Rothwell, R.G. (ed) Marine sample collections their value, use and future. Pp 22-23. Inter-Agency Committee on Marine Science and Technology.
Rothwell, R.G. (ed) 2001. Marine sample collections their value, use and future. Inter-Agency Committee on Marine Science and Technology. 56pp.
Library Image Collections – an Untapped ResourcePauline SimpsonNational Oceanography Centre, Southampton, European Way, Southampton SO14 3ZH. E-mail: [email protected].
Traditionally libraries have been the curators of images generated as part of an organization’s research output, but the changes in culture and technology have altered that perception. Images generated by current research (as illustrated by presentations during this meeting) are no longer deposited in a ‘corporate’ collection although there are some notable exceptions. A concern is that the curation activities which libraries do well: copyright, standards, metadata, accessibility, interoperability, sustainability and preservation are not a priority for the projects and research groups and individuals who now retain the images, and who are often transitory. Images are an integral part of e-Research and need long term curation. The meeting provided a timely opportunity to raise this concern and remind participants that libraries are a skilled resource that should play a signifi cant role in the stakeholder profi le of image collections.
Images have always been an important research recording mechanism, during the early expeditions by paintings, either by expedition naturalists or ships offi cers or crew. Lt Albert Markham, a ship’s offi cer, also painted on the Nares Expedition and some notable biologists/artists who painted illustrations of biological specimens as well as expedition highlights include Edward Wilson, National Antarctic Expedition 1901-04 (Figure 1) and Alistair Hardy during Discovery Investigations in the 1920’s whose paintings are still exhibited (Figure 2). From the mid to late 1800’s photography was also used, but not by an offi cial photographer until 1910 when Herbert Ponting was appointed to Scott’s crew. Previous expeditions had been recorded photographically, but never before by a specialist.
Professional photographers have in some organizations, continued to be part of scientifi c cruises, though in some, this activity was delegated to scientists who were provided with camera and fi lm to add images to the institutional collection.
These were stored in centrally maintained image collections and became the historical collections now in libraries and archives. However, with the advent of cheaper cameras and now digital photography, individual scientists are taking and retaining their own images and only sometimes for media interest are professional cameramen included on a cruise. Copyright law states that the photographer owns the copyright of an image and even though in the digital age, copies are easily transferred, researchers are not routinely depositing their images in an institutional collection. There is a need to fi nd a way of encouraging them to do so, perhaps by Terms and Conditions of Employment, or a mandate from the Funders, or even the temptation of revenue earning.
Whilst images were stored physically as photographs and slides, discovery and access to them was often restricted to personal visits, but the World Wide Web from the 1990’s has changed the world and picture researchers rely almost totally on web discovery. If you are not publishing to the web then you are often unknown, which is why libraries, academic institutions, archives, museums, historical societies, government agencies, and private companies are engaging in imaging initiatives to create digital collections of their textual, visual, and artifact collections. Commercial photo libraries were the early web based collections but libraries have not been far behind in making their historical collections available by following digitization programmes and adding essential metadata for resource discovery.
In the physical and environmental sciences there are many examples of library-maintained image collections which offer: safe corporate storage of images; a unique image identifi er for each image; access to all images and photographs; ready access to project and Centre-wide images through a search application. There are currently two dominant interface types for searching and browsing large image collections: keyword based search, and searching by overall similarity - Galleries, topics etc - a few examples:
The US National Oceanic and Atmospheric Administration Photo Library http://www.photolib.noaa.gov/ was one of the earliest library based collections to be made available on the Web, and they won the U.S. Department of Commerce Bronze Medal for it in 2000. The Royal Geographical Society received a large Heritage Lottery Award to expose its treasures to the nation. One of its fl agship products is its Picture Library http://images.rgs.org/ (Figure 3). The British
Figure 3. Surveys for ‘Scampi’ Nephrops norvegicus are one of the sources of seabed habitat data that are worth archiving because of changes due to fi shing intensity. (Photo Ivor Rees).
Figure 4. An outcrop of sedimentary rock in the Outer Bristol Channel with ‘lemon weed’ Flustra foliacea growing on it. (Photo Ivor Rees).
Figure 5. A re-worked moraine off the north coast of Anglesey with abundant anemones Urticina sp. where the cobbles and boulders are infl uenced by mobile sand. (Photo Ivor Rees).
marine photographs and videosmarine photographs and videosmarine photographs and videos
Figure 1. Edward Wilson, National Antarctic Expedition 1901-04.
Figure 2. Alistair Hardy and his paintings during RV Discovery investigations in the 1920s.
24 25

2
Marine Science and Technology
Geological Survey Library in Edinburgh maintains an excellent National Archive of Geological Photographs with enviable functionality. BGS also has an internal GeoScience ImageBase of over 100,000 images which it is planning to make available possibly on a commercial basis. As part of this initiative a number of centres within the Natural Environment Research Council who have rich collections of images, are discussing sharing the BGS software and e-commerce gateway whilst still preserving their own centre branding. The National Oceanography Centre Southampton has an embryo Research Image Library http://www.soton.ac.uk/library/resources/nolimagelibrary/index.html to expose its historical collections particularly the large collection of photographs from Discovery Investigations, so the NERC partnership route has many attractions.
Libraries have always included image curation within their skills base providing : Secure storage; Long term accessibility; Standards for interoperability; Rich metadata, including rights metadata; Resource Discovery for visibility and exploitation and Preservation. Now that individuals are taking the responsibility of image acquisition, it is not certain what level of curation is happening for images on researchers workstations or those used to enhance web publishing for personal, divisional, project and consortia etc websites. The excellent personal website, Geology of the Wessex Coast, southern England http://www.soton.ac.uk/~imw/ (Figure 4) is an example where it is hoped there are planned preservation/sustainability options. Unless management and researchers make a commitment to policies and resources in support of institutional image libraries, I would suggest that many valuable images are at risk due to the lack of long term curation that libraries routinely manage.
Images are an integral part of e-Research, alongside raw and analysed data, publications, information products and learning objects and all need to be linked to provide an audit trail from and to each object (Figure 5). Already NOAA Library is manually linking text, datasets and imagery within their library
database but this is a resource hungry activity. The National Oceanography Centre, Southampton is a partner in a JISC funded project called CLADDIER which will automate the linking, between its Institutional Research Repository and NERC Data Centres, of datasets and text metadata, with imagery also likely to be tested.
All stakeholders: funders, research organisations, universities and researchers, have a responsibility to preserve images as an important part of their research record. Libraries have a signifi cant role to play and should be recognised and supported as the logical curators of research images, many of which are at risk due to personal retention.
EUROPHLUKES: Initiating a European network to develop a European Cetacean Photo-ID System and Database1
Peter ThijsseMarine Information Service (MARIS), Dillenburgsingel 69, 2263 HW Leidschendam, The Netherlands. E-mail: [email protected]
1. IntroductionThe commercial and military use of the ocean is expanding and also moving inexorably into deeper offshore waters. As a consequence, increasing numbers of cetaceans (whales, dolphins and porpoises) are vulnerable to being impacted by these activities. Managing and mitigating the impact ofthese activities calls for a much better understanding of the distribution, behavior and population densities of Europe’s cetaceans, especially in offshore waters.
However, cetaceans are extremely diffi cult to study in their natural environment. The science of live cetacean research has really only come of age in the last three decades. Information on population and migration could, in principle, be gathered by large scale radio-tracking and DNA-basedidentifi cation, spanning long periods and large areas. The magnitude of such technical and fi nancial effort is prohibitive. Photo identifi cation is one of the key techniques that remains the most effective means for providing much of the information needed for managing cetacean populations. Identifi cation of individual cetaceans from photos is essential for research into population characteristics, migrationand life history. Individual photo-identifi cation is the only non-intrusive tool now feasible, and it will continue to be so in the foreseeable future.
2. ObjectivesScattered over Europe there were some 50 000 photos of cetaceans, held in many separate collections. It was not possible to retrieve the information on population size, survival rates and migration of cetaceans that is contained in the collections, due to the fact that a common format waslacking, as was a common feature based retrieval system. There was not one place where all the material could be accessed together.
In order to set up research infrastructure that would enable adequate monitoring of cetaceans by photo-identifi cation, three problems had to be solved:
1. the researchers involved in photo-identifi cation of cetaceans had to be brought together in a network, so as to research common standards and procedures;
2. a format for the storage of photo material and corresponding information had to be reached and a database had to be built, including tools for collecting all data;3. feature based retrieval had to be developed in order to retrieve photos of individual cetaceans.
3. Image System, management and accessibility3.1. System descriptionThe EUROPHLUKES data- and image management system (point 2 above) exists of a local system for handling metadata with the images, and storing images in the correct format for the Internet Database. The Internet part of the system collects all exports from the local system (containing less metadatafi elds than the local system) and makes them visible for the public (Figure 1).
3.2. Network of usersThe network was set up using two pathways: by organising meetings to bring together all researchers involved in photo-identifi cation of cetaceans and by linking to existing organisations and bodies involved in cetacean management and protection. For the last purpose, EUROPHLUKES established a Liaison Committee.
To construct a map of the potential network of researchers involved in cetaceans photo-identifi cation, EUROPHLUKES started by documenting all European collections, including
marine photographs and videosmarine photographs and videosmarine photographs and videos
Figure 3. The Royal Geographical Society picture library.
Figure 4. An example of a personal website: Geology of the Wessex Coast, southern England.
Figure 5. Images are an integral part of e-Research.
1 Based on the Final report of EUROPHLUKES written by CML Leiden.
Figure 1. Overview of the EUROPHLUKES system.
26 27

2
Marine Science and Technologycontact details, in a Specifi cations Handbook. To activate the network, six open meetings were organised, coinciding withthe meetings of the EUROPHLUKES consortium. During these meetings, talks and presentations were given by researchers experienced in photo-id and in analysing the results of photo-id. These presentations were made available on the EUROPHLUKES website. Initiated and supported by the meetings, documents were produced on scanning priorities, scanning procedure and watermarking of photos. All these contributed to the distribution of good practice and standards of photo-id research.
3.3. FormatWhen following good practice in photo-id on cetaceans one should start at the basis. This basis is data management starting with a common metadata format and ending with collection tools and search applications. Only then photo-identifi cation on cetaceans will lead to required results.
While developing a format for the metadata of images the identifi cation of the relevant fi elds and tables proved to be an issue. There was no best practice available so the format had to be created. It was found that there were some objections to making the data freely available beyond just date and rough place of observation. This was resolved by separating the database into obligatory and optional fi elds: the fi rst were to be fi lled in by all contributors and were to be accessible to the general public, while the second were only to be fi lled in voluntarily and were to be accessible only to the EUROPHLUKES partners and contributors. This agreement having been reached, the Internet database was designed and developed accordingly. Access to the optional fi elds was limited by a keyword that was distributed only to partners and contributors to EUROPHLUKES. The database is accessible on the internet (EUROPHLUKES.maris2.nl) and is also distributed on DVD.
3.4. Local system for data and image management The stand-alone version for data- and image management has had priority, as it is crucial for further development of the system as a whole. A Visual Basic application has been developed based on Access tables, to secure platform independence. For the local system (Figure 2) a much more
extensive metadata format has been developed. Since the partners only use this on the local system the reluctance of fi lling data is of course no issue. The format has been developed as a best practice for the information to be collected with an image and has led to a local database with the Visual Basic application on top of it.
The stand-alone version has the following features:
● Data-entry: Easy dialogue for entering metadata belonging to fi n images. Easy import and resizing of image to a 600 pixels wide copy.● Basic search: Search on the data locally collected via the stand-alone package.● DVD-search: Search via a search screen on all images and metadata collected during the project.● Export: Providing a functionality to export the local data and images to the Internet database (Figures 3 and 4).● Other useful facilities for back-up, and adjustments to the local situation.
3.5. Central metadatabase and Internet version The Internet part of the system contains a database with an abstract of the fi elds from the local database of all partners (Figure 5). Related to the database records, the 600 pixel wide images and 100 pixel wide thumbnails are also stored together with the algorithms coming from the feature extraction.
The Internet search application consists of two search interfaces. One provides an extensive alphanumericalsearch on all images collected. Results can be exported and saved to the local hard disk. The second interface (Figure 6) is for images for which a position has been supplied, a search can be done using a GIS interface. Results are then displayed on a map. By clicking on the map details of the image can be found.
4. Feature based retrieval and matching tools4.1. IntroductionThere are three general methods for feature based retrieval that have been developed:
● a method based on a linear object, such as the trailing edge of a sperm whale fl uke (tail)● a method based on a more or less triangular shape, for dorsal fi ns● a method based on coloration patterns, like that of the humpback tail.
The scientifi c objective of EUROPHLUKES was to develop three methods of feature based retrieval, to be researcher independent, based on one-dimensional linear features, based on two-dimensional linear features and on two-dimensional shapes, taking into account local and non-linear distortions. Within the EUROPHLUKES project three systems were developed for photo identifi cation of sperm whales, dolphins and humpback whales as shown in Figure 7. The partner responsible for this was CWI (National research
institute for mathematics and computer science) in the Netherlands.
The systems for identifi cation of sperm whales and dolphins are based on contour characteristics (of fl ukes and dorsal fi ns, respectively), while the system for humpback whales is based on fl uke pattern identifi cation.
4.2. SegmentationThe fi rst stage of both approaches involves segmenting the contour of a fi n or a tail from the background (sea, sky). The segmentation is a semi-automatic process, controlled by the user. Figure 8 shows the interfaces for the sperm whale trailing edge contour and dolphin dorsal fi n extractions. Tracing the contour is achieved via adaptive grey-level thresholding of the image histogram.
In the humpback whale system, the segmentation is initialised by the user who specifi es a rough polygon within the tail. An image transformation which fi nds the strongest edges in the image is then applied producing an estimate of the tail contour. This estimate can be interactively controlled by theuser. Consequently, global and local grey-level thresholds extract the white patches and the markings.
marine photographs and videosmarine photographs and videosmarine photographs and videos
Figure 2. Overview of the local system.
Figure 3. Introduction page of the local system.
Figure 4. On of the input pages of the local system – Import image and imagedata.
Figure 5. Overview of the EUROPHLUKES Internet System.
Figure 6. Search screen and results of the combined map-text search interface on EUROPHLUKES website.
Figure 7. System diagram: The different processing steps from image to identifi cation.
28 29

2
Marine Science and Technology
As a result of the segmentation stage the original image is represented by a simpler contour or binary image, containing all information relevant to the purpose of photo-identifi cation.
4.3. Feature extractionIn order to facilitate automated photo-identifi cation, a set of features describing the object of interest must be extracted and formal rules must be defi ned. To make the features independent of the camera distance and viewing angle with respect to the whale, as well as of its tail inclination, they aredesigned to be invariant up to the set of affi ne transformations (i.e. translation, rotation, dilation and shear). In the contour matching approach the features are chosen to be the point-wise set of distances between the extracted contour and its convex hull. In the pattern matching approach a tail-dependent coordinate system is proposed. Three anatomical landmarks (viz., the left and right fl uke tips and the central tail notch) specifi ed by the user defi ne the new affi ne coordinate system. Then, a coordinate grid which divides the tail into N regions is constructed.
4.4. RetrievalAfter the features have been computed offl ine for all existing images, the image database can be summarized as a matrix of features, each row of the matrix corresponding to an image. When a new photograph (query image) is submitted, it is segmented and its features are computed. Then the queryis compared to all images in the database. This is done by computing a similarity measure between the query’s feature vector and all the rows in the feature matrix. In case of contour matching the query and candidate contours are aligned (subject to affi ne transformations) and the similarity measure is the area of overlap. In the case of pattern matching Euclidean distance between the feature vectors is the measure of (dis)similarity. Then all the images in the database are ranked based on their measures in respect to the query. Figure 9 illustrates these steps for the sperm whale matching program. The user can access the original images from the ranking list and compare them to the original of the query.
4.5. Performance of feature based retrieval and matching toolsIt was found that the quality of the photos varied widely. Cetaceans spend considerable time underwater and opportunities to take photos are few. In contrast to industrial and medical image processing applications, the photos are not taken in a controlled environment. Position and angle ofthe object, resolution and lighting are outside the control of the photographer. More seriously, it was found that some tails and dorsal fi ns partially bended, resulting in local and non-linear distortions. Techniques developed for the identifi cation of airplanes and ships could not be applied withoutadjustment, as airplanes and ships are ridged and are not subject to local non-linear transformations.
As the photos are taken in the fi eld under varying circumstances, it was found impossible to extract theidentifying features from the photo without some level of human intervention. This was caused by those parts of the photograph with the information that identifi ed the individual varing widely in position and size, while the non-relevant information was not uniform in character, magnitude or position.
The sperm whale system has already been tested during fi eld trials in the Gulf of Mexico. However, to accurately gauge the performance of the system they need to be tested in controlled circumstances on existing databases that have already been labeled by an expert. Tests show that for the sperm whale identifi cation system using a typical database of 600 images there is 93% probability of fi nding the correct matching among the top 1% of the images ranked by the system.
Overall, for the 75% of all images their true match was ranked fi rst. This performance increases up to 86% if we insist on fi nding the true match(es) among the top 3, and for all images of the database the true matches appeared in the top 10.
5. Conclusions In total, 51 contributors provided 52824 photos of 23 species of cetaceans, which were stored in a database,accessible over the Internet (www.europhlukes.net) and available on a standalone DVD. Algorithms for feature based retrieval were produced and tested and a method for digitally watermarking the pictures has also been produced to protect EUROPHLUKES copyright.
The experimental results of the feature based recognition system clearly show the potential to effi ciently assist the a researcher by signifi cantly decreasing the number of images to be inspected. Although the interface has been designed with specifi c species in mind, the proposed methodologies are general enough to be applied to other cetacean species.
The period following the end of the project will be used to collect comments for further improvement of the stand-alone version as well as the Internet version. The overall objective is to have all contributors to the EUROPHLUKES database import their images and metadata and extracted features in the stand-alone version and afterwards collect all high quality data so contributors will be able to conduct further research into populations and migrations.
Figure 8. Contour extraction of the trailing edge of a sperm whale tail (left) and the dorsal fi n of a dolphin (right). A clear notch is visible on the fi n.
Figure 9. Contour matching for sperm whales. The two original contours (Left: top blue and red) are aligned for maximum overlap (left: bottom green and red). The system ranks the database images based on the similarity to the query (right).
marine photographs and videosmarine photographs and videosmarine photographs and videos
30 31
© Mills Media
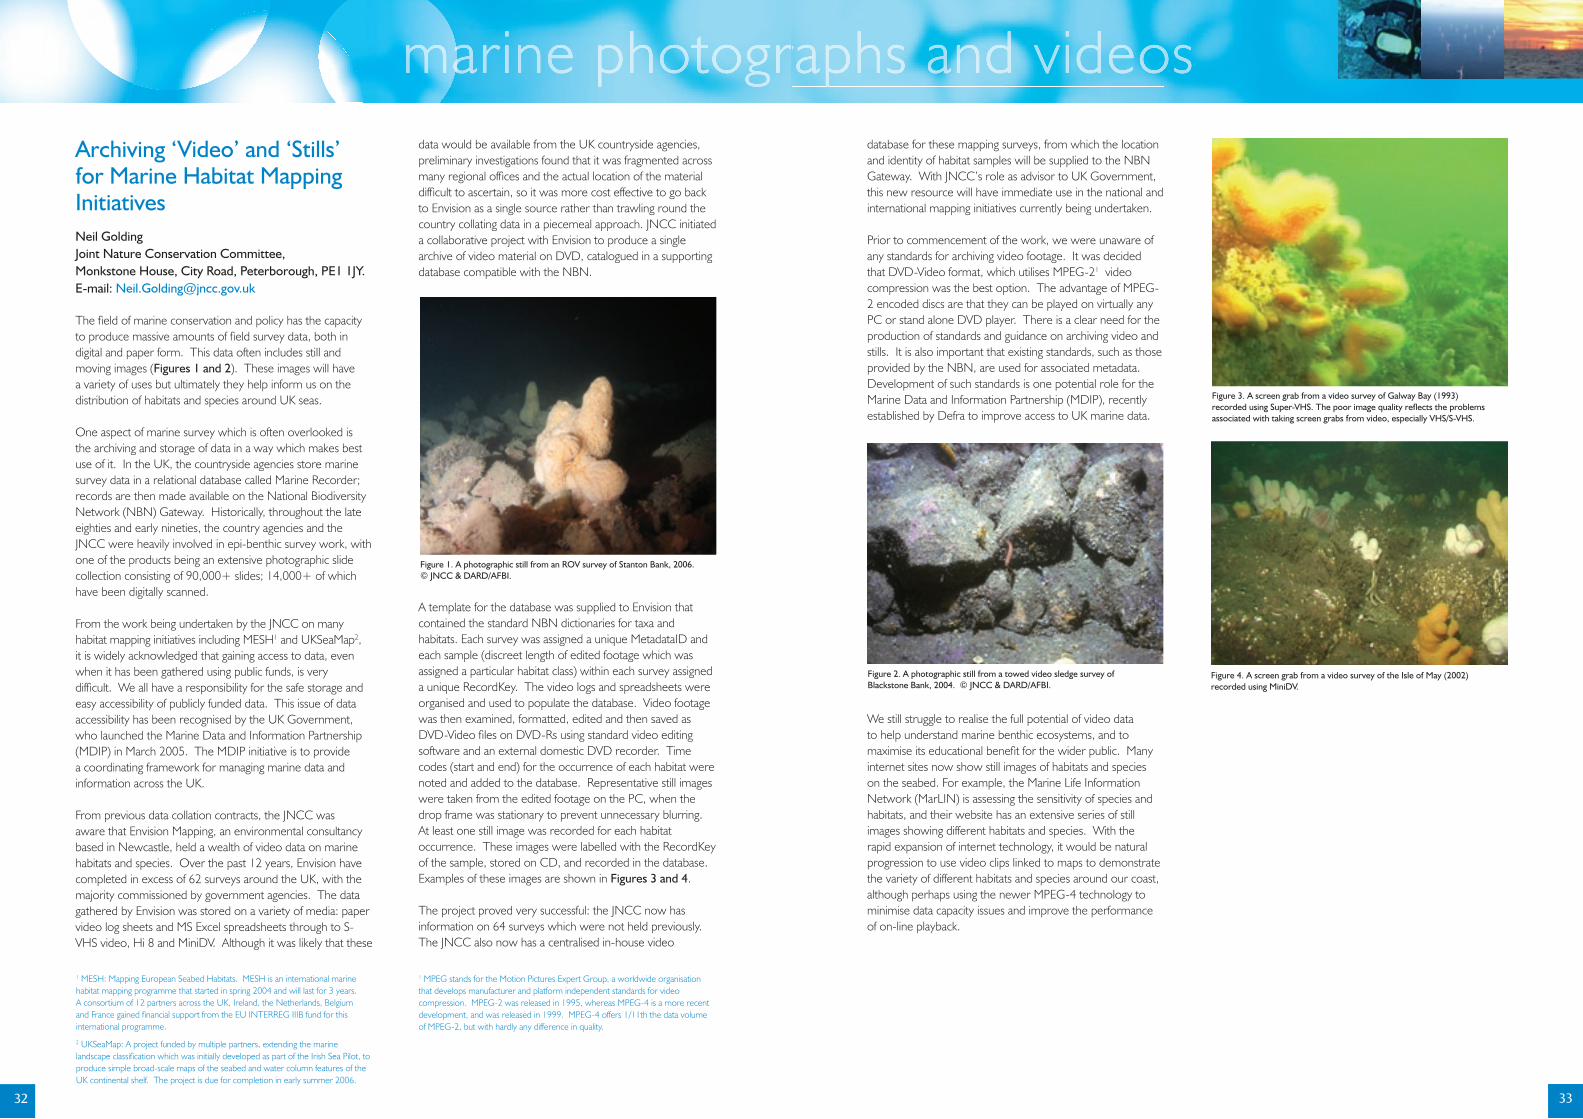
2
Marine Science and TechnologyArchiving ‘Video’ and ‘Stills’ for Marine Habitat Mapping InitiativesNeil GoldingJoint Nature Conservation Committee, Monkstone House, City Road, Peterborough, PE1 1JY. E-mail: [email protected]
The fi eld of marine conservation and policy has the capacity to produce massive amounts of fi eld survey data, both in digital and paper form. This data often includes still and moving images (Figures 1 and 2). These images will have a variety of uses but ultimately they help inform us on the distribution of habitats and species around UK seas.
One aspect of marine survey which is often overlooked is the archiving and storage of data in a way which makes best use of it. In the UK, the countryside agencies store marine survey data in a relational database called Marine Recorder; records are then made available on the National Biodiversity Network (NBN) Gateway. Historically, throughout the late eighties and early nineties, the country agencies and the JNCC were heavily involved in epi-benthic survey work, with one of the products being an extensive photographic slide collection consisting of 90,000+ slides; 14,000+ of which have been digitally scanned.
From the work being undertaken by the JNCC on many habitat mapping initiatives including MESH1 and UKSeaMap2, it is widely acknowledged that gaining access to data, even when it has been gathered using public funds, is very diffi cult. We all have a responsibility for the safe storage and easy accessibility of publicly funded data. This issue of data accessibility has been recognised by the UK Government, who launched the Marine Data and Information Partnership (MDIP) in March 2005. The MDIP initiative is to provide a coordinating framework for managing marine data and information across the UK.
From previous data collation contracts, the JNCC was aware that Envision Mapping, an environmental consultancy based in Newcastle, held a wealth of video data on marine habitats and species. Over the past 12 years, Envision have completed in excess of 62 surveys around the UK, with the majority commissioned by government agencies. The data gathered by Envision was stored on a variety of media: paper video log sheets and MS Excel spreadsheets through to S-VHS video, Hi 8 and MiniDV. Although it was likely that these
data would be available from the UK countryside agencies, preliminary investigations found that it was fragmented across many regional offi ces and the actual location of the material diffi cult to ascertain, so it was more cost effective to go back to Envision as a single source rather than trawling round the country collating data in a piecemeal approach. JNCC initiated a collaborative project with Envision to produce a single archive of video material on DVD, catalogued in a supporting database compatible with the NBN.
A template for the database was supplied to Envision that contained the standard NBN dictionaries for taxa and habitats. Each survey was assigned a unique MetadataID and each sample (discreet length of edited footage which was assigned a particular habitat class) within each survey assigned a unique RecordKey. The video logs and spreadsheets were organised and used to populate the database. Video footage was then examined, formatted, edited and then saved as DVD-Video fi les on DVD-Rs using standard video editing software and an external domestic DVD recorder. Time codes (start and end) for the occurrence of each habitat were noted and added to the database. Representative still images were taken from the edited footage on the PC, when the drop frame was stationary to prevent unnecessary blurring. At least one still image was recorded for each habitat occurrence. These images were labelled with the RecordKey of the sample, stored on CD, and recorded in the database. Examples of these images are shown in Figures 3 and 4.
The project proved very successful: the JNCC now has information on 64 surveys which were not held previously. The JNCC also now has a centralised in-house video
database for these mapping surveys, from which the location and identity of habitat samples will be supplied to the NBN Gateway. With JNCC’s role as advisor to UK Government, this new resource will have immediate use in the national and international mapping initiatives currently being undertaken.
Prior to commencement of the work, we were unaware of any standards for archiving video footage. It was decided that DVD-Video format, which utilises MPEG-21 video compression was the best option. The advantage of MPEG-2 encoded discs are that they can be played on virtually any PC or stand alone DVD player. There is a clear need for the production of standards and guidance on archiving video and stills. It is also important that existing standards, such as those provided by the NBN, are used for associated metadata. Development of such standards is one potential role for the Marine Data and Information Partnership (MDIP), recently established by Defra to improve access to UK marine data.
We still struggle to realise the full potential of video data to help understand marine benthic ecosystems, and to maximise its educational benefi t for the wider public. Many internet sites now show still images of habitats and species on the seabed. For example, the Marine Life Information Network (MarLIN) is assessing the sensitivity of species and habitats, and their website has an extensive series of still images showing different habitats and species. With the rapid expansion of internet technology, it would be natural progression to use video clips linked to maps to demonstrate the variety of different habitats and species around our coast, although perhaps using the newer MPEG-4 technology to minimise data capacity issues and improve the performance of on-line playback.
Figure 1. A photographic still from an ROV survey of Stanton Bank, 2006. © JNCC & DARD/AFBI.
Figure 4. A screen grab from a video survey of the Isle of May (2002) recorded using MiniDV.
1 MESH: Mapping European Seabed Habitats. MESH is an international marine habitat mapping programme that started in spring 2004 and will last for 3 years. A consortium of 12 partners across the UK, Ireland, the Netherlands, Belgium and France gained fi nancial support from the EU INTERREG IIIB fund for this international programme.
2 UKSeaMap: A project funded by multiple partners, extending the marine landscape classifi cation which was initially developed as part of the Irish Sea Pilot, to produce simple broad-scale maps of the seabed and water column features of the UK continental shelf. The project is due for completion in early summer 2006.
1 MPEG stands for the Motion Pictures Expert Group, a worldwide organisation that develops manufacturer and platform independent standards for video compression. MPEG-2 was released in 1995, whereas MPEG-4 is a more recent development, and was released in 1999. MPEG-4 offers 1/11th the data volume of MPEG-2, but with hardly any difference in quality.
marine photographs and videosmarine photographs and videosmarine photographs and videos
32 33
Figure 3. A screen grab from a video survey of Galway Bay (1993) recorded using Super-VHS. The poor image quality refl ects the problems associated with taking screen grabs from video, especially VHS/S-VHS.
Figure 2. A photographic still from a towed video sledge survey of Blackstone Bank, 2004. © JNCC & DARD/AFBI.

2
Marine Science and TechnologyA Brief Introduction to the Digital Curation CentreLiz LyonDigital Curation Centre, University of Edinburgh, Appleton Tower, Crichton St, Edinburgh EH8 9LE. E-mail: [email protected]
BackgroundThe inter-relationship between the concepts of digital preservation and data curation are simply illustrated in Figure 1. Data Curation is an ongoing process which maintains and adds value to a trusted body of digital information for current and future use. Digital Preservation facilitates the longer term custodianship of information.
Data curation is set in the context of a number of relatively new drivers that have increased the demand for open access to primary data. These include the requirement to run model simulations from observational data in astronomical sciences and the need to conduct large scale experiments in particle physics for example, both leading to a growing trend towards data-driven science. A range of inter-disciplinary eScience and grid-enabled cyberinfrastructure applications will also provide increasing volumes of data, which in turn will generate increased demand for access to the primary datasets for further transformation and analysis. Well-managed curation approaches will facilitate added-value services such as annotation and visualisation, data ‘post-processing’ and knowledge extraction methodologies using complex algorithms and data mining techniques. This in turn will facilitate further modelling, simulation and data transformation.
Access to images A number of Web-based initiatives may be considered as potential services to encourage the development of a more collaborative approach to the sharing of marine photographs and videos.
Flickr is an online photo management and sharing application which allows individuals to make their photos available to others on the Web, to tag images with descriptors to enable discovery by a range of search engines. Del.icio.us is a Web tool that allows users to apply one-word descriptors (tags), to assign a bookmark to resources such as an article, an image or a dataset. This informal approach allows greater freedom in allocating tags to assist the fi nding of digital resources, than using more structured approaches such as thesauri or other formal knowledge organisation systems. Furthermore, when another member has used the same tag within del.icio.us, a user can view all bookmarks that are tagged with that search term.
The Technical Advisory Service for Images (TASI) is a JISC-funded service providing advice and guidance to the UK further and higher education community on a variety of image-related issues. This includes digitising images, retrieving digital images, and using images to support learning and research.
Digital repositoriesImages used in research applications may be deposited in a digital repository either within an institution or in a department or in a subject-based repository. There are particular standards and protocols that enable the description of complex digital objects within repositories, such as Metadata Encoding and Transmission Standard (METS), and MPEG 21 Digital Item Declaration Language (DIDL). The Open Archives Initiative Protocol for Metadata Harvesting (OAI-PMH) facilitates the gathering of descriptive metadata about objects within digital repositories for exposure to third party services such as Google and other search engines.
In an interesting exemplar activity, the JISC-funded eBank UK Project led by UKOLN, has brought together chemists, digital librarians and computer scientists in an interdisciplinary collaboration which explores the potential for publishing open access datasets in the domain of crystallography and linking the data to the derived publication as part of the scholarly knowledge cycle (Figure 2). Deposits of crystal structures into a data repository at the University of Southampton provides improved access to experimental data to promote more rapid scholarly communication and dissemination. Similar models such as this could be used to link images to research publications.
The Digital Curation CentreThe Digital Curation Centre (DCC) has been established by the Joint Information System Committee (JISC) and Engineering and Physical Sciences Research Council (EPSRC) to address the extensive challenges of curating and preserving the primary outputs of research and to provide advice and support services to UK institutions (Figure 3). The DCC is led by the University of Edinburgh with partners the University of Glasgow (Human Advanced Technology and Information Institute), UKOLN at the University of Bath and the Council for the Central Laboratory of the Research Councils (CCLRC). Working with other practitioners, the DCC will support researchers, curators and policy makers in UK institutions in the storage, management and preservation of datasets to help ensure their enhancement and their continuing long-term use. The purpose of the DCC is also to provide a national focus for research and development into curation issues and to promote expertise and good practice, both national and international, for the management of all research outputs in digital format. The wider community may participate with DCC through an Associates Network and there is an online discussion forum which recognises DCCs drive to engage with institutions, organisations and individuals across all disciplines and domains.
ConclusionResearchers creating, using and curating photographs and videos for the marine sciences should look more widely across other disciplines to consider appropriate digital curation approaches and relevant knowledge extraction tools. Planning for digital curation and preservation should be initiated at the start of any project to ensure that well-structured methodologies are adopted, that there is the potential for wider (open) access to marine photographs and videos and that digital preservation policies are in place which may ensure the longevity of these resources over time.
marine photographs and videosmarine photographs and videosmarine photographs and videos
34 35
Figure 1. Slide showing simple inter-relationship between digital preservation and data curation.
Figure 2. Data Flow diagram from eBank UK project.
Figure 3. DCC Website screen shot and activities.
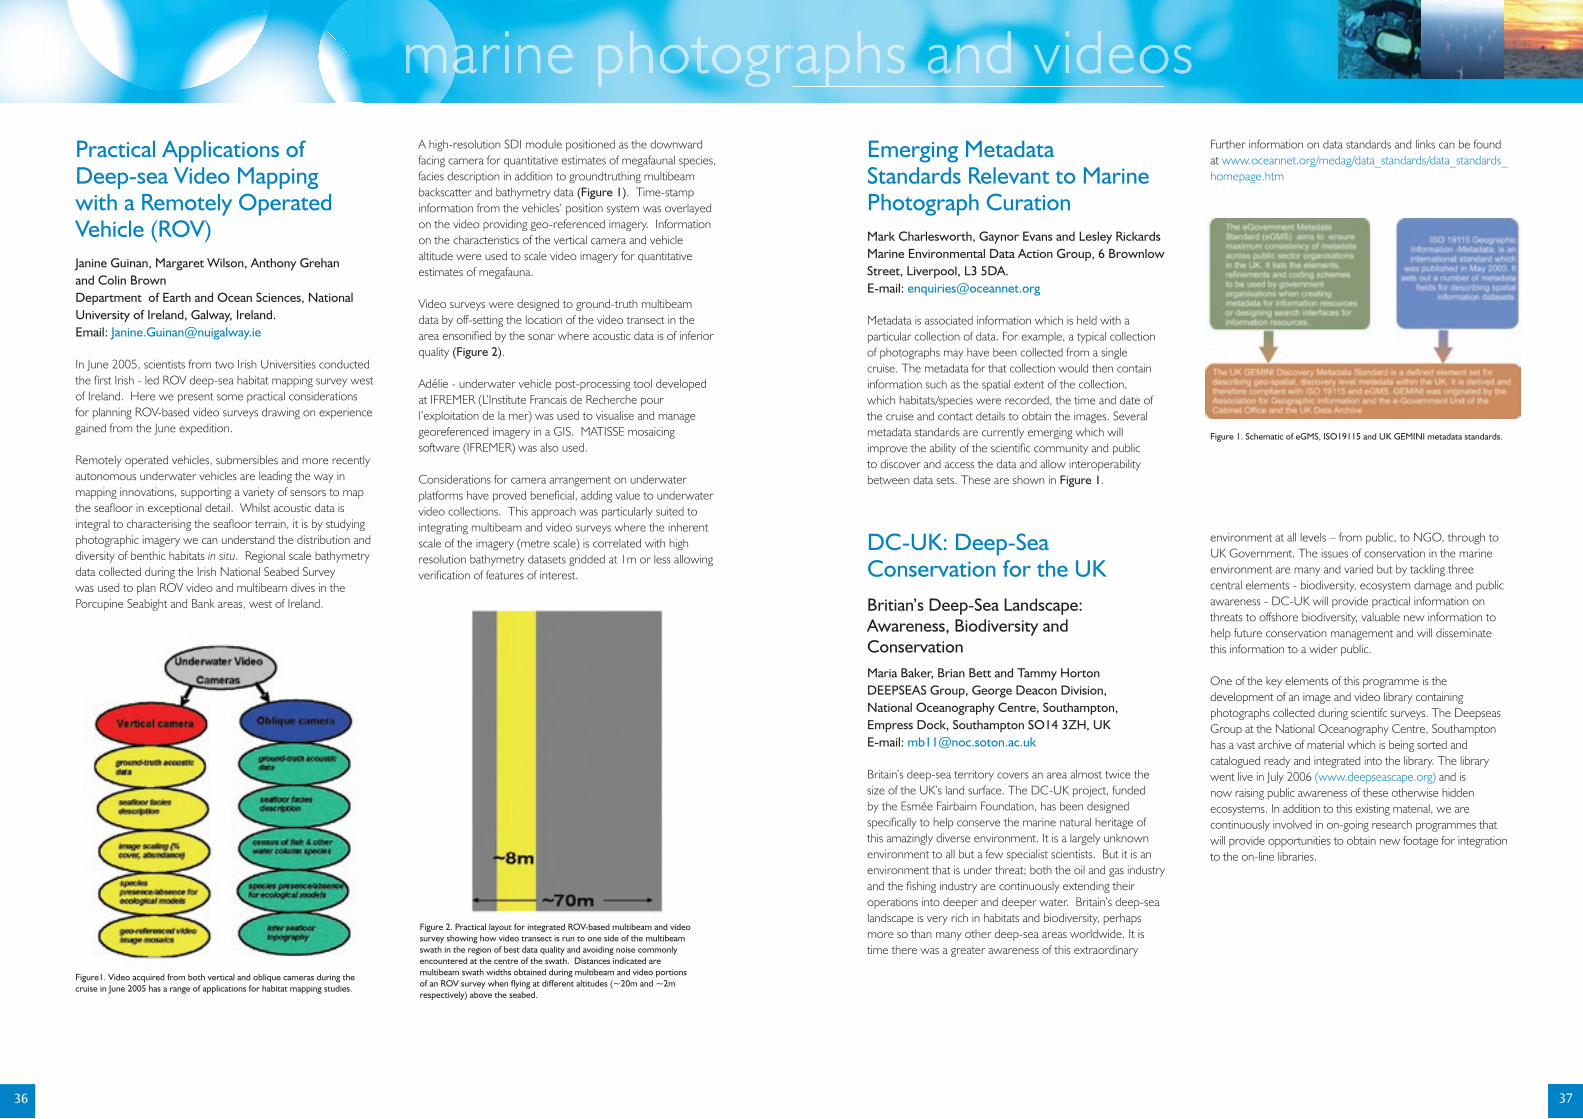
2
Marine Science and TechnologyPractical Applications of Deep-sea Video Mapping with a Remotely Operated Vehicle (ROV)Janine Guinan, Margaret Wilson, Anthony Grehan and Colin BrownDepartment of Earth and Ocean Sciences, National University of Ireland, Galway, Ireland.Email: [email protected]
In June 2005, scientists from two Irish Universities conducted the fi rst Irish - led ROV deep-sea habitat mapping survey west of Ireland. Here we present some practical considerations for planning ROV-based video surveys drawing on experience gained from the June expedition.
Remotely operated vehicles, submersibles and more recently autonomous underwater vehicles are leading the way in mapping innovations, supporting a variety of sensors to map the seafl oor in exceptional detail. Whilst acoustic data is integral to characterising the seafl oor terrain, it is by studying photographic imagery we can understand the distribution and diversity of benthic habitats in situ. Regional scale bathymetry data collected during the Irish National Seabed Survey was used to plan ROV video and multibeam dives in the Porcupine Seabight and Bank areas, west of Ireland.
A high-resolution SDI module positioned as the downward facing camera for quantitative estimates of megafaunal species, facies description in addition to groundtruthing multibeam backscatter and bathymetry data (Figure 1). Time-stamp information from the vehicles’ position system was overlayed on the video providing geo-referenced imagery. Information on the characteristics of the vertical camera and vehicle altitude were used to scale video imagery for quantitative estimates of megafauna.
Video surveys were designed to ground-truth multibeam data by off-setting the location of the video transect in the area ensonifi ed by the sonar where acoustic data is of inferior quality (Figure 2).
Adélie - underwater vehicle post-processing tool developed at IFREMER (L’Institute Francais de Recherche pour l’exploitation de la mer) was used to visualise and manage georeferenced imagery in a GIS. MATISSE mosaicing software (IFREMER) was also used.
Considerations for camera arrangement on underwater platforms have proved benefi cial, adding value to underwater video collections. This approach was particularly suited to integrating multibeam and video surveys where the inherent scale of the imagery (metre scale) is correlated with high resolution bathymetry datasets gridded at 1m or less allowing verifi cation of features of interest.
Emerging Metadata Standards Relevant to Marine Photograph CurationMark Charlesworth, Gaynor Evans and Lesley RickardsMarine Environmental Data Action Group, 6 Brownlow Street, Liverpool, L3 5DA. E-mail: [email protected]
Metadata is associated information which is held with a particular collection of data. For example, a typical collection of photographs may have been collected from a singlecruise. The metadata for that collection would then contain information such as the spatial extent of the collection, which habitats/species were recorded, the time and date of the cruise and contact details to obtain the images. Several metadata standards are currently emerging which will improve the ability of the scientifi c community and public to discover and access the data and allow interoperability between data sets. These are shown in Figure 1.
Further information on data standards and links can be found at www.oceannet.org/medag/data_standards/data_standards_homepage.htm
Figure1. Video acquired from both vertical and oblique cameras during the cruise in June 2005 has a range of applications for habitat mapping studies.
Figure 2. Practical layout for integrated ROV-based multibeam and video survey showing how video transect is run to one side of the multibeam swath in the region of best data quality and avoiding noise commonly encountered at the centre of the swath. Distances indicated are multibeam swath widths obtained during multibeam and video portions of an ROV survey when fl ying at different altitudes (~20m and ~2m respectively) above the seabed.
marine photographs and videosmarine photographs and videosmarine photographs and videos
36 37
Figure 1. Schematic of eGMS, ISO19115 and UK GEMINI metadata standards.
DC-UK: Deep-Sea Conservation for the UKBritian’s Deep-Sea Landscape: Awareness, Biodiversity and ConservationMaria Baker, Brian Bett and Tammy HortonDEEPSEAS Group, George Deacon Division, National Oceanography Centre, Southampton, Empress Dock, Southampton SO14 3ZH, UKE-mail: [email protected]
Britain’s deep-sea territory covers an area almost twice the size of the UK’s land surface. The DC-UK project, funded by the Esmée Fairbairn Foundation, has been designed specifi cally to help conserve the marine natural heritage of this amazingly diverse environment. It is a largely unknown environment to all but a few specialist scientists. But it is an environment that is under threat; both the oil and gas industry and the fi shing industry are continuously extending their operations into deeper and deeper water. Britain’s deep-sea landscape is very rich in habitats and biodiversity, perhaps more so than many other deep-sea areas worldwide. It is time there was a greater awareness of this extraordinary
environment at all levels – from public, to NGO, through to UK Government. The issues of conservation in the marine environment are many and varied but by tackling three central elements - biodiversity, ecosystem damage and public awareness - DC-UK will provide practical information on threats to offshore biodiversity, valuable new information to help future conservation management and will disseminate this information to a wider public.
One of the key elements of this programme is the development of an image and video library containing photographs collected during scientifc surveys. The Deepseas Group at the National Oceanography Centre, Southampton has a vast archive of material which is being sorted and catalogued ready and integrated into the library. The library went live in July 2006 (www.deepseascape.org) and is now raising public awareness of these otherwise hidden ecosystems. In addition to this existing material, we are continuously involved in on-going research programmes that will provide opportunities to obtain new footage for integration to the on-line libraries.
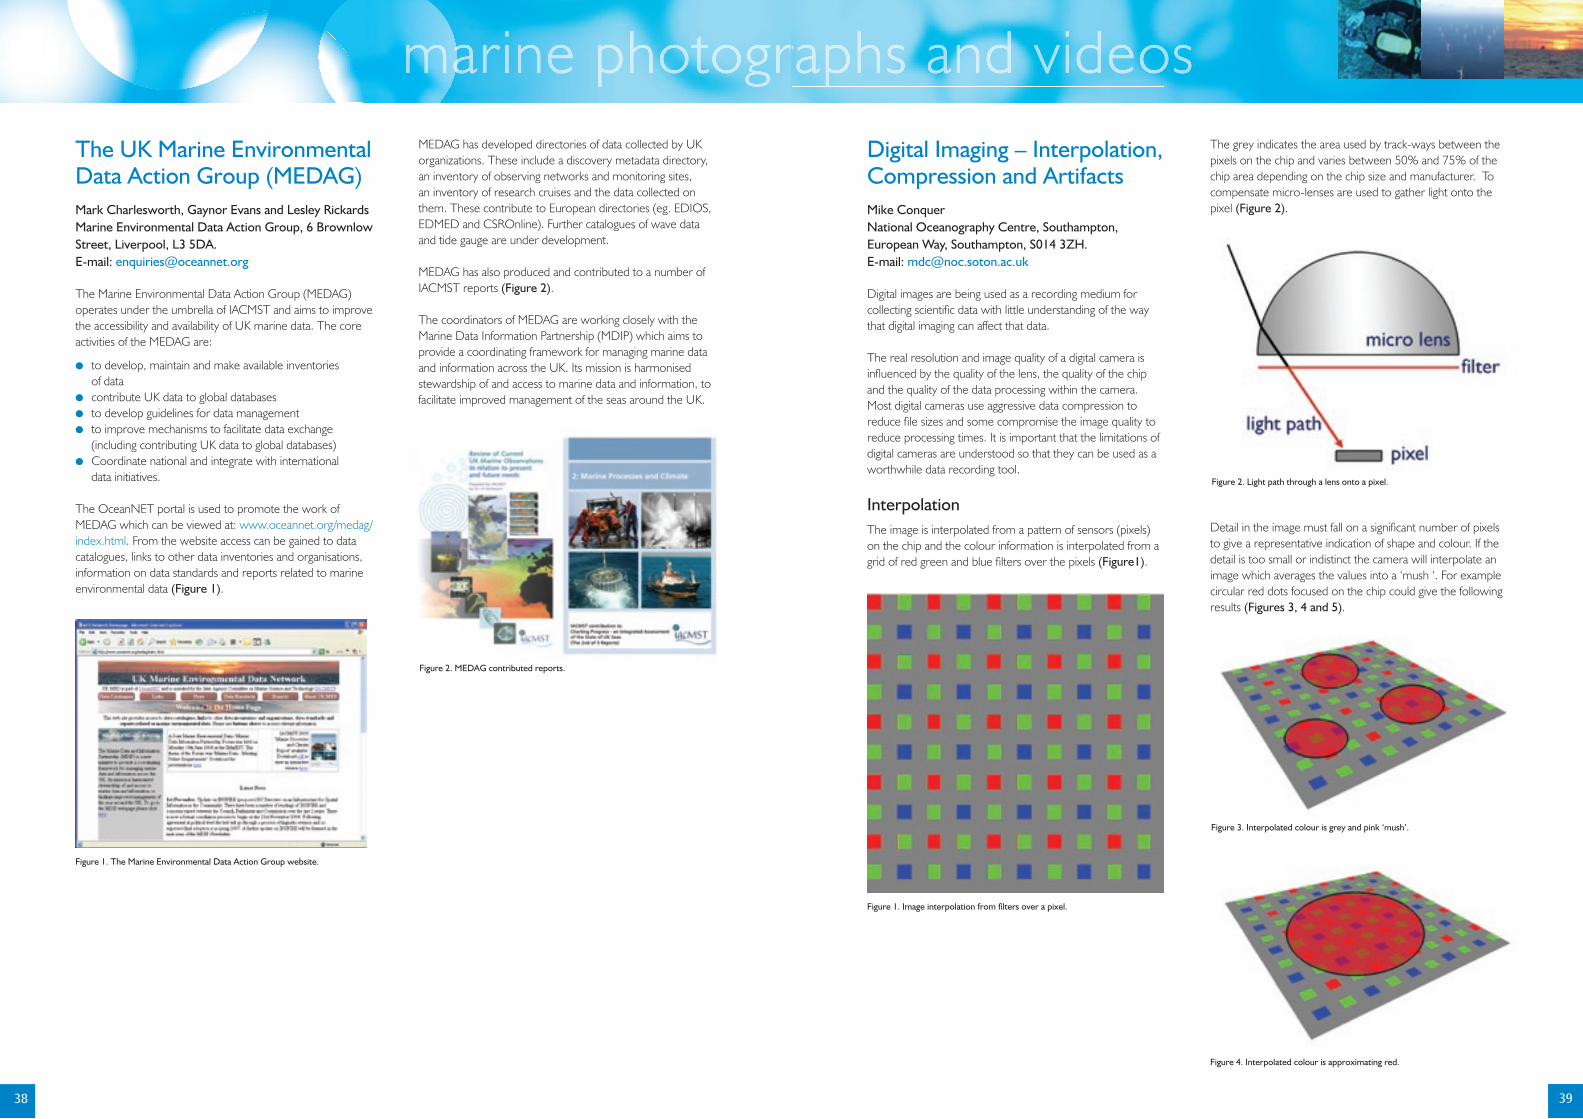
2
Marine Science and TechnologyThe UK Marine Environmental Data Action Group (MEDAG)Mark Charlesworth, Gaynor Evans and Lesley RickardsMarine Environmental Data Action Group, 6 Brownlow Street, Liverpool, L3 5DA. E-mail: [email protected]
The Marine Environmental Data Action Group (MEDAG) operates under the umbrella of IACMST and aims to improve the accessibility and availability of UK marine data. The core activities of the MEDAG are:
● to develop, maintain and make available inventories of data ● contribute UK data to global databases● to develop guidelines for data management ● to improve mechanisms to facilitate data exchange (including contributing UK data to global databases) ● Coordinate national and integrate with international data initiatives.
The OceanNET portal is used to promote the work of MEDAG which can be viewed at: www.oceannet.org/medag/index.html. From the website access can be gained to data catalogues, links to other data inventories and organisations, information on data standards and reports related to marine environmental data (Figure 1).
MEDAG has developed directories of data collected by UK organizations. These include a discovery metadata directory, an inventory of observing networks and monitoring sites, an inventory of research cruises and the data collected on them. These contribute to European directories (eg. EDIOS, EDMED and CSROnline). Further catalogues of wave data and tide gauge are under development.
MEDAG has also produced and contributed to a number of IACMST reports (Figure 2). The coordinators of MEDAG are working closely with the Marine Data Information Partnership (MDIP) which aims to provide a coordinating framework for managing marine data and information across the UK. Its mission is harmonised stewardship of and access to marine data and information, to facilitate improved management of the seas around the UK.
Figure 1. The Marine Environmental Data Action Group website.
Figure 2. MEDAG contributed reports.
marine photographs and videosmarine photographs and videosmarine photographs and videos
38 39
Digital Imaging – Interpolation, Compression and ArtifactsMike ConquerNational Oceanography Centre, Southampton, European Way, Southampton, S014 3ZH. E-mail: [email protected]
Digital images are being used as a recording medium for collecting scientifi c data with little understanding of the way that digital imaging can affect that data.
The real resolution and image quality of a digital camera is infl uenced by the quality of the lens, the quality of the chip and the quality of the data processing within the camera. Most digital cameras use aggressive data compression to reduce fi le sizes and some compromise the image quality to reduce processing times. It is important that the limitations of digital cameras are understood so that they can be used as a worthwhile data recording tool.
InterpolationThe image is interpolated from a pattern of sensors (pixels) on the chip and the colour information is interpolated from a grid of red green and blue fi lters over the pixels (Figure1).
The grey indicates the area used by track-ways between the pixels on the chip and varies between 50% and 75% of the chip area depending on the chip size and manufacturer. To compensate micro-lenses are used to gather light onto the pixel (Figure 2).
Detail in the image must fall on a signifi cant number of pixels to give a representative indication of shape and colour. If the detail is too small or indistinct the camera will interpolate an image which averages the values into a ‘mush ‘. For example circular red dots focused on the chip could give the following results (Figures 3, 4 and 5).
Figure 1. Image interpolation from fi lters over a pixel.
Figure 2. Light path through a lens onto a pixel.
Figure 3. Interpolated colour is grey and pink ‘mush’.
Figure 4. Interpolated colour is approximating red.

2
Marine Science and Technology
The structure of the chip in a digital camera restricts the non- interpolated resolution to less than fi lm can record. When the accurate recording of fi ne detail with a digital camera is important it may be necessary to shoot close-ups of the detail.
Compression and ArtefactsDigital cameras interpolate and compress data from the imaging chip within the camera, and can create data processing artefacts which become part of the image that is stored.
The most commonly used compression (.jpg) was developed in the 1990’s when storage space was at a premium and so creates a fi le that attempts to look like the camera image but does not contain every pixel. This compression algorithm is sophisticated but can produce images that contain visible data compression artefacts. Fine irregular detail compresses with the greatest information loss. To reduce loss of detail always work at the highest quality setting available. Figure 6 shows enlarged images to demonstrate the effect on pixel structure by compression. Some cameras offer the alternative of storing raw data fi les, these can be slow to store but offer the highest quality.
Figure 5. Interpolated colour, size and shape is nearly correct.
a)
Figure 6. Effect of compression of image quality, a) high compression showing enlarged pixels and changes in detail resolution and colour, b) low compression.
marine photographs and videosmarine photographs and videosmarine photographs and videos
40 41
b)
Scuba Divers: Tapping into a Growing LibraryJon Bramley1 & Stefanie Buell21Bramley Associates/Kent Seasearch, Forge House, London Road, Dunkirk, Kent ME13 9LL. E-mail: [email protected] & Medway Biological Records Centre, Tyland Barn, Sandling, Maidstone, Kent ME14 3BD.
Since the development of SCUBA diving in the late 1940’s, recreational divers have taken photographs of marine life, seascapes and shipwrecks. Recent developments in digital photography and the accessibility of underwater housings have led to an exponential increase in the number of pictures now being taken.
We estimate that over a million dives are carried out annually around the UK by SCUBA divers and there is a growing but untapped library of underwater photographs being accrued.These photographs are likely to contain signifi cant information on seascapes and marine archaeology as well as about marine species and habitat distribution. In addition, as divers regularly keep a log of their dives, the photos will generally be associated with a GPS position, time and date, as well as other relevant data such as depth, water temperature, underwater visibility and current.
The cost of underwater camera and video equipment has now reduced to a level that is accessible to a wide range of divers. At the NEC Dive Show (Dec 2005), a 4 megapixel camera with underwater housing could be purchased for less than £200.
Most diving agencies encourage their members to undertake training in the identifi cation of marine habitats and species through the Marine Conservation Society’s Seasearch programme; while training with the Nautical Archaeological Society in maritime archaeology is also promoted. The result being that there are a lot of interested divers out there.
In Kent, the county Wildlife Trust’s Marine Offi cer, together with the Kent & Medway Biological Records Centre encourage divers to submit photographs along with species records. These are then checked and verifi ed by the Marine Offi cer and staff from the Records Centre before being stored electronically. The species and habitat records collected by volunteer divers in Kent are stored on the JNCC’s Marine Recorder database as part of the national Seasearch programme; the records are then made available on the National Biodiversity Network (NBN). Currently, Marine Recorder has no facility for the storage of photographic records. We propose that the development of an add-on to the software would allow records within the database to be linked to photographic records, as is the case with the Recorder database commonly used by Biological Records Centres for terrestrial data. This would enable the records and their corresponding images to be stored in an easily accessible format, allowing a more comprehensive collation of the data being recorded within coastal waters.
Useful links:Kent & Medway Biological Records Centre: www.kmbrc.org.ukKent Wildlife Trust: www.kentwildlife.org.ukSeasearch: www.seasearch.org.ukMarine Recorder: www.jncc.gov.uk/page-1599NBN: www.searchnbn.net
© Tom Reid
© Tom Reid
© Matin Bardoe © Bryony Chapman

2
Marine Science and Technologymarine photographs and videosmarine photographs and videosmarine photographs and videos
42 43
Summary and Recommendations Mark Charlesworth.Marine Environmental Data Action Group, 6 Brownlow Street, Liverpool, L3 5DA. E-mail: [email protected]
The presentations made during the workshop demonstrated a wide variety of uses of photographs and videos for research and monitoring. As such photographs and videos should be seen as data in their own right which may be used as tools to further generate knowledge. Frequently a photograph or video is taken for a specifi c purpose within an organisation, however it may have a number of different uses outside that for which it was taken. These additional uses are often not recognised and the collections not publicised or made available to the wider public.
Raising the profi le of marine and coastal photographs and videosRaising the profi le of the use of photographs and videos and recognising them as data may improve access to collections held by institutions and improve funding opportunities for long term curation. This workshop report is one aspect of the process to demonstrate the various uses of photographs and videos, however several other mechanisms are also available including:
● promotion of data holdings by established institutions or initiatives such as libraries and archive centres
● greater recognition of the need to curate marine photographs and videos, for example, within the Marine Data and Information Partnership (MDIP) framework
● greater recognition of the use of photographs and videos within international data initiatives such as International Council for the Exploration of the Sea (ICES) and IOC’s International Oceanographic Data and Information Exchange (IODE) programme
● using photographs to demonstrate scientifi c phenomenon which may attract media attention. Photographs which demonstrate retreating glaciers due to climate change are frequently used by the press. Similar photographs demonstrating ecological and morphological phenomenon can equally capture the imagination of the public
● demonstrating the use of marine photographs and videos in outreach programmes such as those undertaken by the SERPENT project and the Marine Biological Association (this volume).
Widening access to marine and coastal photographs and videosThere are two main approaches to making photographs and videos more widely available;
Firstly, by the submission of photographs and videos to recognised centres such as libraries or data archive centres who then make the images available on behalf of the originators. This model works well, as demonstrated by the English Heritage National Monuments Record and ensures long-term curation to specifi ed standards. However, available resources within such centres may limit the amount of images that may be archived within a particular time frame. Associated metadata that gives information on date, location, habitat, etc., must be given if relevant images are to be identifi ed easily for research purposes. Providing this metadata may impose further effort on behalf of the submitter and the curation centre which could lead to a resource issue for both parties. In the past, a lack of resources has often lead to photographs not being submitted to curation centres or initiatives.
Secondly by providing an internet base tool for access and submission allowing any individual to upload photographs and videos. Sites such as Flickr and YouTube are widely used by the general public and actively encourage submission of photographs and videos. Applying this model to marine and coastal photographs and videos may limit the use of images in a research context due to poor quantity (lack of relevant metadata fi elds) or quality (e.g. accuracy of location) of metadata. However, this approach does generally lead to a larger volume of holdings being made available due to the ease of submission of images to a central resource.
It is important that both these approaches can be accommodated if the full use of available images is to be realised. Finding a solution that may encompass both of these approaches is a challenge which is well suited to using new technologies such as those outlined within this report. The application and use of metadata harvesting tools across a number of data holdings is already used within a scientifi c
© Mills Media
context (e.g. GIGateway, NERC Data Grid). Using these tools provides a number of centres the potential to maintain control of their holdings while they are publicised and accessed through a central point.
Copyright and ownership of photographs and videos is an area that requires advice to be given to the marine community. Copyrighting may require substantial resources and different organisations that have different approaches must be accomodated. There is scope for advice to be sought from organisations such as the Technical Advisory Service for Images (TASI) and initiatives like Arkive where copyright issues have already been considered.
RecommendationsIt is important that any national initiative to improve access to marine and coastal photographs and videos must fi rstly recognise and make use of the curation centres already in place. In particular, the skills and knowledge within libraries are often overlooked despite the fact that many technological advances in curation are often pioneered within the library and e-research environment (see P. Simpson, L. Lyons, this volume).
To progress these fi ndings it is suggested that a strategy for the curation of marine and coastal photographs and videos should be developed under the umbrella of the Marine Data and Information Partnership (MDIP) and the Marine Environmental Data Action Group (MEDAG), building and drawing on the expertise and skills held within existing archive centres. The Data Archive for Seabed Species and Habitats (DASSH) uses the skills and knowledge gained from MarLIN, and considers marine photographs and videos. DASSH is therefore well placed to provide input and advice for marine ecological images. The existing archive of aerial photography at English Heritage is also well placed to be recognised as a centre for coastal aerial images.
A study of the metadata standards which are used for storing photographs and videos would provide a base for interoperability between centres and collections. An assessment of metadata fi elds and the use of controlled dictionaries within particular themes (marine ecology, coastal morphology) at the outset would ensure that photographs could be searched by defi ned criteria and be of greater use for research within those themes. However, as outlined above the provision of metadata should not be restrictive and where possible make use of technology such as metadata harvesting tools.
In the current age of digital photography, e-research and large digital storage capability, image collections are likely to expand. The cost of obtaining images particularly underwater and offshore or from aircraft remains high, and providing better access to these photographs and videos will adhere to the ethos of ‘collect once, use many times’. This would result in signifi cant resource savings for the marine community.
There is scope to create a small working group to discuss and recommend a national approach for curating marine and coastal images and we recommend that such a group be set up linked to MEDAG under the umbrella of IACMST.
Steps to achieve better use and availability of marine and coastal photographs and videos may include:
● Categorise types of photos/images/videos
● Identify existing marine and coastal image curation centres and initiatives
● Investigate relevant UK and European standards for geographic metadata and standards specifi cally dealing with images
● Discuss and provide advice on copyright issues
● Investigate technological applications that may aid access
● Recommend how the initiative to develop a strategy for the curation of photographs and videos could be accommodated within the MDIP framework.
© Mills Media