marine and petroleum geology - · pdf filehigh-resolution p-cable 3d seismic imaging of gas...
TRANSCRIPT

lable at ScienceDirect
Marine and Petroleum Geology xxx (2010) 1e14
Contents lists avai
Marine and Petroleum Geology
journal homepage: www.elsevier .com/locate/marpetgeo
High-resolution P-Cable 3D seismic imaging of gas chimney structures in gashydrated sediments of an Arctic sediment drift
Carl Jörg Petersen a, Stefan Bünz a,*, Steinar Hustoft a, Jürgen Mienert a, Dirk Klaeschen b
aUniversity of Tromsø, Department of Geology, Dramsveien 201, N-9037 Tromsø, Norwayb Leibniz Institute of Marine Sciences, IFM-GEOMAR, Wischhofstr. 1-3, 24148 Kiel, Germany
a r t i c l e i n f o
Article history:Received 27 February 2009Received in revised form12 May 2010Accepted 9 June 2010Available online xxx
Keywords:3D seismicFluid flowAcoustic chimneysP-CableGas hydratesPockmarks
* Corresponding author. Tel.: þ47 776 46266.E-mail address: [email protected] (S. Bünz).
0264-8172/$ e see front matter � 2010 Elsevier Ltd.doi:10.1016/j.marpetgeo.2010.06.006
Please cite this article in press as: PetersenMarine and Petroleum Geology (2010), doi:
a b s t r a c t
The newly developed P-Cable 3D seismic system allows for high-resolution seismic imaging to charac-terize upper geosphere geological features focusing on geofluid expressions (gas chimneys), shallow gasand gas hydrate reservoirs. Seismic imaging of a geofluid system of an Arctic sediment drift at theVestnesa Ridge, offshore western Svalbard, provides significantly improved details of internal chimneystructures from the seafloor to w500 m bsf (below seafloor). The chimneys connect to pockmarks at theseafloor and indicate focused fluid flow through gas hydrated sediments. The pockmarks are not buriedand align at the ridge-crest pointing to recent, topography-controlled fluid discharge. Chimneys arefuelled by sources beneath the base of gas hydrate stability zone (GHSZ) that is evident at w160e170 mbsf as indicated by a bottom-simulating reflector (BSR). Conduit centres that are not vertically straightbut shift laterally by up to 200 m as well as discontinuous internal chimney reflections indicateheterogeneous hydraulic fracturing of the sediments. Episodically active, pressure-driven focused fluidflow could explain the hydro-fracturing processes that control the plumbing system and lead toextensive pockmark formation at crest of the Vestnesa Ridge. High-amplitude anomalies in the upper50 m of the chimney structures suggest formations of near-surface gas hydrates and/or authigeniccarbonate precipitation. Acoustic anomalies, expressed as high amplitudes and amplitude blanking, areirregularly distributed throughout the deeper parts of the chimneys and provide evidence for the vari-ability of hydrate and/or carbonate formation in space and time.
� 2010 Elsevier Ltd. All rights reserved.
1. Introduction
Pockmarks represent common seafloor manifestations of fluidflow on continental margins around the world (Judd and Hovland,2007). They were first described in the Scotia Shelf offshore Canada(King and MacLean, 1970). Pockmarks are defined as seafloordepressions, which are related to the escape of fluids and gasesthrough the seabed. They can show a great variety of shapes andsizes with diameters ranging from 1 m to over 700 m (e.g. Hovlandet al., 2002). Because of their association with seepage of methane-rich fluids and gases, active pockmarks are usually characterized byprecipitated authigenic carbonates (e.g. Greinert et al., 2001; Ritgeret al., 1987) and chemosynthetic communities (Kennicutt et al.,1985). As a result of focused fluid flow, near-vertical ‘wipe-outzones’ with little reflected seismic energy, so-called gas chimneys,may form beneath pockmarks representing feeding channels for
All rights reserved.
, et al., High-resolution P-Cab10.1016/j.marpetgeo.2010.06.
the upward migrating fluids and gases (Riedel et al., 2002;Zuhlsdorff and Spiess, 2004). On seismic data, gas chimneys arecommonly characterized by low coherency, low amplitude, variabledip and pull-up or push-down effects of seismic reflections (e.g.Berndt et al., 2003; Ligtenberg, 2005; Westbrook et al., 2008b).
Previous studies on the Norwegian continental margin docu-ment that bottom-simulating reflectors (BSR), which mark the baseof gas hydrate stability, coexist with pockmarks and chimneys(Brown et al., 2006; Bünz et al., 2003; Mienert et al., 2001).Geochemical studies using sulfate gradients as flux indicatorshowed smaller fluxes inside chimneys located north of theStoregga Slide than in undisturbed sediment around them sug-gesting that these chimneys are not hydrate-lined fluid flowconduits (Paull et al., 2008). However, in the same region evidencefor hydrate occurrence and active seepage in the pockmarks wasfound based on seismic data and core samples (Ivanov et al., 2007;Westbrook et al., 2008b). Thus, a broad range of structural stylesand levels of fluid flow activity seems to occur on a local scale onthe Norwegian margin. Located west of Svalbard at 80� N, theVestnesa Ridge represents one of the northernmost gas hydrate
le 3D seismic imaging of gas chimney structures in gas hydrated...,006

C.J. Petersen et al. / Marine and Petroleum Geology xxx (2010) 1e142
provinces that exist along Arctic continental margins (e.g. Eikenand Hinz, 1993; Posewang and Mienert, 1999). The pockmarks atthe Vestnesa Ridge were first discovered and described by Vogtet al. (1994, 1999) who speculated that the pockmarks wereformed by active or recent upward rising methane flow collectingin the ridge-crest trap. The occurrence of gas hydrate-bearingsediments, the evidence for active fluid flow and the geologicalsetting on a young and sedimented ocean ridge make the VestnesaRidge a key location to study the interaction of gas hydrateformation and focused fluid flow as well as the possible impact ofmethane seepage on Arctic environments.
In the recent past, 3D seismic data became an increasinglyimportant tool for studies of geofluids (Bünz et al., 2005a; Gay et al.,2007, 2006; Hornbach et al., 2008; Hustoft et al., 2007; Purdy et al.,2008; Riedel, 2007; Sultan et al., 2007). However, 3D seismicresearch studies are mostly limited to areas of hydrocarbonexploration. Moreover, conventional 3D seismic technology isdesigned to image targets at greater depths focusing on hydro-carbon reservoirs, and processing of this type of data does notaccount for shallow subsurface structures. Many areas of scientificinterest in the field of marine geology and geophysics are outsideany conventional 3D seismic coverage, e.g. the Arctic regions, and
Fig. 1. Simrad EM300 multi-beam bathymetry (grid size 50 m) of the W-Svalbard margin shfigure: High-resolution EM300 multi-beam bathymetry (grid size 15 m, due to multiple co
Please cite this article in press as: Petersen, et al., High-resolution P-CabMarine and Petroleum Geology (2010), doi:10.1016/j.marpetgeo.2010.06.
the poor resolution of conventional 3D seismic data leaves manyscientific questions unresolved. Therefore, the University of Tromsø(Petersen et al., 2008) in cooperation with Volcanic Basin Petro-leum Research (VBPR, Oslo), National Oceanographic CentreSouthampton (Southampton University) and IFM-GEOMAR (KielUniversity) developed a lightweight high-resolution 3D seismicsystem, the P-Cable system (Planke and Berndt, 2004).
In contrast to several 3D seismic studies, which used a set ofparallel, closely spaced high-resolution 2D lines to construct a 3Dseismic data volume (also called 2.5D seismic) (e.g., Hornbach et al.,2008; Wagner-Friedrichs et al., 2008; Zuhlsdorff and Spiess, 2004),the P-Cable system offers full 3D seismic data acquisition using a setof parallel streamers with high-resolution seismic sources, whichmake this system unique in academic research.
Our study presents one of the first high-resolution 3D seismicstudies using the P-Cable system to characterize the internalstructure of chimneys to improve our understanding of theplumbing system in gas hydrate environments. The main purposeof this paper is to present high-resolution 3D seismic data of the P-Cable system, its acquisition and processing as well as its value inunderstanding focused fluid flow features piercing through the gashydrate stability zone (GHSZ).
owing the Vestnesa Ridge with the location of the 3D seismic survey and the OBS; inlayverage during 3D survey) shows abundance of pockmarks at ridge-crest.
le 3D seismic imaging of gas chimney structures in gas hydrated...,006

Fig. 2. (a) Schematic diagram of P-Cable 3D seismic system; (b) and (c) Comparison between P-Cable 3D seismic data (bin size 10 m) and high-resolution 3D seismic explorationdata from the Lower Congo Basin(bin size 12.5 m) (Gay et al., 2007), identical horizontal and vertical scales.
C.J. Petersen et al. / Marine and Petroleum Geology xxx (2010) 1e14 3
2. Regional setting
The Vestnesa Ridge is a sediment drift located on hot and youngoceanic crust at the eastern spreading segments of the MolloyRidge in the Fram Strait west of Svalbard (Fig. 1) (Engen et al., 2008;Hustoft et al., 2009; Ritzmann et al., 2004). Seafloor spreading atthe Molloy Ridge probably initiated at 19.6 Ma and was wellestablished at 9.8 Ma (Engen et al., 2008). The Vestnesa Ridge iscovered by more than 2 km thick sediments deposited as con-tourites by prevailing northward directed contour currents duringthe late Miocene and Pliocene (Eiken and Hinz, 1993). Depositionwas probably stimulated by a rough underlying oceanic basementthat reduced the speed of the northward directedWest SpitsbergenCurrent (Vogt, 1986). The crest of the Vestnesa Ridge consists ofsilty turbidites and muddy-silty contourites of mid-Weichselianand Holocene age, and the post 19 ka sedimentation rate wasestimated to 9.6 cm/ka on average (Howe et al., 2008).
Please cite this article in press as: Petersen, et al., High-resolution P-CabMarine and Petroleum Geology (2010), doi:10.1016/j.marpetgeo.2010.06.
Several seismic studies revealed the occurrence of a prominentbottom-simulating reflector (BSR) along theW-Svalbardmargin (Eikenand Hinz, 1993; Mienert et al., 1998; Posewang and Mienert, 1999;Vanneste et al., 2005; Westbrook et al., 2008a). Hydrate concentra-tions derived from seismic velocity analyses show up to 11% (Hustoftet al., 2009) and 12% (Westbrook et al., 2008a) in the pore space ofsedimentsabove theBSR.The inferredgas-hydrateprovinceontheNW-Svalbardmargincoversanareaofw3000km2(Bünzetal., 2008;Hustoftetal., 2009;Vannesteet al., 2005). Fluidfluxesofmaximum0.15mma�1
were estimated for the W-Svalbard margin based on numericalmodeling assuming a steady-state 150-m-thick free gas zone beneaththe BSR atw200 m below the seafloor (m bsf) (Haacke et al., 2008).
The 3D seismic data volume is located at thewestern crest of theVestnesa Ridge between 1200 and 1300 m of water depth (Fig. 1).Numerous pockmarks concentrate on the crest of the ridge (Fig. 1)(Vogt et al., 1994, 1999) and gas flares indicate ongoing focusedfluid flow activity (Hustoft et al., 2009).
le 3D seismic imaging of gas chimney structures in gas hydrated...,006

Fig. 3. Flowchart of 3D seismic data processing.
Fig. 4. Acquisition geometry calculation: (a) Triangular cross cable geometry assumedas starting geometry; (b) Streamer-channel and shot point positions after source andreceiver relocation; (c) final CMP coverage.
C.J. Petersen et al. / Marine and Petroleum Geology xxx (2010) 1e144
3. The P-Cable 3D seismic system
The P-Cable system represents a high-resolution 3D seismicimaging tool, which consists of a cable towed perpendicular to theship’s steaming direction, a so-called cross cable, that is spreadbehind the vessel by two large trawl doors (Planke and Berndt,2004; Fig. 2a). Up to 24 multi-channel streamers with a length of25 m are attached to the cross cable. The array of single-channelstreamers acquire 24 seismic lines simultaneously, thus covering anapprox. 240 m wide swath with close inline spacing in a cost effi-cient way. GPS antennas are mounted on both the gun float and thetrawl doors to ensure accurate navigationwith uncertainties of lessthan a meter. The spatial resolution of such a system is at least oneorder of magnitude higher than conventional 3D seismic, whereasthe temporal resolution is improved 3e5 times. The increases inresolution facilitate a much better target identification and achievea much more accurate imaging of, for example, shallow subsurfacestructures and fluid flow systems. The advantages and benefits ofthe P-Cable seismic system with respect to data quality are illus-trated in Fig. 2b and c. It shows a comparison of high-resolution 3Dseismic exploration data from the Lower Congo Basin (Gay et al.,2007) with P-Cable data from a comparable target. Both imageshave the same horizontal and vertical scale and the P-Cable datashows superior quality in both horizontal and vertical resolution.
The 3D seismic data presented in this paper were acquired inJuly 2007 (Mienert et al., 2007 submitted for publication) using theP-Cable 3D seismic system of the University of Tromsø. In total, anarea of 23 km2 was surveyed with 32 profiles using 8 or 12 parallelstreamers (Fig. 1). Two GI guns with a total volume of 240 cubicinch provided seismic energywith frequencies from 20 to 250 Hz. A
Please cite this article in press as: Petersen, et al., High-resolution P-Cable 3D seismic imaging of gas chimney structures in gas hydrated...,Marine and Petroleum Geology (2010), doi:10.1016/j.marpetgeo.2010.06.006
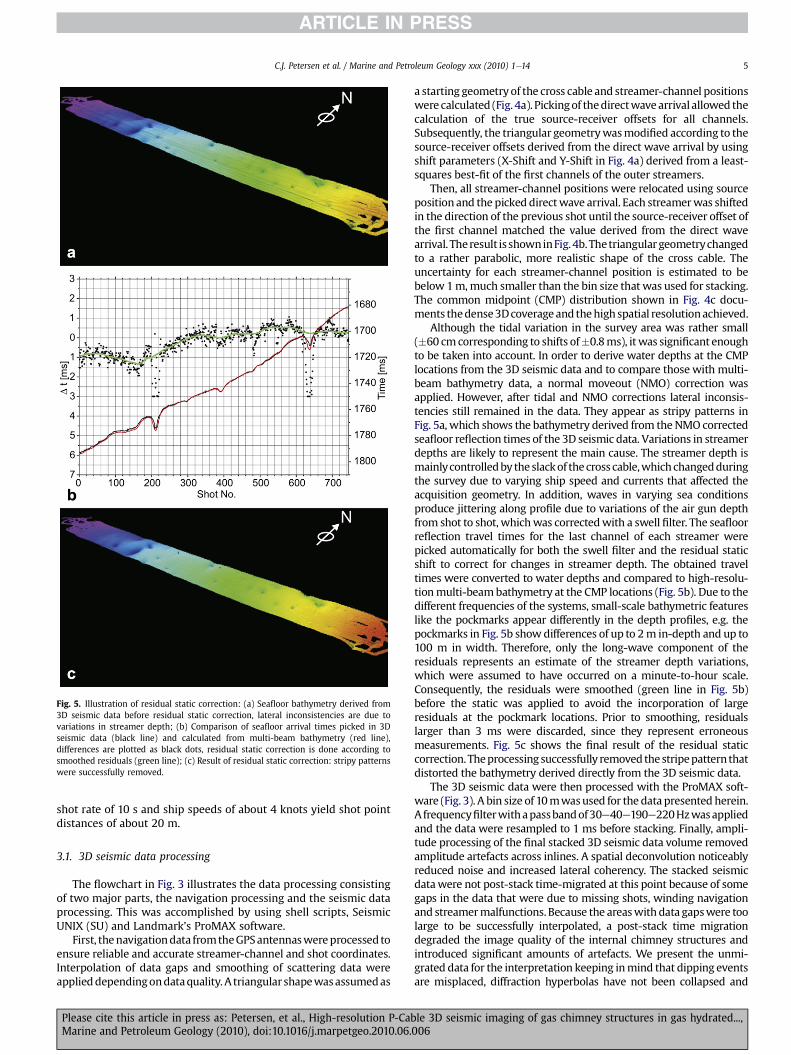
Fig. 5. Illustration of residual static correction: (a) Seafloor bathymetry derived from3D seismic data before residual static correction, lateral inconsistencies are due tovariations in streamer depth; (b) Comparison of seafloor arrival times picked in 3Dseismic data (black line) and calculated from multi-beam bathymetry (red line),differences are plotted as black dots, residual static correction is done according tosmoothed residuals (green line); (c) Result of residual static correction: stripy patternswere successfully removed.
C.J. Petersen et al. / Marine and Petroleum Geology xxx (2010) 1e14 5
shot rate of 10 s and ship speeds of about 4 knots yield shot pointdistances of about 20 m.
3.1. 3D seismic data processing
The flowchart in Fig. 3 illustrates the data processing consistingof two major parts, the navigation processing and the seismic dataprocessing. This was accomplished by using shell scripts, SeismicUNIX (SU) and Landmark’s ProMAX software.
First, thenavigationdata fromtheGPSantennaswereprocessed toensure reliable and accurate streamer-channel and shot coordinates.Interpolation of data gaps and smoothing of scattering data wereapplieddependingondataquality.A triangular shapewasassumedas
Please cite this article in press as: Petersen, et al., High-resolution P-CabMarine and Petroleum Geology (2010), doi:10.1016/j.marpetgeo.2010.06.
a starting geometryof the cross cable and streamer-channel positionswere calculated (Fig. 4a). Pickingof thedirectwavearrival allowed thecalculation of the true source-receiver offsets for all channels.Subsequently, the triangular geometrywasmodified according to thesource-receiver offsets derived from the direct wave arrival by usingshift parameters (X-Shift and Y-Shift in Fig. 4a) derived from a least-squares best-fit of the first channels of the outer streamers.
Then, all streamer-channel positions were relocated using sourceposition and the picked directwave arrival. Each streamerwas shiftedin the direction of the previous shot until the source-receiver offset ofthe first channel matched the value derived from the direct wavearrival. Theresult is showninFig. 4b.Thetriangulargeometrychangedto a rather parabolic, more realistic shape of the cross cable. Theuncertainty for each streamer-channel position is estimated to bebelow 1m,much smaller than the bin size that was used for stacking.The common midpoint (CMP) distribution shown in Fig. 4c docu-ments thedense3Dcoverageand thehigh spatial resolutionachieved.
Although the tidal variation in the survey area was rather small(�60 cmcorresponding to shifts of�0.8ms), itwas significant enoughto be taken into account. In order to derive water depths at the CMPlocations from the 3D seismic data and to compare those with multi-beam bathymetry data, a normal moveout (NMO) correction wasapplied. However, after tidal and NMO corrections lateral inconsis-tencies still remained in the data. They appear as stripy patterns inFig. 5a, which shows the bathymetry derived from the NMO correctedseafloor reflection times of the 3D seismic data. Variations in streamerdepths are likely to represent the main cause. The streamer depth ismainlycontrolledby theslackof thecross cable,whichchangedduringthe survey due to varying ship speed and currents that affected theacquisition geometry. In addition, waves in varying sea conditionsproduce jittering along profile due to variations of the air gun depthfrom shot to shot, whichwas correctedwith a swell filter. The seafloorreflection travel times for the last channel of each streamer werepicked automatically for both the swell filter and the residual staticshift to correct for changes in streamer depth. The obtained traveltimes were converted to water depths and compared to high-resolu-tionmulti-beambathymetry at the CMP locations (Fig. 5b). Due to thedifferent frequencies of the systems, small-scale bathymetric featureslike the pockmarks appear differently in the depth profiles, e.g. thepockmarks in Fig. 5b showdifferences of up to 2m in-depth and up to100 m in width. Therefore, only the long-wave component of theresiduals represents an estimate of the streamer depth variations,which were assumed to have occurred on a minute-to-hour scale.Consequently, the residuals were smoothed (green line in Fig. 5b)before the static was applied to avoid the incorporation of largeresiduals at the pockmark locations. Prior to smoothing, residualslarger than 3 ms were discarded, since they represent erroneousmeasurements. Fig. 5c shows the final result of the residual staticcorrection. Theprocessing successfully removedthestripepattern thatdistorted the bathymetry derived directly from the 3D seismic data.
The 3D seismic data were then processed with the ProMAX soft-ware (Fig. 3). A bin size of 10mwasused for the data presented herein.A frequencyfilterwithapassbandof30e40e190e220Hzwasappliedand the data were resampled to 1 ms before stacking. Finally, ampli-tude processing of the final stacked 3D seismic data volume removedamplitude artefacts across inlines. A spatial deconvolution noticeablyreduced noise and increased lateral coherency. The stacked seismicdatawere not post-stack time-migrated at this point because of somegaps in the data that were due to missing shots, winding navigationand streamermalfunctions. Because the areaswithdata gapswere toolarge to be successfully interpolated, a post-stack time migrationdegraded the image quality of the internal chimney structures andintroduced significant amounts of artefacts. We present the unmi-grated data for the interpretation keeping inmind that dipping eventsare misplaced, diffraction hyperbolas have not been collapsed and
le 3D seismic imaging of gas chimney structures in gas hydrated...,006
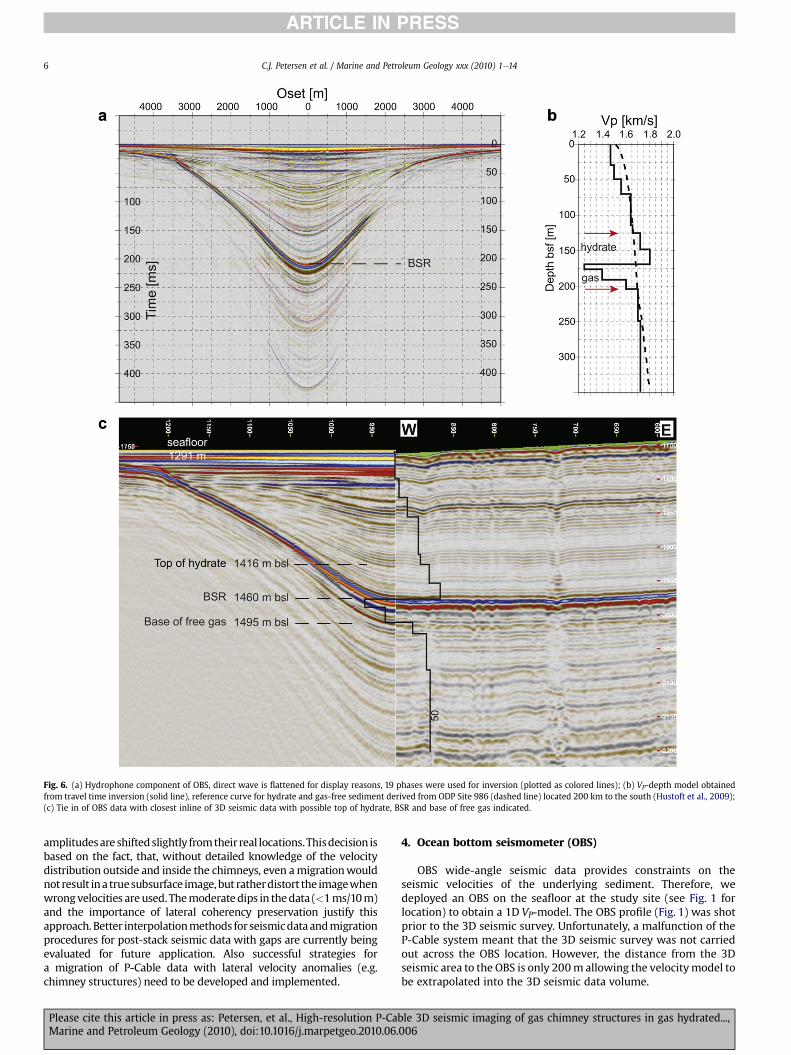
Fig. 6. (a) Hydrophone component of OBS, direct wave is flattened for display reasons, 19 phases were used for inversion (plotted as colored lines); (b) VP-depth model obtainedfrom travel time inversion (solid line), reference curve for hydrate and gas-free sediment derived from ODP Site 986 (dashed line) located 200 km to the south (Hustoft et al., 2009);(c) Tie in of OBS data with closest inline of 3D seismic data with possible top of hydrate, BSR and base of free gas indicated.
C.J. Petersen et al. / Marine and Petroleum Geology xxx (2010) 1e146
amplitudesareshiftedslightly fromtheir real locations.Thisdecision isbased on the fact, that, without detailed knowledge of the velocitydistribution outside and inside the chimneys, even amigrationwouldnot result ina truesubsurface image,but ratherdistort the imagewhenwrongvelocities areused. Themoderatedips in thedata (<1ms/10m)and the importance of lateral coherency preservation justify thisapproach.Better interpolationmethods for seismicdataandmigrationprocedures for post-stack seismic data with gaps are currently beingevaluated for future application. Also successful strategies fora migration of P-Cable data with lateral velocity anomalies (e.g.chimney structures) need to be developed and implemented.
Please cite this article in press as: Petersen, et al., High-resolution P-CabMarine and Petroleum Geology (2010), doi:10.1016/j.marpetgeo.2010.06.
4. Ocean bottom seismometer (OBS)
OBS wide-angle seismic data provides constraints on theseismic velocities of the underlying sediment. Therefore, wedeployed an OBS on the seafloor at the study site (see Fig. 1 forlocation) to obtain a 1D VP-model. The OBS profile (Fig. 1) was shotprior to the 3D seismic survey. Unfortunately, a malfunction of theP-Cable system meant that the 3D seismic survey was not carriedout across the OBS location. However, the distance from the 3Dseismic area to the OBS is only 200m allowing the velocitymodel tobe extrapolated into the 3D seismic data volume.
le 3D seismic imaging of gas chimney structures in gas hydrated...,006

Fig. 7. Perspective view of depth-converted 3D seismic data showing high amplitudes associated with free gas accumulations below the BSR (green surface) and acoustic blankingassociated with gas chimneys, which pierce through sediments from depth of at least 500 m bsf. Possible top of gas hydrate is indicated as red surface.
C.J. Petersen et al. / Marine and Petroleum Geology xxx (2010) 1e14 7
Please cite this article in press as: Petersen, et al., High-resolution P-Cable 3D seismic imaging of gas chimney structures in gas hydrated...,Marine and Petroleum Geology (2010), doi:10.1016/j.marpetgeo.2010.06.006
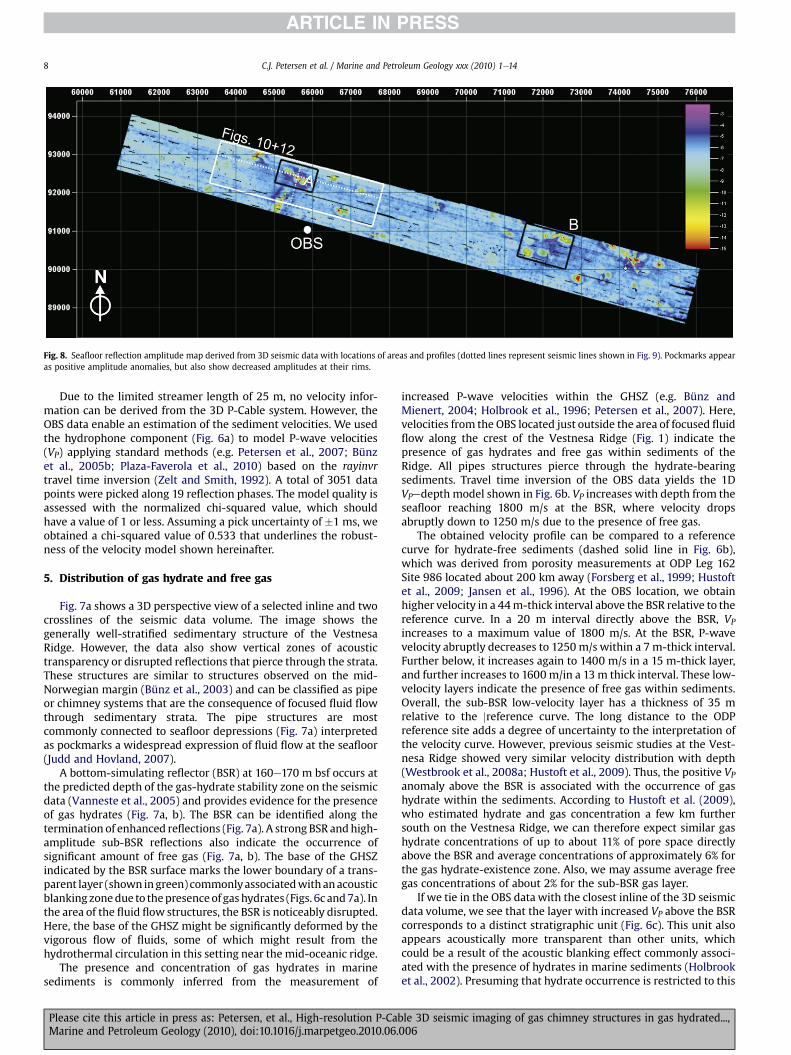
Fig. 8. Seafloor reflection amplitude map derived from 3D seismic data with locations of areas and profiles (dotted lines represent seismic lines shown in Fig. 9). Pockmarks appearas positive amplitude anomalies, but also show decreased amplitudes at their rims.
C.J. Petersen et al. / Marine and Petroleum Geology xxx (2010) 1e148
Due to the limited streamer length of 25 m, no velocity infor-mation can be derived from the 3D P-Cable system. However, theOBS data enable an estimation of the sediment velocities. We usedthe hydrophone component (Fig. 6a) to model P-wave velocities(VP) applying standard methods (e.g. Petersen et al., 2007; Bünzet al., 2005b; Plaza-Faverola et al., 2010) based on the rayinvrtravel time inversion (Zelt and Smith, 1992). A total of 3051 datapoints were picked along 19 reflection phases. The model quality isassessed with the normalized chi-squared value, which shouldhave a value of 1 or less. Assuming a pick uncertainty of �1 ms, weobtained a chi-squared value of 0.533 that underlines the robust-ness of the velocity model shown hereinafter.
5. Distribution of gas hydrate and free gas
Fig. 7a shows a 3D perspective view of a selected inline and twocrosslines of the seismic data volume. The image shows thegenerally well-stratified sedimentary structure of the VestnesaRidge. However, the data also show vertical zones of acoustictransparency or disrupted reflections that pierce through the strata.These structures are similar to structures observed on the mid-Norwegian margin (Bünz et al., 2003) and can be classified as pipeor chimney systems that are the consequence of focused fluid flowthrough sedimentary strata. The pipe structures are mostcommonly connected to seafloor depressions (Fig. 7a) interpretedas pockmarks a widespread expression of fluid flow at the seafloor(Judd and Hovland, 2007).
A bottom-simulating reflector (BSR) at 160e170 m bsf occurs atthe predicted depth of the gas-hydrate stability zone on the seismicdata (Vanneste et al., 2005) and provides evidence for the presenceof gas hydrates (Fig. 7a, b). The BSR can be identified along thetermination of enhanced reflections (Fig. 7a). A strong BSR andhigh-amplitude sub-BSR reflections also indicate the occurrence ofsignificant amount of free gas (Fig. 7a, b). The base of the GHSZindicated by the BSR surface marks the lower boundary of a trans-parent layer (shown ingreen) commonlyassociatedwithanacousticblanking zonedue to thepresenceof gashydrates (Figs. 6c and7a). Inthe area of the fluid flow structures, the BSR is noticeably disrupted.Here, the base of the GHSZ might be significantly deformed by thevigorous flow of fluids, some of which might result from thehydrothermal circulation in this setting near the mid-oceanic ridge.
The presence and concentration of gas hydrates in marinesediments is commonly inferred from the measurement of
Please cite this article in press as: Petersen, et al., High-resolution P-CabMarine and Petroleum Geology (2010), doi:10.1016/j.marpetgeo.2010.06.
increased P-wave velocities within the GHSZ (e.g. Bünz andMienert, 2004; Holbrook et al., 1996; Petersen et al., 2007). Here,velocities from the OBS located just outside the area of focused fluidflow along the crest of the Vestnesa Ridge (Fig. 1) indicate thepresence of gas hydrates and free gas within sediments of theRidge. All pipes structures pierce through the hydrate-bearingsediments. Travel time inversion of the OBS data yields the 1DVPedepth model shown in Fig. 6b. VP increases with depth from theseafloor reaching 1800 m/s at the BSR, where velocity dropsabruptly down to 1250 m/s due to the presence of free gas.
The obtained velocity profile can be compared to a referencecurve for hydrate-free sediments (dashed solid line in Fig. 6b),which was derived from porosity measurements at ODP Leg 162Site 986 located about 200 km away (Forsberg et al., 1999; Hustoftet al., 2009; Jansen et al., 1996). At the OBS location, we obtainhigher velocity in a 44m-thick interval above the BSR relative to thereference curve. In a 20 m interval directly above the BSR, VP
increases to a maximum value of 1800 m/s. At the BSR, P-wavevelocity abruptly decreases to 1250 m/s within a 7 m-thick interval.Further below, it increases again to 1400 m/s in a 15 m-thick layer,and further increases to 1600m/in a 13 m thick interval. These low-velocity layers indicate the presence of free gas within sediments.Overall, the sub-BSR low-velocity layer has a thickness of 35 mrelative to the jreference curve. The long distance to the ODPreference site adds a degree of uncertainty to the interpretation ofthe velocity curve. However, previous seismic studies at the Vest-nesa Ridge showed very similar velocity distribution with depth(Westbrook et al., 2008a; Hustoft et al., 2009). Thus, the positive VP
anomaly above the BSR is associated with the occurrence of gashydrate within the sediments. According to Hustoft et al. (2009),who estimated hydrate and gas concentration a few km furthersouth on the Vestnesa Ridge, we can therefore expect similar gashydrate concentrations of up to about 11% of pore space directlyabove the BSR and average concentrations of approximately 6% forthe gas hydrate-existence zone. Also, we may assume average freegas concentrations of about 2% for the sub-BSR gas layer.
If we tie in the OBS data with the closest inline of the 3D seismicdata volume, we see that the layer with increased VP above the BSRcorresponds to a distinct stratigraphic unit (Fig. 6c). This unit alsoappears acoustically more transparent than other units, whichcould be a result of the acoustic blanking effect commonly associ-ated with the presence of hydrates in marine sediments (Holbrooket al., 2002). Presuming that hydrate occurrence is restricted to this
le 3D seismic imaging of gas chimney structures in gas hydrated...,006

Fig. 9. Close-up perspective view of the seafloor reflection amplitude (same color scale as in Fig. 8) and a selected inline and crossline (area is marked as white box in Fig. 8)showing the internal structure of a gas chimney in detail.
C.J. Petersen et al. / Marine and Petroleum Geology xxx (2010) 1e14 9
interval, the top of gas hydrate zone (TGHZ) can be traced along thesedimentary reflection through the entire 3D data volume (markedred surface in Fig. 7b). The part of the GHSZ, which extends from theseafloor down to the BSR, has a total volume of 3.86 km3 inside the3D study area of 23 km2. The BSR surface and the TGHZ surfaceenclose a volume of 0.68 km3, which is w18% of the sub-seafloorGHSZ volume. Since the single OBS station does not allow for a solidand reliable quantification of the entire 3D volume, in the future anarray of OBS stations is to be planned jointly with the 3D survey.Nevertheless, the P-Cable 3D seismic data enable an efficient andaccurate reservoir mapping of shallow gas/gas hydrate reservoirs.
6. Seabed and sub-seabed expressions of focused fluid flow
Theseafloormapof the3Dseismicdatashowscircular toellipticallyshaped depressions that are interpreted as pockmarks, seabedexpressions of focused fluid flow (Judd and Hovland, 2007). Thepockmarks have a diameter of up to 700 m and depressions of up to
Please cite this article in press as: Petersen, et al., High-resolution P-CabMarine and Petroleum Geology (2010), doi:10.1016/j.marpetgeo.2010.06.
10 m, which are very typical values for these structures on theNorwegianMargin(Hustoftetal., 2009;Hjelstuenetal., 2010).Wehaveselected twoareas (AandB inFig. 8) for the3Dseismiccharacterizationof the focusedfluidflowsystemontheVestnesaRidge. These twoareasshow characteristics that are representative for the total of 18 struc-tures that were identified in the 3D seismic data volume.
Fig. 8 shows a map of seafloor reflection amplitudes derivedfrom the 3D seismic data with selected locations of seabed anom-alies shown in detail hereinafter. In general, the seafloor showsrather uniform reflection amplitudes outside of the pockmarks.Inside the pockmarks, very heterogeneous amplitude patternsexist. The majority of structures exhibit positive amplitudes in orclose to the centre, which are in some cases partly or fully encircledby a rim of decreased amplitudes relative to the surroundingseafloor (Figs. 8, 9 and 10a and 11a). Some pockmarks are charac-terized by a homogeneous positive amplitude anomaly, whereasothers seem to intersect each other and exhibit complex amplitudepattern. The observed high amplitudes at and close to the seafloor
le 3D seismic imaging of gas chimney structures in gas hydrated...,006
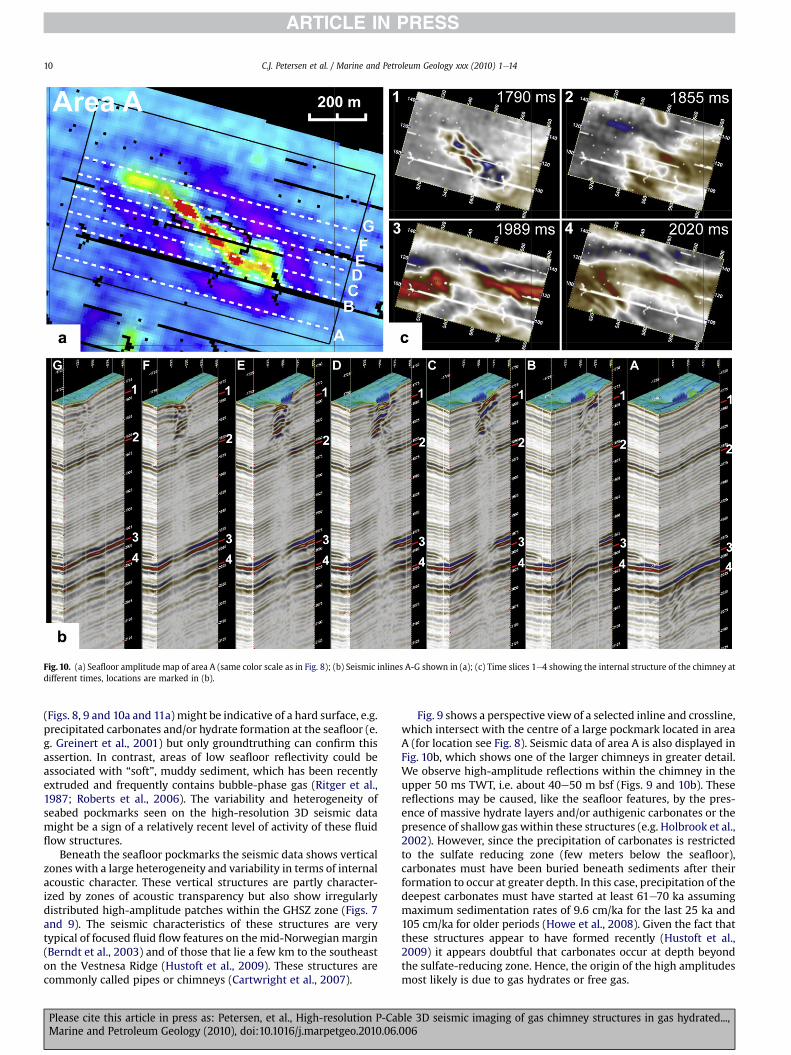
Fig. 10. (a) Seafloor amplitude map of area A (same color scale as in Fig. 8); (b) Seismic inlines A-G shown in (a); (c) Time slices 1e4 showing the internal structure of the chimney atdifferent times, locations are marked in (b).
C.J. Petersen et al. / Marine and Petroleum Geology xxx (2010) 1e1410
(Figs. 8, 9 and 10a and 11a) might be indicative of a hard surface, e.g.precipitated carbonates and/or hydrate formation at the seafloor (e.g. Greinert et al., 2001) but only groundtruthing can confirm thisassertion. In contrast, areas of low seafloor reflectivity could beassociated with “soft”, muddy sediment, which has been recentlyextruded and frequently contains bubble-phase gas (Ritger et al.,1987; Roberts et al., 2006). The variability and heterogeneity ofseabed pockmarks seen on the high-resolution 3D seismic datamight be a sign of a relatively recent level of activity of these fluidflow structures.
Beneath the seafloor pockmarks the seismic data shows verticalzones with a large heterogeneity and variability in terms of internalacoustic character. These vertical structures are partly character-ized by zones of acoustic transparency but also show irregularlydistributed high-amplitude patches within the GHSZ zone (Figs. 7and 9). The seismic characteristics of these structures are verytypical of focused fluid flow features on themid-Norwegian margin(Berndt et al., 2003) and of those that lie a few km to the southeaston the Vestnesa Ridge (Hustoft et al., 2009). These structures arecommonly called pipes or chimneys (Cartwright et al., 2007).
Please cite this article in press as: Petersen, et al., High-resolution P-CabMarine and Petroleum Geology (2010), doi:10.1016/j.marpetgeo.2010.06.
Fig. 9 shows a perspective view of a selected inline and crossline,which intersect with the centre of a large pockmark located in areaA (for location see Fig. 8). Seismic data of area A is also displayed inFig. 10b, which shows one of the larger chimneys in greater detail.We observe high-amplitude reflections within the chimney in theupper 50 ms TWT, i.e. about 40e50 m bsf (Figs. 9 and 10b). Thesereflections may be caused, like the seafloor features, by the pres-ence of massive hydrate layers and/or authigenic carbonates or thepresence of shallow gas within these structures (e.g. Holbrook et al.,2002). However, since the precipitation of carbonates is restrictedto the sulfate reducing zone (few meters below the seafloor),carbonates must have been buried beneath sediments after theirformation to occur at greater depth. In this case, precipitation of thedeepest carbonates must have started at least 61e70 ka assumingmaximum sedimentation rates of 9.6 cm/ka for the last 25 ka and105 cm/ka for older periods (Howe et al., 2008). Given the fact thatthese structures appear to have formed recently (Hustoft et al.,2009) it appears doubtful that carbonates occur at depth beyondthe sulfate-reducing zone. Hence, the origin of the high amplitudesmost likely is due to gas hydrates or free gas.
le 3D seismic imaging of gas chimney structures in gas hydrated...,006

Fig. 11. (a) Seafloor amplitude map of area B (same color scale as in Fig. 8); (b) Seismic inlines A-G shown in (a); (c) Time slices 1e4 showing the internal structure of the chimney atdifferent times, locations are marked in (b).
C.J. Petersen et al. / Marine and Petroleum Geology xxx (2010) 1e14 11
Significant disruption of sedimentary strata at the chimneyouter limits can be identified. Close to the seafloor the sedimentlayers on the seismic profiles are clearly pushed downwith respectto the surrounding strata. Approaching the base of gas hydratestability, which is marked by the BSR, the internal reflections areshifted to earlier times, representing velocity pull-up features(Fig. 9). If these observations are due to the presence of gas causinga low-velocity anomaly or gas hydrates causing a high-velocityanomaly, or if they are the consequence of the mechanical defor-mation of the sediments is still unclear and requires furtherdetailed analysis of all chimney structures in the 3D seismicvolume. However, we suggest that it is most likely a combination ofthese effects. Push-down features could be due to free gas close tothe seafloor within these apparently very active fluid flow features(Hustoft et al., 2009). Pull-up features close to the base of the GHSZcould be due to gas hydrates which occur in higher saturationsdirectly above this surface. The flow of fluids within the chimneysprobably results in higher concentrations of gas hydrates withinthese structures. When entering the free gas zone beneath the BSR,
Please cite this article in press as: Petersen, et al., High-resolution P-CabMarine and Petroleum Geology (2010), doi:10.1016/j.marpetgeo.2010.06.
push-down effects are observed again that can be related to thepresence of gas underneath the hydrates.
The complex nature of the chimneys is also demonstrated bylooking at time slice representations of the 3D seismic data thatenable the visualization of the internal distribution of amplitudeanomalies within the chimneys. Four selected time slices of area Aare shown in Fig. 10c. Time slice 1 images the near-seafloor sedi-ments at 1790 ms TWT (two-way time) bsl (below sea level) andreveals a heterogeneous, composite pattern of positive and nega-tive amplitude anomalies, which is confined to the inner part of thepockmark. The acoustic chimney structure can be easily followeddownwards with the time slices 2, 3 and 4. They visualize changesin both the chimney dimension and its internal structure. Thefringe of the chimney can be traced downwell below the BSR basedon disrupted or distorted amplitudes. Apparently, the chimneydiameter increases significantly with depth, e.g. from a short axis ofabout 400 m at the seafloor to about 600 m at 2020 ms TWT,though, this observation could be hampered by the fact that thedata have not been migrated. A slight counter-clockwise rotation of
le 3D seismic imaging of gas chimney structures in gas hydrated...,006
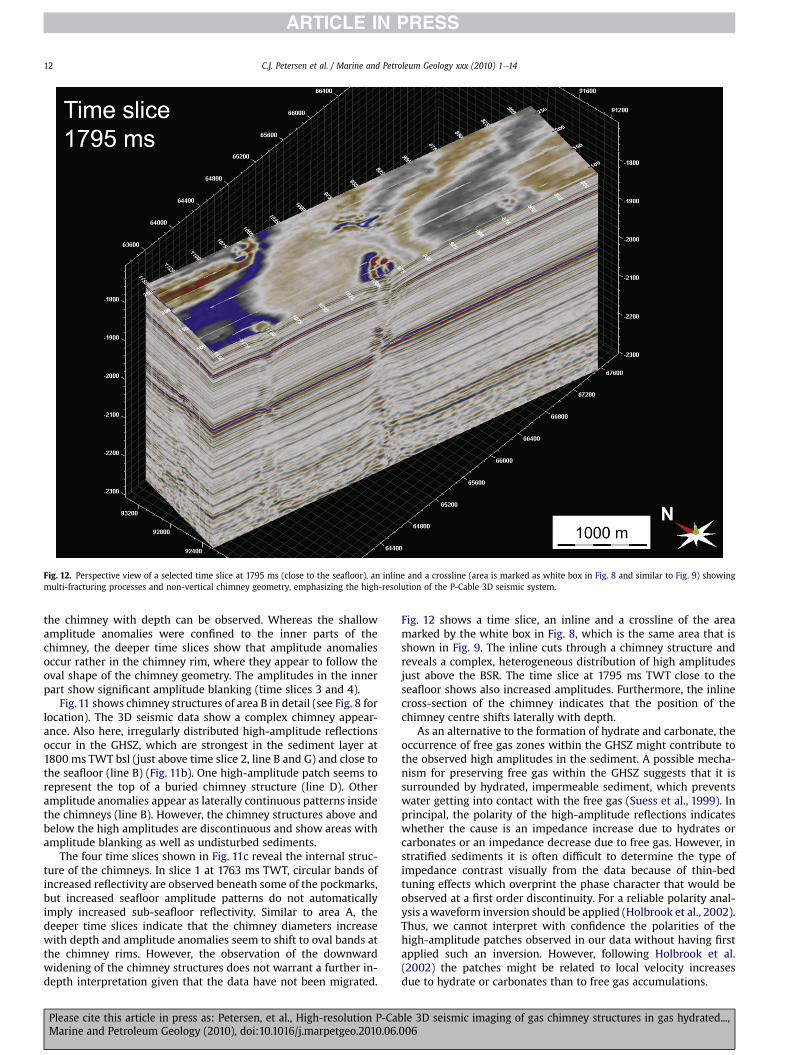
Fig. 12. Perspective view of a selected time slice at 1795 ms (close to the seafloor), an inline and a crossline (area is marked as white box in Fig. 8 and similar to Fig. 9) showingmulti-fracturing processes and non-vertical chimney geometry, emphasizing the high-resolution of the P-Cable 3D seismic system.
C.J. Petersen et al. / Marine and Petroleum Geology xxx (2010) 1e1412
the chimney with depth can be observed. Whereas the shallowamplitude anomalies were confined to the inner parts of thechimney, the deeper time slices show that amplitude anomaliesoccur rather in the chimney rim, where they appear to follow theoval shape of the chimney geometry. The amplitudes in the innerpart show significant amplitude blanking (time slices 3 and 4).
Fig. 11 shows chimney structures of area B in detail (see Fig. 8 forlocation). The 3D seismic data show a complex chimney appear-ance. Also here, irregularly distributed high-amplitude reflectionsoccur in the GHSZ, which are strongest in the sediment layer at1800 ms TWT bsl (just above time slice 2, line B and G) and close tothe seafloor (line B) (Fig. 11b). One high-amplitude patch seems torepresent the top of a buried chimney structure (line D). Otheramplitude anomalies appear as laterally continuous patterns insidethe chimneys (line B). However, the chimney structures above andbelow the high amplitudes are discontinuous and show areas withamplitude blanking as well as undisturbed sediments.
The four time slices shown in Fig. 11c reveal the internal struc-ture of the chimneys. In slice 1 at 1763 ms TWT, circular bands ofincreased reflectivity are observed beneath some of the pockmarks,but increased seafloor amplitude patterns do not automaticallyimply increased sub-seafloor reflectivity. Similar to area A, thedeeper time slices indicate that the chimney diameters increasewith depth and amplitude anomalies seem to shift to oval bands atthe chimney rims. However, the observation of the downwardwidening of the chimney structures does not warrant a further in-depth interpretation given that the data have not been migrated.
Please cite this article in press as: Petersen, et al., High-resolution P-CabMarine and Petroleum Geology (2010), doi:10.1016/j.marpetgeo.2010.06.
Fig. 12 shows a time slice, an inline and a crossline of the areamarked by the white box in Fig. 8, which is the same area that isshown in Fig. 9. The inline cuts through a chimney structure andreveals a complex, heterogeneous distribution of high amplitudesjust above the BSR. The time slice at 1795 ms TWT close to theseafloor shows also increased amplitudes. Furthermore, the inlinecross-section of the chimney indicates that the position of thechimney centre shifts laterally with depth.
As an alternative to the formation of hydrate and carbonate, theoccurrence of free gas zones within the GHSZ might contribute tothe observed high amplitudes in the sediment. A possible mecha-nism for preserving free gas within the GHSZ suggests that it issurrounded by hydrated, impermeable sediment, which preventswater getting into contact with the free gas (Suess et al., 1999). Inprincipal, the polarity of the high-amplitude reflections indicateswhether the cause is an impedance increase due to hydrates orcarbonates or an impedance decrease due to free gas. However, instratified sediments it is often difficult to determine the type ofimpedance contrast visually from the data because of thin-bedtuning effects which overprint the phase character that would beobserved at a first order discontinuity. For a reliable polarity anal-ysis awaveform inversion should be applied (Holbrook et al., 2002).Thus, we cannot interpret with confidence the polarities of thehigh-amplitude patches observed in our data without having firstapplied such an inversion. However, following Holbrook et al.(2002) the patches might be related to local velocity increasesdue to hydrate or carbonates than to free gas accumulations.
le 3D seismic imaging of gas chimney structures in gas hydrated...,006
C.J. Petersen et al. / Marine and Petroleum Geology xxx (2010) 1e14 13
The inline section displayed in Fig. 12 intersects a gas chimneyand shows that the chimney centre is not stationary with depth.The chimney structure is not straight vertical, but rather contortedand laterally shifted, i.e. the chimney’s centre conduit at the BSRdepth is shifted by about 200 m compared to its location close tothe seafloor pockmark (Fig. 12). The discontinuous strata reflec-tions of the chimney shown in Fig. 12 may indicate a sub-verticalconduit consisting of heterogeneously fractured sediments createdunder high pore fluid pressure. These hydrofractures mightrepresent the currently open fluid pathway that is createdaccording to the principle of least resistance when fluid pressureexceeds a specific threshold (Hubbert and Willis, 1957). Episodi-cally active, vigorous and focused fluid flow could explain theindicated multi-fracturing processes that control the plumbingsystem and lead to extensive pockmark formation at the crest ofthe Vestnesa Ridge. This kind of internal chimney structure hasnot been previously documented by 3D seismic imagery, and itemphasizes the capability of the P-Cable 3D seismic system toidentify subtle details of geo-objects such as gas chimneys andassociated seafloor anomalies.
7. Conclusions
The P-Cable 3D seismic system provides a high-resolutionacoustic imaging tool for the shallow geosphere. Integrated withvelocity information from ocean-bottom seismic measurements itallows a detailed characterization of gas hydrate and fluid flowdominated geological settings such as the sediment drift at theVestnesa Ridge. The exceptional detail of the P-Cable 3D seismicsystem allows for an accurate imaging of gas hydrate reservoirs andthe dynamic free gas system.
High-resolution imaging of focused fluid flow structuresprovides insights into processes related to fluid expulsion offormer or recent activity. The internal structure of these chimneysappears very complex as demonstrated by a great variety ofamplitude anomalies that characterize the conduits for fluids andgases ascending from greater depth to the seafloor. The internalstructure shows both low (amplitude blanking) and high ampli-tudes. The heterogeneous distribution of high-amplitude reflec-tions above the BSR and at shallower depth in the upper 40e50 mbsf suggests formation of massive hydrate and/or authigeniccarbonate in the vicinity of multi-fractured fluid pathways. Sincecarbonate precipitation is restricted to the upper meters belowthe seafloor, we associate the deeper high-amplitude reflectionsabove the BSR with the occurrence of hydrate layers. An alterna-tive explanation may be that free gas causes the high reflectivity ifit is enclosed by gas hydrates. If authigenic carbonates are presentin the sediments down to 40e50 m bsf, carbonate precipitationmust have started at least 61e70 ka ago. Only targeted coring anddrilling of fluid flow chimneys would provide more conclusiveanswers.
Acknowledgements
The research work has been financed by the NorwegianResearch Council within PETROMAKS projects GANS (GasHydrates on the Norwegian-Barents Sea-Svalbard margin,contract 175969/S30) and Fluid flow (contract 169514/S 30). Wekindly acknowledge support by the Seabed consortium andStatoilHydro.
References
Berndt, C., Bünz, S., Mienert, J., 2003. Polygonal fault systems on the Mid-Norwegianmargin: a long-term source for fluid flow. In: Rensbergen, P.V., Hillis, R.,
Please cite this article in press as: Petersen, et al., High-resolution P-CabMarine and Petroleum Geology (2010), doi:10.1016/j.marpetgeo.2010.06.
Maltman, A., Morley, C. (Eds.), Origin, Processes, and Effects of SubsurfaceSediment Mobilization on Reservoir to Regional Scale. Geological Society ofLondon, Special Publication.
Brown, H.E., Holbrook, W.S., Hornbach, M.J., Nealon, J., 2006. Slide structure androle of gas hydrate at the northern boundary of the Storegga Slide, offshoreNorway. Marine Geology 229 (3e4), 179e186.
Bünz, S., Mienert, J., 2004. Acoustic imaging of gas hydrate and free gas at theStoregga Slide. Journal of Geophysical Research 109.
Bünz, S., Mienert, J., Berndt, C., 2003. Geological controls on the Storegga gas-hydrate system of the mid-Norwegian continental margin. Earth and PlanetaryScience Letters 209 (3e4), 291e307.
Bünz, S., Mienert, J., Bryn, P., Berg, K., 2005a. Fluid flow impact on slope failure fromthree-dimensional seismic data: a case study in the Storegga Slide. BasinResearch 17, 109e122.
Bünz, S., Mienert, J., Vanneste, M., Andreassen, K., 2005b. Gas hydrates at theStoregga Slide: constraints from an analysis of multicomponent, wide-angleseismic data. Geophysics 70 (5), B19eB34.
Bünz, S., Petersen, C.J., Hustoft, S., Mienert, J., 2008. Environmentally-sensitive gashydrates on the W-Svalbard margin at the gateway to the Arctic ocean. In:Proceedings of the 6th International Conference on Gas Hydrates, Vancouver,British Colombia, Canada, pp. 6.
Cartwright, J., Huuse, M., Aplin, A., 2007. Seal bypass systems. AAPG Bulletin 91 (8),1141e1166.
Eiken, O., Hinz, K., 1993. Contourites in the Fram Strait. Sedimentary Geology 82,15e32.
Engen, Ø., Faleide, J.I., Dyreng, T.K., 2008. Opening of the Fram Strait gateway:a review of plate tectonic constraints. Tectonophysics 450 (1e4), 51e69.
Forsberg, C.F., Solheim, A., Elverhoi, A., Jansen, E., Channell, J.E.T., Andersen, E.T.,1999. The depositional environment of the Western Svalbard Margin during thelate Pliocene and the Pleistocene: sedimentary facies changes at site 986. In:Raymo, M.E., Jansen, E., Blum, P., Herbert, T.D. (Eds.), Proceedings of the OceanDrilling Program, Scientific Results. Ocean Drilling Program. College Station,Texas, pp. 233e246.
Gay, A., Lopez, M., Berndt, C., Seranne, M., 2007. Geological controls on focused fluidflow associated with seafloor seeps in the Lower Congo Basin. Marine Geology244 (1e4), 68e92.
Gay, A., Lopez, M., Cochonat, P., Séranne, M., Levaché, D., Sermondadaz, G., 2006.Isolated seafloor pockmarks linked to BSRs, fluid chimneys, polygonal faults andstacked OligoceneeMiocene turbiditic palaeochannels in the Lower CongoBasin. Marine Geology 226 (1e2), 25e40.
Greinert, J., Bohrmann, G., Suess, E., 2001. Gas hydrate-associated carbonates andmethane-venting at Hydrate Ridge: classification, distribution and origin ofauthigenic lithologies. In: Paull, C.K., Dillon, W.P. (Eds.), Natural Gas Hydrates:Occurrence, Distribution and Detection. Geophysical Monographs. AmericanGeophysical Union, pp. 99e114.
Haacke, R.R., Westbrook, G.K., Riley, M., 2008. Controls on the formation andstability of gas hydrate-related bottom-simulating reflectors (BSRs): a casestudy from the west Svalbard continental slope. Journal of GeophysicalResearch 113. doi:10.1029/2007JB005200 B05104.
Hjelstuen, B.O., Haflidason, H., Sejrup, H.P., Nygard, A., 2010. Sedimentary andstructural control on pockmark development e evidence from the Nyeggapockmark field, NW European margin. Geo-Marine Letters 30 (3e4), 221e230.
Holbrook, W.S., Gorman, A.R., Hornbach, M., Hackwith, K.L., Nealon, J., Lizarralde, D.,Pecher, I.A., 2002. Seismic detection of marine methane hydrate. The LeadingEdge 21, 686e689.
Holbrook, W.S., Hoskins, H., Wood, W.T., Stephen, R.A., Lizarralde, D., Leg 164Science Party, 1996. Methane gas-hydrate and free gas on the Blake Ridge fromvertical seismic profiling. Science 273, 1840e1843.
Hornbach, M.J., Saffer, D., Holbrook, W.S., Van Avendonk, H.J.A., Gorman, A.R., 2008.3D seismic imaging of the Blake Ridge methane hydrate province: evidence forlarge concentrated zones of gas hydrate and morphologically-driven advection.Journal of Geophysical Research. doi:10.1029/2007JB005392.
Hovland, M., Gardner, J.V., Judd, A.G., 2002. The significance of pockmarks tounderstanding fluid flow processes and geohazards. Geofluids 2 (2), 127e136.
Howe, J.A., Shimmield, T.M., Harland, R., 2008. Late Quaternary contourites andglaciomarine sedimentation in the Fram Strait. Sedimentology 55 (1), 179e200.
Hubbert, M.K., Willis, D.G.W., 1957. Mechanics of hydraulic fracturing. Transactionsof the American Institute of Mining and Metallurgical Engineers 210, 153e168.
Hustoft, S., Bünz, S., Mienert, J., Chand, S., 2009. Gas hydrate reservoir and activemethane-ventingprovince in sedimentson<20Mayoungoceanic crust in the FramStrait, offshore NW-Svalbard. Earth and Planetary Science Letters 284 (1e2),12e24.
Hustoft, S., Mienert, J., Bunz, S., Nouze, H., 2007. High-resolution 3D-seismic dataindicate focussed fluid migration pathways above polygonal fault systems ofthe mid-Norwegian margin. Marine Geology 245 (1e4), 89e106.
Ivanov, M., Blinova, V., Kozlova, E., Westbrook, G.K., Mazzini, A., Minshull, T.A.,Nouze, H., 2007. First sampling of gas hydrate from the Vøring Plateau. EOS 88(19), 209e212.
Jansen,E., Raymo,M.E., Blum, P.,1996.OceanDrillingProgram, Site986. In: Proceedingsof the Ocean Drilling Program, Initial Reports. College Station, Texas, 162.
Judd, A.G., Hovland, M., 2007. Seabed Fluid Flow; the Impact on Geology, Biology,and the Marine Environment. Cambridge University Press, 475 pp.
Kennicutt, M.C., et al., 1985. Vent-type taxa in a hydrocarbon seep region on thelouisiana slope. Nature 317 (6035), 351e353.
King, L.H., MacLean, B., 1970. Pockmarks on the Scotian Shelf. GSA Bulletin 81,3141e3148.
le 3D seismic imaging of gas chimney structures in gas hydrated...,006

C.J. Petersen et al. / Marine and Petroleum Geology xxx (2010) 1e1414
Ligtenberg, J.H., 2005. Detection of fluid migration pathways in seismic data:implications for fault seal analysis. Basin Research 10, 13.
Mienert, J., et al., 2007. “Gas hydrates of the NBS-Margin” W-Svalbard margin, 3D-PCable seismic Experiment, PETROMAKS-Project. University of Tromsø,Department of Geology. submitted for publication.
Mienert, J., Posewang, J., Baumann, M., 1998. Gas hydrates along the north-easternAtlantic Margin: possible hydrate bound margin instabilities and possiblerelease of methane. In: Henriet, J.-P., Mienert, J. (Eds.), Gas Hydrates: Relevanceto World Margin Stability and Climatic Change. Geological Society of London,Special Publication, pp. 275e291.
Mienert, J., Posewang, J., Lukas, D., 2001. Changes in the hydrate stability zone onthe Norwegian margin and their consequences for methane and carbonreleases into the oceanosphere. In: Schlaefer, P., Ritzrau, W., Schlueter, W.,Thiede, J. (Eds.), The Northern North Atlantic: A Changing Environment.Springer, Berlin, pp. 259e280.
Paull, C., Ussler III, W., Holbrook, W.S., Hill, T.M., Keaten, R., Mienert, J.,Haflidason, H., Johnson, J.E., Winters, W.J., Lorenson, T.D., 2008. Origin ofpockmarks and chimney structures on the flanks of the Storegga Slide, offshoreNorway. Geo-Marine Letters 28 (1), 43e51.
Petersen, C.J., Bünz, S., Hustoft, S.,Mienert, J., 2008. 3D Seismic Imaging of MarineGas Hydrates in Arctic Sediments of the Vestnesa Ridge off the W-Svalbardmargin. In: Proceedings of the 6th International Conference on Gas Hydrates.Vancouver, British Colombia, Canada, July 6e10, pp. 8.
Petersen, C.J., Papenberg, C., Klaeschen, D., 2007. Local seismic quantification of gashydrates and BSR characterization from multi-frequency OBS data at northernHydrate Ridge. Earth and Planetary Science Letters 255 (3e4), 414e431.
Planke, S., Berndt, C., 2004. Apparatus for seismic measurements. US Patent no. US7221620 B2.
Plaza-Faverola, A., Bünz, S., Mienert, J., 2010. Fluid distributions inferred from P-wave velocity and reflection seismic amplitude anomalies beneath the Nyeggapockmark field of the mid-Norwegian margin. Marine Petroleum Geology 27(1), 46e60.
Posewang, J., Mienert, J., 1999. High-resolution seismic studies of gas hydrates westof Svalbard. Geo-Marine Letters 19, 150e156.
Purdy, G.M., Mutter, J.C., Carbotte, S.M., Canales, J.P., Nedimovic, M.R., Carton, H.,Newman, K.R., Marjanovic, M., Xu, M., Aghaei, O., Stowe, L.C., 2008. 3Dseismic reflection imaging of crustal formation processes on the East PacificRise, 9�57e42’N. Eos Trans. AGU, 89(53): Fall Meet. Suppl., Abstract B21A-0322.
Riedel, M., 2007. 4D seismic time-lapse monitoring of an active cold vent, northernCascadia margin. Marine Geophysical Researches 28 (4), 355e371.
Riedel, M., Hyndman, R.D., Spence, G.D., Chapman, N.R., 2002. Seismic investiga-tions of a vent field associated with gas hydrates, offshore Vancouver Island.Journal of Geophysical research 107 (B9), 2200,. doi:10.1029/2001.
Ritger, S., Carson, B., Suess, E., 1987. Methane-derived authigenic carbonates formedby subduction-induced pore water expulsion along the Oregon/Washingtonmargin. GSA Bulletin 48, 147e156.
Please cite this article in press as: Petersen, et al., High-resolution P-CabMarine and Petroleum Geology (2010), doi:10.1016/j.marpetgeo.2010.06.
Ritzmann, O., Jokat, W., Czuba, W., Guterch, A., Mjelde, R., Nishimura, Y., 2004. Adeep seismic transect from Hovgård Ridge to northwestern Svalbard across thecontinental-ocean transition: a sheared margin study. Geophysical JournalInternational 157 (2), 683e702.
Roberts, H.H., Hardage, B.A., Shedd, W.W., Hunt, J., 2006. Seafloor reflectivity e animportant seismic property for interpreting fluid/gas expulsion geology and thepresence of gas hydrate. The Leading Edge 25 (5), 620e628.
Suess, E., Torres, M.E., Bohrmann, G., Collier, R.W., Greinert, J., Linke, P., Rehder, G.,Trehu, A.,Wallmann, K.,Winckler, G., Zuleger, E.,1999. Gas hydrate destabilization:enhanced dewatering, benthicmaterial turnover and largemethane plumes at theCascadia convergent margin. Earth and Planetary Science Letters 170 (1e2), 1e15.
Sultan, N., Voisset, M., Marsset, T., Vernant, A.M., Cauquil, E., Colliat, J.L., Curinier, V.,2007. Detection of free gas and gas hydrate based on 3D seismic data and conepenetration testing: an example from the Nigerian Continental Slope. MarineGeology 240 (1e4), 235e255.
Vanneste, M., Guidard, S., Mienert, J., 2005. Bottom-simulating reflections andgeothermal gradients across the western Svalbard margin to the MolloyTransform Fault. Terra Nova 17 (6), 510e516.
Vogt, P.R., 1986. Geophysical and geochemical signatures and plate tectonics. In:Hurdle, B.G. (Ed.), The Nordic Seas. Springer, New York, pp. 413e664.
Vogt, P.R., Crane, K., Sundvor, E., Max, M.D., Pfirman, S.L., 1994. Methane-generated(?) pockmarks on young, thickly sedimented oceanic crust in the Arctic: vest-nesa Ridge, Fram Strait. Geology 22, 255e258.
Vogt, P.R., Gardner, J., Crane, K., Sundvor, E., Bowles, F., Cherkahev, G., 1999. Ground-truthing 11- to 12-kHz side-scan sonar imagery in the Norwegia-GreenlandSea: Part I: pockmarks on the Vestnesa Ridge and Storegga slide margin. Geo-Marine Letters V19 (1), 97e110.
Wagner-Friedrichs, Krastel, S., Spiess, V., Ivanov, M., Bohrmann, G., Meisner, M., 2008.Three-dimensional seismic investigations of the Sevastopol mud volcano in corre-lationtogas/fluidmigrationpathways and indications for gashydrateoccurrences inthe Sorokin Trough (Black Sea). Geochemistry Geophysics Geosystems 9, 22.
Westbrook, G.K., Chand, S., Rossi, G., Long, C., Buenz, S., Camerlenghi, A., Carcione, J.M., Dean, S., Foucher, J.-P., Flueh, E., Gei, D., Haacke, R.R., Madrussani, G.,Mienert, J., Minshull, T.A., Nouze, H., Peacock, S., Reston, T.J., Vanneste, M.,Zillmer, M., 2008a. Estimation of gas hydrate concentration from multi-compo-nent seismic data at sites on the continental margins of NW Svalbard and theStoregga region of Norway. Marine and Petroleum Geology 25 (8), 744e758.
Westbrook, G.K., Exley, R., Minshull, T., Nouze, H., Gailler, A., Jose, T., Ker, S., Plaza, A.,2008b. High-resolution 3D Seismic Investigations of Hydrate-bearing Fluid-escape Chimneys in the Nyegga Region of the Vøring Plateau, Norway. In:Proceedings of the 6th International Conference on Gas Hydrates, Vancouver,British Colombia, Canada, July 6e10, pp. 8.
Zelt, C.A., Smith, R.B., 1992. Seismic traveltime inversion for 2-D crustal velocitystructure. Geophysical Journal International 108, 16e34.
Zuhlsdorff, L., Spiess, V., 2004. Three-dimensional seismic characterization ofa venting site reveals compelling indications of natural hydraulic fracturing.Geology 32 (2), 101e104.
le 3D seismic imaging of gas chimney structures in gas hydrated...,006