marine atlantic 2013/14 summary 2013-2018 corporate... · marine atlantic 2013/14 – 2017/18...
TRANSCRIPT

Corporate Plan 2013 - 2018
Marine Atlantic
2013/14 – 2017/18 Corporate Plan
Summary
November 20th
, 2013

Corporate Plan 2013 – 2018 i
Executive Summary
2012-13 was another successful year for Marine Atlantic. With its new fleet in place, the
Corporation was able to make great strides in reviewing its business processes and focusing its
energies on continued improvements to customer service, developing new cost containment
strategies, and the continued restructuring and re-building of its shore based infrastructure.
For the upcoming planning period, the Corporation will continue to build on these successes with
two key strategic priorities: continuing improvements to service reliability, and improving the cost
effectiveness of the organization.
Financial results for the 2012/13 fiscal year show the Corporation achieving an overall cost
recovery result of 67.1%, well ahead of expectations. The Corporation is forecasting cost recovery
to remain relatively stable over the planning period.
MAI continues to see a change in its traffic mix, with passenger related vehicle (PRV) traffic
declining, and commercial related vehicle (CRV) traffic increasing. Overall, the Corporation is
forecasting traffic to remain relatively stable over the course of the planning period.
There was a slight softening of total revenues in 2012/13, which can be attributed to the decline in
PRV traffic and a slower than anticipated growth rate in CRV traffic. In alignment with its revenue
strategy, MAI increased all rates by 4% in April of 2013.
As a result of these rate actions, as well as other revenue generating activities, the Corporation is
forecasting an increase in revenues over the planning period from $108M in 2013/14 to $134M in
2017/18.
The Corporation is committed to delivering on the savings initiatives that were identified as part of
the 2012 Budget.
Improving service reliability is a key strategic goal for the organization, and is reflected in two
measures: On-time Performance and Unplanned Service Interruptions. On-time performance
increased in 2012/13 to 86%, excluding weather related delays, an improvement of 2% over last
year. This measure has increased significantly since the introduction of the new fleet in 2010/11.
Although the Corporation experienced several significant unplanned service interruptions in the
summer, overall the amount of time that the fleet was out of service decreased from 6% in
2011/12 to 3% in 2012/13. The Corporation is forecasting that it will maintain or improve on the
time that the fleet is out of service due to unplanned mechanical events over the five year planning
period.
Customer satisfaction levels have increased dramatically over the past several years due to the
introduction of the new fleet and significant improvements to service levels. In 2012/13, ‘Overall
Satisfaction’ was at 64% and ‘Very Likely to Recommend’ was at 45%. The Corporation has set
Corporate Plan 2013 – 2018 ii
higher targets for these two key measures over the course of the five year planning period, and
commits to continuing improvements in customer satisfaction levels.
The highest priority for the Corporation is to ensure the health and safety of both its employees and
its passengers. Great strides have been made over the past year with respect to improving the
safety culture throughout the company, with demonstrable results. Over the course of the
planning period, the Corporation will build on these improvements, with a continued focus on
safety in every aspect of its operations.
One of the most important factors to the ongoing success of Marine Atlantic is its ability to
efficiently and effectively plan and govern its operations, thereby enjoying the continued confidence
of its shareholder. To that end, the Corporation has successfully implemented strategies to fully
address all of the deficiencies laid out in the 2009 Special Examination completed by the Office of
the Auditor General. Recognizing that the Corporation’s current funding envelope expires at the
end of 2014/15, and that the charters for the Corporation’s fleet extend beyond the end of the
current funding period, MAI intends to submit to Government its proposal for sustainable long
term funding.
To summarize, despite negative pressures on both traffic and revenues, MAI’s financial
performance remains strong. The Corporation has generated an operating funding surplus for the
third consecutive year, and continues to achieve strong cost recovery results. MAI has made great
strides in its investments in new vessels and its shore-based infrastructure, allowing for significant
improvements in operations and a much improved customer experience.
The upcoming planning period will be one of continued transition for Marine Atlantic. While most
of the focus over the past several years has been on vessel and physical infrastructure renewal, the
Corporation must now turn its energies to business process and cultural renewal. Information
management, reservation management, work flow processes, procurement processes, maintenance
management, and human resource management are all vital to the organization’s ongoing success.
And just as investments were necessary to improve our vessels and shore-based facilities, continued
investment is now required for business process transformation. As the Corporation moves through
the next five year planning cycle, MAI’s focus will change from an organization intent on re-
building itself to one whose primary focus is ongoing operational success and excellent customer
service.
Corporate Plan 2013 – 2018 iii
Table of Contents
Executive Summary ............................................................................................................. i
1 Corporate Profile, Mandate and Governance ................................................................... 1
1.1 Background ................................................................................................................................... 1
1.2 Vision Statement ......................................................................................................................... 1
1.3 Mission Statement ...................................................................................................................... 1
1.4 The Board of Directors.............................................................................................................. 1
2 Strategic Priorities - 2013/14 to 2017/18 ......................................................................... 2
3 Protection of People, Property and the Environment ....................................................... 3
3.1 Health, Safety and Environment ........................................................................................... 4
3.2 Security and Emergency Preparedness ............................................................................. 5
3.3 Emissions Regulations .............................................................................................................. 5
4 Service Reliability ............................................................................................................ 6
4.1 On-Time Performance ............................................................................................................... 6
4.1.1 Unplanned Service Interruptions ....................................................................... 6
4.2 Vessel Maintenance .................................................................................................................... 7
4.2.1 Vessel Refits and Major Overhauls ................................................................... 8
4.3 Fleet Strategy ................................................................................................................................ 8
5 Customer Experience ....................................................................................................... 8
5.1 Customer Service ........................................................................................................................ 9
5.2 Changing Customer Demand ............................................................................................... 10
5.2.1 Traffic Results – 2012-13 ............................................................................... 10
5.2.2 Influencing Customer Demand ...................................................................... 10
5.3 Improved Value Perception ................................................................................................. 10
6 Effective Governance and Sustainable Funding ............................................................ 11
6.1 OAG Special Examination ...................................................................................................... 11
6.2 Enhancing Risk Management .............................................................................................. 11
6.3 Internal Controls ...................................................................................................................... 12
6.4 Long Term Funding Requirements ................................................................................... 12
7 Being a Respectful and Engaging Organization ............................................................ 12
7.1 Human Resource Management ........................................................................................... 13
7.2 Managing People-Based Changes ...................................................................................... 13
7.3 Long Term Labour Relations Strategy ............................................................................. 15

Corporate Plan 2013 – 2018 iv
7.4 Changes to the Pension Plan ................................................................................................ 15
8 Meet Cost Recovery Targets and Live Within Appropriation ....................................... 16
8.1 Financial Results 2012/13 ................................................................................................... 16
8.1.1 Capital Spend 2012/13 .................................................................................. 17
8.2 Financial Assumptions 2013/14 – 2017/18 ................................................................. 17
8.2.1 Traffic Forecast ............................................................................................... 18
8.2.2 Revenues ......................................................................................................... 18
8.2.3 Operating Expenses ........................................................................................ 18
8.2.4 Fuel Management ........................................................................................... 18
8.2.5 Capital Management ........................................................................................ 19
8.2.6 Inflation Rates ................................................................................................ 19
8.2.7 Foreign Exchange ........................................................................................... 20
8.2.8 Savings Commitments .................................................................................... 20
8.3 Business Process Efficiencies .............................................................................................. 20
8.3.1 Procurement ................................................................................................... 20
8.3.2 Information Technology Management ......................................................... 21
8.4 External Impacts ...................................................................................................................... 22
8.4.1 Bar Harbor ....................................................................................................... 22
9 Specific Approvals Sought ............................................................................................ 22
9.1 Bank Line of Credit .................................................................................................................. 22
10 Financial Statements .................................................................................................... 23
10.1 Statement A: Statement of Financial Position ............................................................ 24
10.2 Statement B: Statement of Operations and Accumulated Surplus ..................... 26
10.3 Statement C: Statement of Remeasurement Gains and Losses ........................... 28
10.4 Statement D: Statement of Changes in Net Financial Assets (Debt) .................. 29
10.5 Statement E: Statement of Cash Flows .......................................................................... 30
Appendix A: Organizational Structure ............................................................................. 32

Corporate Plan 2013 – 2018 v
TABLE of FIGURES
FIGURE 1 – SAFETY STATISTICS _____________________________________________________________4 FIGURE 2 – ON-TIME PERFORMANCE ________________________________________________________6 FIGURE 3 - CUSTOMER SERVICE ____________________________________________________________9
LIST OF TABLES TABLE 1 - STRATEGIC GOALS & PRIORITIES ____________________________________________________3 TABLE 2 - FTE BREAKDOWN ______________________________________________________________ 14 TABLE 3 - SAVINGS COMMITMENTS _______________________________________________________ 20

Corporate Plan 2013 – 2018 1
1 Corporate Profile, Mandate and Governance
1.1 Background
When Newfoundland joined Canada in 1949, the ferry service between the Province of Newfoundland and
Labrador and the mainland was accorded special constitutional status under Term 32(1) of the Terms of
Union (The Newfoundland Act, 1949) which guarantees that Canada will “maintain in accordance with the traffic
offering a freight and passenger steamship service between North Sydney and Port aux Basques, which, on completion of a
motor highway between Corner Brook and Port aux Basques, will include suitable provision for the carriage of motor
vehicles”. Marine Atlantic exists to fulfill that mandate.
Marine Atlantic was created on June 27, 1986 as a parent Crown Corporation through the Marine Atlantic
Inc. Acquisition Authorization Act. As a Crown Corporation, Marine Atlantic is regulated under Part X of the
Financial Administration Act. As per the Order in Council of March 12, 1987 (P.C. 1987-463), the Bilateral
Agreement between Her Majesty the Queen and Marine Atlantic established the relationship between the
Parties under which subsidiary operating, capital, and land lease agreements relating to the operation of
specific ferry and coastal services in Atlantic Canada may be executed.1
Besides providing a year-round freight and passenger ferry service between North Sydney, Nova Scotia and
Port aux Basques, Newfoundland and Labrador, Marine Atlantic also operates a seasonal service (June to
September) between North Sydney, Nova Scotia and Argentia, Newfoundland and Labrador.
1.2 Vision Statement
The Corporation’s Vision Statement is “to achieve excellence in fulfilling the federal mandate to provide a
ferry service between the mainland of Canada and the Province of Newfoundland and Labrador”.
1.3 Mission Statement
The Corporation’s Mission Statement is “to provide a safe, environmentally responsible and quality ferry
service between the Island of Newfoundland and the Province of Nova Scotia in a reliable, courteous and
cost-effective manner”.
1.4 The Board of Directors
Like all Crown corporations, Marine Atlantic was established to allow it to operate at arm’s length from its
sole shareholder, the Government of Canada. While the shareholder provides policy direction and funding
for the Corporation’s ongoing operations, as stated in the Financial Administration Act, Marine Atlantic’s
Board of Directors ensures that the Corporation fulfils its mandate by setting the Corporation’s strategic
1 A Bilateral Agreement was considered necessary, at the time, given the fact that the Marine Atlantic Inc. Acquisition Authorization Act was merely an instrument that created the Crown Corporation. Another instrument was required to define the roles and responsibilities of the Corporation and its responsible Minister. This Bilateral Agreement replaced the Tripartite Agreement that existed between Canadian National (CN), CN Marine and Her Majesty the Queen.

Corporate Plan 2013 – 2018 2
direction and organizational goals and overseeing their implementation by management. Board members
are appointed by the Governor in Council on the recommendation of the Minister of Transport.
The Corporation’s Board of Directors is made up of 10 members, including the President and CEO, and
reports to the Parliament of Canada through the Minister of Transport. Board members are appointed by
the shareholder for one to five year terms, which can be extended at the discretion of the Crown. The
Board currently holds five regularly scheduled meetings annually, convening additional meetings as needed.
Membership of the Board includes individuals with experience in the marine industry, accounting, law,
marketing, tourism, and a broad spectrum of general business experience, all beneficial in providing Marine
Atlantic with appropriate governance direction.
Three permanent Board committees function to support and advise the Board: Audit and Risk, Corporate
Governance and Accountability, and Human Resources and Pension Management. The Audit and Risk
Committee oversees the Corporation’s standards for integrity and behaviour, financial reporting, risk
management, internal audit and management control practices. The Corporate Governance and
Accountability Committee ensures the Board has prudent and effective governance practices to create an
environment of excellence. The Human Resources and Pension Management Committee oversees all
aspects of the Corporation’s human resources and pension plan issues.
2 Strategic Priorities - 2013/14 to 2017/18 Through its annual strategic planning session with the Board of Directors, MAI has identified two key
strategic priorities for the upcoming planning period:
1. Continuing improvements to service reliability.
2. Improving the cost effectiveness of the organization.
These are not new priorities for the organization. In fact, they are a continuation of the work that has
already been undertaken. However, as the organization moves away from the replacing and rebuilding of
its physical assets, a greater focus can now be taken on business process re-engineering and improved
efficiencies.
These strategies must be viewed in the context of the organization as a whole, and have been incorporated
into each of the Corporation’s key areas of focus, as outlined in the table below.
Corporate Plan 2013 – 2018 3
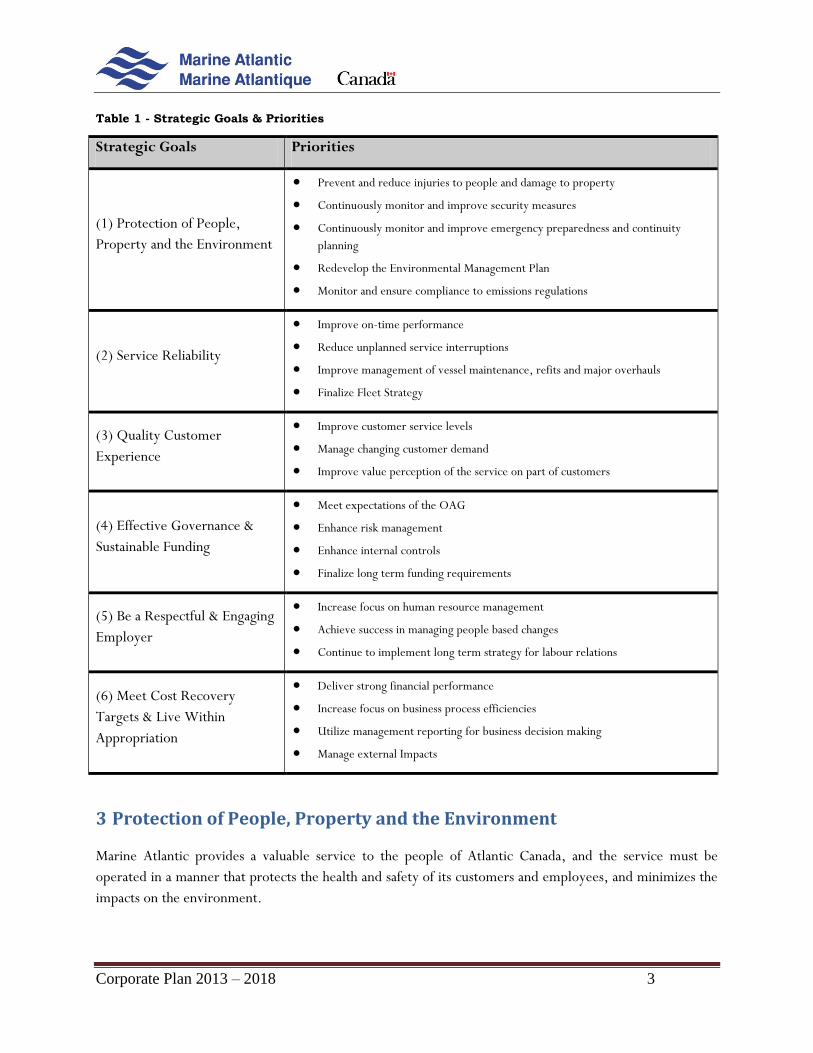
Table 1 - Strategic Goals & Priorities
Strategic Goals Priorities
(1) Protection of People,
Property and the Environment
Prevent and reduce injuries to people and damage to property
Continuously monitor and improve security measures
Continuously monitor and improve emergency preparedness and continuity
planning
Redevelop the Environmental Management Plan
Monitor and ensure compliance to emissions regulations
(2) Service Reliability
Improve on-time performance
Reduce unplanned service interruptions
Improve management of vessel maintenance, refits and major overhauls
Finalize Fleet Strategy
(3) Quality Customer
Experience
Improve customer service levels
Manage changing customer demand
Improve value perception of the service on part of customers
(4) Effective Governance &
Sustainable Funding
Meet expectations of the OAG
Enhance risk management
Enhance internal controls
Finalize long term funding requirements
(5) Be a Respectful & Engaging
Employer
Increase focus on human resource management
Achieve success in managing people based changes
Continue to implement long term strategy for labour relations
(6) Meet Cost Recovery
Targets & Live Within
Appropriation
Deliver strong financial performance
Increase focus on business process efficiencies
Utilize management reporting for business decision making
Manage external Impacts
3 Protection of People, Property and the Environment Marine Atlantic provides a valuable service to the people of Atlantic Canada, and the service must be
operated in a manner that protects the health and safety of its customers and employees, and minimizes the
impacts on the environment.

Corporate Plan 2013 – 2018 4
3.1 Health, Safety and Environment
The highest priority for the Corporation is to ensure the health and safety of both its employees and its
passengers. Great strides have been made over the past year with respect to improving the safety culture
throughout the company, with demonstrable results. Toolbox meetings are now a standard part of the
management teams’ functions; reports of near misses have increased by almost 367%. Lost Time Incidents
(LTIs) have decreased by 57%. A Corporate wide Communications Plan with the theme of “Work Aware”
was recently launched highlighting the importance of safety in all aspects of operations. Occupational
Health and Safety (OH&S) committees have been established and are functioning well throughout the
company.
Year over year (April 1 – March 31) results for safety incidents are outlined below.
Figure 1 – Safety Statistics
The number of near misses reported in 2012 has increased significantly over 2011, which is a very positive
indication that the Corporation’s employees are using the Safety Management System (SMS) effectively and
that MAI’s commitment to safety has been recognized and is being assimilated throughout the organization.
The many improvements in MAI’s safety culture have not gone unnoticed. In the summer of 2012, the Port
aux Basques Terminal Occupational Health and Safety Committee was named “Committee of the Year” at
the fifty-sixth Annual Newfoundland and Labrador Occupational Health and Safety Conference. With over
3,100 registered Occupational Health and Safety Committees in the Province, this is a tremendous
accomplishment for MAI.
Over the course of the planning period, the Corporation will build on these improvements, with a
continued focus on safety in every aspect of its operations. The overall goal is to minimize the number of all
types of actual incidents, while increasing near miss reporting, which allows the organization to identify
potential incidents before they occur, and take the necessary precautions to reduce the likelihood of their
future occurrence. Health, safety and environmental initiatives moving forward will focus on the following:
Continuing education, training, monitoring and communication.
46
20
0
5
10
15
20
25
30
35
40
45
2011/12 2012/13
Lost Time Incidents - 2011/12 vs 2012/13
172
804
0
100
200
300
400
500
600
700
800
900
2011/12 2012/13
Near Misses - 2011/12 vs 2012/13

Corporate Plan 2013 – 2018 5
Continuous updating and improvement of the SMS documents, forms and procedures.
Instilling the theme of Leadership, Ownership & Accountability in employees throughout the
organization through such forums as safety summits, tool box meetings, etc.
Implementing the Environmental Management Plan.
3.2 Security and Emergency Preparedness
Over the past several years, the Corporation has invested significant resources to ensure that its security and
emergency preparedness systems are robust and effective. Through continuous threat, risk and
vulnerabilities (TRV) analysis, the Corporation will ensure that it is ready to effectively manage through any
of the likely events that it might face.
Over the course of the upcoming planning period, the Corporation will focus on continuous improvement
and readiness:
Continued and consistent training in emergency management.
Emergency drills and simulations.
Regular monitoring and updating of security plans.
The development of an IT Continuity Plan to support MAI’s Business Continuity Plan.
Reviewing and updating of vessel security plans.
3.3 Emissions Regulations
In 2009, the International Maritime Organization (IMO) introduced new regulations regarding mandatory
reductions in greenhouse gas emissions for the international shipping industry. Marine Atlantic is expected
to align with these regulations, which take effect in 2015. The entire shipping industry is struggling to find
solutions that will allow organizations to meet these regulations going forward. There are challenges,
however, to doing so. 1.) Fuel suppliers require time to retool their fuel processing facilities in order to
produce fuel that meets the emission targets, and 2.) Vessel based ‘scrubber’ systems designed to reduce
exhaust emissions are not yet commercially available. As such, the Corporation anticipates that to meet the
regulations, it will be forced to convert from blended fuels to the more expensive marine gas oil (MGO).
Should this happen, there will be several impacts on the organization, which have been highlighted as part of
the planning process:
1. Fuel surcharge amounts will need to be reviewed.
2. Capital funding will be required to enable the conversion of the vessel engines to burn MGO, as
well as to make necessary changes to shore-based fueling facilities. An internal team has been
established to better understand the costs and implementation requirements to comply with the
new regulations; their analysis and recommendations are anticipated to be completed end of year.
Meeting the current timelines for compliance with these regulations will be very challenging for the
organization, as it will be for all ship operators. MAI has currently submitted a proposal to Transport

Corporate Plan 2013 – 2018 6
Canada to allow a more gradual switch to MDO to minimize the impacts on both the Corporation and its
customers, yet still allow for compliance with the regulations in a timely manner.
4 Service Reliability
Maintaining on-time performance, minimizing unplanned service interruptions and providing a reliable
service are key goals of the Corporation and are key indicators of the Corporation’s success.
4.1 On-Time Performance
Vessel on-time performance is defined as a vessel leaving port no later than 15 minutes beyond its scheduled
sailing time. With the introduction of the new fleet in early 2011, the Corporation experienced a dramatic
increase in on-time performance relative to previous years. 2012/13 results remained the same as 2011/12
results with on-time performance remaining at 78%, including weather related delays. Excluding weather
related delays, on-time performance increased to 86% in 2012/13, an increase of 2% over the same period
last year.
On time performance is a key measure for the Corporation and one that directly correlates with overall
customer satisfaction. The Corporation has set a target of 85 - 88% that it will strive to maintain throughout
the planning period. With the implementation of improved maintenance practices and other planned
efficiency gains, this target will be revisited in the 2014/15 Corporate Plan.
Figure 2 – On-Time Performance
4.1.1 Unplanned Service Interruptions
Another key contributor to overall customer satisfaction levels is the percentage of time that the fleet is out
of service.
Given the often severe weather conditions in the Gulf of St. Lawrence, delivering consistent on time
performance can sometimes be a challenge for the Corporation, and weather related service interruptions
are unavoidable. However, improved customer communications and management decision making related
40%
50%
60%
70%
80%
90%
100%On-Time Performance - Excl. Weather
Corporate Plan 2013 – 2018 7
to forecasted weather events has enabled the Corporation to minimize the negative impacts of these
weather related outages.
Unplanned service interruptions due to mechanical issues also impact the Corporation’s ability to provide a
reliable, on-time service. The Corporation experienced three significant service interruptions due to
mechanical failure between June and August of 2012/13, creating many challenges for the Corporation.
With vessels being out of service during the Corporation’s busiest time of the year, employees throughout
the organization were faced with significant scheduling and capacity issues. In order to meet demand on the
constitutional route, crossings between North Sydney and Argentia were cancelled, as the MV Atlantic
Vision was re-routed to the Port aux Basques crossing, ensuring adequate capacity to manage the traffic
requirements. It was through the dedication of the Corporation’s employees in rebooking, loading, and
transporting its customers as efficiently and effectively as possible that the Corporation was able to recover
from these service interruptions, while still offering a high level of customer service.
Despite these service interruptions, the Corporation improved on the percentage of time that the fleet was
out of service due to unplanned mechanical issues by three percent over fiscal 2011/12.
Moving forward, the Corporation has set a Key Performance Indicator (KPI) target of three percent, or
lower.
4.2 Vessel Maintenance
Unplanned service interruptions due to mechanical issues have a negative impact not only on the
Corporation’s ability to provide on time service, but also on the public’s perception of the MAI brand. To
minimize these unplanned service interruptions, the Corporation is increasing its focus on its preventative
maintenance management program.
In January 2012, the Corporation engaged Det Norske Veritas (DNV) to perform a full review of its
maintenance management practices, the first phase of which is now complete.
During Phase one, DNV completed an assessment of MAI’s governing manuals, procedures and tools, and
benchmarked them against industry standards in order to identify the gaps between industry leading
practices and the Corporation’s current operation levels. As a result of this activity, MAI has developed a
list of key priorities that it must address in order to reach its goal of improved maintenance management.
The Corporation is in the process of implementing the following activities, which will continue into the
planning period:
Introducing tailored reporting templates that can be implemented in the vessel’s maintenance
software for major equipment types to standardize and streamline the process. This will make
analysis and trending of historical maintenance information much easier as each report will contain
identical fields to be populated by the vessel crew.
Updating maintenance manuals to reflect current best practices.
Phase one also analysed the Corporation’s maintenance management organizational structure and made a
recommendation that will allow MAI to better manage its maintenance practices and have better cost

Corporate Plan 2013 – 2018 8
control. The Corporation will be assessing this recommendation for possible implementation in the
upcoming planning period. Phase two of the DNV review consists of the optimization of the onboard
preventative maintenance program. The maintenance strategy will be vessel specific and will be broken
down by each individual piece of equipment. Phase two will also include the alignment of the Corporation’s
planned maintenance systems into a more user friendly interface that will align with the Corporation’s
overall maintenance philosophy.
4.2.1 Vessel Refits and Major Overhauls
With the introduction of the new vessels in 2011, the Corporation has benefited from greater capacity and
more efficient operations. In the upcoming planning period, MAI plans to build upon these efficiencies by
revisiting its annual operating plan, and reducing the number of planned work periods for each of the
vessels. By reducing planned work periods from two to one, the organization’s maintenance practices will
be brought in line with industry best practices, thereby driving significant savings in its maintenance budget.
Along with the planned improvements to its regular day-to-day maintenance programs, MAI is confident
that its actions will not only generate maintenance efficiencies, but also ensure a well-maintained fleet.
Moving forward, Marine Atlantic will face strategic challenges with respect to finding suitable dry-docking
facilities. While the limited availability of acceptable shipyards is not a new challenge, a recent shipyard
feasibility study completed for the organization concluded that the number of ship repair facilities in Canada
that can respond to the exact needs of the Corporation - specifically the ability to deploy the vessel’s
stabilizers while docked - is very limited.
4.3 Fleet Strategy
Fleet renewal is a key issue for the Corporation, not only from an operational perspective, but also from a
financial perspective, as it helps to form the framework for discussions with its Shareholder about a long
term future funding strategy for the Corporation.
The Corporation has submitted a long term fleet strategy to Transport Canada as part of its submission for
long term sustainable funding. Part of this strategy would allow for a longer term, more predictable fleet
replacement program with each vessel being replaced approximately every 25 years, thereby maintaining a
consistently modern fleet while minimizing costs of maintenance, and enabling the organization to take
advantage of new technologies and to continually meet the changing demands of its customer base.
5 Customer Experience Marine Atlantic has made tremendous progress with respect to the level of customer service that it offers.
Over the course of the planning period, the Corporation will continue to build a strong perception of value
for money within its customer base, as well as with potential new customers.

Corporate Plan 2013 – 2018 9
5.1 Customer Service
Customer satisfaction levels increased dramatically in 2011/12 over previous years due to the introduction
of the new fleet and significant improvements to service levels. In 2012/13, the Corporation has worked
diligently to maintain this improved level of customer satisfaction, despite the challenges of two significant
service interruptions during MAI’s peak operating period.
There are two key indicators that the Corporation tracks in order to ensure that it is offering a satisfactory
level of customer service. The first high level indicator is “overall satisfaction.” This represents the
percentage of customers surveyed who are satisfied with Marine Atlantic’s service. The second indicator is
the percentage of customers who are “very likely to recommend MAI.” This represents the percentage of
customers surveyed who are very likely to recommend the service to another member of the public. This
indicator is, arguably, the most important, as it not only portrays an element of overall satisfaction with the
service offering, but also gives the Corporation an indicator of future growth. If more customers are very
likely to recommend Marine Atlantic, the Corporation can reasonably expect associated demand growth
through increased usage by existing customers, along with growth from new customers.
2012/13 year end results for Overall Satisfaction were at 64%, somewhat lower than the results for the
same period last year. Similarly, Very Likely to Recommend was at 45%, 6% lower than the previous year.
Figure 3 - Customer Service
It is interesting to note that results for both of these indicators were trending ahead of last year’s results at
the end of June 2012, but dropped back to 2011 levels after the service interruptions that were experienced
in June and August of 2012. Ongoing weather related issues due to more severe weather conditions have
also contributed to the decrease. While this minor setback is unfortunate, it is again further reinforcement
of the importance of service reliability to the overall satisfaction levels of the Corporation’s customers.
The Corporation has set a long term target for Overall Satisfaction at 70%, and will strive to achieve results
that are consistently above 50% in “Very Likely to Recommend” by the end of the planning period.
MAI currently surveys its non-commercial customers only. Plans to survey commercial customers are
underway, and results should be available by the third quarter of 2013-14. Appropriate targets for
commercial related traffic will be included in next year’s corporate plan.
70%
64%
60%
62%
64%
66%
68%
70%
72%
2011/12 2012/13
Overall Satisfaction
51%
45%
40%
42%
44%
46%
48%
50%
52%
2011/12 2012/13
Very Likely to Recommend

Corporate Plan 2013 – 2018 10
5.2 Changing Customer Demand
As seen in previous years, the Corporation is continuing to experience a shift in the traffic mix – Passenger
Related Vehicle (PRV) traffic is declining year over year, while Commercial Related Vehicle (CRV) traffic
is increasing. This shift in traffic mix is a result of numerous factors. Downward pressure on PRV traffic
can be attributed to rising gas prices, the strengthening of the Canadian dollar versus the US dollar, the
global recession, and the emergence of low cost airfares. All of these factors, coupled with the
Newfoundland travelers’ rising incomes and the financial wherewithal to travel further afield, have
negatively impacted PRV traffic levels.
On the other hand, CRV traffic has been positively impacted by accelerated Gross Domestic Product
(GDP) growth in Newfoundland and the resulting investments made by the trucking industry to capitalize
on the growing business opportunities in Newfoundland. As well, the attractiveness of MAI’s drop trailer
service and the fact that the Corporation provides daily service has been amenable to the growth of the
importation and exportation of goods that are best suited to MAI’s service – perishable goods such as
produce and fish, and aquaculture – as well as the increase in demand for cargo types principally handled by
MAI – dangerous goods, oversized loads, etc.
5.2.1 Traffic Results – 2012-13
MAI continues to see a decline in PRV traffic, and CRV traffic continues to increase, albeit at a slower rate
than in previous years. The total AEU traffic for 2012/13 is down 1% over the previous year.
PRV traffic declined in 2012/13 by approximately 3% from last year’s level. This represents the third
consecutive year of PRV decline, which has dropped by an annual compounded rate of 3.4% in the past 3
years. Total CRV traffic declined slightly in 2012/13, while the growth in drop trailers has declined to
0.5%.
5.2.2 Influencing Customer Demand
A key determinant in achieving success will be both anticipating and influencing customer demand. The
change in traffic mix impacts not only revenues and costs, but also capacity utilization and workflow
processes.
As such, the Corporation is currently exploring strategies to smooth demand that will eventually enable it
to maximize capacity utilization on a per crossing basis, while reducing costs at the same time.
As part of its overall revenue strategy, the Corporation is focused on increasing the average revenue per
customer. The focus on total revenues rather than on individual product line revenues recognizes the
elasticity of demand and the fact that the Corporation has to operate in a business-like fashion, remaining
flexible to changing customer needs.
5.3 Improved Value Perception
MAI is committed to delivering a high level of customer service and ensuring that its customers feel they are
receiving good value for their money when travelling on MAI’s vessels and when availing of the many on-

Corporate Plan 2013 – 2018 11
shore amenities. How a customer perceives value depends on their evaluation of the benefits received, the
price paid for those benefits, as well as the available alternatives, which in the case of MAI would mainly be
the various airlines operating in Atlantic Canada and other freight operators.
The Corporation currently undertakes public opinion research twice yearly. “Providing Customers with
Value for Money” is one of several indicators that the Corporation is now tracking. The term “Value for
Money” is open to interpretation by the customer and the scores will vary based on customers varying
perceptions of what good value for money represents. By tracking this measure, the Corporation is ensuring
that it collects information on customer’s value perceptions of MAI’s service offerings and their associated
rates. While current results are lower than the organization would like, the results are trending upward,
indicating that MAI’s efforts to date have been successful.
Over the course of the planning period, MAI will continue to work on improving its customers’ perceived
value for money through operating efficiencies and further analysis of products and amenities available both
on-shore and on the Corporation’s four vessels.
6 Effective Governance and Sustainable Funding One of the most important factors to the ongoing success of Marine Atlantic is its ability to efficiently and
effectively govern its operations. The Corporation has made significant improvements in its governance
processes over the past several years, and will continue to build on them throughout the upcoming planning
period. By doing so, the Corporation hopes to enjoy the continued confidence of its shareholder, which will
result in a sustainable business model with predictable funding requirements.
6.1 OAG Special Examination
The Corporation has successfully implemented strategies to fully address all of the deficiencies laid out in
the 2009 Special Examination completed by the Office of the Auditor General. Deficiencies related to
funding, strategic and operational planning, risk management and business continuity planning have all been
addressed and are well documented within the organization. The Board of Directors has completed its
review of the corporate governance practices, and implemented the changes necessary to improve its
governance measures. Changes in MAI’s operations to accommodate new security requirements have also
been implemented. A strategic human resources plan has been developed and was approved by the Board,
and an automated staff scheduling system has been put in place. The Corporation has secured the aid of
DNV to help improve its maintenance management functions, which will enable MAI to not only become
more efficient and reliable, but also continue to provide a service that is safe and timely for its customers.
6.2 Enhancing Risk Management
Marine Atlantic recognizes that in offering products and services to customers, and the means by which the
products and services are offered, the Company inherently assumes a variety of risks. A key accountability
of Marine Atlantic is to provide for the safety and security of the organization. Therefore, for the safety,
soundness and good reputation of Marine Atlantic as a whole to be maintained, the Corporation’s Board of

Corporate Plan 2013 – 2018 12
Directors instructed the organization to implement and maintain a comprehensive enterprise-wide approach
to ensure that the inherent risks of the organization are recognized, governed and managed appropriately.
The process by which this is completed is known as Enterprise Risk Management (ERM).
The focus of MAI’s Enterprise Risk Management program at the governing and executive level is on the
risks that have a significant severity and/or significant impact on safety, the financial resources, service
levels, or the reputation of the company. The ERM program ensures that when a high level risk is
identified, specific policies are established for the major types of risks including (but not limited to)
employee safety, customer safety, financial health, and people.
6.3 Internal Controls
The Corporation is currently engaged in a comprehensive assessment of its internal control environment to
develop and improve current procedures. A risk assessment has been completed on the various finance
processes to facilitate the development of internal control questionnaires and to prioritize their
implementation. A draft questionnaire has been developed for the expenditures process, controls gaps have
been identified and remedial action is being developed. The expenditures questionnaire will be used as a
template for the other finance processes with expected completion by March 31, 2013. A comprehensive
testing and compliance program will be developed and implemented for each finance process as it is
completed.
Going forward, internal control questionnaires and a testing and compliance program will be developed for
non-finance processes. Entity level controls will be examined and reviewed for effectiveness with the
ultimate objective being to provide documentation on an ongoing basis to demonstrate the in-control state
of the organization.
6.4 Long Term Funding Requirements
As part of the Corporation’s governance model, MAI is looking at further developing its long term strategic
planning functions. While much of the organization is focused on day to day operations and fulfilling its
monthly, quarterly and annual governance requirements, a successful organization must also be focused on
its long term strategic goals in order to build upon its successes and sustain its progress. For MAI, this will
consist of developing longer term vessel strategies, identifying its long term shore-based infrastructure
requirements, and assessing the required sustainable funding levels to enable fulfillment of these goals.
As part of this long term strategic planning process and recognizing that the Corporation’s current funding
envelope expires at the end of 2014/15, MAI intends to submit to Government its proposal for sustainable
long term funding.
7 Being a Respectful and Engaging Organization Marine Atlantic remains committed to being an employer of choice in Atlantic Canada and strives to offer a
safe and healthy workplace, where employee actions are directly aligned with the business and where
contributions are acknowledged and rewarded.

Corporate Plan 2013 – 2018 13
7.1 Human Resource Management
Marine Atlantic has a diverse workforce that is represented by six bargaining units as well as a number of
management/non-union employees. The breakdown in full time equivalents (FTEs) of the Corporation’s
workforce and the current status of contract negotiations is shown on the following page. Future contract
negotiations will be in line with the Corporation’s Long Term Labour Relations Strategy.
7.2 Managing People-Based Changes
During the planning period, Marine Atlantic will strive to be successful in managing people-based changes.
As a major employer in Atlantic Canada, Marine Atlantic’s workforce is constantly changing. Training new
employees and managing change as long time employees retire or depart from the Corporation is an
ongoing challenge. In 2013/14, MAI will introduce a formal workforce planning program. This is a critical
step in linking the Corporation’s business directions with its resource planning, succession planning, work
design and staff development.
MAI will continue to strengthen its leadership development capacity to ensure that the next generation of
the Corporation’s leaders are up to the task of leading the organization in its continued transformation to
become a more modern and efficient organization with a high level of customer service.

Corporate Plan 2013 – 2018 14
Table 2 - FTE Breakdown
Agreement &
Expiry Date Representing Bargaining Agent
Collective Bargaining
Status FTEs 2012/13
A Dec-31-2013 Licensed
Officers
Canadian Merchant Service
Guild
Agreement renewed until
31 December 2013
142
B Dec-31-2013
Unlicensed
Vessel Crew
National Automobile,
Aerospace, Transportation and
General Workers Union of
Canada (CAW)
Agreement renewed until
31 December 2013
446
C Dec-31-2013
Shore-Based
Maintenance
Employees
National Automobile,
Aerospace, Transportation and
General Workers Union of
Canada (CAW)
Arbitrator’s decision
received 7 June 2013,
agreement renewed until
31 December 2013
63
D Dec-31-2013 Shore-Based
Terminal and
Clerical
Employees
The United Steel Workers/
International Longshoremen,
Council of Trade Unions
Agreement renewed until
31 December 2013
294
E Dec-31-2012 Masters, Chief
Engineers and
Chief Electrical
Officers
Canadian Merchant Service
Guild
Collective bargaining for
new agreement
commenced December
2012, next negotiation
session scheduled
September 2013
29
F Dec-31-2013 Shore-Based
Supervisory
Employees
Public Service Alliance of
Canada
Agreement renewed until
31 December 2013
63
N/A Management /
Non-Union
N/A N/A
72
Total 1,109

Corporate Plan 2013 – 2018 15
7.3 Long Term Labour Relations Strategy
MAI has developed a new Labour Relations Strategy in order to advance the contribution made by all
employees to the improved performance of the Corporation. The heart of the strategy is the introduction
of an employee engagement program intended to significantly raise the level of commitment to the success
of the business.
The key aspects of the engagement program are as follows:
Provide employees with a clear set of corporate values centering on safety, integrity, excellence,
teamwork and commitment with the understanding that the Corporation must align with these
values.
Provide employees with a high level of understanding of how the business operates so that there is a
clear appreciation of the importance of each individual’s contribution to the monthly performance
results.
Provide employees with details of financial commitments, targets and challenges with regular
monthly reports showing MAI’s performance.
Clarify roles, responsibilities and accountabilities for every job.
Provide leadership training and development for all employees responsible for the supervision of
people.
Work closely with union leaders to ensure they understand the challenges facing MAI, while still
providing their members with appropriate representation.
The employee engagement program will be introduced throughout 2013/14. It is understood that this is a
major undertaking and will likely take longer than one year to implement, but it is expected that the
Corporation will see very positive results moving forward.
The majority of the Corporation’s collective agreements expire at December 31, 2013. Notification to
bargain will be completed in the third quarter of 2013/14.
The collective bargaining process will commence with the vessel based agreements; shore agreements will
follow shortly thereafter. MAI will schedule negotiations in blocks to facilitate a timely renewal of
collective agreements. The plan is for the Corporation to commence the bargaining process with all
bargaining units by the end of this fiscal year.
7.4 Changes to the Pension Plan Budget 2013 announced that “The Government will continue to work with Crown Corporations with a
view to moving to a 50:50 cost sharing between the employer and employees by 2017 and aligning the age
at which retirement benefits become available with those announced in Economic Action Plan 2012 for
post-2012 hires under the Public Service Pension Plan.” Marine Atlantic, as a Crown Corporation, is
transitioning to align with these requirements.
Current Employees

Corporate Plan 2013 – 2018 16
o Starting January 1, 2014, employee contributions to the pension plan will be gradually
increased with the goal of attaining the 50:50 cost sharing between the employer and
employees in 2017. For current employees, there will be no change to pension benefits.
Employees Hired after January 1, 2014
o For all new hires on or after January 1, 2014, the pension plan will provide less generous
early retirement conditions. This change in benefits will be reflected in a slightly lower
contribution rate for new plan members.
8 Meet Cost Recovery Targets and Live Within Appropriation
Marine Atlantic’s shareholder has prescribed cost recovery targets over the planning period. Marine
Atlantic is committed to continuing to meet these targets through a combination of revenue management
and improved cost efficiency.
To meet its commitments for cost recovery the Corporation has set a number of priorities to achieve during
the planning period:
Employing management reporting results to improve decision making.
Implementation of its revenue strategy, including annual tariff reviews.
Business process renewal and efficiency initiatives to drive cost savings.
8.1 Financial Results 2012/13
Marine Atlantic had another successful year from a financial perspective, and achieved a cost recovery target
of approximately 67.1%, well ahead of expectations. The Corporation’s cost recovery percentage is
calculated by dividing total revenues into total costs (less charter fees, capital expenditures, program
management, implementation and restructuring and pension costs).
There are several key factors impacting 2012/13 results. Revenues are down 3.9% from budget, for a
negative variance of $4.4M, due to a decline in PRV traffic, and a slight decline in CRV traffic growth.
However, 2012/13 revenue results are $6.8M above 2011/12 actuals, a year over year increase of 7%.
The Corporation’s operational expenses are $0.7M lower than budgeted. Although the Corporation
experienced three unplanned maintenance events during 2012/13, its maintenance costs are still $0.3M
under budget as efficiencies continue to be achieved. Additionally there were significant savings due to the
timing and cost of transformation activities. Vessel fuel costs in 2012/13 are $1.1M lower than budgeted.
The price of fuel was 6% higher than forecasted; however, this was offset by lower overall fuel
consumption.
The company was successful in hedging against fluctuations in the global fuel market with the fuel hedging
program on track to yield gains of approximately $1.6M for 2012/13.
Amortization is $10.5M less than budgeted for 2012/13 as the actual in service date of work in progress
changed. The overall capital asset renewal activity is still progressing as planned.
Corporate Plan 2013 – 2018 17
Charter Importation taxes of $6.1M were recognized as an expense in 2012/13, but not included in the
budget. Under Public Sector Accounting Standards costs related to the importation of vessels that were
previously recognized as an intangible asset are reclassified as a prepaid expense and amortized over the
remaining terms of the vessel charter agreements. Therefore, an “intangible assets” balance as of March 31,
2011 totaling $13,832 was reclassified to “prepaid expenses” and will be amortized to “charter importation
taxes” on the statement of operations.
8.1.1 Capital Spend 2012/13
In 2012/13, the Corporation spent $51M on capital projects, which is $4.1M above its budget of $46.9M.
Due to the nature of the work associated with the capital plan, primarily the building of physical
infrastructure - which is inherent with unanticipated delays and involves engineering cost estimates that may
vary significantly from tendered bids - both budget overages, under-spending on individual projects, and
unanticipated project requirements are inevitable. This all contributes to the difficulty in forecasting
precise capital expenditures. The Corporation utilized operational savings to fund these emerging projects
and budget overages.
The $4.1M in budget variance is comprised of a number of factors; planned projects that exceeded budget
account for $4.7M in spending, while re-prioritization of projects and delayed spending equate to a net of
$0.6M in savings, for a variance of $4.1M in capital spending.
Increased costs for major shore-based projects resulted in additional expenditures of $1.6M, including
significant additional work for the electrical distribution project at the NSY Terminal Site, and due to the
growth of commercial traffic, expansion of both North Sydney and Port aux Basques marshaling yards.
Vessel-based projects accounted for approximately $3.1M in additional capital requirements, but were
necessary investments from an operational risk perspective. Base capital projects came in $0.6M under
budget.
Some of this work was identified in previous corporate plans, and some projects emerged as the year
progressed. However, the issue of overspending is primarily linked to the difficulty of precisely forecasting
a capital project’s cost before engineering estimates and project tenders are completed. In order to meet all
of the capital requirements in 2012/13, MAI delayed some project work, reduced the scope of other
projects, and overspent as noted on projects that were deemed necessary for the safe and continued
operations of the organization.
8.2 Financial Assumptions 2013/14 – 2017/18
The following sections outline the financial assumptions used as the basis for the projected financial
statements for the upcoming planning period.

Corporate Plan 2013 – 2018 18
8.2.1 Traffic Forecast
Demand figures for the Revitalization Strategy submission were based upon traffic projections2 previously
presented to Transport Canada. For this year’s Corporate Plan, these traffic projections have been adjusted
to reflect the change in traffic trends experienced during the last number of years.
8.2.2 Revenues
Marine Atlantic’s revenue forecasts take into consideration the following: rate increases, surcharges, and
traffic growth expectations as well as additional passenger service revenue.
For purposes of completing the financial projections, the Corporation modeled revenue projections based
on 4% tariff increases on all transportation services including drop trailer management fees for 2013/14.
This increase was implemented on April 1st, 2013.
Given the level of uncertainty associated with future traffic levels, the cost of fuel and the new fleet, the
Corporation will continue to review its fare requirements to ensure that it can operate within approved
appropriations while achieving its cost recovery targets. The full rate structure will be reviewed each year
during the preparation of the Corporate Plan, and appropriate adjustments made according to the factors
impacting the Corporation at that time.
8.2.3 Operating Expenses
Expense projections for the upcoming five year planning period take into consideration the operation of the
current fleet, comprised of the MV Blue Puttees, the MV Highlanders, the MV Leif Ericson, and the MV Atlantic
Vision and/or comparable replacement vessels.
8.2.4 Fuel Management
Fuel is, and will continue to be, a large portion of the Corporation’s operating budget, accounting for
upwards of 15 per cent of total operating expenses. With the new fleet that was brought into service early
in 2011/12, the Corporation was able to reduce its average fuel burn per trip.
The Corporation faces large uncertainties surrounding future fuel prices. For planning purposes, the
Corporation has calculated fuel prices using market information and analyzing New York Mercantile
Exchange future contract prices.
The Corporation intends to maintain its fuel hedging program, which is focused on minimizing the impacts
of price fluctuations, thereby stabilizing the company’s fuel budget.
To align with regulatory requirements on fuel emissions, the Corporation’s current plan anticipates the use
of marine gas oil (MGO) in the future. This change results in increased fuel costs as the corporation
switches from the less costly blended fuels to MGO.
2 Marine Atlantic Inc. Traffic Projection 00-001/000-010 RV.0

Corporate Plan 2013 – 2018 19
8.2.5 Capital Management
Budget 2010 provided the Corporation with $84M for shore-based equipment and infrastructure renewal.
The bulk of these funds have been directed toward critical infrastructure - docks, terminal buildings and
sites, and shore-based support equipment and machinery - to address the significant deficiencies in these
critical areas. As the Corporation has progressed through the implementation of its capital program,
challenges have arisen that have put significant pressure on its capital budget. Original estimates were very
high level, and based on the assumption that most assets could be repaired and upgraded, rather than
replaced. Construction costs in both Newfoundland and Labrador and Nova Scotia have increased
significantly over the planning period, and the aging shore-based assets were in a worse state of
deterioration than first thought, requiring significantly more effort to bring them up to an acceptable
standard. As well, the integration of the newer, larger vessels has driven capital requirements that were
unforeseen at the time of the original budgeting exercise. All of these challenges have driven costs
significantly higher than originally anticipated when the funding requests were prepared going into Budget
2010. As a result, in 2012/13 the Corporation requested that $7.4M of funding be re-profiled to meet
ongoing capital requirements.
The upcoming planning period will see the completion of major dock upgrades in Argentia, Port aux
Basques, and North Sydney, as well as the construction of a new terminal building in North Sydney and
major upgrades to the Port aux Basques terminal building. Detailed estimates for the construction of the
new terminal building in North Sydney have indicated that the current budget is not sufficient to cover the
total project costs. To address the budget shortfall, the Corporation is requesting approval to move $4.0M
in operating expense to supplement its capital budget in 2013-14. This reallocation of funding will allow
the Corporation to supplement the funding available for the terminal building, while still meeting its savings
commitments. Investments in information technology (IT) are also required in the upcoming planning
period as catalysts for business process improvements.
The Corporation has set the following objectives in relation to its capital planning efforts:
Ensure funds are used to the best long term advantage of the Corporation
Manage the capital program in an effective manner
Follow the newly implemented capital management process that recognizes the fluid nature of the
Corporation’s requirements
Utilize operating funding savings for necessary capital projects if and when possible.
8.2.6 Inflation Rates
Canada's inflation policy, as set out by the Federal Government and the Bank of Canada, aims to keep
inflation at two per cent, the midpoint of the one to three per cent inflation-control target range. For the
purposes of this Corporate Plan, MAI has used a more conservative estimate and is assuming a three per
cent general inflation rate annually over the planning period.

Corporate Plan 2013 – 2018 20
8.2.7 Foreign Exchange
The Corporation implemented a foreign exchange hedging strategy to proactively mitigate exposure to
foreign currency. The Corporation negotiated with Stena RoRo to pay in Canadian currency for the charter
of two of their vessels in the initial five year charter period.
The Corporation also secured forward contracts with a financial institution for the Euro currency
requirements over the remaining charter period of the vessels. Marine Atlantic hedges its exposure to this
foreign currency obligation by utilizing forward contracts to ascertain the Canadian dollar equivalent to
these monthly charter payments.
Marine Atlantic’s hedging strategy has been successful in bringing stability and cost certainty to the charter
obligations for the duration of the charter agreements.
8.2.8 Savings Commitments
Marine Atlantic has made significant savings commitments arising out of both the Strategic Review and the
savings commitments identified in Budget 2012 as outlined in the table below. The Corporation is on track
and committed to delivering on these savings commitments.
Table 3 - Savings Commitments
Year Strategic Review
(in millions)
Budget 2012
Savings
Commitments
(in millions)
Total
2012/13 $ 1.22 $ 0.50 $ 1.72
2013/14 $ 5.40 $ 2.20 $ 7.60
2014/15 & onward $ 5.40 $ 10.90 $ 16.30
8.3 Business Process Efficiencies
In order to achieve ongoing cost efficiencies and to develop a sustainable business model, the organization
must now focus on how it runs its business – driving cost efficiencies through improved business processes
and management of those processes. The following sections highlight two of the key priorities that will be
focused on during the upcoming planning period.
8.3.1 Procurement
Sustained efforts will be made over the planning period toward the development of a continuous
improvement philosophy within procurement.
To that end, recommendations of various audits continue to be implemented:
Monitoring the new procurement policy to assess performance and adjusting procedures as
required to increase value for money.
Corporate Plan 2013 – 2018 21
Continuing to build relationships with internal and external customers – enhancing the process of
contracted rates and the vendor assessment approach.
Improving the contracts management approach.
Enhancing the communication requirements.
Continuing procurement policy compliance reviews.
Improving procurement activity monitoring and performance objectives.
Identifying employee development and training opportunities to enhance performance.
Improving internal procurement communications.
Identifying and continuing the establishment of more efficient procurement techniques including
purchase order consolidation, vendor consolidation, standing offers, and procurement cards.
8.3.2 Information Technology Management
MAI’s Information Technology strategy is a key component of the organization’s plans for business
transformation. MAI’s IT strategy is holistic in nature, going far beyond the mere acquisition of
technology, and focusing more on how Information Technology can enable and sustain business
transformation. Investments in Information Technology are vital to enabling the modernization of the other
functional areas of the organization, and are the key to realizing sustainable business improvements. MAI’s
IT strategy will enable the corporation to harvest the value that is yet unexplored in its current systems, and
allow MAI to move forward with achieving the desired operational efficiencies highlighted as necessary for
the long term success of the corporation. Three key strategic objectives of MAI’s Information Technology
strategy are as follows:
1. Realize value and efficiencies from legacy IT investments.
Assess the core IT solutions currently utilized by the organization in areas such as Human
Resources, Finance, Reservations and Information Management and establish a roadmap for
how MAI can best utilize the functionality in these existing systems to become more efficient.
Prioritize the opportunities to allow focus on those activities that are identified as low-risk yet high-value to the organization.
Align the use of core solutions with industry best practices by limiting system customization
and focus instead on optimizing and adjusting existing business processes.
Leverage relationships with MAI’s technology partners to gain insight into industry trends and
opportunities that may realize value within the organization.
2. Enable effective collaboration and integration.
Seek opportunities to utilize mobile business solutions to increase the accessibility of
information with a goal to empowering the mobile worker.
Assess the organization’s “Ship-Shore” communications infrastructure to ensure that the
solution deployed supports the business objectives of the organization.

Corporate Plan 2013 – 2018 22
3. Proactively identify corporate opportunities for innovation and efficiency.
Use a business first approach that will drive innovative solutions through a detailed
understanding of MAI business processes.
Work with the Corporation’s strategic partners to better understand industry trends and
opportunities to become a more effective organization.
Of specific interest from a strategic IT perspective in the upcoming year is driving improvements to both
the inventory management and operational maintenance programs. Both of these areas have been
highlighted as key to MAI’s ongoing success, and will help drive efficiencies in both procurement and
operations.
8.4 External Impacts
8.4.1 Bar Harbor
Marine Atlantic owns a terminal facility located in Bar Harbor, Maine that is surplus to its needs and outside
of its current mandate. The Corporation received approval to dispose of this facility in the 2011/12
Corporate Plan. The Corporation does not anticipate selling the property until the 2014-15 fiscal year.
9 Specific Approvals Sought MAI seeks Governor in-Council approval of MAI’s 2013 – 2018 Corporate Plan, Treasury Board approval
of the operating and capital plans contained herein (See Section 10 – Financial Statements), and approval for
the continuation of a line of credit as described in section 9.1 below.
9.1 Bank Line of Credit Marine Atlantic's bank line of credit is currently approved at $35,622,000. The Corporation utilizes
$31,422,000 to secure letters of credit related to the Corporation’s defined benefit pension plan. This is in
accordance with Section 9.11 of the Pension Benefits Standards Act, 1985 (the “Act”) and is utilized to replace
solvency special payments. These letters of credit must be maintained and can only be reduced if equivalent
additional contributions are made to the Plan. These letters of credit could also be reduced without
additional contributions if a future actuarial valuation shows a solvency ratio and an average solvency ratio
that meet certain criteria defined in the Act.
The remaining $4,200,000 is utilized as security against long-term liabilities arising from Marine Atlantic
employees’ past injury claims and this Corporation’s status as a “deposit account company” with the New
Brunswick Workers’ Compensation Board.
The Corporation is currently seeking approval for a line of credit sufficient to handle the $35,622,000
requirements for the pension plan and the Workers’ Compensation Board requirement. In addition, upon

Corporate Plan 2013 – 2018 23
completion of the 2012 pension plan fiscal year actuarial valuation in June of 2013, if the solvency position
of the pension plan deteriorates, the Corporation could potentially seek further capacity on the line of
credit.
10 Financial Statements Statements A through E present financial projections over the planning period, based on the operational
plans, forecasts and assumptions discussed in previous sections of this Corporate Plan and are presented
based on Public Sector Accounting Standards.

Corporate Plan 2013 – 2018 24
10.1 Statement A: Statement of Financial Position
Marine Atlantic Inc. Statement of Financial Position - Year Ended March 31st
As at March 31, 2012; March 31, 2013; and Projected for 2013/14 to 2017/18
Actual Actual Budget
(In $ Thousands) 2011/12 2012/13 2013/14 2014/15 2015/16 2016/17 2017/18
Financial assets Cash 8,353 12,087 12,679 9,208 (365,085) (479,406) (608,466) Accounts receivable 9,971 12,248 9,748 9,748 9,748 9,748 9,748 Receivable from Government of Canada 1,222 - - - - - - Inventories for resale 291 302 302 302 302 302 302 Derivative financial instruments 3,147 641 641 641 641 641 641 Accrued pension asset 60,080 73,151 86,233 99,299 116,299 133,299 150,299
83,064 98,429 109,603 119,198 (238,095) (335,416) (447,477)
Liabilities Accounts payable and accrued liabilities 30,565 28,039 27,039 27,039 27,039 27,039 27,039 Derivative financial instruments 1,015 781 781 781 781 781 781 Deferred revenue 2,556 2,202 2,202 2,202 2,202 2,202 2,202 Payable to Government of Canada - 2,687 2,687 2,687 2,687 2,687 2,687 Accrued liabilities
Note 1 54,951 59,534 59,534 59,534 59,534 59,534 59,534
89,087 90,556 89,556 89,556 89,556 89,556 89,556
Net financial assets (debt) (6,023) 7,873 20,047 29,642 (327,651) (424,972) (537,033)
Non-financial assets Note 2
233,428 253,519 257,117 240,633 446,807 439,702 439,109
Accumulated surplus (deficit) 227,405 261,392 277,164 270,275 119,156 14,730 (97,924)
The accompanying notes are an integral part of these financial statements

Corporate Plan 2013 – 2018 25
Notes to Statement A – Statement of Financial Position 1. Accrued liabilities consist of: accrued vacation pay; accrued pension liability; accrued liability for other non-pension post-retirement benefits; and accrued liability for post-employment benefits. 2. Non-financial assets consist of: prepaid expenses; inventories held for consumption; and vessel, facilities, and equipment.
3. Numbers may not add due to rounding.

Corporate Plan 2013 – 2018 26
10.2 Statement B: Statement of Operations and Accumulated Surplus
Marine Atlantic Inc. Statement Operations and Accumulated Surplus
For the Year Ended March 31, 2012; March 31, 2013; and Projected for 2013/14 to 2017/18
Actual Budget Actual Budget
(In $ Thousands) 2011/12 2012/13 2012/13 2013/14 2014/15 2015/16 2016/17 2017/18
Total Revenues 100,440 111,641 107,273 108,069 113,150 123,546 128,782 133,846
Expenditures
Wages and benefits 85,021 83,996 84,032 83,029 85,929 89,775 91,376 95,512
Fuel 33,051 35,389 34,252 30,435 32,913 42,025 45,705 47,815
Charter fees 44,256 44,290 43,202 43,654 42,397 37,531 17,033 17,033
Charter importation taxes 5,306 - 6,121 5,034 2,861 2,386 - -
Repairs and maintenance 13,187 16,068 15,731 13,409 11,395 15,173 15,482 16,478
Materials, supplies and services 17,538 20,730 17,398 16,062 17,209 18,385 18,422 18,678
Insurance, rent and utilities 6,066 6,807 6,267 7,059 6,966 7,234 7,248 7,911
Fleet renewal costs 1,201 - - - - 28,338 - 1,719
Other 10,906 12,699 4,217 10,504 6,034 9,227 9,578 9,898
Employee future benefits Note 1
16,022 12,311 19,387 11,732 12,065 12,027 11,404 11,231
Decommissioning of vessels 2,371 - - - - - - -
Foreign currency exchange (gain) loss (48) - (224) - - - - -
Realized (gain) loss on derivative financial instruments (2,703) - (512) - - - - -
(Gain) Loss on disposal of tangible capital assets (21) - 4,085 - - - - -
(Gain) on disposal of assets held for sale (736) - - - - - - -
Amortization 20,165 35,288 24,797 26,400 29,753 31,948 36,344 39,610
Total Expenditures 251,582 267,578 258,753 247,319 247,523 294,048 252,591 265,884
(Deficit) before government funding (151,142) (155,937) (151,480) (139,250) (134,373) (170,503) (123,810) (132,039)

Corporate Plan 2013 – 2018 27
Marine Atlantic Inc. Statement Operations and Accumulated Surplus
For the Year Ended March 31, 2012; March 31, 2013; and Projected for 2013/14 to 2017/18
Actual Budget Actual Budget
(In $ Thousands) 2011/12 2012/13 2012/13 2013/14 2014/15 2015/16 2016/17 2017/18
Government funding
Operations 135,060 134,726 136,881 119,398 111,354 14,384 14,384 14,384
Capital 36,698 46,900 51,003 35,032 16,130 5,000 5,000 5,000
Recovery of vessel decommissioning costs 2,371 - - - - - - -
Total Government funding 174,129 181,626 187,884 154,430 127,484 19,384 19,384 19,384
Surplus (deficit) 22,987 25,689 36,404 15,180 (6,889) (151,119) (104,426) (112,655) Accumulated surplus (deficit), beginning of year 206,300 219,710 229,287 265,691 280,871 273,982 122,863 18,438
Accumulated surplus, end of year 229,287 245,399 265,691 280,871 273,982 122,863 18,438 (94,217)
Notes to Statement B – Statement of Operations and Accumulated Surplus:
1. Employee future benefits expenses for 2011/12 and 2012/13 are based on actuarially determined numbers. For 2013/14 and future years, expense is assumed to equal cash requirements for non-pension employee future benefits and current service pension cost payments. 2. Numbers may not add due to rounding.
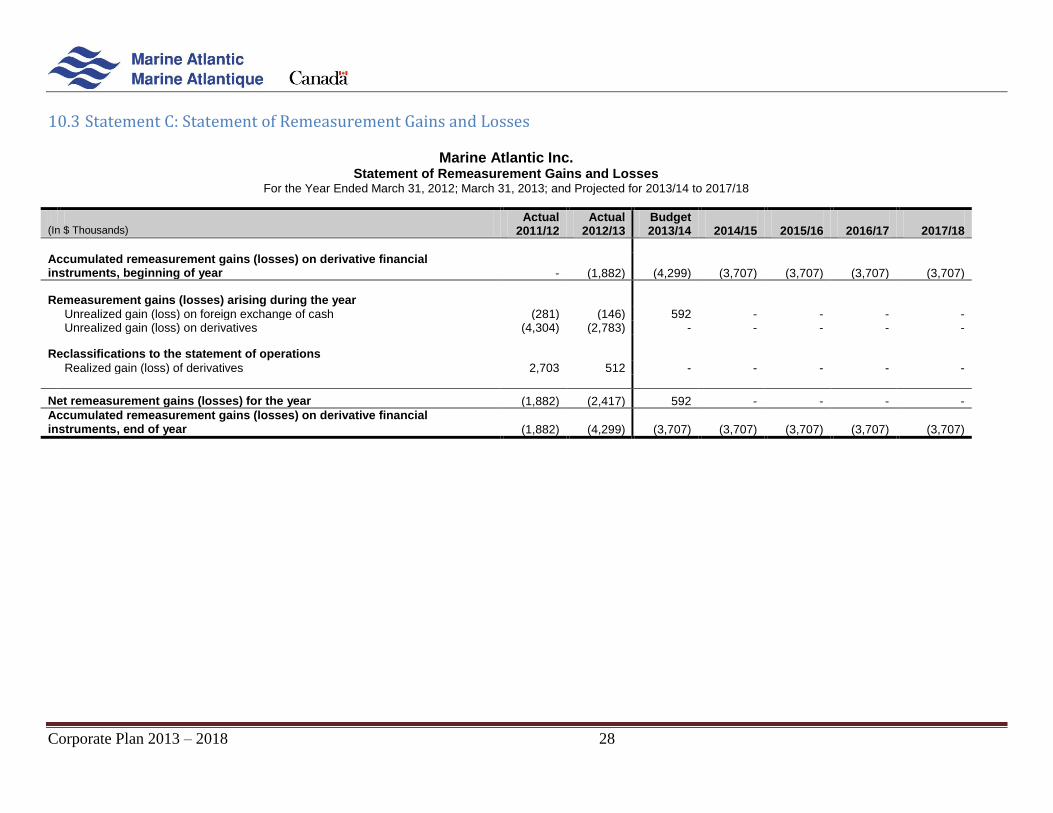
Corporate Plan 2013 – 2018 28
10.3 Statement C: Statement of Remeasurement Gains and Losses
Marine Atlantic Inc. Statement of Remeasurement Gains and Losses
For the Year Ended March 31, 2012; March 31, 2013; and Projected for 2013/14 to 2017/18
Actual Actual Budget (In $ Thousands) 2011/12 2012/13 2013/14 2014/15 2015/16 2016/17 2017/18
Accumulated remeasurement gains (losses) on derivative financial instruments, beginning of year - (1,882) (4,299) (3,707) (3,707) (3,707) (3,707)
Remeasurement gains (losses) arising during the year Unrealized gain (loss) on foreign exchange of cash (281) (146) 592 - - - - Unrealized gain (loss) on derivatives (4,304) (2,783) - - - - -
Reclassifications to the statement of operations Realized gain (loss) of derivatives 2,703 512 - - - - -
Net remeasurement gains (losses) for the year (1,882) (2,417) 592 - - - -
Accumulated remeasurement gains (losses) on derivative financial instruments, end of year (1,882) (4,299) (3,707) (3,707) (3,707) (3,707) (3,707)

Corporate Plan 2013 – 2018 29
10.4 Statement D: Statement of Changes in Net Financial Assets (Debt)
Marine Atlantic Inc. Statement of Change in Net Financial Assets (Debt)
For the Year Ended March 31, 2012; March 31, 2013; and Projected for 2013/14 to 2017/18
Actual Actual Budget (In $ Thousands) 2011/12 2012/13 2013/14 2014/15 2015/16 2016/17 2017/18
Surplus (deficit) 22,987 36,404 15,180 (6,889) (151,119) (104,426) (112,655)
Change in tangible capital assets Acquisition of tangible capital assets (36,698) (51,003) (35,032) (16,130) (240,508) (29,239) (39,016) Amortization of tangible capital assets 20,165 24,797 26,400 29,753 31,948 36,344 39,610 Gain (Loss) on disposal of tangible capital assets (21) 4,085 - - - - - Proceeds on disposal of tangible capital assets 25 62 - - - - -
Decrease (increase) in tangible capital assets (16,529) (22,059) (8,632) 13,623 (208,560) 7,105 594
Change in other non-financial assets Net change in inventories held for consumption (6,306) (4,124) - - - - - Net change in prepaid expenses (2,283) 6,092 5,034 2,861 2,386 - -
Decrease (increase) in other non-financial assets (8,589) 1,968 5,034 2,861 2,386 - -
Remeasurement (losses) gains (1,882) (2,417) 592 - - - -
Decrease (increase) in net debt (4,013) 13,896 12,174 9,595 (357,293) (97,321) (112,061) Net financial assets (debt), beginning of year (2,010) (6,023) 7,873 20,047 29,642 (327,651) (424,972)
Net financial assets (debt), end of year (6,023) 7,873 20,047 29,642 (327,651) (424,972) (537,033)

Corporate Plan 2013 – 2018 30
10.5 Statement E: Statement of Cash Flows Marine Atlantic Inc.
Statement of Cash Flows For the Year Ended March 31, 2012; March 31, 2013; and Projected for 2013/14 to 2017/18
(In $ Thousands)
Actual
2011/12
Actual
2012/13
Budget
2013/14
2014/15
2015/16
2016/17
2017/18
Operating transactions
Cash receipts from customers 100,285 107,072 107,971 113,090 123,486 128,722 133,786
Other income received 255 453 98 60 60 60 60
Government funding – operations (current year) 141,104 129,802 119,398 111,354 14,384 14,384 14,384
Government funding – operations (prior year) - 3,104 - - - - -
Government funding – capital (current year) 27,417 47,687 35,032 16,130 5,000 5,000 5,000
Government funding – capital (prior year PAYE) 10,231 11,199 - - - - -
Proceeds from assets held for sale 7,938 - - - - - -
Cash paid to suppliers and employees (225,832) (206,135) (202,653) (202,843) (247,688) (204,843) (215,044)
Cash paid for EFBs Note 1
(24,717) (30,450) (24,814) (25,131) (29,027) (28,404) (28,231)
Interest and foreign exchange on cash (285) (174) 592 - - - -
36,396 62,558 35,624 12,659 (133,785) (85,082) (90,045)
Capital transactions Note 2
Capital asset purchases from current year funding (27,417) (47,687) (35,032) (16,130) (240,508) (29,239) (39,016)
Capital asset purchases from prior year funding Note 3
(10,231) (11,199) - - - - -
Proceeds on disposal of tangible capital assets 25 62 - - - - -
(37,623) (58,824) (35,032) (16,130) (240,508) (29,239) (39,016)
Net (decrease) increase in cash (1,227) 3,734 592 (3,471) (374,293) (114,321) (129,061)
Cash, beginning of year 9,580 8,353 12,087 12,679 9,208 (365,085) (479,406)
Cash, end of year 8,353 12,087 12,679 9,208 (365,085) (479,406) (608,466)

Corporate Plan 2013 – 2018 31
Notes to Statement E– Statement of Cash Flows:
1. Cash paid for EFBs (Employee Future Benefits) includes cash paid for pension, worker’s compensation and other non-pension employee future benefits.
2. Capital assets are also referred to as tangible capital assets elsewhere throughout these statements. It was shortened to capital assets on this statement simply for presentation purposes.
3. Capital asset purchases from prior year funding represents cash outlays for capital goods and services received in the prior fiscal year and paid in the current
fiscal year. A payable at year end (PAYE) was established to fund these purchases out of prior year funding.
4. Numbers may not add due to rounding.

Corporate Plan 2013 – 2018 32
Appendix A: Organizational Structure