marine resources
TRANSCRIPT
Marine Resources There are five large marine regions of the UnitedStates: Northeast, Southeast, Alaska, Pacific coast,and western Pacific oceanic (Fig. 1). The widegeographical spread of the United States covers abroad range of physical and oceanographicconditions, from warm tropical to freezing Arcticand coastal to oceanic environments that support awide variety of marine resources and associatedwildlife. The commercial use of these resourcesprovides 5% of the world's fisheries production,making the United States the fifth largest producerof seafood in the world. The resources also havegreat recreational and aesthetic value.
The stewardship of the nation's living marineresources is largely entrusted to the NationalOceanic and Atmospheric Administration. Theagency's strategic plan assigns responsibility forresearch and conservation of the ocean's livingmarine resources to the National Marine FisheriesService, with the Secretary of Commerce havingthe final authority for managing these resources.
The National Marine Fisheries Service carries outits charge under many laws and mandates from theU.S. Congress. Most of its responsibilities arisefrom six statutes: the Magnuson-Stevens Fishery Conservation and Management Act, whichregulates fisheries within the U.S. Exclusive
Page 1 of 186Marine Resources
1/26/2007http://biology.usgs.gov/s+t/SNT/noframe/mr181.htm

Economic Zone; the Endangered Species Act,which protects threatened or endangered species;the Marine Mammal Protection Act, whichregulates the taking or harassment of marinemammals; the Lacey Act, which prohibits fisherytransactions that violate state, federal, Americantribal, or foreign laws; the Fish and WildlifeCoordination Act, which authorizes the NationalMarine Fisheries Service to collect fisheries dataand to advise other agencies on environmentaldecisions affecting living marine resources; and theAgricultural Marketing Act, which authorizes avoluntary seafood inspection program. Numerousother statutes and international conventions andtreaties also guide federal management of livingmarine resources.
Courtesy B. Mundy, National Marine Fisheries Service
Northeast Region Environment and Physical Features The Northeast marine region encompasses 260,000square kilometers of the Northeast shelf ecosystem,which includes four major areas: the Gulf of Maine,Georges Bank, southern New England, and theMiddle Atlantic Bight (Fig. 2). These separate areasare distinguished largely by bottom topography,productivity, food web dynamics, and water masscharacteristics (Sherman et al. 1988).
The Gulf of Maine is a semi-enclosed continental shelf sea area bounded landward by thenortheastern United States, including waters west of66°W longitude between Georges Bank and theentrance to the Bay of Fundy. The gulf is stronglyinfluenced by freshwater inflow. Maine rivers--principally the Androscoggin, Penobscot,Merrimack, and Kennebec--flow into the gulf, forming a plume of relatively brackish stratifiedwater in the western gulf during spring. These localrivers contribute significantly to the upper 40meters of the water column and, along with the
Page 2 of 186Marine Resources
1/26/2007http://biology.usgs.gov/s+t/SNT/noframe/mr181.htm

outflow of the Bay of Fundy (the St. John River),maintain the counterclockwise circulation of thegulf, which seems strongest in spring (Fig. 2). Themost significant inputs of fresh water originatefrom the Gulf of St. Lawrence.
The Gulf of Maine includes more than 59,570 square kilometers of estuarine drainage areas. Estuaries in this region were formed by glaciers that removed soil cover, leaving behind rocky shorelines and steep-sided river channels. These estuaries are smaller on average and generally deeper than those found in other regions. The strong tides and basin geometry in these estuaries result in tidally dominated circulation patterns. Three large human population centers (Boston, Massachusetts; Manchester, New Hampshire; and Portland, Maine) are located in the Gulf of Maine estuarine drainage area.
Fig. 1. Geographical coverage of the five major marine regions of the United States, colored to indicate their boundaries within their 200-mile Exclusive Economic Zones.
Georges Bank is generallydelineated from thesurrounding deeper Gulf ofMaine by the area of equaldepth (bathymetriccontour) of 100 meters.
Page 3 of 186Marine Resources
1/26/2007http://biology.usgs.gov/s+t/SNT/noframe/mr181.htm
Along the northern flank,sharp depth gradientsbetween the Gulf of Maineand Georges Bank definethe bank and generateequally sharp hydrographicand biological fronts.Changes in bottom depthsand hydrographicconditions are moregradual along the easternand southern areas of thebank. To the southwest,Georges Bank is boundedby the Great SouthChannel, which separatesGeorges Bank fromNantucket Shoals. Theshallowest waters arefound on the northwesternpart of the bank. Daily andtwice-daily tides, interacting with theshallow bottomtopography of the bank,maintain exceptionallystrong currents that resultin a vertically well-mixed water column within the60-meter isobaththroughout the year(Butman 1987; Twichell et al. 1987). This vertical mixing exerts a majorinfluence on the abundanceand richness of biologicalpopulations on the bank.
Fig. 2. General surface circulation and major areas of the Atlantic and gulf coasts.
The southern New England and Middle Atlantic Bight areas include the shelf area between Cape Hatteras, North Carolina, and the Great South Channel off Cape Cod. The shelves in these areas slope gently offshore and are relatively shallow. Much of the bight from Long Island
Page 4 of 186Marine Resources
1/26/2007http://biology.usgs.gov/s+t/SNT/noframe/mr181.htm

southward is less than 60 meters deep. Waters in southern New England, with respect to productivity and plankton, represent a transition between the more oceanic characteristics of the Georges Bank area and the dominant estuarine influences on the Middle Atlantic Bight. The water column of the Middle Atlantic Bight is well mixed during winter and strongly stratified during summer, with the exception of shallow coastal areas, which experience episodes of vertical mixing from storms, upwelling, and downwelling.
Fresh water enters theMiddle Atlantic Bightprincipally at the mouth ofthe Hudson-Raritan, Delaware, and Chesapeakebays. Such local sources offresh water are responsiblefor approximately 70% ofthe large year-to-year variation in salinity in theMiddle Atlantic Bight andstrongly influencehydrographic conditions(Manning 1991). The general circulation in theMiddle Atlantic Bight ischaracterized by a net flowof shelf water fromGeorges Bank through thebight in a southwesterlydirection toward CapeHatteras. At the shelfbreak, a persistenthydrographic frontseparates the shelf fromoffshore slope waters. Thisfront undergoes seasonalonshore-offshore movements. Though thefront is coherent fromGeorges Bank to CapeHatteras, warm core rings
Fig. 3. a) General surface layer circulation of coastal and offshore surface waters of the Northeast region. b) Color-enhanced satellite image of relative productivity of the Northeast coast and offshore waters based on imagery from Nimbus 7 Coastal Zone Color Scanner. The yellow, red, and brown pigments represent chlorophyll levels, and blue depicts low-productivity Gulf Stream waters and the warm core ring. a.
Page 5 of 186Marine Resources
1/26/2007http://biology.usgs.gov/s+t/SNT/noframe/mr181.htm

drifting southwest betweenthe northern edge of theGulf Stream current andthe continental shelf break,in addition to intrusions ofGulf Stream water alongthe southern portion of theMiddle Atlantic Bight,may entrain and displacesignificant amounts ofshelf water and organisms(Fig. 3).
The combined area of thesouthern New England-Middle Atlantic Bightaccounts for more than124,320 square kilometersof estuarine drainage,extending from BuzzardsBay in Massachusettsthrough Chesapeake Bayin Virginia. ChesapeakeBay has the largest totaldrainage area in the regionand is one of the largestestuaries in the world.Almost half of all freshwater entering estuaries inthe Northeast region flowsinto Chesapeake Bay (seechapter on Northeast). Themid-Atlantic coast ranksthird, behind the Gulf ofMexico and South Atlanticregions, in total wetlandarea contained in estuarinedrainages (NationalOceanic and AtmosphericAdministration 1991a),with forested wetlandsbeing the most commonwetland type. The major
b. Courtesy National Oceanic and Atmospheric Administration
Page 6 of 186Marine Resources
1/26/2007http://biology.usgs.gov/s+t/SNT/noframe/mr181.htm

human population centersin the region--New York, Philadelphia, Baltimore,and Washington, D.C.--make this area the mostdensely populated coastalregion in the nation. Urbanland use still lags behindforest and agricultural landuses in the region'sestuarine drainages;however, compared withother geographical regions,mid-Atlantic estua-rine drainages include thegreatest percentage ofurban land (NationalOceanic and AtmosphericAdministration 1990a).
Primary Production
Primary production isrelatively high throughoutthe Northeast shelfecosystem and isexceptional on GeorgesBank and in the nearshorewaters of the southernNew England-Middle Atlantic Bight, where thephytoplankton, influencedby nutrient-enriched estuarine plumes, producethree times the meanproductivity of the world'scontinental shelves(O'Reilly et al. 1987; Fig. 4). Generally,phytoplankton abundancedecreases from nearshoreto the shelf break (Fig. 5).The highest concentrations
Fig. 4. Mean annual primary productivity (grams of organic carbon per square meter per year) of the coastal and offshore waters of the Northeast shelf ecosystem.
Page 7 of 186Marine Resources
1/26/2007http://biology.usgs.gov/s+t/SNT/noframe/mr181.htm

of phytoplankton areusually observed near themouths of the Hudson-Raritan, Delaware, andChesapeake bays, over theshallow water on GeorgesBank, and in a small areaalong the southeast edge ofNantucket Shoals. Lowestabundances are usuallyrestricted to the mostseaward stations sampledalong the shelf break andthe central deep waters inthe Gulf of Maine. Whenrelatively high primaryproduction occurs in theGulf of Maine, it is in theinshore western portion.
The annual cycle ofphytoplankton biomassfollows the patternexpected for temperatecontinental shelfecosystems, where there isat least a two-fold seasonal variation. The greatestphytoplankton concentrations and largeststanding stocks occurduring the winter-spring bloom; the lowest biomassis during summer, whenvertical densitystratification is greatest.
Fig. 5. a) Distribution of Chlorophyll a showing primary productivity, and b) distribution of netplankton representing larger phytoplankton (percentage of chlorophyll sample retained in a 20-micron sampling mesh) in the Northeast region, 19771988.
The winter-spring bloom is a major biological event,but its timing, duration,and intensity varysignificantly by area. In thesouthern New England-Middle Atlantic Bight, the
Page 8 of 186Marine Resources
1/26/2007http://biology.usgs.gov/s+t/SNT/noframe/mr181.htm
bloom progresses fromnearshore to the slope,occurring January throughMarch in the nearshore andmidshelf and during Marchin offshore shelf and slopewaters. On Georges Bank,the winter-spring bloom peaks in shallow waterduring March and alongthe southern flank of thebank during April. Thewinter-spring blooms appear in February throughMarch in the nearshorewestern Gulf of Maine andduring April throughoutthe deeper waters of thegulf.
In most regions of the ecosystem, a secondary phytoplankton bloom is evident in the fall. As with the winter-spring bloom, the timing and intensity of the fall bloom vary regionally. In the shallow nearshore Middle Atlantic Bight, fall blooms appear in September through October. In the midshelf and outer-shelf regions and along the Middle Atlantic Bight shelf break, the bloom occurs a month later, in October, and follows the expected delay in destratification of deeper water. In the shallow water on Georges Bank, fall bloom starts in September and continues through November. In the deeper water, blooms appear during October. In some areas of the Gulf of Maine, the fall bloom approaches the magnitude of the winter-spring bloom, but Georges Bank, southern New England, and Middle Atlantic Bight fall blooms are clearly subordinate in magnitude to winter-spring blooms.
There are distinct patterns in the seasonal, regional, and vertical variation in plankton abundance which seem to reflect significant spatial diversity in species composition. Netplankton (larger than 25 microns) tends to dominate nearshore areas of the southern New England-Middle Atlantic Bight and the shallow water on
Page 9 of 186Marine Resources
1/26/2007http://biology.usgs.gov/s+t/SNT/noframe/mr181.htm
Georges Bank, where chlorophyll concentrations are usually high. Nannoplankton (smaller than 25 microns) dominates deeper waters at the shelf break, as well as deep water in the Gulf of Maine, where chlorophyll levels are usually low (Fig. 3).
Findings support the relatively new idea (Malone et al. 1983) that netplankton prevails during the unstratified period when turbulence, vertical mixing, and nutrient levels are high and light for photosynthesis in the upper mixed layer is variable. Smaller nannoplankton and motile species prevail during density stratification, when turbulence is low and average light for photosynthesis is high in the upper mixed layer.
Planktonic Secondary Production
Secondary productionpatterns of the Northeastshelf ecosystem aredistinguishable in fourgeographic areascharacterized bydistinctive water depth,hydrography, food chainrelationships, seasonalspecies succession, andpulses of zooplanktonabundance. On GeorgesBank, the annual peak is inspring, followed by a sharpdecline from springthrough summer. In theGulf of Maine, the annualpeak of zooplanktonabundance occurs in Mayand declines lessprecipitously in autumnthan on Georges Bank. Insouthern New England,zooplankton abundance isbimodal, with an initialpeak in May and asecondary peak in August.
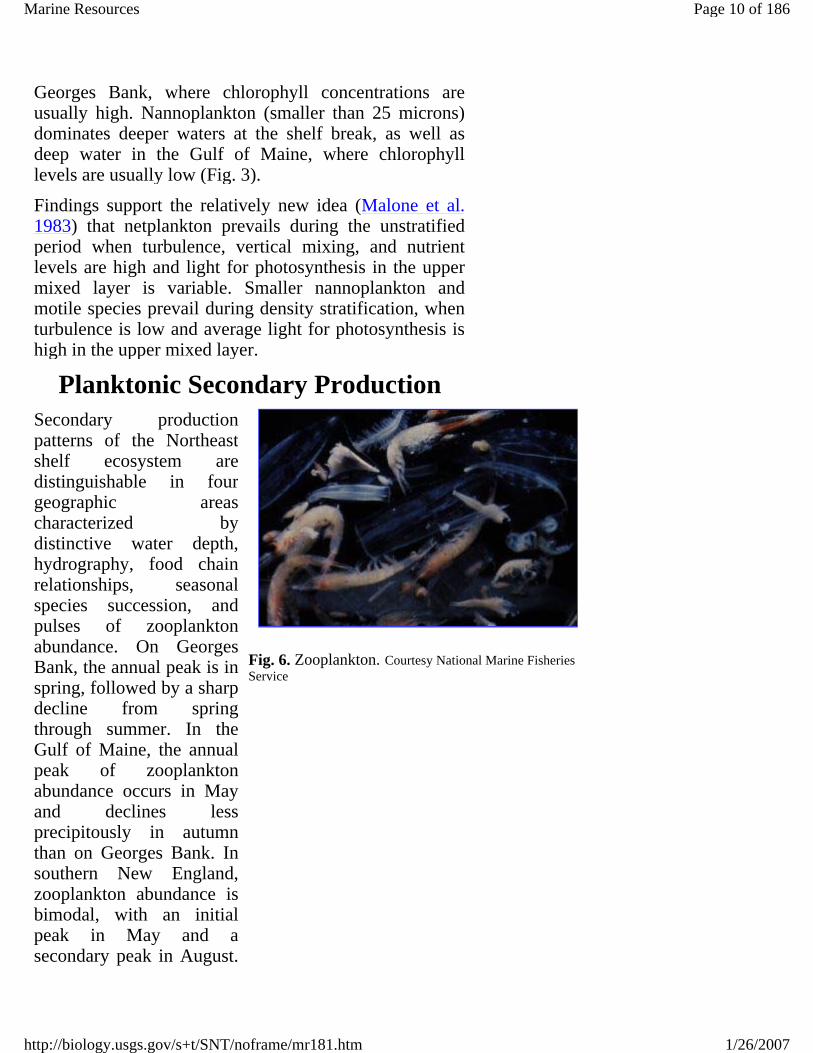
Fig. 6. Zooplankton. Courtesy National Marine Fisheries Service
Page 10 of 186Marine Resources
1/26/2007http://biology.usgs.gov/s+t/SNT/noframe/mr181.htm
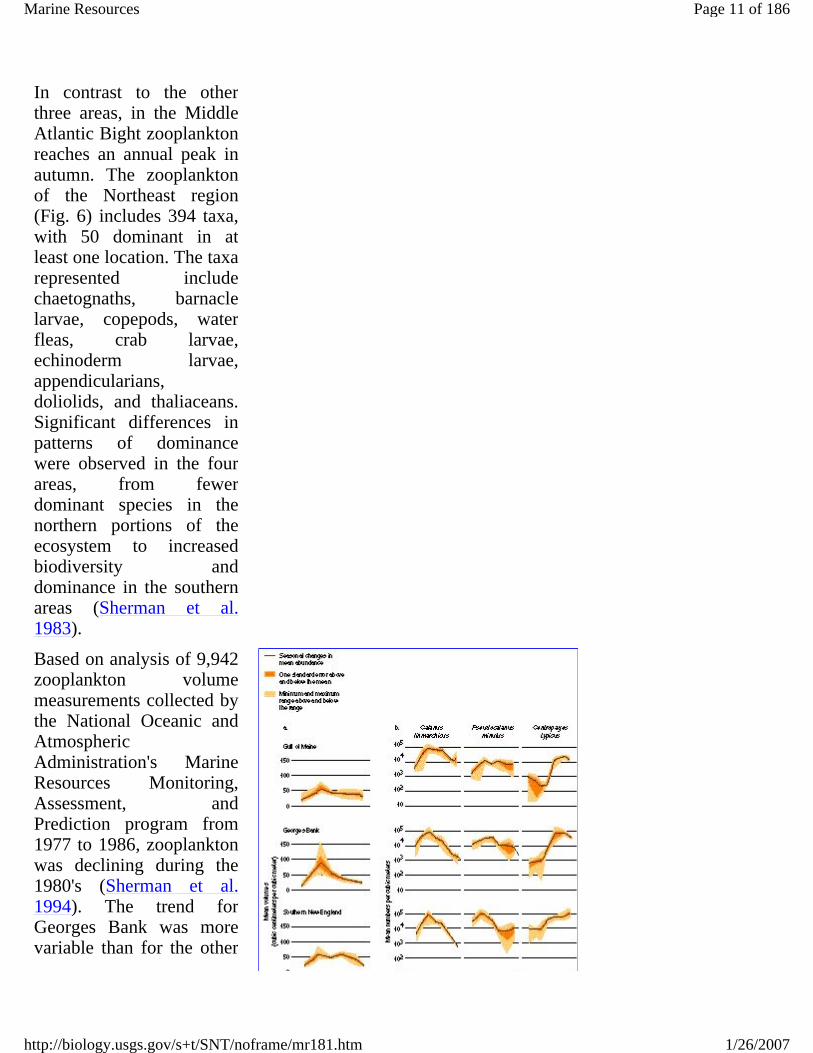
In contrast to the otherthree areas, in the MiddleAtlantic Bight zooplanktonreaches an annual peak inautumn. The zooplanktonof the Northeast region(Fig. 6) includes 394 taxa,with 50 dominant in atleast one location. The taxarepresented includechaetognaths, barnaclelarvae, copepods, waterfleas, crab larvae,echinoderm larvae,appendicularians, doliolids, and thaliaceans.Significant differences inpatterns of dominancewere observed in the fourareas, from fewerdominant species in thenorthern portions of theecosystem to increasedbiodiversity anddominance in the southernareas (Sherman et al. 1983).
Based on analysis of 9,942zooplankton volumemeasurements collected bythe National Oceanic andAtmospheric Administration's MarineResources Monitoring,Assessment, andPrediction program from1977 to 1986, zooplanktonwas declining during the1980's (Sherman et al. 1994). The trend forGeorges Bank was morevariable than for the other
Page 11 of 186Marine Resources
1/26/2007http://biology.usgs.gov/s+t/SNT/noframe/mr181.htm

three areas. The persistentdownward trend inzooplankton abundancecoincided with the increasein abundance of principalopen-ocean fishes--herring, mackerel, andbutterfish. Zooplanktonpopulations have beensufficiently robust in theNortheast shelf ecosystem,even through a period ofdecline, to sustain therecovery of both herringand mackerel populations.Sufficient zooplankton willalso be needed to support arecovery of the depressedcods and related fishes,together with flounderstocks during their larvalstages. This dependence ofrecovering fish populationson zooplankton representsyet another factor to beconsidered in the recoveryof zooplankton itself.Whether the observeddecline in zooplanktonreflects a response toincreasing predation by thegrowing populations ofpelagic fishes or abiofeedback response to anenvironmental signalremains an importantunanswered question.There are some indicationsof renewed growth inzooplankton populations.From further analysis ofthe data through 1992 overGeorges Bank, Sherman et
Fig. 7. a) Seasonal changes in the standing stock of zooplankton for four areas of the Northeast shelf ecosystem--the Gulf of Maine, Georges Bank, southern New England, and the Middle Atlantic Bight. Values are based on mean monthly volumes in cubic centimeters per 100 cubic meters of water and include the range and standard error of the mean. b) Seasonal pulses in abundance of the dominant copepods--Calanus finmarchicus, Pseudocalanus minutus, and Centropages typicus--in four areas of the Northeast shelf ecosystem are shown.
Page 12 of 186Marine Resources
1/26/2007http://biology.usgs.gov/s+t/SNT/noframe/mr181.htm

al. (1994) found that thezooplankton standingstocks may again beincreasing (Fig. 7).
To gain insights into the possibility of an environmentally mediated biofeedback, the zooplankton was examined for shifts in biodiversity over time as indicated by the abundance of five zooplankton species: Calanus finmarchicus, Pseudocalanus spp., Centropages typicus, Metridia lucens, and Centropages hamatus, for the four Northeast shelf areas from 1977 to 1987. Significant trends for Georges Bank and the Gulf of Maine were found. It appears that the dominant copepod community was undergoing a shift from Calanus finmarchicus, Pseudocalanus spp., Metridia lucens, and Centropages typicus toward an increasing abundance of C. hamatus on Georges Bank and in the Gulf of Maine (Sherman et al. 1994). The shift in species abundance may have been environmentally induced, as it is unlikely that the principal pelagic fishes would selectively avoid preying on C. hamatus. An ecosystem monitoring program presently under way through the National Marine Fisheries Service's Northeast Fisheries Science Center, in cooperation with the Environmental Protection Agency, is designed to provide more definitive information on factors that cause changes in the structure of the zooplankton community. Major shifts in biodiversity of the zooplankton community could affect the recruitment success of the presently depressed cod, haddock, and flounder populations.
Benthic Resources
Information on the bottomof the Northeast shelfecosystem is availablefrom qualitative surveysbeginning in the 1870'sand quantitative samplingin the 1950's-1960's (Wigley and Theroux1981; Fig. 8) and the1970's-1980's (Steimle
Page 13 of 186Marine Resources
1/26/2007http://biology.usgs.gov/s+t/SNT/noframe/mr181.htm

1990). These surveysfound the benthos toconsist of a mosaic ofassemblages. The 1970's-1980's surveys yielded1,250 taxa, withpolychaete worms mostnumerous (45% of thetotal), followed bycrustaceans (23%),bivalves (12%), andgastropods (11%).Composition andabundances of dominantspecies vary temporallyand spatially, butsubsequent surveys ofbenthic assemblages havefound them to be relativelystable. The only notableexceptions to this stabilityare in areas where wastedisposal has altered thebenthos or whereshellfishes have beenharvested. Larger bottom-dwelling animals likeAtlantic rock crabs andlady crabs, the mostabundant species, hadfairly stable populationsizes between 1978 and1987. Stocks of thehorseshoe crab, whoseeggs are criticallyimportant as food formigrating shorebirds, werestable from the mid-1970's to mid-1980's, with no evidence that harvestinglevels were depleting theresource, but continuedmonitoring was advised for
Fig. 8. Geographic distribution of biomass for each dominant benthic species or group in the Middle Atlantic Bight, part of the Northeast shelf ecosystem (from Wigley and Theroux 1981).
Page 14 of 186Marine Resources
1/26/2007http://biology.usgs.gov/s+t/SNT/noframe/mr181.htm

this species (Botton and Ropes 1987).
The larger animals of submarine canyons on the shelf edge and continental slope, such as those off New Jersey and Delaware, have been sampled since the 1970's, with intensive work in the 1980's and early 1990's, in order to estimate the potential effects of oil and gas exploration and of waste disposal at Deepwater Dumpsite 106. Deepwater Dumpsite 106 is located approximately 170 kilometers southeast of New York City in depths of 1,700-2,750 meters. The benthic fauna of this area was found to be remarkably naturally diverse, with 798 species (58% new to science) recorded in the pre-oil exploration study.
Surveys of larger bottom-dwelling organisms have been conducted in all the major estuaries of the Northeast shelf ecosystem except Cobscook Bay in northern Maine. Only Chesapeake Bay has a major program for monitoring status and trends of benthic organisms; indicators there signaled recent improvements at some sites and increasing degradation at others. Data from the 1970's indicated that Delaware Bay and Raritan Bay had lower abundances of benthic fauna than did other Middle Atlantic estuaries, but the number of species in these bays was typical for the region. Studies in the early 1990's suggested no major changes had occurred in the Delaware Bay benthic ecosystem since the earlier work, whereas higher abundances and richness were reported for Raritan Bay in the late 1980's (Cerrato et al. 1989). In Chesapeake Bay and western Long Island Sound, chronic hypoxia (defined as less than 2 milligrams dissolved oxygen per liter of water) has altered the benthos and spurred nutrient reduction efforts. The decline of eelgrass in many northeastern estuaries since a 1930's wasting disease affected the plant has probably led to reduced abundance and diversity of benthic organisms in those areas.
Information is becoming available on the secondary production of benthic invertebrates, especially harvestable and forage species and community dominants. Annual productivity estimates of benthic
Page 15 of 186Marine Resources
1/26/2007http://biology.usgs.gov/s+t/SNT/noframe/mr181.htm
organisms on Georges Bank suggest that production is relatively high there (more than 100 kilocalories per square meter) compared with other offshore and coastal areas in the northwest Atlantic (Steimle 1987).
Fisheries Resources
The Northeast shelf ecosystem contains a myriad of finfish and invertebrate species, some of which exist wholly within the ecosystem and others that are migratory and cross the regional boundary. Briggs (1974)reported about 250 shore fishes in this area, and Grosslein and Azarovitz (1982) indicated that 180 species of fishes and invertebrates were recorded in 1974 in the spring and autumn bottom trawl surveys conducted between Nova Scotia and Cape Hatteras, North Carolina, by the National Marine Fisheries Service's Northeast Fisheries Science Center. This comprehensive survey, which began in 1963, provides an invaluable time-series of relative abundance estimates of all the fish and invertebrate species caught by this gear. The number of species is not comprehensive, however, because some are not caught in the otter trawls used in those surveys (for example, sharks, large pelagic fishes such as tuna and billfish, small or elusive pelagic fishes, and species residing in water deeper than 365 meters). About 50-75 of the species caught during the surveys are harvested in commercial and recreational fisheries. Although not supporting any fisheries, the remaining species are nevertheless important elements in the complex web of the ecosystem, serving as a food source for those species more directly used by humans.
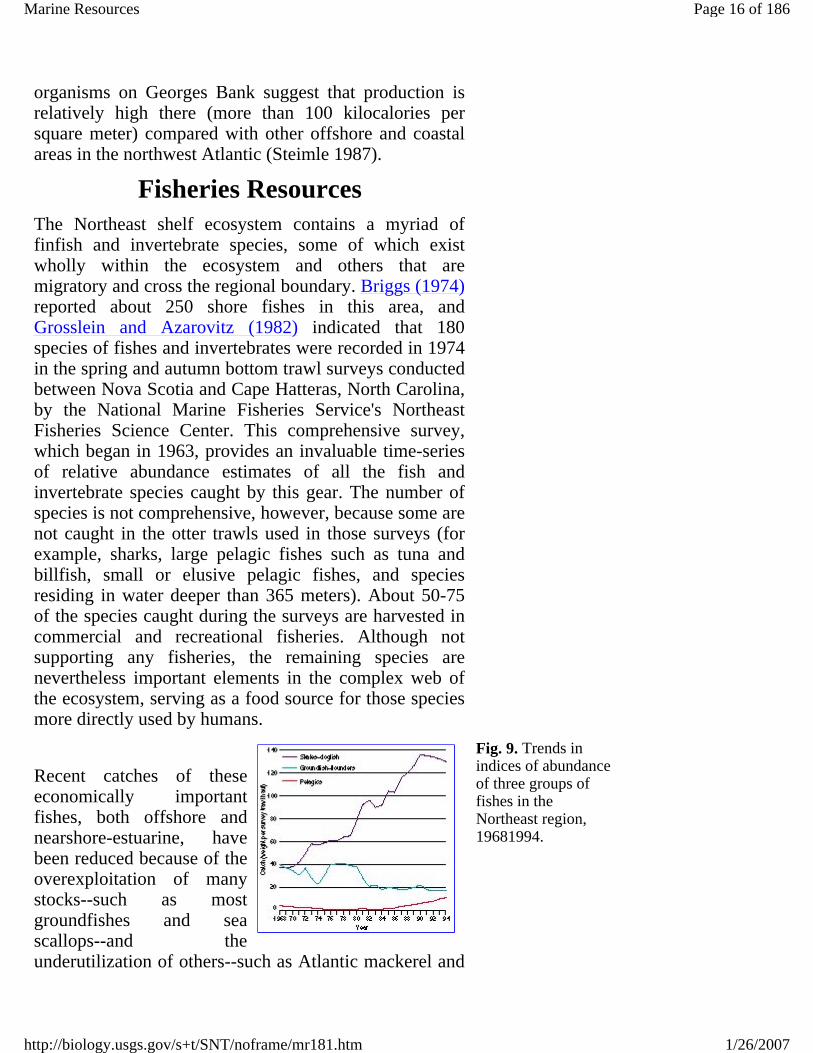
Recent catches of these economically important fishes, both offshore and nearshore-estuarine, have been reduced because of the overexploitation of many stocks--such as most groundfishes and sea scallops--and the underutilization of others--such as Atlantic mackerel and
Fig. 9. Trends in indices of abundance of three groups of fishes in the Northeast region, 19681994.
Page 16 of 186Marine Resources
1/26/2007http://biology.usgs.gov/s+t/SNT/noframe/mr181.htm

Atlantic herring. A major shift in dominance has taken place within the finfish community from groundfishes in the 1960's--Atlantic cod, haddock, pollock, white hake, silver hake, and flounders--to predominantly elasmobranchs such as spiny dogfish and skates, and pelagic fishes such as mackerel and herring in recent years (Fig. 9). This shift is the consequence of excessive trawl fishing on groundfish and has led to reduced numbers of mature fishes, diminished spawning success, abnormally few older fishes, and stock depletion.
The demersal groundfish group (about 35 species) has a long-term potential yield of more than 500,000 metric tons; nearly every stock is overexploited. This overall abundance declined substantially in the past 30 years to an all-time low in 1994 (Fig. 10). Initially the decline was the result of heavy distant-water fleet fishing in the 1960's-1970's and, more recently, it is because of excessive domestic fishing pressure. Recent (1994) catches are about 160,000 metric tons per year. The status and trends of the major fish resources in the northeastern region are summarized in Table 1. Haddock, yellowtail flounder, and Atlantic cod stocks on Georges Bank have collapsed--1994 landings were only 23% of long-term potential yield (Fig. 11). Other groundfish species are generally low in abundance, and populations are expected to remain depressed. Consequently, large portions of the bank and southern New England were closed to fishing, effective December 1994, to reduce fishing pressure and avert reducing the abundance of these species to levels that would not support fishing of any kind (Fig. 12).
Fig. 10. Landings and abundance index of principal Northeast flounders and groundfishes, 19601994 (from National Oceanic and Atmospheric Administration 1996).
Abundance of spiny dogfish and skates combined (seven species), expressed as kilograms per tow from research bottom trawl surveys, has increased four- to five-fold since the late
Fig. 11. Total landings of Atlantic cod, haddock, and yellowtail flounder from Georges Bank, 19761995.
Page 17 of 186Marine Resources
1/26/2007http://biology.usgs.gov/s+t/SNT/noframe/mr181.htm
1960's (Fig. 13). The biomass of spiny dogfish alone was estimated to be about 650,000 metric tons in 1994 (Northeast Fisheries Science Center 1994). This increase, coupled with the decline in cods and related fishes and flounders, has resulted in dogfish and skates increasing in relative abundance from 25% of the total fish biomass on Georges Bank in 1963 to about 75% in recent years. Currently, dogfish and skates are high in abundance and declining slightly.
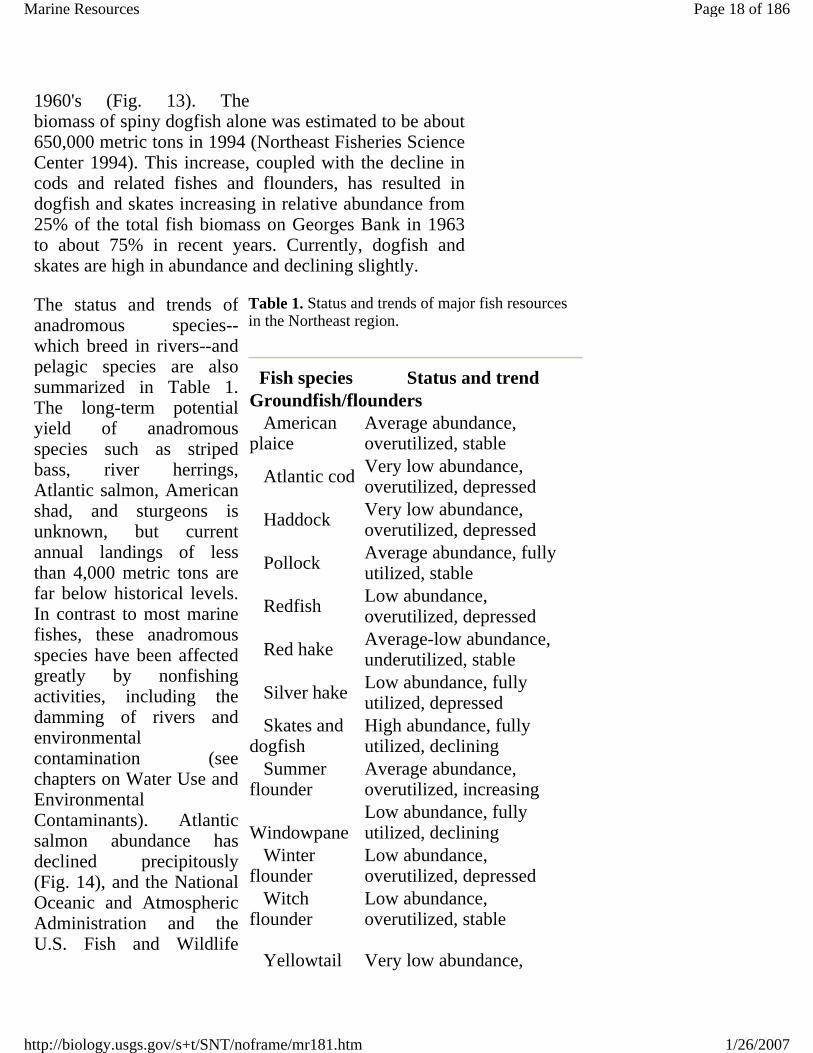
The status and trends ofanadromous species--which breed in rivers--and pelagic species are alsosummarized in Table 1.The long-term potential yield of anadromousspecies such as stripedbass, river herrings,Atlantic salmon, Americanshad, and sturgeons isunknown, but currentannual landings of lessthan 4,000 metric tons arefar below historical levels.In contrast to most marinefishes, these anadromousspecies have been affectedgreatly by nonfishingactivities, including thedamming of rivers andenvironmental contamination (seechapters on Water Use andEnvironmental Contaminants). Atlanticsalmon abundance hasdeclined precipitously(Fig. 14), and the NationalOceanic and AtmosphericAdministration and theU.S. Fish and Wildlife
Table 1. Status and trends of major fish resources in the Northeast region.
Fish species Status and trendGroundfish/flounders American plaice
Average abundance, overutilized, stable
Atlantic cod Very low abundance, overutilized, depressed
Haddock Very low abundance, overutilized, depressed
Pollock Average abundance, fully utilized, stable
Redfish Low abundance, overutilized, depressed
Red hake Average-low abundance, underutilized, stable
Silver hake Low abundance, fully utilized, depressed
Skates and dogfish
High abundance, fully utilized, declining
Summer flounder
Average abundance, overutilized, increasing
Windowpane
Low abundance, fully utilized, declining
Winter flounder
Low abundance, overutilized, depressed
Witch flounder
Low abundance, overutilized, stable
Yellowtail Very low abundance,
Page 18 of 186Marine Resources
1/26/2007http://biology.usgs.gov/s+t/SNT/noframe/mr181.htm
Service have accepted aState of MaineConservation Plan toconserve a populationcomplex of Atlanticsalmon in seven Mainerivers as an alternative tolisting it as threatenedunder the U.S. EndangeredSpecies Act. The stripedbass is another species thatwas reduced to lownumbers in the late 1970'sand early 1980's byexcessive fishing pressure(Fig. 15). Striped basspopulations, however,have responded positivelyto a series of restrictivemanagement measuresimposed in the 1980's; thisspecies' recruitment andabundance are nowincreasing (NationalOceanic and AtmosphericAdministration 1993).
flounder overutilized, depressedAnadromous fishes American shad
Low abundance, overutilized, variable
Atlantic salmon
Low abundance, fully utilized, variable
River herring
Low abundance, overutilized, variable
Striped bass High abundance, fully utilized, increasing
Sturgeons Low abundance, overutilized, stable
Pelagic fishesa
Atlantic herring
High abundance, underutilized, stable to increasing
Atlantic mackerel
High abundance, underutilized, stable to increasing
Bluefish Low abundance, overutilized, declining
Butterfish Average abundance, underutilized, stable
SharksUnknown abundance, some species possibly fully or overutilized, unknown trend
aFor highly migratory pelagic fishes see text discussion of the Southeast region.
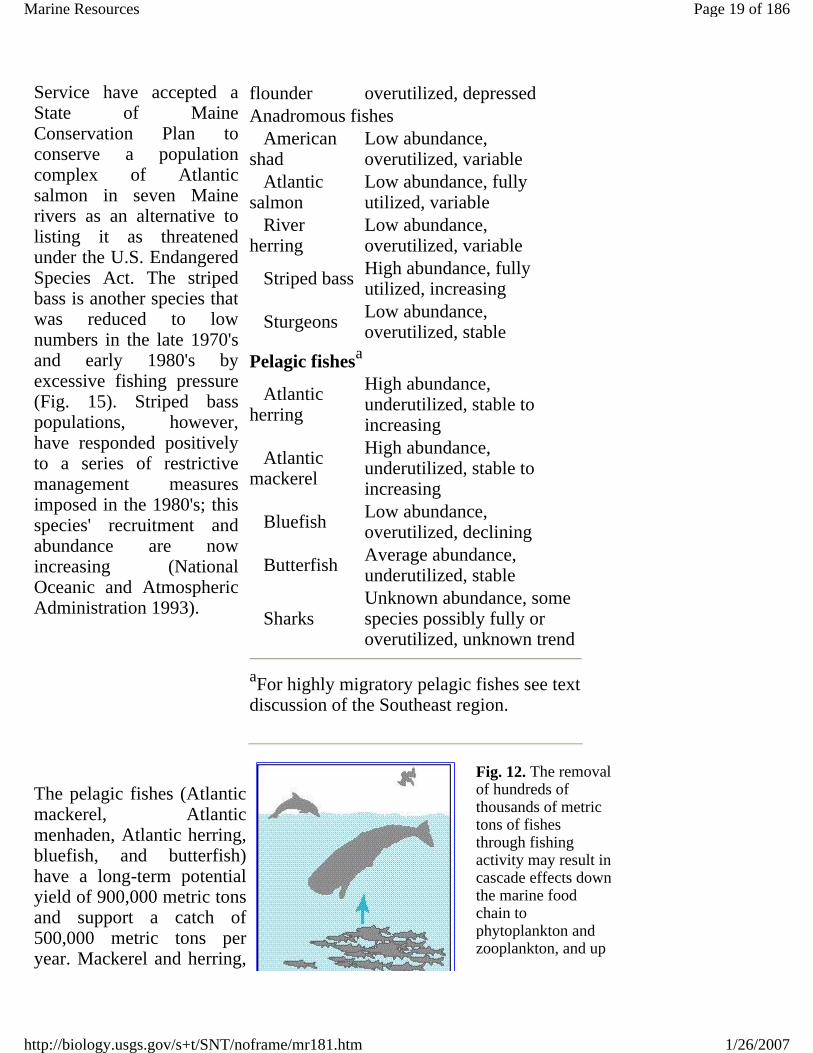
The pelagic fishes (Atlantic mackerel, Atlantic menhaden, Atlantic herring, bluefish, and butterfish) have a long-term potential yield of 900,000 metric tons and support a catch of 500,000 metric tons per year. Mackerel and herring,
Fig. 12. The removal of hundreds of thousands of metric tons of fishes through fishing activity may result in cascade effects down the marine food chain to phytoplankton and zooplankton, and up
Page 19 of 186Marine Resources
1/26/2007http://biology.usgs.gov/s+t/SNT/noframe/mr181.htm

currently underutilized, were heavily fished by distant-water fleets from the mid-1960's to mid-1970's (Fig. 16). Their populations decreased to minimal levels around 1980 but have subsequently increased to present record-high levels, measured in excess of 2 million metric tons each (Northeast Fisheries Science Center 1993). Mackerel and herring stocks can support long-term potential yields of 200,000 and 120,000 metric tons, respectively. Bluefish, an important recreational species that supported catches as high as 76,500 metric tons in 1980, has since declined and is now overexploited. Atlantic menhaden, distributed from Canada to Florida, is fully utilized, with a long-term potential yield of 480,000 metric tons per year and recent annual catches of 360,000 metric tons.
the food chain to marine birds and mammals.
The long-term potential yield of highly migratory pelagic fishes in the Atlantic (such as swordfish, bluefin tuna, yellowfin tuna, bigeye tuna, albacore, skipjack tuna, blue marlin, white marlin, sailfish, and spearfish) is about 250,000 metric tons, less than 20,000 metric tons of which is the U.S. share (prorated based on previous catches). Recent catches have averaged about 230,000 metric tons worldwide, with 16,000 metric tons taken by the United States (Fig. 17). Virtually all the species are either fully or overutilized, with the abundance of several species (for example, swordfish, bluefin tuna, and marlin) below or far below optimal levels.
Fig. 13. Landings and abundance index of Northeast skates and dogfish, 1960-1994 (from National Oceanic and Atmospheric Administration 1996).
Little is known about the abundance of large and small coastal and pelagic sharks in the Atlantic, but their long-term potential yield is estimated to be
Fig. 14. Spawning run size of Atlantic salmon returning to Maine rivers, and total catch by U.S. anglers and at-sea catch by foreign vessels, 19681994
Page 20 of 186Marine Resources
1/26/2007http://biology.usgs.gov/s+t/SNT/noframe/mr181.htm

about 10,000 metric tons per year, the level of current catches. Sharks traditionally were fished moderately, but in recent years, large coastal sharks have been particularly subject to increased fishing pressure, resulting in overexploitation (Fig. 18).
(from National Oceanic and Atmospheric Administration 1996).
Valuable crustacean and molluscan resources occur in offshore and nearshore (estuarine) waters. Offshore species such as American lobster, sea scallop, Atlantic surfclam, ocean quahog, long-finned squid, short-finned squid, and northern shrimp have a long-term potential yield of 160,000-200,000 metric tons, with smaller recent landings. Their population status and trends are summarized in Table 2. With the exception of short-finned squid, all are either fully utilized or overutilized. Sea scallops in particular (7,400 metric tons landed in the Northeast region in 1993; Fig. 19), and to a lesser extent lobsters in the Gulf of Maine (25,500 metric tons landed in 1993 throughout the Northeast; Fig. 20), are exploited at rates exceeding management definitions of overfishing. Sea scallops, whose reproductive success exhibits high annual variability, are now at a low level of abundance. Green sea urchins (for which we have no estimate of long-term potential yield) have been subjected to ever- increasing fishing pressure since a fishery began in 1987. Landings in 1993 were more than 19,000 metric tons, a three-fold increase from 1990, with a strong likelihood of overexploitation in some areas (for example, coastal Maine). Various species of crab (for example, Jonah, Atlantic rock, and red crabs), some found both offshore and nearshore, produced about 4,500 metric tons of landings in 1993 and are underutilized.
Fig. 15. Striped bass catch and recruitment index of young striped bass in Chesapeake Bay, 19501994 (from National Oceanic and Atmospheric Administration 1996).
Nearshore and estuarinespecies (for example,eastern oysters, northernquahogs, softshell clams,blue mussels, bay scallops,
Table 2. Status and trends of selected crustaceans and mollusks in the Northeast region.
Habitat/species Status and trend
Page 21 of 186Marine Resources
1/26/2007http://biology.usgs.gov/s+t/SNT/noframe/mr181.htm

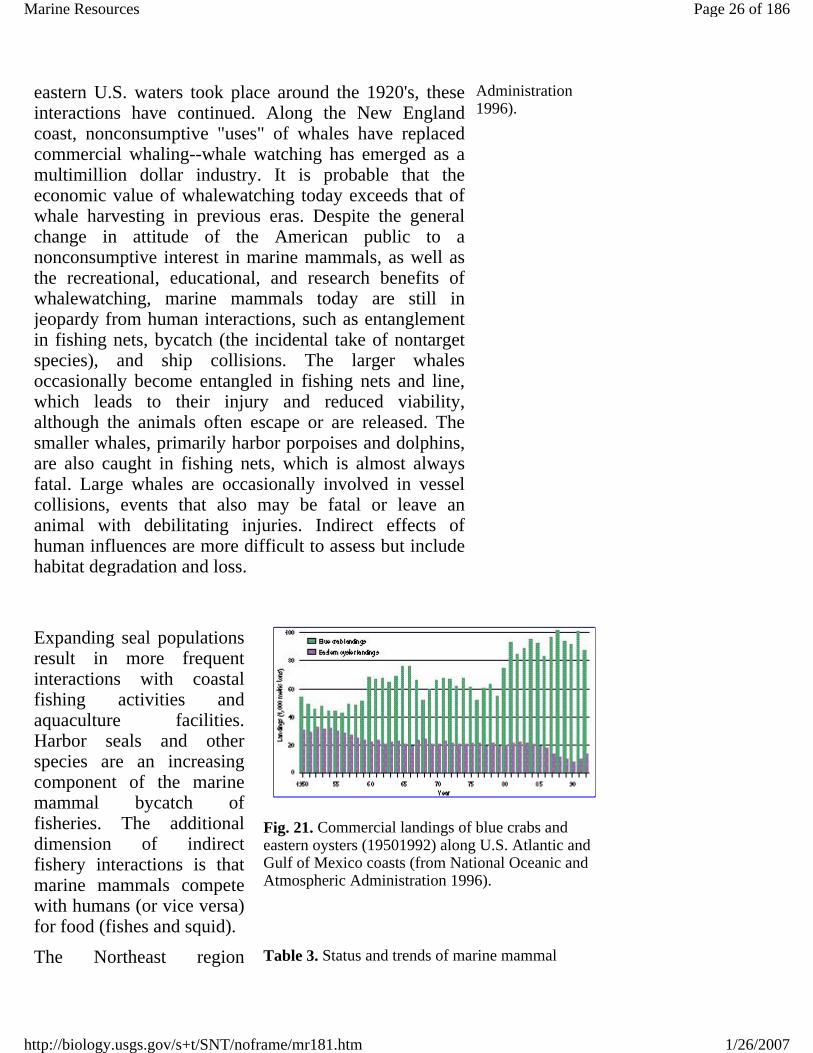
whelks or conchs, and bluecrabs) are generally fullyor overutilized (Table 2)and have a long-term potential yield of about100,000 metric tons (meatweight only, except forblue crab). Eastern oysterlandings fell sharply in thelate 1980's (Fig. 21) andare now, at about 11,000metric tons per year, farbelow long-term potential yield. Populations in theprincipal historical easternoyster areas, theChesapeake and Delawarebays, are largely depletedby effects of disease (MSXand dermo); Connecticutnow accounts for mosteastern oyster production.Bay scallops, with recentlandings averaging about160 metric tons (1990-1992), are overexploitedand at reduced levels ofabundance. Recentlandings of blue mussels(Fig. 22), with an uncertainlong-term potential yield,have increased to anaverage 3,500 metric tonsper year. Northern quahog(hardshell clam) landings(Fig. 22) are now fairlysteady at about 4,700metric tons per year andare probablyoverexploited. Softshellclams (average catches of2,100 metric tons in 1990-1992; Fig. 22) appear to be
Offshore American lobster
High abundance, overutilized, variable
Atlantic surfclam
Average abundance, fully utilized, declining
CrabsHigh abundance, underutilized, relatively stable
Long-finned squid
Average abundance, fully utilized, variable
Northern shrimp
Average abundance, fully utilized, relatively stable
Ocean quahog Average abundance, fully utilized, declining
Sea scallop Low abundance, overutilized, variable
Sea urchins
Average abundance, in danger of being overutilized, unknown trend
Short-finned squid
Average abundance, underutilized, variable
Nearshore and estuarine
Bay scallopLow abundance, overutilized, relatively stable
Blue crab Average abundance, fully utilized, relatively stable
Blue mussel Average abundance, fully utilized, stable
Eastern oysterLow to depleted abundance, overutilized, stable
Hardshell clam Low abundance, overutilized, stable
Softshell clam Low abundance, overutilized, stable
Page 22 of 186Marine Resources
1/26/2007http://biology.usgs.gov/s+t/SNT/noframe/mr181.htm

fully exploited, withdecreased abundance inMaryland and Maine. Bluecrab off the Atlantic coastis fully utilized, withcommercial landingsaveraging 44,000 metrictons per year since 1985(Fig. 21). Their greatestconcentration is inChesapeake Bay, wherethe recreational harvest hasmade up approximately30%-40% of the total catch in recent years.
Marine Birds
Marine birds, which breed, forage, or migrate through marine environments, consist of several ecological groupings. Some breeding marine birds nest on nearshore beaches, coastal cliffs, or islands near the coast. These species forage in either coastal, nearshore, or pelagic habitats during the breeding season--usually summer and fall--but often migrate to other regions during other seasons. During winter, marine birds that breed farther north may spend the winter living and foraging in more southern environments. For example, some birds that nest in the Canadian arctic and subarctic may be prevalent in the winter in the Northeast. Another group of marine birds found in all U.S. marine systems, sometimes in immense numbers, are birds that breed in tropical environments or in the Southern Hemisphere. Birds of this latter group are almost always found offshore near the continental shelf break and include tropicbirds, shearwaters, albatrosses, petrels, storm-petrels, and skuas.
Fig. 16. Landings of Atlantic herring and Atlantic mackerel in the Northeast region and their combined abundance index, 19601994 (from National Oceanic and Atmospheric Administration 1996).
Page 23 of 186Marine Resources
1/26/2007http://biology.usgs.gov/s+t/SNT/noframe/mr181.htm

Buckley and Buckley (1984) reported that at least 20 marine bird species nest regularly in the Northeast region, while 9 others irregularly nest there or in the near vicinity. Schneider and Heinemann (1996) completed a recent overview of predominant marine birds inhabiting the Northeast shelf ecosystem. Gulls, terns, and herons are important species breeding within the ecosystem. Other species of marine birds that do not breed in the ecosystem are nevertheless important and occupy two ecological regimes within the ecosystem, coastal and pelagic. In the coastal zone, plovers, sandpipers, and other shorebirds are important predators of beach and intertidal invertebrates. Other nonbreeding but abundant species are for the most part pelagic, breeding in colonies around the margin of the northwestern Atlantic basin.
Fig. 17. U.S. landings of tunas, swordfish, marlins, and spearfish from the western North Atlantic Ocean, and percentages of selected species, 19601994 (from National Oceanic and Atmospheric Administration 1996).
In the Gulf of Maine, the dominant bird populations include Leach's storm-petrel, great cormorant, razorbill, and Atlantic puffin. Farther south, terns, gulls, and jaegers are the dominant pelagic birds. Species abundances in the Northeast region are highly seasonal. The most numerous species in early summer is the sooty shearwater, a regular migrant from its Southern Hemisphere breeding areas; in late summer, Wilson's storm-petrel is more abundant. The greater shearwater is abundant in autumn. During winter, the ecosystem is inhabited by southward-migrating flocks of Iceland gulls, glaucous gulls, black-legged kittiwakes, Leach's storm-petrels, dovekies, and
Fig. 18. Landings and relative catch rates of large coastal sharks in the western Atlantic Ocean and Gulf of Mexico by commercial vessels, 19851995 (from National Oceanic and Atmospheric Administration 1996).
Page 24 of 186Marine Resources
1/26/2007http://biology.usgs.gov/s+t/SNT/noframe/mr181.htm

razorbills.
Researchers observed the changing population densities of pelagic marine birds during the National Oceanic and Atmospheric Administration's Marine Resources Monitoring, Assessment, and Prediction surveys of the Northeast shelf ecosystem, conducted from 1976 to 1988. Some of these pelagic marine species breed in the area, but others are only winter visitors or passage migrants, thus the trends revealed do not necessarily relate to breeding population sizes. Based on analysis of the surveys, northern fulmar, great black-backed gull, and herring gull populations declined from 1978 to 1980. Other species showing similar decreasing trends in abundance were greater shearwater, sooty shearwater, Cory's shearwater, Wilson's storm-petrel, black-legged kittiwake, and pomarine jaeger. Some of these species feed heavily on trawler-discarded offal at sea. Schneider and Heinemann (1996) hypothesized that as fish stocks decreased in abundance in the early 1980's, the amount of offal discarded at sea also declined, which may have reduced the survival of some marine birds. Another possibility is that the birds moved their foraging activities elsewhere. Significant year-to-year variability was observed among other marine birds, including ring-billed gulls, common terns, northern gannets, laughing gulls, Leach's storm-petrels, red phalaropes, and dovekies. The causes of this variability have not been determined.
Fig. 19. U.S. and Canadian landings of sea scallops from the mid-Atlantic coast, Gulf of Maine, and Georges Banks, 19401994 (from National Oceanic and Atmospheric Administration 1996).
Marine Mammals
Since at least the 1500's, humans have interacted with marine mammals in waters off the coast of what is now the United States. Historically, much of this interaction has been the result of the whaling industry; although the last whaling in
Fig. 20. Landings of American lobsters in U.S. waters, and landings per unit effort (LPUE) in Maine, 19401994 (from National Oceanic and Atmospheric
Page 25 of 186Marine Resources
1/26/2007http://biology.usgs.gov/s+t/SNT/noframe/mr181.htm
eastern U.S. waters took place around the 1920's, these interactions have continued. Along the New England coast, nonconsumptive "uses" of whales have replaced commercial whaling--whale watching has emerged as a multimillion dollar industry. It is probable that the economic value of whalewatching today exceeds that of whale harvesting in previous eras. Despite the general change in attitude of the American public to a nonconsumptive interest in marine mammals, as well as the recreational, educational, and research benefits of whalewatching, marine mammals today are still in jeopardy from human interactions, such as entanglement in fishing nets, bycatch (the incidental take of nontarget species), and ship collisions. The larger whales occasionally become entangled in fishing nets and line, which leads to their injury and reduced viability, although the animals often escape or are released. The smaller whales, primarily harbor porpoises and dolphins, are also caught in fishing nets, which is almost always fatal. Large whales are occasionally involved in vessel collisions, events that also may be fatal or leave an animal with debilitating injuries. Indirect effects of human influences are more difficult to assess but include habitat degradation and loss.
Administration 1996).
Expanding seal populations result in more frequent interactions with coastal fishing activities and aquaculture facilities. Harbor seals and other species are an increasing component of the marine mammal bycatch of fisheries. The additional dimension of indirect fishery interactions is that marine mammals compete with humans (or vice versa) for food (fishes and squid).
Fig. 21. Commercial landings of blue crabs and eastern oysters (19501992) along U.S. Atlantic and Gulf of Mexico coasts (from National Oceanic and Atmospheric Administration 1996).
The Northeast region Table 3. Status and trends of marine mammal
Page 26 of 186Marine Resources
1/26/2007http://biology.usgs.gov/s+t/SNT/noframe/mr181.htm
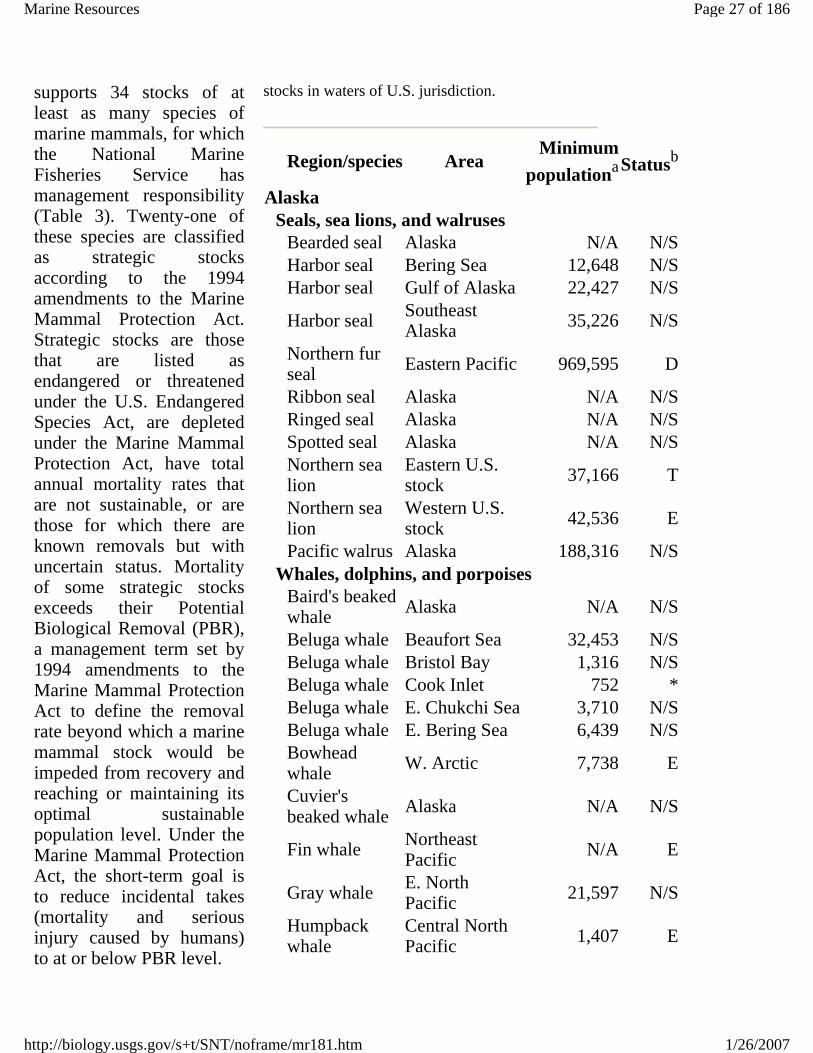
supports 34 stocks of at least as many species of marine mammals, for which the National Marine Fisheries Service has management responsibility (Table 3). Twenty-one of these species are classified as strategic stocks according to the 1994 amendments to the Marine Mammal Protection Act. Strategic stocks are those that are listed as endangered or threatened under the U.S. Endangered Species Act, are depleted under the Marine Mammal Protection Act, have total annual mortality rates that are not sustainable, or are those for which there are known removals but with uncertain status. Mortality of some strategic stocks exceeds their Potential Biological Removal (PBR), a management term set by 1994 amendments to the Marine Mammal Protection Act to define the removal rate beyond which a marine mammal stock would be impeded from recovery and reaching or maintaining its optimal sustainable population level. Under the Marine Mammal Protection Act, the short-term goal is to reduce incidental takes (mortality and serious injury caused by humans) to at or below PBR level.
stocks in waters of U.S. jurisdiction.
Region/species AreaMinimum
populationaStatusb
Alaska Seals, sea lions, and walruses Bearded seal Alaska N/A N/S Harbor seal Bering Sea 12,648 N/S Harbor seal Gulf of Alaska 22,427 N/S
Harbor seal Southeast Alaska 35,226 N/S
Northern fur seal Eastern Pacific 969,595 D
Ribbon seal Alaska N/A N/S Ringed seal Alaska N/A N/S Spotted seal Alaska N/A N/S
Northern sea lion
Eastern U.S. stock 37,166 T
Northern sea lion
Western U.S. stock 42,536 E
Pacific walrus Alaska 188,316 N/S Whales, dolphins, and porpoises
Baird's beaked whale Alaska N/A N/S
Beluga whale Beaufort Sea 32,453 N/S Beluga whale Bristol Bay 1,316 N/S Beluga whale Cook Inlet 752 * Beluga whale E. Chukchi Sea 3,710 N/S Beluga whale E. Bering Sea 6,439 N/S
Bowhead whale W. Arctic 7,738 E
Cuvier's beaked whale Alaska N/A N/S
Fin whale Northeast Pacific N/A E
Gray whale E. North Pacific 21,597 N/S
Humpback whale
Central North Pacific 1,407 E
Page 27 of 186Marine Resources
1/26/2007http://biology.usgs.gov/s+t/SNT/noframe/mr181.htm

Fig. 22. Commercial landings of hardshell clams, softshell clams, and blue mussels (19501994) along U.S. Atlantic and Gulf of Mexico coasts (from National Oceanic and Atmospheric Administration 1996).
Humpback whale
W. North Pacific N/A E
Killer whale
E. North Pacific, northern resident
764 N/S
Killer whaleE. North Pacific, transient
314 N/S
Minke whale Alaska N/A N/S
Northern right whale North Pacific N/A E
Sperm whale North Pacific N/A E
Stejneger's beaked whale Alaska N/A N/S
Pacific white-sided dolphin North Pacific 486,719 N/S
Dall's porpoise Alaska 76,874 N/S
Harbor porpoise Bering Sea 8,549 N/S
Harbor porpoise Gulf of Alaska 7,085 N/S
Harbor porpoise
Southeast Alaska 8,156 N/S
Sea otters and polar bears Sea otter Alaska 100,000 N/S
Polar bear Southern Beaufort Sea 1,579 N/S
Polar bear Chukchi/Bering Sea N/A N/S
Atlantic and Gulf of Mexico Seals
Gray seal N.W. North Atlantic 2,035 N/S
Harbor seal W. North Atlantic 28,810 N/S
Harp seal N.W. North Atlantic N/A N/S
Spinner dolphin
N. Gulf of Mexico 4,465 N/S
In the western North Atlantic, strategic stock species include endangered right whales, humpback whales, fin whales (Figs. 23 and 24), sei whales, blue whales, and sperm whales (Fig. 25); the mid-Atlantic coastal bottlenose dolphin, which is listed as depleted under the Marine Mammal Protection Act; and stocks whose estimated mortality exceeds PBR: Cuvier's beaked whale, dwarf sperm whale, long-finned pilot whale, pygmy sperm whale, short-finned pilot whale, Atlantic spotted dolphin, common dolphin, pantropical spotted dolphin, and the Gulf of Maine-Bay of Fundy harbor porpoise. Of these strategic stocks,
Page 28 of 186Marine Resources
1/26/2007http://biology.usgs.gov/s+t/SNT/noframe/mr181.htm

North Atlantic right whales are believed to be increasing, Western North Atlantic coastal bottlenose dolphins are believed to be stable, and the population trends for the remaining species, such as the Atlantic white-sided dolphin (Fig. 26), are unknown.
Hooded seal N.W. North Atlantic N/A N/S
Whales, dolphins, and porpoises
Blainville's beaked whale
N. Gulf of Mexico N/A N/S
Blainville's beaked whale
W. North Atlantic N/A N/S
Blue whale W. North Atlantic N/A E
Bryde's whale N. Gulf of Mexico 17 N/S
Cuvier's beaked whale
N. Gulf of Mexico 20 N/S
Cuvier's beaked whale
W. North Atlantic 895 *
Dwarf sperm whale
N. Gulf of Mexico N/A *
Dwarf sperm whale
W. North Atlantic N/A *
False killer whale
N. Gulf of Mexico 236 N/S
Fin whale W. North Atlantic 1,704 E
Gervais' beaked whale
N. Gulf of Mexico N/A N/S
Gervais' beaked whale
W. North Atlantic N/A N/S
Humpback whale
W. North Atlantic 4,848 E
Killer whale N. Gulf of Mexico 197 N/S
Killer whale W. North Atlantic N/A N/S
Long-finned pilot whale
W. North Atlantic 4,968 *
Melon-headed whale
N. Gulf of Mexico 2,888 N/S
Minke whale Canadian east coast 2,053 N/S
North Atlantic right whale
W. North Atlantic 295 E
In general, the distribution and abundance of marine mammals ebb and flow with the seasons. This phenomenon is almost solely linked to food, because cetacean (whale, dolphin, and porpoise) distributions are far from regular or random but almost always correspond with the location of food sources. Cetaceans generally enter the Northeast region in spring and circulate through the feeding grounds during summer and into fall. During the feeding season, cetaceans in the Northeast region probably intermix with animals of the Canadian Scotian shelf and northward. As the year wanes, whales migrate to wintering grounds in waters of the mid-Atlantic and southeastern United States, offshore deep-ocean areas, and the West Indies. A few individuals of most species, however, occupy the
Page 29 of 186Marine Resources
1/26/2007http://biology.usgs.gov/s+t/SNT/noframe/mr181.htm

Northeast region throughout the winter.
Northern bottlenose whale
W. North Atlantic N/A N/S
Pygmy killer whale
N. Gulf of Mexico 285 N/S
Pygmy killer whale
W. North Atlantic 6 N/S
Pygmy sperm whale
N. Gulf of Mexico N/A *
Pygmy sperm whale
W. North Atlantic N/A *
Sei whale W. North Atlantic N/A E
Short-finned pilot whale
N. Gulf of Mexico 186 *
Short-finned pilot whale
W. North Atlantic 457 *
Sowerby's beaked whale
W. North Atlantic N/A N/S
Sperm whale N. Gulf of Mexico 411 E
Sperm whale W. North Atlantic 1,617 E
True's beaked whale
W. North Atlantic N/A N/S
Atlantic spotted dolphin
N. Gulf of Mexico 2,255 N/S
Atlantic spotted dolphin
W. North Atlantic 1,617 *
Atlantic white-sided dolphin
W. North Atlantic 19,196 N/S
Bottlenose dolphin
E. Gulf of Mexico, coastal 8,963 N/S
Bottlenose dolphin
Gulf of Mexico, bay, sound, estuarine
3,933 *
Bottlenose dolphin
Gulf of Mexico, outer continental shelf
43,233 N/S
Although some migration patterns have been described, it is generally observed that whales appear and disappear and that their whereabouts and habitats, when the animals are absent from their better-known feeding grounds, remain largely unknown. For most species, this is particularly true for the wintering and calving grounds. Where whales are concerned, the waters of the northeastern United States are not a discrete entity but rather part of a continuum that stretches through large sections of the Atlantic Ocean throughout the Northern Hemisphere. The various calving and feeding grounds are not residences but temporary stopping points.
In terms of numbers and ecological effects, marine mammals are significant components of the northeastern marine ecosystem, although many of their populations have been reduced in historical times. The fin whale and humpback whale, for example, are recovering from commercial depletion and presently represent the largest component of the
Page 30 of 186Marine Resources
1/26/2007http://biology.usgs.gov/s+t/SNT/noframe/mr181.htm

cetacean population in northwest Atlantic waters; their abundance is estimated at 6,000 animals or more during the peak feeding season. The mid-Atlantic coastal and offshore populations of bottlenose dolphin are depleted following a significant die-off in 1987-1988. The abundance of harbor porpoises has been estimated at 47,200 individuals in the Gulf of Maine-Bay of Fundy area; they have been proposed for listing as threatened under the Endangered Species Act because their annual incidental death rate exceeds their birth rate. Populations of harbor seal, gray seal, harp seal, and hooded seal appear to be increasing and expanding their ranges along New England's coasts. The seasonal abundance and population trends of other marine mammals are not well known.
Bottlenose dolphin
Gulf of Mexico, shelf edge and slope
4,530 N/S
Bottlenose dolphin
W. North Atlantic, coastal
2,482 D
Bottlenose dolphin
W. North Atlantic, offshore
8,794 N/S
Bottlenose dolphin
N. Gulf of Mexico, coastal 3,518 N/S
Bottlenose dolphin
W. Gulf of Mexico, coastal 2,938 N/S
Clymene dolphin
N. Gulf of Mexico 4,120 N/S
Common dolphin
W. North Atlantic 15,470 *
Fraser's dolphin
N. Gulf of Mexico 66 N/S
Pantropical spotted dolphin
N. Gulf of Mexico 26,510 N/S
Pantropical spotted dolphin
W. North Atlantic 1,617 *
Risso's dolphin N. Gulf of Mexico 2,199 N/S
Risso's dolphin W. North Atlantic 11,140 N/S
Rough-toothed dolphin
N. Gulf of Mexico 660 N/S
Spinner dolphin
W. North Atlantic N/A N/S
Striped dolphin N. Gulf of Mexico 3,409 N/S
Striped dolphin W. North Atlantic 18,220 N/S
White-beaked dolphin
W. North Atlantic N/A N/S
Harbor porpoise
Gulf of Maine/ Bay of Fundy 48,289 *
ManateesWest Indian
The majority of present research on and management activities for marine mammals is aimed at reducing resource use conflicts and mitigating adverse effects of interactions between humans and these animals. Research on northwest
Page 31 of 186Marine Resources
1/26/2007http://biology.usgs.gov/s+t/SNT/noframe/mr181.htm

Atlantic marine mammal populations has focused on three primary questions: (1) Have fisheries interactions and other human-related activities directly or indirectly disadvantaged marine mammals or adversely altered their environment? (2) Are the depleted and endangered marine mammals recovering, and have adequate steps been taken to encourage their recovery? and (3) What management actions are and will be necessary in the future to minimize or avoid potential conflicts between marine mammal conservation and human activities, such as commercial fishing and coastal development? For example, in 1994, Cape Cod Bay, Stellwagen Bank, the Great South Channel, and coastal waters of the southeastern United States all were designated under the U.S. Endangered Species Act as critical habitats for the North Atlantic right whale. Amendments to the Marine Mammal Protection Act in 1994 and to the Northeast Multispecies Fishery Management Plan mandate a reduction in harbor porpoise bycatch, and research on gear
manatee Antillean 86 E
West Indian manatee Florida 1,822 E
Pacific and Western Pacific Sea otters Sea otter California 2,376 E Sea otter Washington 360 N/S Seals, sea lions, and walruses
Guadalupe fur seal
Mexico to California 3,028 T
Harbor seal Washington, inland waters 15,349 N/S
Harbor seal California 27,962 N/S
Harbor sealOregon to Washington, coastal
25,665 N/S
Hawaiian monk seal Hawaii 1,366 E
Northern elephant seal
California, breeding 51,625 N/S
Northern fur seal
San Miguel Island 5,018 N/S
California sea lion United States 111,339 N/S
Whales, dolphins, and porpoises
Baird's beaked whale
California to Washington 252 N/S
Blainville's beaked whale Hawaii N/A N/S
Blue whale California to Mexico 1,463 E
Blue whale Hawaii N/A E
Bryde's whale E. Tropical Pacific 11,163 N/S
Bryde's whale Hawaii N/A N/S
Cuvier's beaked whale
California to Washington 6,070 N/S
Cuvier's Hawaii N/A N/S
Page 32 of 186Marine Resources
1/26/2007http://biology.usgs.gov/s+t/SNT/noframe/mr181.htm

modifications--including the use of acoustic deterrent devices--is directed at reducing interactions between fisheries and harbor porpoises.
beaked whale
Dwarf sperm whale
California to Washington N/A N/S
Dwarf sperm whale Hawaii N/A N/S
False killer whale Hawaii N/A N/S
Fin whale California to Washington 747 E
Fin whale Hawaii N/A E
Humpback whale
California to Mexico 563 E
Killer whale California to Washington 436 N/S
Killer whale
Eastern N. Pacific, southern resident
96 N/S
Killer whale Hawaii N/A N/S
Melon-headed whale Hawaii N/A N/S
Mesoplodont beaked whales
California to Washington 1,169 *
Minke whale California to Washington 122 *
Pygmy killer whale Hawaii N/A N/S
Pygmy sperm whale
California to Washington 2,059 N/S
Pygmy sperm whale Hawaii N/A N/S
Sei whale E. North Pacific N/A E
Short-finned pilot whale
California to Washington 741 *
Short-finned pilot whale Hawaii N/A N/S
Sperm whale California to Washington 896 E
Sperm whale Hawaii N/A EBottlenose California,
Southeast Region Environment and Physical Features The Southeast region, including the islands of Puerto Rico and the U.S. Virgin Islands in the Caribbean, encompasses such diverse marine habitats as extensive coral reefs, salt marshes, tidal flats, seagrass and barrier islands, and nearshore, oceanic, and tropical island areas. The region is composed of three large marine ecosystems: the Gulf of Mexico (Brown et al. 1991), the Southeast shelf (Yoder 1991), and the Caribbean (Richards and Bohnsack 1990). The gulf and Southeast shelf ecosystems share many physical and ecological characteristics. Their fisheries have similar species compositions: both ecosystems have broad continental shelves with many coastal lagoons,
Page 33 of 186Marine Resources
1/26/2007http://biology.usgs.gov/s+t/SNT/noframe/mr181.htm

estuaries, and marshes, and both systems support reefs with a tropical affinity and a complex multispecies structure. Also, both ecosystems are strongly influenced by Atlantic western boundary current systems (the Loop Current in the Gulf of Mexico and the Gulf Stream in the Southeast shelf), and both receive major freshwater outflows from large drainage systems bordered by extensive estuarine wetlands. Fishes and invertebrates of the insular shelf of the Caribbean ecosystem are similar to those of reefs in the other two systems but are influenced by quite distinct oceanic processes that occur as a result of the Antilles Current, tropical latitudes, and other conditions of the Caribbean.
dolphin coastal 134 N/S
Bottlenose dolphin
California to Washington, offshore
1,904 N/S
Bottlenose dolphin Hawaii N/A N/S
Central American spinner dolphin
E. Tropical Pacific N/A N/S
Common dolphin
E. Tropical Pacific, central 297,400 N/S
Common dolphin, long-beaked
California 5,504 N/S
Common dolphin
E. Tropical Pacific, northern
353,100 N/S
Common dolphin, short-beaked
California to Washington 309,717 N/S
Common dolphin
E. Tropical Pacific, southern
1,845,600 N/S
Eastern spinner dolphin
E. Tropical Pacific 518,500 D
Northern right whale dolphin
California to Washington 15,080 N/S
Pacific white-sided dolphin
California to Washington 82,939 N/S
Pantropical spotted dolphin Hawaii N/A N/S
Risso's dolphin California to Washington 22,388 N/S
Risso's dolphin Hawaii N/A N/S
Rough-toothed dolphin Hawaii N/A N/S
Spinner dolphin Hawaii 677 N/S
Spotted dolphin
E. Tropical Pacific, coastal 22,500 N/S
The Gulf of Mexico ecosystem, "America's inland sea," is fed by warm tropical waters of the Caribbean, which enter through the Yucatan Straits (Fig. 27). This flow develops into the Loop Current and a number of associated eddies in the gulf (Fig. 2). Part of the water entering the gulf bends to the east, flows through the
Page 34 of 186Marine Resources
1/26/2007http://biology.usgs.gov/s+t/SNT/noframe/mr181.htm

Straits of Florida, and joins the Florida Current. Some of the water flows farther north into the gulf and then veers to the east to form a clockwise gyre off west Florida. The remaining water turns west, traverses most of the width of the gulf, and contributes to a complex series of anticyclonic warm eddies that eventually exit through the Florida Straits, form the Florida Current, and flow into the Atlantic Ocean. There the water forms the Gulf Stream as it moves northward, carrying its warm waters along the South Atlantic coast (Rabalais and Boesch 1987). The circulation, hydrographic conditions, and productivity of the South Atlantic Bight are influenced by these Gulf Stream waters, which follow the shelf edge from the Straits of Florida to Cape Hatteras.
Spotted dolphin
E. Tropical Pacific, northeastern
648,900 D
Spotted dolphin
E. Tropical Pacific, west/south
1,145,100 N/S
Striped dolphin California to Washington 19,248 N/S
Striped dolphin E. Tropical Pacific 1,745,900 N/S
Striped dolphin Hawaii N/A N/S
Whitebelly spinner dolphin
E. Tropical Pacific 872,000 N/S
Dall's porpoise California to Washington 34,393 N/S
Harbor porpoise
Central California 3,431 N/S
Harbor porpoise N. California 7,640 N/S
Harbor porpoise
Oregon to Washington, coast
22,046 N/S
Harbor porpoise
Washington, inland 2,681 N/S
aN/A = not available or not determined.bN/S = no special status under the Endangered Species Act/ Marine Mammal Protection Act; D = depleted; T = threatened; E = endangered; and * = Marine Mammal Protection Act strategic stock because human-caused take exceeds potential biological removal.
The Southeast shelf ecosystem is characterized by bays and sounds with extensive coastal marshes. These wetlands form unique habitats that provide important links to production of living marine resources. The Southeast shelf ecosystem accounts for almost 145,040 square
Page 35 of 186Marine Resources
1/26/2007http://biology.usgs.gov/s+t/SNT/noframe/mr181.htm

kilometers of estuarine drainage, extending from the temperate latitudes of North Carolina to the tropics of southern Florida and the northern Gulf of Mexico (National Oceanic and Atmospheric Administration 1990a). The largest estuary of the Southeast shelf is the combined Albemarle and Pamlico sounds. The Gulf of Mexico ecosystem accounts for more than 248,640 square kilometers of estuarine drainage, extending from south Florida to the Texas-Mexico border. Major features include the Mississippi and Atchafalaya deltas, which form a complex web of estuarine channels and extensive coastal wetlands that are important habitat for many fisheries. This region has the largest estuarine drainage area of all the U.S. regions. The fluvial drainage areas of the Mississippi and Atchafalaya rivers receive water from more than half of the contiguous United States. This drainage system creates tremendous freshwater flow into estuaries, accounting for about half of all the water discharged to U.S. estuaries.
Page 36 of 186Marine Resources
1/26/2007http://biology.usgs.gov/s+t/SNT/noframe/mr181.htm
Although wetlands are extensive in the Southeast region, an estimated 1,295 square kilometers of these wetlands were lost each year between the mid-1950's and late 1970's (Day and Craig 1981) because of sea-level rise, land subsidence, and human alterations such as channelization of estuaries, canal dredging through wetlands to accommodate oil and gas production, and impoundments (see chapter on Coastal Louisiana). The dense swamps and marshes of much of the region historically restricted coastal development. However, draining of wetlands uncovered an immensely fertile soil that expanded agricultural activity, particularly in the Mississippi delta and areas near the Florida Everglades. Conflicts over multiple uses of resources abound in this region, where the major population centers are growing rapidly. The Southeast's human population is expected to grow by almost 26% over the next 20 years, a faster rate than most other coastal regions in the country (Culliton et al. 1990).
Page 37 of 186Marine Resources
1/26/2007http://biology.usgs.gov/s+t/SNT/noframe/mr181.htm

Primary and Secondary Production
Primary and secondary production are enhanced by upwelling. Upwellings of the tropical and lower temperate waters of the Southeast shelf ecosystem, however, are not as intense and evident as in the higher latitude regions. More important to production in this ecosystem is the role of ichthyoplankton, the component of plankton made up of larval fishes. In the Gulf of Mexico ecosystem, four distinct groups of ichthyoplankton species have been identified: estuarine-dependent, coastal, reef (local or tropical), and oceanic. The general life history pattern of the estuarine-dependent species of the Gulf of Mexico and Southeast shelf ecosystems is characterized by fish that spawn in shallow (less than 200 meters), nearshore waters, with postlarval and juvenile stages inhabiting estuaries. How well the larvae survive--and how effectively they are recruited to estuarine nursery areas--is largely controlled by tides, prevailing winds, and surface currents.
Fig. 23. The fin whale, the most abundant large cetacean in the western North Atlantic. Courtesy Cetacean and Turtle Assessment Program, University of Rhode Island
The coastal species are a
Page 38 of 186Marine Resources
1/26/2007http://biology.usgs.gov/s+t/SNT/noframe/mr181.htm

diverse group of finfish and shellfish that complete all or most of their life cycle in the open ocean or deepwater realms associated with the continental shelf. This group is believed to undergo extreme fluctuations in abundance, probably in response to changes in environmental conditions on the shelf. The locations of principal spawning areas of coastal species and the factors that may determine the species' reproductive success and ultimate recruitment are poorly known. Because spawning usually occurs in shelf waters, major oceanic phenomena, such as gravity-oriented current boundaries or eddies, and riverine fronts may offer key microhabitats for successful reproduction and recruitment of coastal species.
Fig. 24. Sightings of the fin whale from 1966 to 1989 (n = 3,858) in the Northeast region. The 2,000-meter depth contour defines the boundary of the survey area. During the peak spring summer feeding season, there may be between 2,500 and 3,000 fin whales in the Northeast region waters. Modified from Hain et al. (1992). Strandings and floaters are dead whales found ashore or at sea.
The reef species in the Southeast region spawn virtually continuously, maximizing the potential recruitment of young to a reef. For many reef fishes and invertebrates, spawning is believed to be related to lunar--thus tidal--conditions in a regular fashion that promotes local retention of larvae. Recruitment has
Page 39 of 186Marine Resources
1/26/2007http://biology.usgs.gov/s+t/SNT/noframe/mr181.htm

been thought to vary little, regulated more by the availability of suitable habitat than by oceanic conditions or number of spawning stock. The oceanic species spend their entire life cycles in the oceanic waters of the Gulf of Mexico and the South Atlantic.
Recent studies indicate that species richness of ichthyoplankton in the Gulf of Mexico ecosystem--in these very different groups--is among the highest of all regions currently reported. A recent gulfwide study by Richards et al. (1993) documented 100 families, including many deepwater species, taken in 87 plankton tows along the boundary of the Loop Current, the major hydrographic feature in the Gulf of Mexico. The boundary was determined by real-time satellite images of the Loop Current.
Fig. 25. Sperm whales in deep water over the continental slope just south of Georges Bank. Courtesy Cetacean and Turtle Assessment Program, University of Rhode Island
Benthic Resources
Most studies of the benthic community in the Gulf of Mexico and Southeast shelf ecosystems have been concerned with the characterization of the fauna. Patterns of community composition (Harper and
Fig. 26. The white-sided dolphin is the most abundant dolphin in continental shelf waters of the northeastern United States. Courtesy Cetacean and Turtle Assessment Program, University of Rhode Island
Page 40 of 186Marine Resources
1/26/2007http://biology.usgs.gov/s+t/SNT/noframe/mr181.htm

McKinney 1980; Baker et al. 1981) vary by substrate and by factors associated with the depth gradient, such as temperature and temperature variability, freshwater plumes, changes in sediment particle sizes, and the decreasing effects of wind-forced hydraulic factors, including hurricanes (Tenore 1979). The soft-bottom communities are generally dominated by polychaete worms (47%-51%), crustaceans (28%-29%), and mollusks (10%-17%). Hard-bottom communities are characterized by animals and plants living on the bottom surface, including macroalgae, coralline algae, sponges, soft coral, and often patches of the fungus Agaricia. Other areas of soft-bottom sands may be covered with layers of coralline algae nodules or with an algal nodule pavement with Agaricia accumulations (Woodward-Clyde Consultants and Continental Shelf Association, Inc., 1983). Characteristically, the benthic fauna of the north inner shelf is an extension of the warm temperate Carolinian province, with divisions at the Rio Grande and east of the Mississippi delta. The southern portion of the South Texas Continental Shelf is inhabited by a more tropical Caribbean fauna. The fauna of the outer shelf of the northwestern gulf has more definite tropical affinities than those of the warm temperate inner shelf.
Overall, the mollusk populations (oysters, clams, conchs, and so forth) in the Southeast region have declined from the levels of 100 years ago. Much of this decline is attributed to disease, overexploitation, and habitat degradation. Habitat degradation is best measured by an index developed by Engle et al. (1994), which is designed for broad spatial generalizations of ecological conditions. Benthic data from selected
Fig. 27. Color satellite photo showing surface water temperature profiles for the Gulf of Mexico, as detected by a National Oceanic and Atmospheric Administration satellite.
Page 41 of 186Marine Resources
1/26/2007http://biology.usgs.gov/s+t/SNT/noframe/mr181.htm