markers, mapping, and expression using arrays justin borevitz salk institute naturalvariation.org
Post on 20-Dec-2015
223 views
TRANSCRIPT

Markers, mapping, and expression using arrays
Justin BorevitzSalk Institutenaturalvariation.org

Talk Outline
• Intro Natural Variation/ QTL
• Transcription profiling to identify QTL candidate genes
• Identification of Single Feature Polymorphisms
• Future Prospects


PHYB


differences may be due to expression or hybridization

Deletions

Spatial Correction
Spatial Artifacts
Improved reproducibility


False Discovery and Sensitivity
PM only
SAM threshold
5% FDR
GeneChip SFPs nonSFPs Cereon marker accuracy 3806 89118 100% Sequence 817 121 696 Sensitivity
Polymorphic 340 117 223 34% Non-polymorphic 477 4 473
False Discovery rate: 3% Test for independence of all factors: Chisq = 177.34, df = 1, p- value = 1.845e- 40 SAM threshold 18% FDR
GeneChip SFPs nonSFPs Cereon marker accuracy 10627 82297 100% Sequence 817 223 594 Sensitivity
Polymorphic 340 195 145 57% Non-polymorphic 477 28 449
False Discovery rate: 13% Test for independence of all factors: Chisq = 265.13, df = 1, p-value = 1.309e-59
90% 80% 70%
41% 53% 85%
90% 80% 70%
67% 85% 100%
Cereonmay be asequencingError
TIGRmatch isa match


Chip genotyping of a Recombinant Inbred Line
29kb interval


bibb mutant phenotypes
Col bib-1 det2-1
23 days
bib-3
• three independent recessive alleles • medial sepals remain attached• “cabbage-like” rosette leaves • flowers open prematurely• fruit appear more slender
bib-3
Ler
bib-3

bibb mapping
ChipMapAS1
Bulk segregantMapping usingChip hybridization
bibb maps toChromosome2 near ASYMETRIC LEAVES1

BIBB=AS1
Sequenced AS1 coding region from bib-1…found g -> a change that would introduce a stop codon in the MYB domain
bibb as1-101
MYB
bib-1W49*
as-101Q107*
as1bibb
• AS1 (ASYMMETRIC LEAVES1) =MYB closely related to PHANTASTICAlocated at 64cM

Future Bulk segregant Mapping
Extend to Quantitative Traits
Map multiple genes (mutation modifiers)
Fine mapping after PCRidentification of recombinants
Multiple models(epistasis)
Changes in allele F2, F3frequency (selection)
20% variance
20 simulations

Potential Deletions
111 potential deletions45 confirmed by Ler sequence
23 (of 114) transposons
Disease Resistance(R) gene clusters
Single R gene deletions
Genes involved in Secondary metabolism
Unknown genes


Gene expression revisited
• Now that we know what features are polymorphic we can determine which gene expression differences are real and which are due to polymorphism.
• New RNA analysis algorithm—
account for spatial correction, polymorphisms, and feature differences

Genes Expression for a candidate gene
Features (probes) for At1g22360
Spa
tially
cor
rect
ed lo
g P
M in
tens
ity
Gene Expression index that accounts for feature differences and polymorphisms

Gene expression revisited
0.02 1464 2913.6 -1449.6 1.990164 0.04 831 1067.5 -236.5 1.284597 0.06 409 390.8 18.2 0.9555012 0.08 242 160.2 81.8 0.6619835 0.1 171 73.6 97.4 0.4304094 0.12 131 35.4 95.6 0.270229 0.14 96 20.6 75.4 0.2145833 0.16 60 12.2 47.8 0.2033333 0.18 44 8.2 35.8 0.1863636 0.2 41 6.2 34.8 0.1512195
SAM True False Difference FDR threshold Positive Positive

Gene expression revisited
FLC controls flowering time
Difference detected at 3 day old seedling stage

Gene expression revisited
PAG1 down regulated in Cvi pag1 Knock Out is pale

pag1 KO is light insensitive
pag1 KO has long hypocotyl in red light

pag1 KO is early flowering

25 bp 25 bp
25 bp 25 bp16 bp
25 bp 25 bp8 bp
1st Set
2nd Set
3rd Set
Complete Genome Tiling Chip
Polymorphisms (re-sequencing)Global methylation (Methylome)Comparative Genomics (Brassica)
New Gene DiscoveryImprove AnnotationAlternative SplicingMicro RNAs
9 Whole-Genome Expression Chips2 Splicing Chips2 5’ Mapping Chips
Validate features
Extra Chips:
ChIP – Chip (DNA binding sites)

ChipViewer: Mapping of transcriptional units of ORFeome
From 2000v At1g09750 (MIPS) to the latest AGI At1g09750
2000 v Annotation (MIPS)
The latest AGI Annotation

SyngentaHur-Song ChangTong Zhu
NaturalVariation.orgNaturalVariation.orgSalkJon WernerTodd MocklerSarah LiljegrenJoanne ChoryDetlef WeigelJoseph Ecker
UC DavisJulin Maloof
UC San DiegoCharles Berry
ScrippsElizabeth Winzeler
SalkJon WernerTodd MocklerSarah LiljegrenJoanne ChoryDetlef WeigelJoseph Ecker
UC DavisJulin Maloof
UC San DiegoCharles Berry
ScrippsElizabeth Winzeler

Future Projects
Design 2nd generation expression array $200
350,000 25mer features, expect 12,000 SFPs (2accessions)Validated gene models (exon intron)2 features per exon, alternative splicing5’ 3’ Untranslated region for gene family/ polymorphismMicro RNAsValidated “good” hybridization intensities
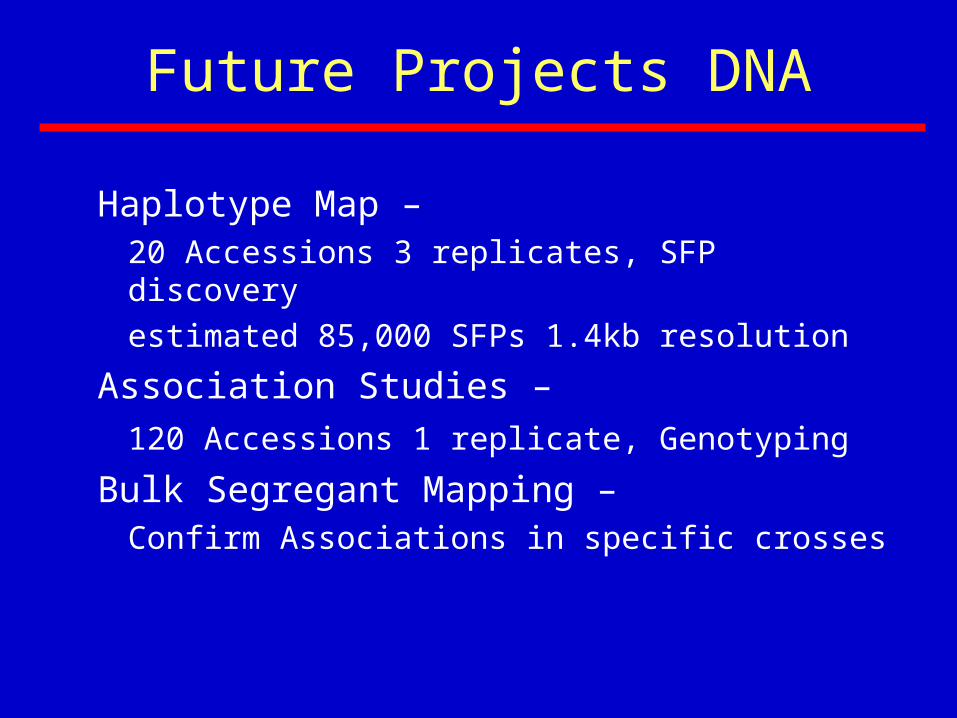
Haplotype Map –20 Accessions 3 replicates, SFP discovery
estimated 85,000 SFPs 1.4kb resolution
Association Studies –
120 Accessions 1 replicate, Genotyping
Bulk Segregant Mapping –Confirm Associations in specific crosses
Future Projects DNA

Future work with Natural Variation
• VanC advanced intercross RIL population• Backcross collections

True natural variation in gene expression20 Accessions 3 replicates, (polymorphism accounted for)
Cis regulatory variation/ Imprintingreciprocal F1s 3 replicates
Transcriptome QTL Map –100 best VanC Advanced Intercross Lines
How many loci control the variation in gene transcription? Candidate TF and binding sites?
Future Projects RNA