high resolution patterns of variation in the arabidopsis genome justin borevitz university of...
Post on 20-Dec-2015
214 views
TRANSCRIPT

High Resolution Patterns of Variationin the Arabidopsis Genome
Justin BorevitzUniversity of Chicagonaturalvariation.org


Talk Outline
• Single Feature Polymorphisms (SFPs)– Potential deletions
• Bulk Segregant Mapping– Extreme Array Mapping
• Haplotype analysis
• Patterns in gene Families
• New Arrays
• Aquilegia

What is Array Genotyping?
• Affymetrix expression GeneChips contain 202,806 unique 25bp oligo nucleotides.
• 11 features per probset for 21546 genes• New array’s have even more• Genomic DNA is randomly labeled with
biotin, product ~50bp.• 3 independent biological replicates
compared to the reference strain Col
GeneChip

Potential Deletions

Spatial Correction
Spatial Artifacts
Improved reproducibilityNext: Quantile Normalization


False Discovery and Sensitivity
PM only
SAM threshold
5% FDR
GeneChip SFPs nonSFPs Cereon marker accuracy 3806 89118 100% Sequence 817 121 696 Sensitivity
Polymorphic 340 117 223 34% Non-polymorphic 477 4 473
False Discovery rate: 3% Test for independence of all factors: Chisq = 177.34, df = 1, p-value = 1.845e-40 SAM threshold 18% FDR
GeneChip SFPs nonSFPs Cereon marker accuracy 10627 82297 100% Sequence 817 223 594 Sensitivity
Polymorphic 340 195 145 57% Non-polymorphic 477 28 449
False Discovery rate: 13% Test for independence of all factors: Chisq = 265.13, df = 1, p-value = 1.309e-59
3/4 Cvi markers were also confirmed in PHYB
90% 80% 70%
41% 53% 85%
90% 80% 70%
67% 85% 100%
Cereonmay be asequencingError
TIGRmatch isa match

Chip genotyping of a Recombinant Inbred Line
29kb interval
Discovery 6 replicates X $500 12,000 SFPs = $0.25Typing 1 replicate X $500 12,000 SFPs = $0.041

Potential Deletions
>500 potential deletions45 confirmed by Ler sequence
23 (of 114) transposons
Disease Resistance(R) gene clusters
Single R gene deletions
Genes involved in Secondary metabolism
Unknown genes

Potential Deletions Suggest Candidate Genes
FLOWERING1 QTL
Chr1 (bp)
Flowering Time QTL caused by a natural deletion in MAF1
MAF1
MAF1 natural deletion

Fast Neutron deletions
FKF1 80kb deletion CHR1 cry2 10kb deletion CHR1
Het

Map bibb100 bibb mutant plants100 wt mutant plants

bibb mapping
ChipMapAS1
Bulk segregantMapping usingChip hybridization
bibb maps toChromosome2 near ASYMETRIC LEAVES1

BIBB = ASYMETRIC LEAVES1
Sequenced AS1 coding region from bib-1 …found g -> a change that would introduce a stop codon in the MYB domain
bibb as1-101
MYB
bib-1W49*
as-101Q107*
as1bibb
AS1 (ASYMMETRIC LEAVES1) =MYB closely related toPHANTASTICA located at 64cM

0 20 40 60 80 100
-0.2
-0.1
0.0
0.1
0.2
arr90mut
cM Chromosome 1
alle
le fr
eque
ncy
0 20 40 60 80
-0.2
-0.1
0.0
0.1
0.2
arr90mut
cM Chromosome 2
alle
le fr
eque
ncy
0 20 40 60 80
-0.2
-0.1
0.0
0.1
0.2
arr90mut
cM Chromosome 3
alle
le fr
eque
ncy
0 20 40 60
-0.2
-0.1
0.0
0.1
0.2
arr90mut
cM Chromosome 4
alle
le fr
eque
ncy
0 20 40 60 80 100
-0.2
-0.1
0.0
0.1
0.2
arr90mut
cM Chromosome 5
alle
le fr
eque
ncy
0 20 40 60 80 100
-0.4
-0.2
0.0
0.2
0.4
arr21mut
cM Chromosome 1
alle
le fr
eque
ncy
0 20 40 60 80
-0.4
-0.2
0.0
0.2
0.4
arr21mut
cM Chromosome 2
alle
le fr
eque
ncy
0 20 40 60 80
-0.4
-0.2
0.0
0.2
0.4
arr21mut
cM Chromosome 3
alle
le fr
eque
ncy
0 20 40 60-0
.4-0
.20.
00.
20.
4
arr21mut
cM Chromosome 4
alle
le fr
eque
ncy
0 20 40 60 80 100
-0.4
-0.2
0.0
0.2
0.4
arr21mut
cM Chromosome 5
alle
le fr
eque
ncy
arythmic90Gene clonedSam Hazen
arythmic21Allelic to arr90Sam Hazen

stamenstayLerSarah LiljegrenMapping confirmed
0 20 40 60 80 100
-0.5
0.0
0.5
stamenstaymut
cM Chromosome 1
alle
le fr
eque
ncy
0 20 40 60 80
-0.5
0.0
0.5
stamenstaymut
cM Chromosome 2
alle
le fr
eque
ncy
0 20 40 60 80
-0.5
0.0
0.5
stamenstaymut
cM Chromosome 3
alle
le fr
eque
ncy
0 20 40 60
-0.5
0.0
0.5
stamenstaymut
cM Chromosome 4
alle
le fr
eque
ncy
0 20 40 60 80 100
-0.5
0.0
0.5
stamenstaymut
cM Chromosome 5
alle
le fr
eque
ncy

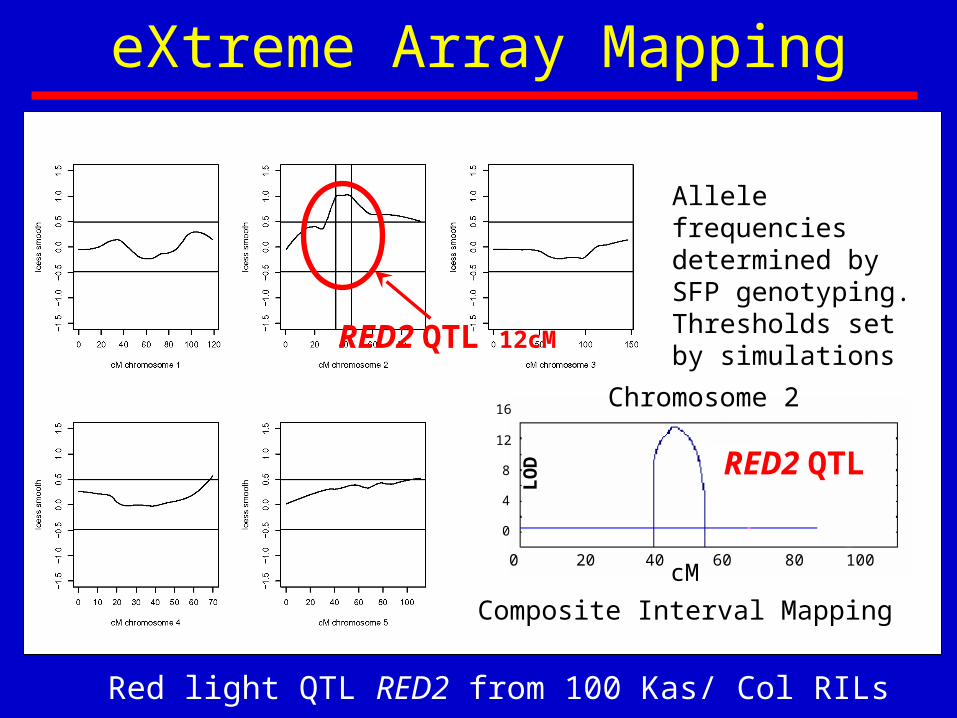
eXtreme Array Mapping
Histogram of Kas/Col RILs Red light
hypocotyl length (mm)
cou
nts
6 8 10 12 14
02
46
81
01
2
15 tallest RILs pooled vs15 shortest RILs pooled
LOD
eXtreme Array Mapping
Allele frequencies determined by SFP genotyping. Thresholds set by simulations
0
4
8
12
16
0 20 40 60 80 100cM
LO
D
Composite Interval Mapping
RED2 QTL
Chromosome 2
RED2 QTL 12cM
Red light QTL RED2 from 100 Kas/ Col RILs

Array Haplotyping
• What about Diversity/selection across the genome?
• A genome wide estimate of population genetics parameters, θw, π, Tajima’D, ρ
• LD decay, Haplotype block size
• Deep population structure?
• Col, Lz, Ler, Bay, Shah, Cvi, Kas, C24,
Est, Kin, Mt, Nd, Sorbo, Van, Ws2
C c c c C c C j j j j j j L L L B B B S S C C C k k c c E E E K K M M M N N N S S S v v V WWW
Cc
cc
Cc
Cj
jj
jj
jL
LL
BB
BS
SC
CC
kk
cc
EE
EK
KM
MM
NN
NS
SS
vv
VW
WW
o o o o o o o w w w w w w e e e a a a h h v v v a a 2 2 s s s e e t t t d d d o o o a a a s s s
oo
oo
oo
ow
ww
ww
we
ee
aa
ah
hv
vv
aa
22
ss
se
et
tt
dd
do
oo
aa
as
ss
l l l l l l l C C C L L L r r r y y y a a i i i s s 4 4 t t t n n 0 0 0 - - - r r r n n n - - -
ll
ll
ll
lC
CC
LL
Lr
rr
yy
ya
ai
ii
ss
44
tt
tn
n0
00
--
-r
rr
nn
n-
--
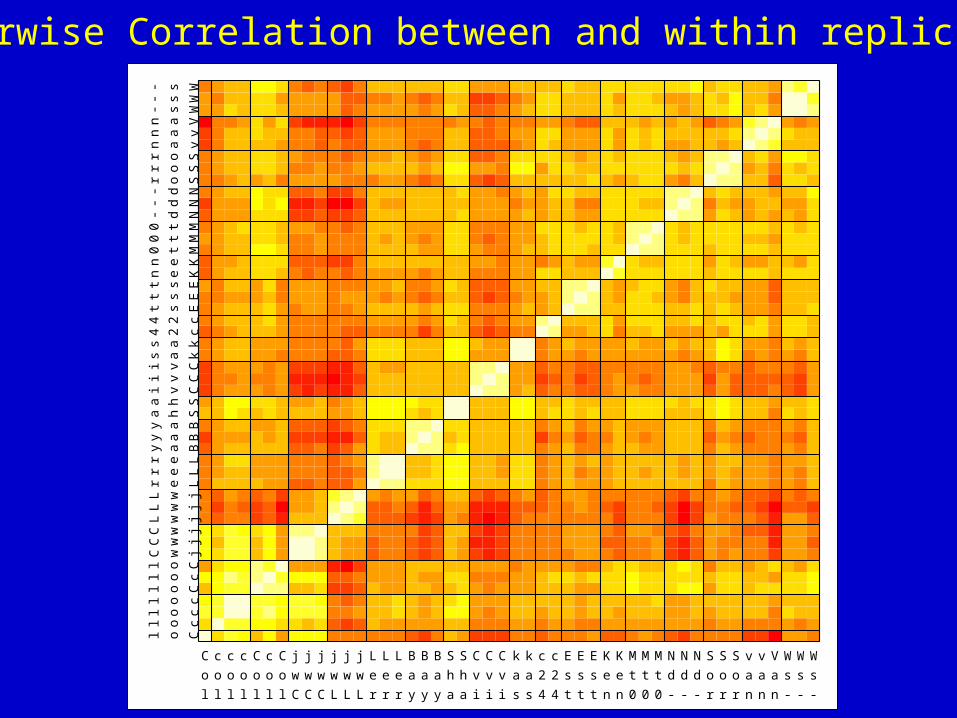
Pairwise Correlation between and within replicates

Array Haplotyping
Inbred lines
Low effectiverecombinationdue to partialselfing
Extensive LDblocks
Col Ler Cvi Kas Bay Shah Lz Nd
Chr
omos
ome1
~50
0kb

(-4,-3.5] (-3,-2.5] (-2,-1.5] (-1,-0.5] (0,0.5] (1,1.5] (2,2.5] (3,3.5]
T statistic
fre
qu
en
cy
0
e+
00
4
e+
04
8
e+
04
Distribution of T-stats
null (permutation)actual
Not Col ColNA NA duplications
32,427Calls
208,729
12,250 SFPs

Accession FDR Sensitivity SNP Totalbay 0.0% 43% 51 563c24 0.2% 39% 64 580cvi 0.0% 38% 91 543est 0.0% 59% 39 548kas 1.9% 44% 66 577kendl 3.1% 33% 57 545ler 0.0% 49% 43 562lz 0.0% 53% 51 573mt 0.2% 61% 49 570nd 0.0% 47% 49 568shah 0.0% 24% 80 548sorbo 0.0% 45% 55 526van 0.2% 29% 92 571ws2 0.0% 49% 57 514
Sequence confirmation of SFPs

SFPs for reverse genetics
http://naturalvariation.org/sfp
14 Accessions 30,950 SFPs`

Chromosome Wide Diversity

Diversity 50kb windows

Tajima’s D like 50kb windows
RPS4 unknown

R genes vs bHLH Theta W
RPS4

Rgenes vs bHLH Tajimas’ D
RPS4

R genes vs bHLH

RNA DNA
Universal Whole Genome Array
Transcriptome AtlasExpression levelsTissues specificity
Transcriptome AtlasExpression levelsTissues specificity
Gene DiscoveryGene model correctionNon-coding/ micro-RNAAntisense transcription
Gene DiscoveryGene model correctionNon-coding/ micro-RNAAntisense transcription
Alternative SplicingAlternative Splicing Comparative GenomeHybridization (CGH)
Insertion/Deletions
Comparative GenomeHybridization (CGH)
Insertion/Deletions
MethylationMethylation
ChromatinImmunoprecipitation
ChIP chip
ChromatinImmunoprecipitation
ChIP chip
Polymorphism SFPsDiscovery/Genotyping
Polymorphism SFPsDiscovery/Genotyping
~35 bp tile, non-repetitive regions, “good” binding oligos, evenly spaced

ChipViewer: Mapping of transcriptional units of ORFeome
From 2000v At1g09750 (MIPS) to the latest AGI At1g09750
2000 v Annotation (MIPS)
The latest AGI Annotation

SNP SFP MMMMM MSFP
SFP
MMMMM M
Chromosome (bp)
con
serv
atio
n
SNP
ORFa
start AAAAA
Tra
nsc
ripto
me
Atla
s
ORFb
deletion
Improved Genome Annotation

Review
• Single Feature Polymorphisms (SFPs) can be used to
• Potential deletions (candidate genes)
• Identify recombination breakpoints
• eXtreme Array Mapping
• Haplotyping
• Diversity/Selection
• Association Mapping

Aquilegia (Columbines)
Recent adaptive radiation, 350Mb genome

NSF Genome Complexity
• 35,000 ESTs 5’ and 3’
• 350 arrays, RNA and genotyping– High density SFP Genetic Map
• Physical Map (BAC tiling path)– Physical assignment of ESTs
• QTL for pollinator preference – and abiotic stress– QTL fine mapping/ LD mapping
• Develop transformation techniques
NSF Genome Complexity
Scott Hodges (UCSB)
Elena Kramer (Harvard)
Magnus Nordborg (USC)
Justin Borevitz (U Chicago)
Jeff Tompkins (Clemson)

NaturalVariation.orgNaturalVariation.orgSalk
Jon WernerSarah LiljegrenHuaming ChenJoanne ChoryDetlef WeigelJoseph Ecker
UC San Diego
Charles Berry
Scripps
Sam HazenElizabeth Winzeler
Salk
Jon WernerSarah LiljegrenHuaming ChenJoanne ChoryDetlef WeigelJoseph Ecker
UC San Diego
Charles Berry
Scripps
Sam HazenElizabeth Winzeler
University of Chicago
Xu ZhangEvadne Smith
Syngenta
Hur-Song ChangTong Zhu
UC Davis
Julin Maloof
University of Guelph, Canada
Dave Wolyn
Sainsbury Laboratory
Jonathan Jones
University of Chicago
Xu ZhangEvadne Smith
Syngenta
Hur-Song ChangTong Zhu
UC Davis
Julin Maloof
University of Guelph, Canada
Dave Wolyn
Sainsbury Laboratory
Jonathan Jones