arabidopsis - ijbs
TRANSCRIPT
The Protein Elicitor PevD1 Enhances Resistance to Pathogens and Promotes Growth in
Arabidopsis
Mengjie Liu, Najeeb Ullah Khan, Ningbo Wang, Xiufen Yang, Dewen Qiu*
(State Key Laboratory for Biology of Plant Diseases and Insect Pests, Institute of Plant Protection, Chinese Academy of Agricultural Sciences, Beijing, 100081, China)
*Corresponding author: Dewen Qiu, Institute of Plant Protection, Chinese Academy of Agricultural
Sciences, No.12 zhongguancun south street, Haidian district, Beijing, 100081, China. Phone:
86-10-62815924, email: [email protected]
.

Figure S1. Structural diagram of the recombinant vectors used to transfer the pevd1 gene. The sequence between the L-border and R-border, containing the gene coding for the PevD1 protein and the hygromycin resistance gene, both under the CaMV35s promoter, was inserted into the Arabidopsis genome
Figure S2. Plant height of WT and transgenic Arabidopsis L1 (A) and L6 (B) at the indicated times shown in days after sowing (das) and days after bolting (dab). All experiments were repeated three times, and the data presented are shown as the means ± SD of three independent experiments. The bars represent the standard deviation (n = 3). The asterisks indicate a significant difference between transgenic and WT Arabidopsis (Student's t-test: , P < 0.01).

Figure S3. The 23 most enriched (pcorrected < 0.05) Gene Ontology (GO) terms in transgenic and WT Arabidopsis (AtRNA_T vs AtRNA_W). Twenty GO terms belong to biological processes and another 3 GO terms belong to molecular functions. The values shown on the columns indicate the number of up-regulated or down-regulated genes involved in the corresponding GO terms. GO terms were sorted based on corrected p-values. x-axis: GO terms; left y-axis: corrected p-values; right y-axis: number of genes.

Figure S4. Scattered Plot of KEGG pathway terms of differentially expressed genes. Dot size represents the number of different genes and the color indicates the value of pcorrected.
Figure S5. The relative expression level of PR1 induced by B. cinerea (A) and Pst DC3000 (B) infection in WT and transgenic Arabidopsis. The Actin2 gene was used as an internal control to normalize the expression data. The bars represent the standard deviation (n = 3).
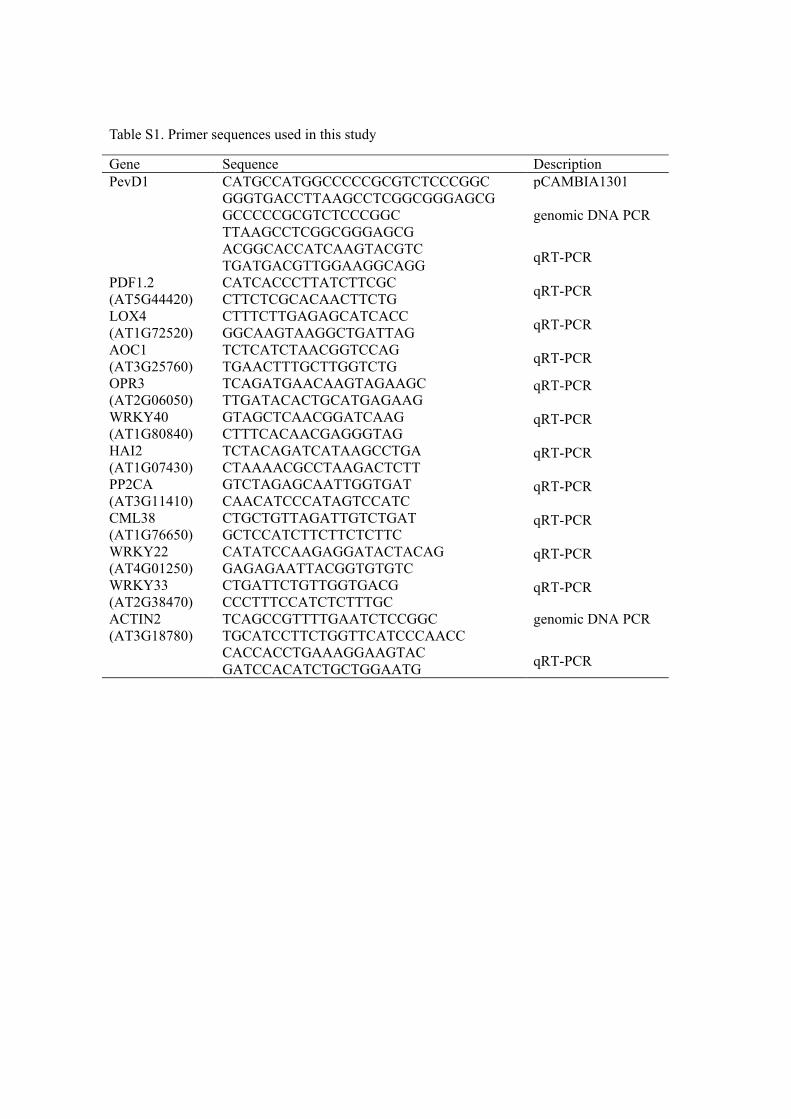
Table S1. Primer sequences used in this study
Gene Sequence Description PevD1 CATGCCATGGCCCCCGCGTCTCCCGGC pCAMBIA1301
GGGTGACCTTAAGCCTCGGCGGGAGCG GCCCCCGCGTCTCCCGGC genomic DNA PCR
TTAAGCCTCGGCGGGAGCG ACGGCACCATCAAGTACGTC qRT-PCR TGATGACGTTGGAAGGCAGG PDF1.2 (AT5G44420)
CATCACCCTTATCTTCGC qRT-PCR CTTCTCGCACAACTTCTG LOX4 (AT1G72520)
CTTTCTTGAGAGCATCACC qRT-PCR GGCAAGTAAGGCTGATTAG AOC1 (AT3G25760)
TCTCATCTAACGGTCCAG qRT-PCR TGAACTTTGCTTGGTCTG OPR3 (AT2G06050)
TCAGATGAACAAGTAGAAGC qRT-PCR TTGATACACTGCATGAGAAG
WRKY40 (AT1G80840)
GTAGCTCAACGGATCAAG qRT-PCR CTTTCACAACGAGGGTAG
HAI2 (AT1G07430)
TCTACAGATCATAAGCCTGA qRT-PCR CTAAAACGCCTAAGACTCTT
PP2CA (AT3G11410)
GTCTAGAGCAATTGGTGAT qRT-PCR CAACATCCCATAGTCCATC
CML38 (AT1G76650)
CTGCTGTTAGATTGTCTGAT qRT-PCR GCTCCATCTTCTTCTCTTC
WRKY22 (AT4G01250)
CATATCCAAGAGGATACTACAG qRT-PCR GAGAGAATTACGGTGTGTC
WRKY33 (AT2G38470)
CTGATTCTGTTGGTGACG qRT-PCR CCCTTTCCATCTCTTTGC
ACTIN2 (AT3G18780)
TCAGCCGTTTTGAATCTCCGGC genomic DNA PCR TGCATCCTTCTGGTTCATCCCAACC
CACCACCTGAAAGGAAGTAC qRT-PCR GATCCACATCTGCTGGAATG
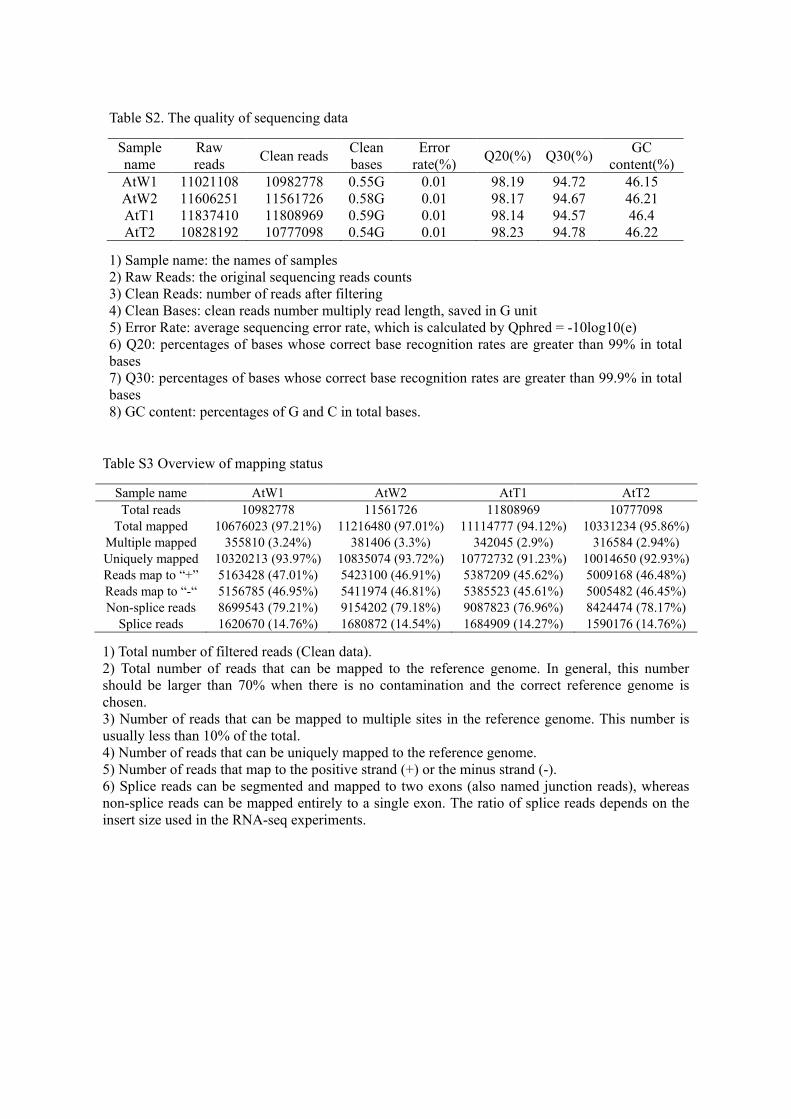
Table S2. The quality of sequencing data
Sample name
Raw reads Clean reads Clean
bases Error
rate(%) Q20(%) Q30(%) GC content(%)
AtW1 11021108 10982778 0.55G 0.01 98.19 94.72 46.15 AtW2 11606251 11561726 0.58G 0.01 98.17 94.67 46.21 AtT1 11837410 11808969 0.59G 0.01 98.14 94.57 46.4 AtT2 10828192 10777098 0.54G 0.01 98.23 94.78 46.22
1) Sample name: the names of samples 2) Raw Reads: the original sequencing reads counts 3) Clean Reads: number of reads after filtering 4) Clean Bases: clean reads number multiply read length, saved in G unit 5) Error Rate: average sequencing error rate, which is calculated by Qphred = -10log10(e) 6) Q20: percentages of bases whose correct base recognition rates are greater than 99% in total bases 7) Q30: percentages of bases whose correct base recognition rates are greater than 99.9% in total bases 8) GC content: percentages of G and C in total bases.
Table S3 Overview of mapping status
Sample name AtW1 AtW2 AtT1 AtT2 Total reads 10982778 11561726 11808969 10777098
Total mapped 10676023 (97.21%) 11216480 (97.01%) 11114777 (94.12%) 10331234 (95.86%) Multiple mapped 355810 (3.24%) 381406 (3.3%) 342045 (2.9%) 316584 (2.94%) Uniquely mapped 10320213 (93.97%) 10835074 (93.72%) 10772732 (91.23%) 10014650 (92.93%) Reads map to “+” 5163428 (47.01%) 5423100 (46.91%) 5387209 (45.62%) 5009168 (46.48%) Reads map to “-“ 5156785 (46.95%) 5411974 (46.81%) 5385523 (45.61%) 5005482 (46.45%) Non-splice reads 8699543 (79.21%) 9154202 (79.18%) 9087823 (76.96%) 8424474 (78.17%)
Splice reads 1620670 (14.76%) 1680872 (14.54%) 1684909 (14.27%) 1590176 (14.76%)
1) Total number of filtered reads (Clean data). 2) Total number of reads that can be mapped to the reference genome. In general, this number should be larger than 70% when there is no contamination and the correct reference genome is chosen. 3) Number of reads that can be mapped to multiple sites in the reference genome. This number is usually less than 10% of the total. 4) Number of reads that can be uniquely mapped to the reference genome. 5) Number of reads that map to the positive strand (+) or the minus strand (-). 6) Splice reads can be segmented and mapped to two exons (also named junction reads), whereas non-splice reads can be mapped entirely to a single exon. The ratio of splice reads depends on the insert size used in the RNA-seq experiments.
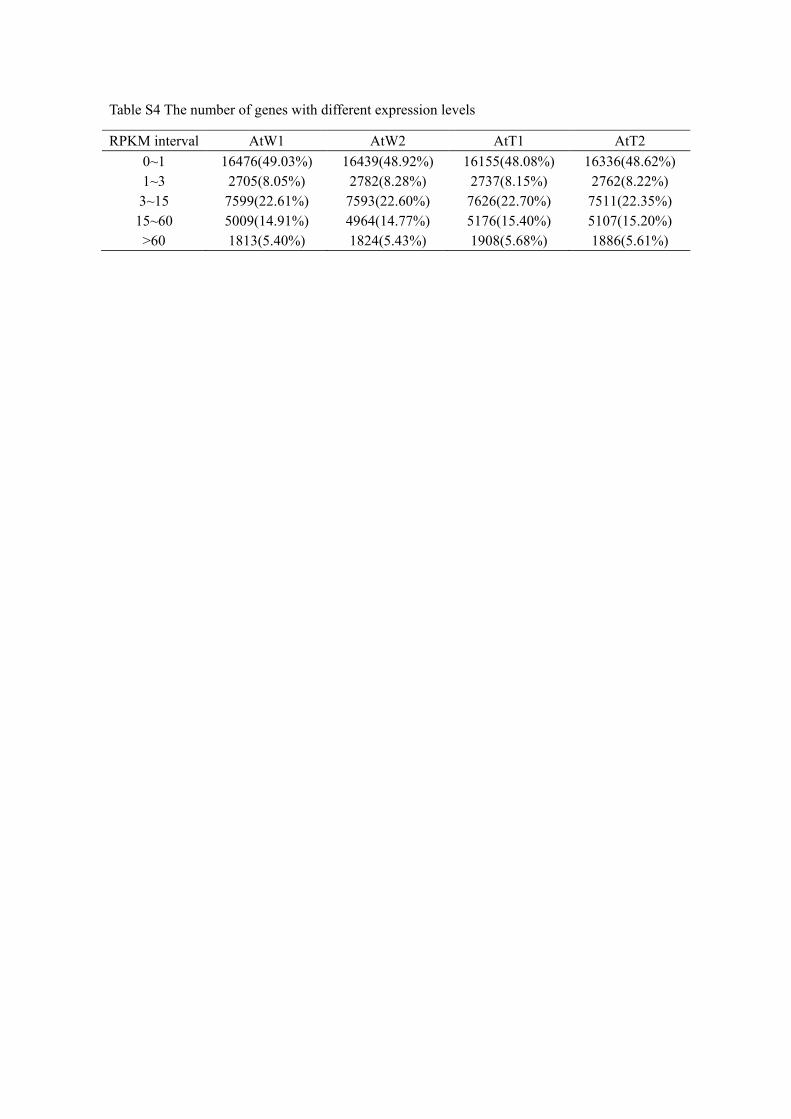
Table S4 The number of genes with different expression levels
RPKM interval AtW1 AtW2 AtT1 AtT2 0~1 16476(49.03%) 16439(48.92%) 16155(48.08%) 16336(48.62%) 1~3 2705(8.05%) 2782(8.28%) 2737(8.15%) 2762(8.22%) 3~15 7599(22.61%) 7593(22.60%) 7626(22.70%) 7511(22.35%)
15~60 5009(14.91%) 4964(14.77%) 5176(15.40%) 5107(15.20%) >60 1813(5.40%) 1824(5.43%) 1908(5.68%) 1886(5.61%)