root. (a) arabidopsis - plant cell · · 2014-12-24supplemental figure 1 – h2b-gfp expression...
TRANSCRIPT

Supplemental Data. Rosa et al. (2014). Plant Cell 10.1105/tpc.114.133793
1
Supplemental Figure 1 – H2B-GFP expression in Arabidopsis root.
(A) Arabidopsis root expressing H2B-GFP protein fusion in the different
developmental zones (M – division zone; EZ – elongation zone; DZ –
differentiation zone), scale bar represents 100 µm. (B) Cell division
showing complete incorporation of H2B-GFP in the chromatin. The nucleus
on the left is undergoing division while the one on the right is in G2 stage,
scale bar represents 5 µm.

Supplemental Data. Rosa et al. (2014). Plant Cell 10.1105/tpc.114.133793
2
Supplemental Figure 2 - Arabidopsis root meristem diagram.
A schematic diagram showing tissues in Arabidopsis root meristem. (adapted from
(Heo et al., 2011))
Supplemental Data. Rosa et al. (2014). Plant Cell 10.1105/tpc.114.133793
3
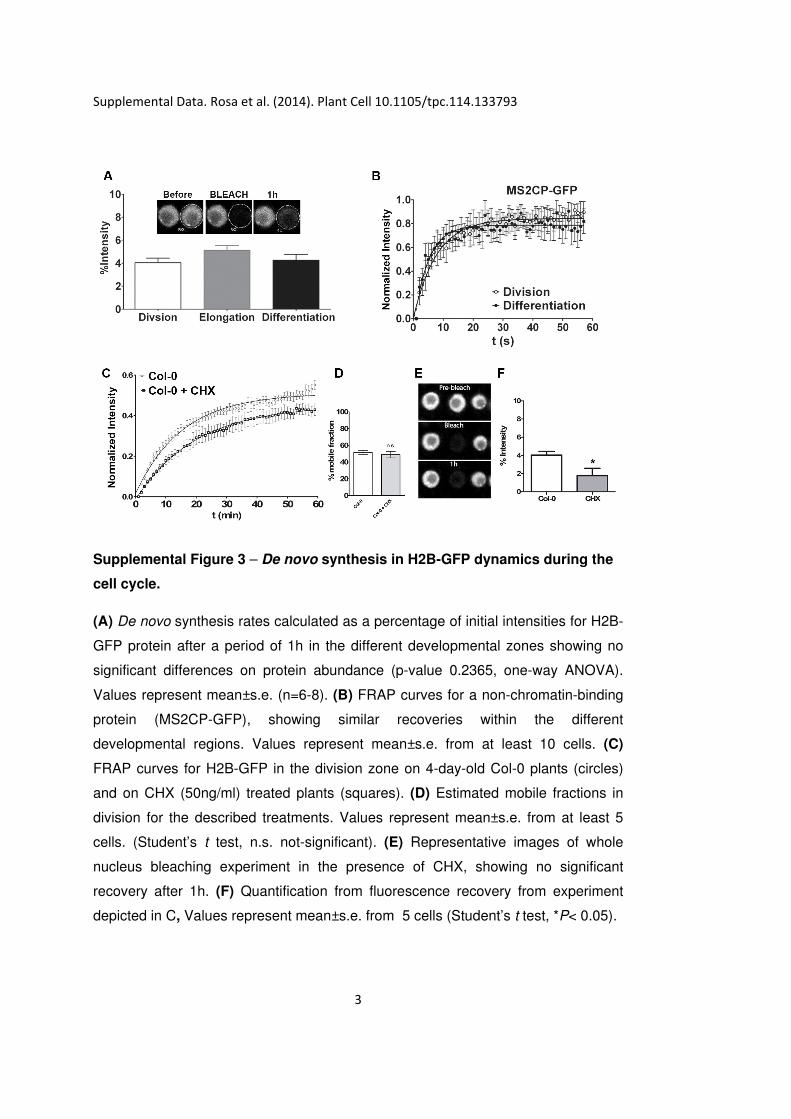
Supplemental Figure 3 – De novo synthesis in H2B-GFP dynamics during the
cell cycle.
(A) De novo synthesis rates calculated as a percentage of initial intensities for H2B-
GFP protein after a period of 1h in the different developmental zones showing no
significant differences on protein abundance (p-value 0.2365, one-way ANOVA).
Values represent mean±s.e. (n=6-8). (B) FRAP curves for a non-chromatin-binding
protein (MS2CP-GFP), showing similar recoveries within the different
developmental regions. Values represent mean±s.e. from at least 10 cells. (C)
FRAP curves for H2B-GFP in the division zone on 4-day-old Col-0 plants (circles)
and on CHX (50ng/ml) treated plants (squares). (D) Estimated mobile fractions in
division for the described treatments. Values represent mean±s.e. from at least 5
cells. (Student’s t test, n.s. not-significant). (E) Representative images of whole
nucleus bleaching experiment in the presence of CHX, showing no significant
recovery after 1h. (F) Quantification from fluorescence recovery from experiment
depicted in C, Values represent mean±s.e. from 5 cells (Student’s t test, *P< 0.05).
Supplemental Data. Rosa
Supplemental Figure 4
(A) FRAP data for H2A
zone (empty circles) and differentiati
fractions for H2A
of 60min in division zone (empty circles) and differentiation zone (black circles).
Estimated mobile fractions
Supplemental Data. Rosa
Supplemental Figure 4
FRAP data for H2A
zone (empty circles) and differentiati
fractions for H2A-GFP
of 60min in division zone (empty circles) and differentiation zone (black circles).
stimated mobile fractions
Supplemental Data. Rosa et al. (2014). Plant Cell
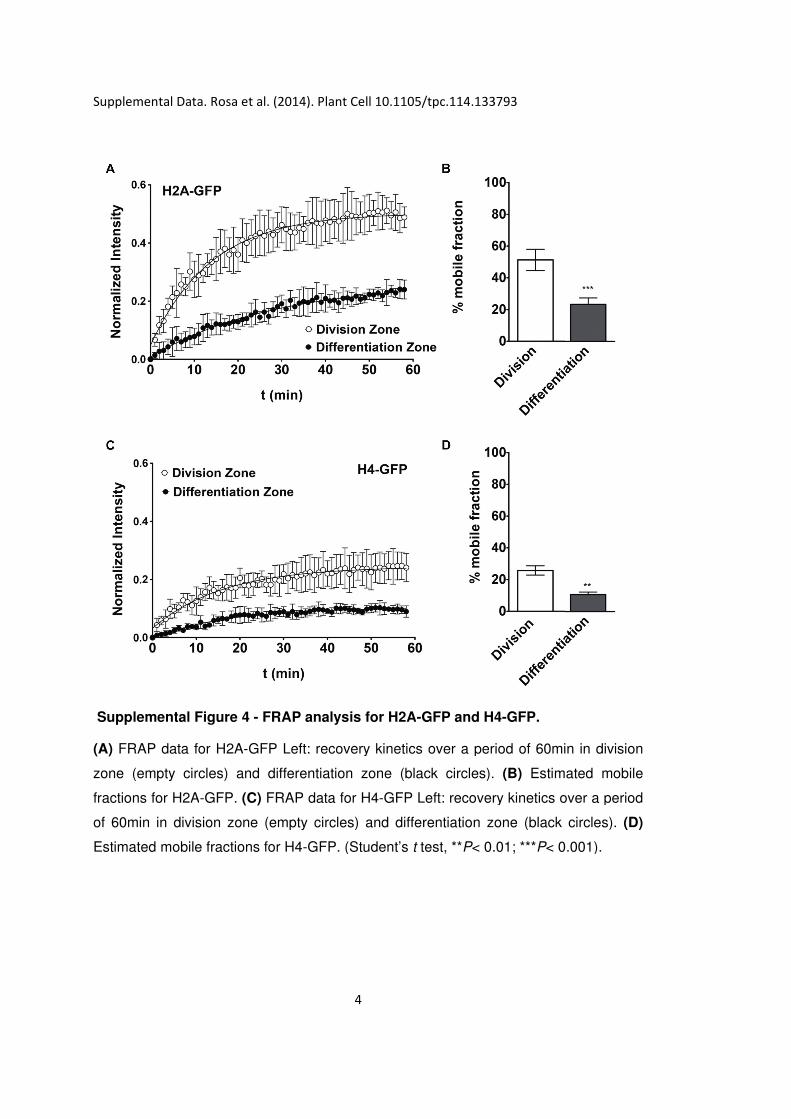
Supplemental Figure 4 - FRAP analysis for H2A
FRAP data for H2A-GFP Left: recovery kinetics over a period of 60min in division
zone (empty circles) and differentiati
GFP. (C) FRAP data for H4
of 60min in division zone (empty circles) and differentiation zone (black circles).
stimated mobile fractions for H4
et al. (2014). Plant Cell
FRAP analysis for H2A
GFP Left: recovery kinetics over a period of 60min in division
zone (empty circles) and differentiation zone (black circles).
FRAP data for H4
of 60min in division zone (empty circles) and differentiation zone (black circles).
for H4-GFP. (Student’s
et al. (2014). Plant Cell 10.1105/tpc.114
4
FRAP analysis for H2A-GFP and H4
GFP Left: recovery kinetics over a period of 60min in division
on zone (black circles).
FRAP data for H4-GFP Left: recovery kinetics over a period
of 60min in division zone (empty circles) and differentiation zone (black circles).
. (Student’s t test, **
10.1105/tpc.114.133793
GFP and H4
GFP Left: recovery kinetics over a period of 60min in division
on zone (black circles).
GFP Left: recovery kinetics over a period
of 60min in division zone (empty circles) and differentiation zone (black circles).
test, **P< 0.01; ***
133793
GFP and H4-GFP.
GFP Left: recovery kinetics over a period of 60min in division
on zone (black circles). (B) Estimated
GFP Left: recovery kinetics over a period
of 60min in division zone (empty circles) and differentiation zone (black circles).
< 0.01; ***P< 0.001).
GFP Left: recovery kinetics over a period of 60min in division
stimated mobile
GFP Left: recovery kinetics over a period
of 60min in division zone (empty circles) and differentiation zone (black circles). (D
< 0.001).
GFP Left: recovery kinetics over a period of 60min in division
mobile
GFP Left: recovery kinetics over a period
(D)
Supplemental Data. Rosa et al. (2014). Plant Cell 10.1105/tpc.114.133793
5
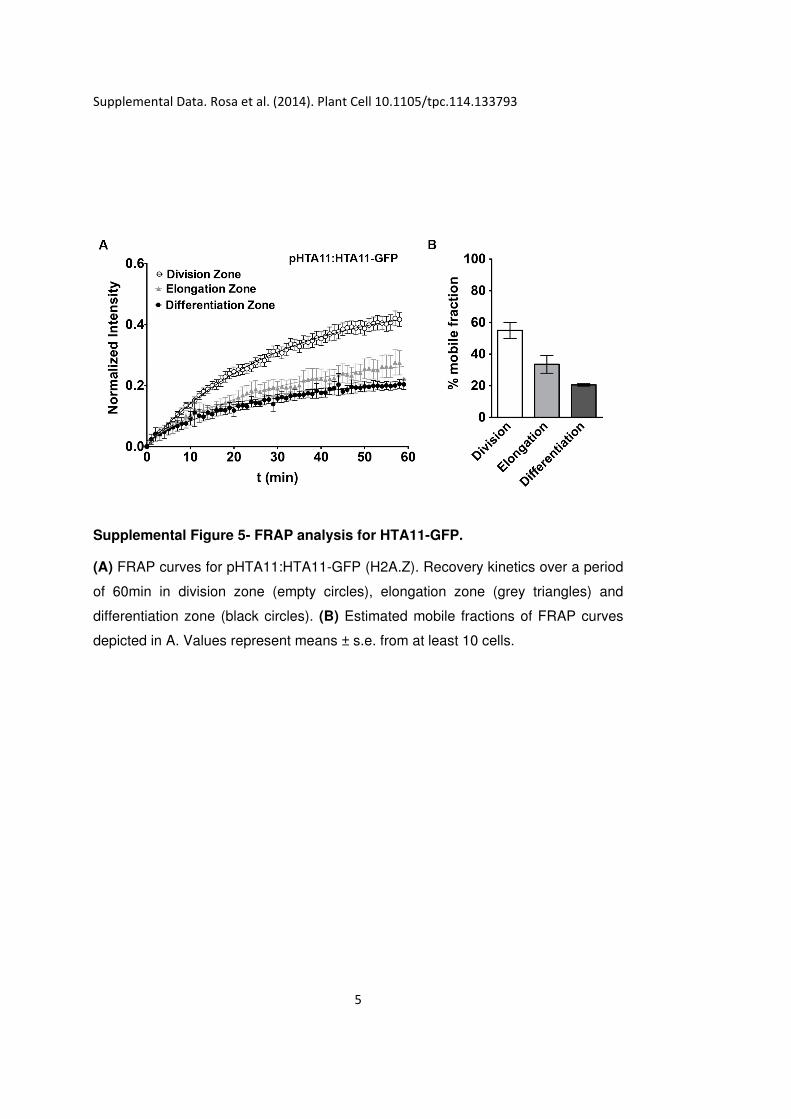
Supplemental Figure 5- FRAP analysis for HTA11-GFP.
(A) FRAP curves for pHTA11:HTA11-GFP (H2A.Z). Recovery kinetics over a period
of 60min in division zone (empty circles), elongation zone (grey triangles) and
differentiation zone (black circles). (B) Estimated mobile fractions of FRAP curves
depicted in A. Values represent means ± s.e. from at least 10 cells.
Supplemental Data. Rosa
Supplement
different developmental zones.
(A) Recovery kinetics over a period of 60min in division zone (empty circles),
elongation zone (grey circles) and differe
mobile fractions of division zone (white), elongation zone (grey circles) and
differentiation
Supplemental Data. Rosa
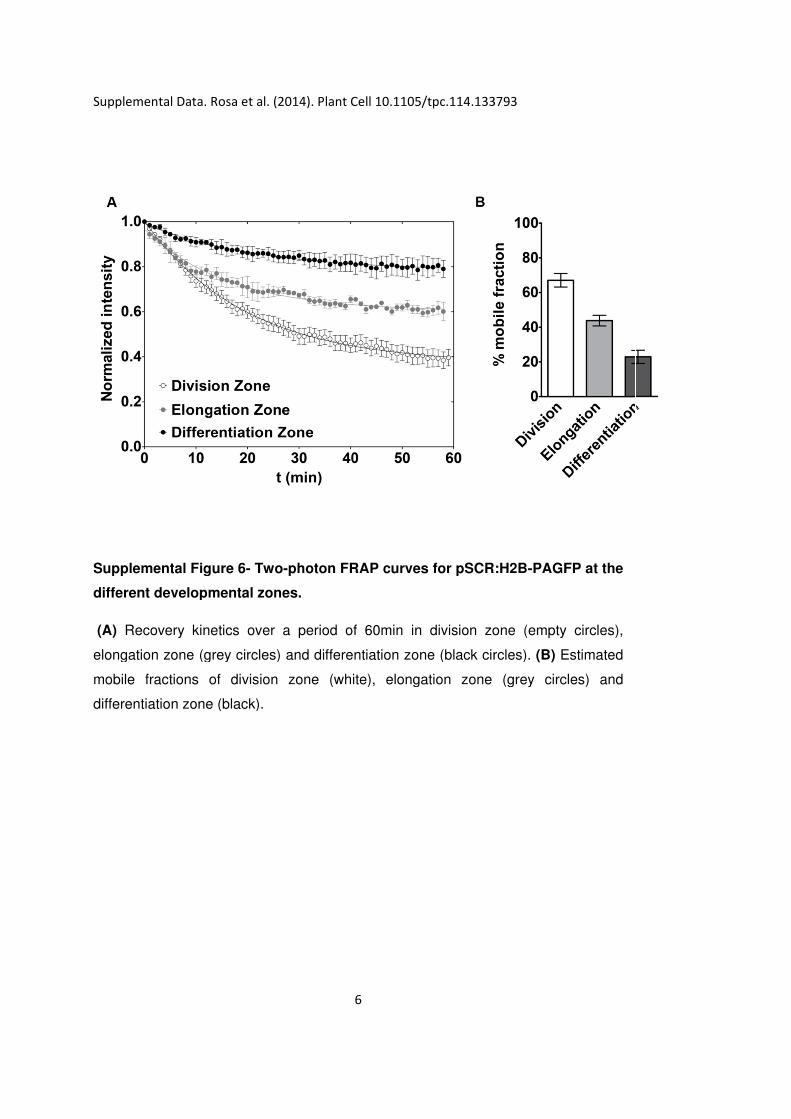
Supplemental Figure 6
different developmental zones.
Recovery kinetics over a period of 60min in division zone (empty circles),
elongation zone (grey circles) and differe
mobile fractions of division zone (white), elongation zone (grey circles) and
differentiation zone (black).
Supplemental Data. Rosa et al. (2014). Plant Cell
al Figure 6- Two
different developmental zones.
Recovery kinetics over a period of 60min in division zone (empty circles),
elongation zone (grey circles) and differe
mobile fractions of division zone (white), elongation zone (grey circles) and
zone (black).
et al. (2014). Plant Cell
wo-photon FRAP curves for pSCR:
different developmental zones.
Recovery kinetics over a period of 60min in division zone (empty circles),
elongation zone (grey circles) and differe
mobile fractions of division zone (white), elongation zone (grey circles) and
et al. (2014). Plant Cell 10.1105/tpc.114
6
photon FRAP curves for pSCR:
Recovery kinetics over a period of 60min in division zone (empty circles),
elongation zone (grey circles) and differentiation zone (black circles).
mobile fractions of division zone (white), elongation zone (grey circles) and
10.1105/tpc.114.133793
photon FRAP curves for pSCR:
Recovery kinetics over a period of 60min in division zone (empty circles),
ntiation zone (black circles).
mobile fractions of division zone (white), elongation zone (grey circles) and
133793
photon FRAP curves for pSCR:H2B-PAGFP
Recovery kinetics over a period of 60min in division zone (empty circles),
ntiation zone (black circles). (B) Estimated
mobile fractions of division zone (white), elongation zone (grey circles) and
PAGFP at the
Recovery kinetics over a period of 60min in division zone (empty circles),
Estimated
mobile fractions of division zone (white), elongation zone (grey circles) and
Supplemental Data. Rosa et al. (2014). Plant Cell 10.1105/tpc.114.133793
7
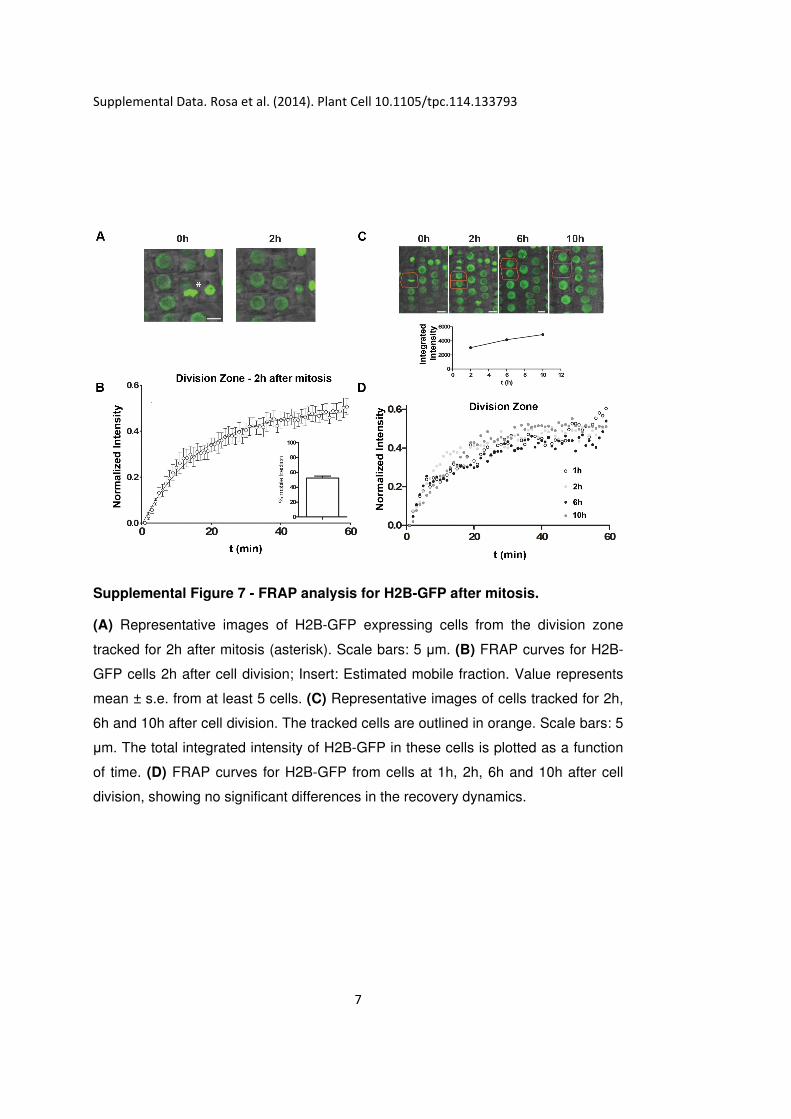
Supplemental Figure 7 - FRAP analysis for H2B-GFP after mitosis.
(A) Representative images of H2B-GFP expressing cells from the division zone
tracked for 2h after mitosis (asterisk). Scale bars: 5 µm. (B) FRAP curves for H2B-
GFP cells 2h after cell division; Insert: Estimated mobile fraction. Value represents
mean ± s.e. from at least 5 cells. (C) Representative images of cells tracked for 2h,
6h and 10h after cell division. The tracked cells are outlined in orange. Scale bars: 5
µm. The total integrated intensity of H2B-GFP in these cells is plotted as a function
of time. (D) FRAP curves for H2B-GFP from cells at 1h, 2h, 6h and 10h after cell
division, showing no significant differences in the recovery dynamics.
Supplemental Data. Rosa
Supplemental Figure
Representative immunolabeling images of
(A) differentiation zone
and hag1
Supplemental Data. Rosa
Supplemental Figure
Representative immunolabeling images of
differentiation zone
hag1-6 mutant.
Supplemental Data. Rosa et al. (2014). Plant Cell
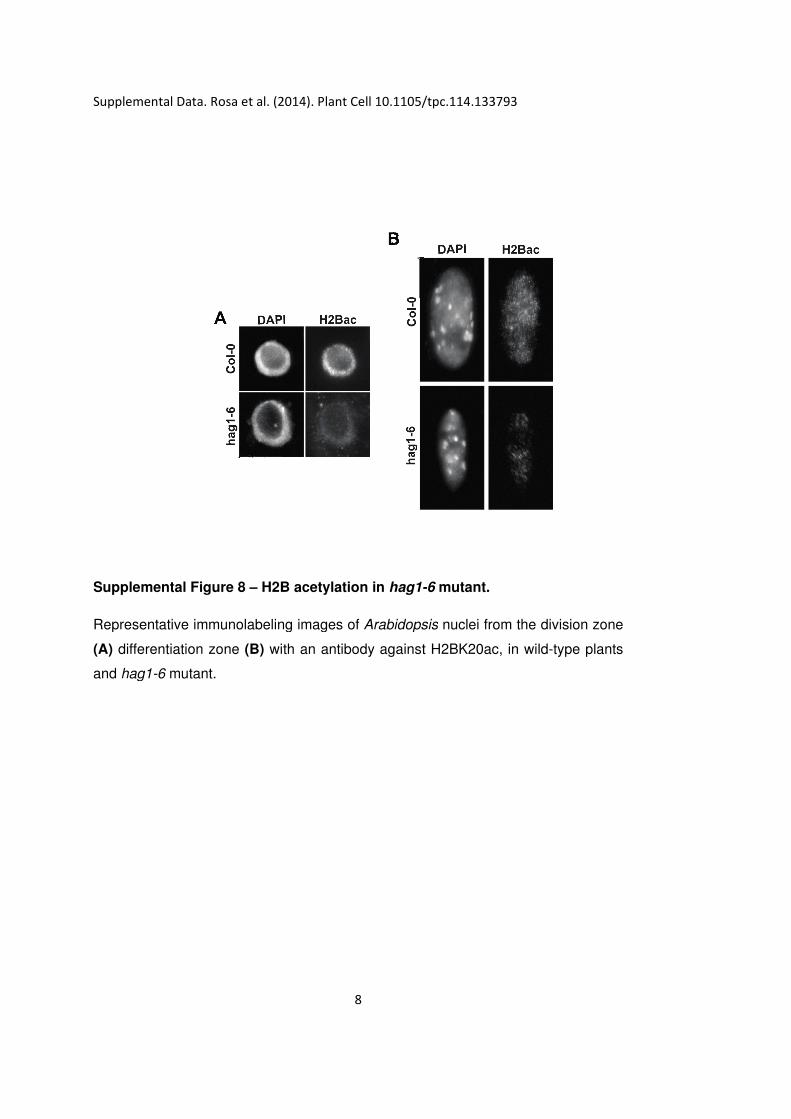
Supplemental Figure 8 – H2B acetylation in
Representative immunolabeling images of
differentiation zone (B) with an antibody against H2BK20ac, in wild
mutant.
et al. (2014). Plant Cell
H2B acetylation in
Representative immunolabeling images of
with an antibody against H2BK20ac, in wild
et al. (2014). Plant Cell 10.1105/tpc.114
8
H2B acetylation in hag1-
Representative immunolabeling images of Arabidopsis
with an antibody against H2BK20ac, in wild
10.1105/tpc.114.133793
-6 mutant.
Arabidopsis nuclei from the division zone
with an antibody against H2BK20ac, in wild
133793
nuclei from the division zone
with an antibody against H2BK20ac, in wild-type plants
nuclei from the division zone
type plants
Supplemental Data. Rosa et al. (2014). Plant Cell 10.1105/tpc.114.133793
9
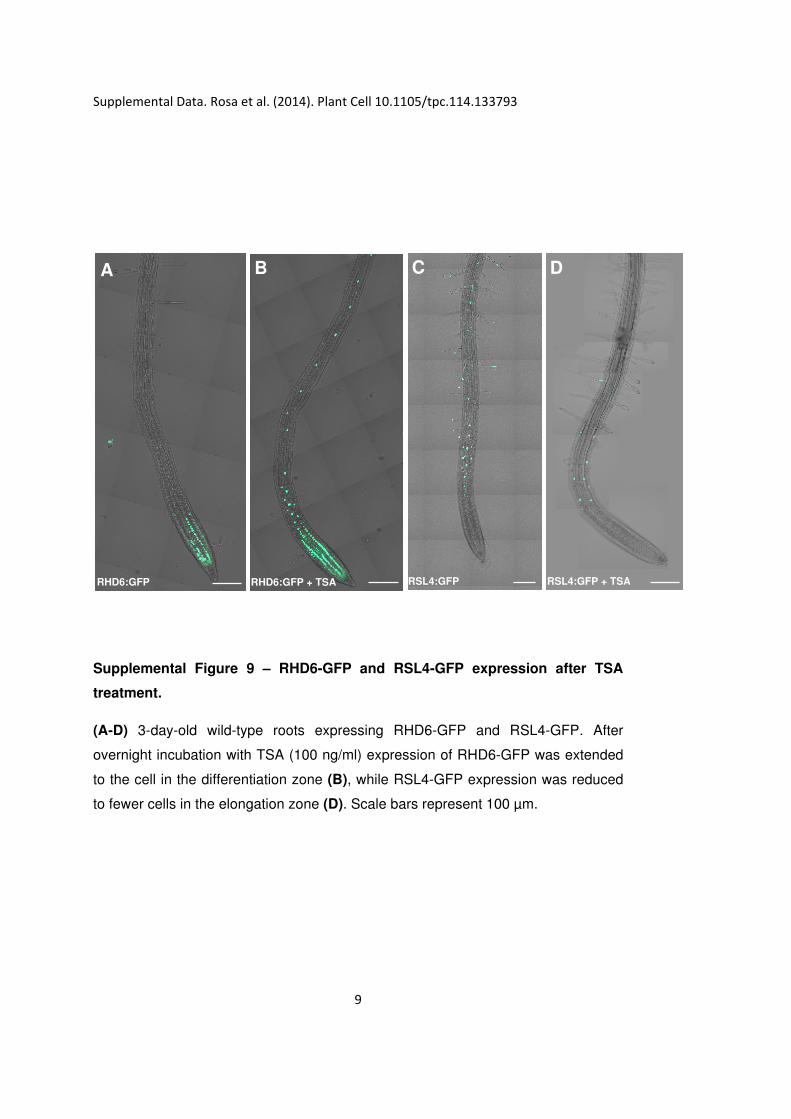
Supplemental Figure 9 – RHD6-GFP and RSL4-GFP expression after TSA
treatment.
(A-D) 3-day-old wild-type roots expressing RHD6-GFP and RSL4-GFP. After
overnight incubation with TSA (100 ng/ml) expression of RHD6-GFP was extended
to the cell in the differentiation zone (B), while RSL4-GFP expression was reduced
to fewer cells in the elongation zone (D). Scale bars represent 100 µm.
RHD6:GFP RHD6:GFP + TSA RSL4:GFP RSL4:GFP + TSA
A B C D
Supplemental Data. Rosa et al. (2014). Plant Cell 10.1105/tpc.114.133793
10
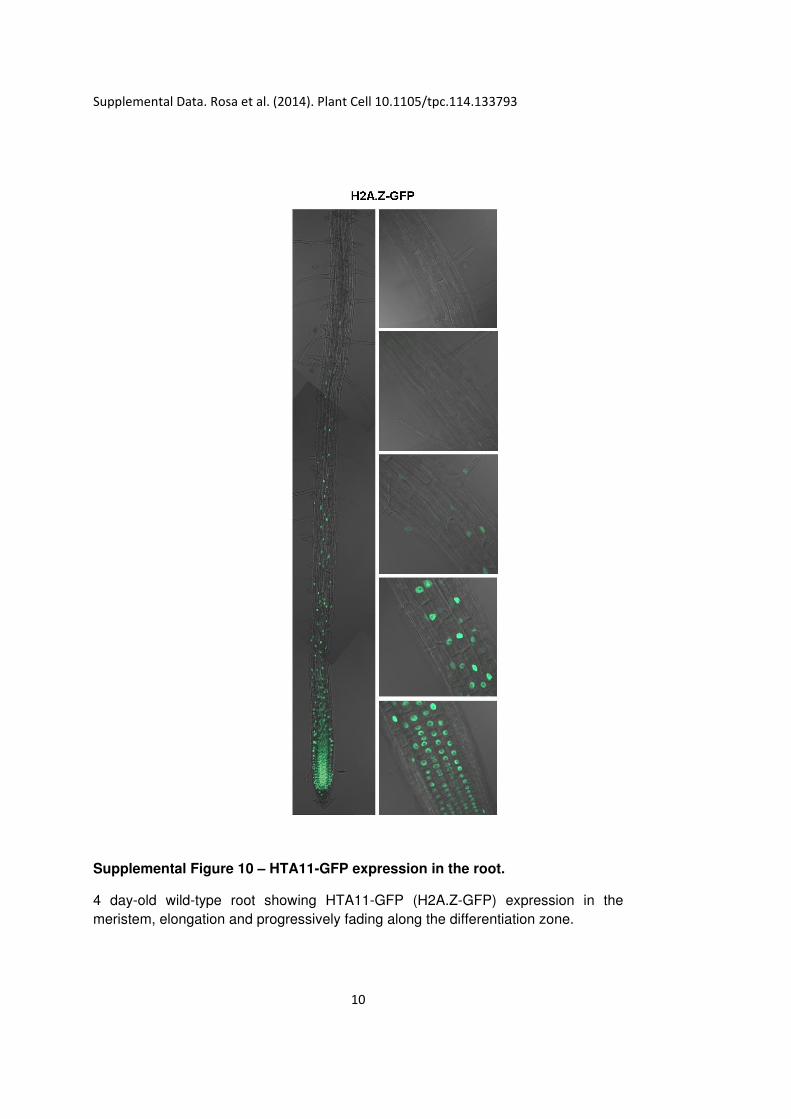
Supplemental Figure 10 – HTA11-GFP expression in the root.
4 day-old wild-type root showing HTA11-GFP (H2A.Z-GFP) expression in the
meristem, elongation and progressively fading along the differentiation zone.
Supplemental Data. Rosa et al. (2014). Plant Cell 10.1105/tpc.114.133793
11
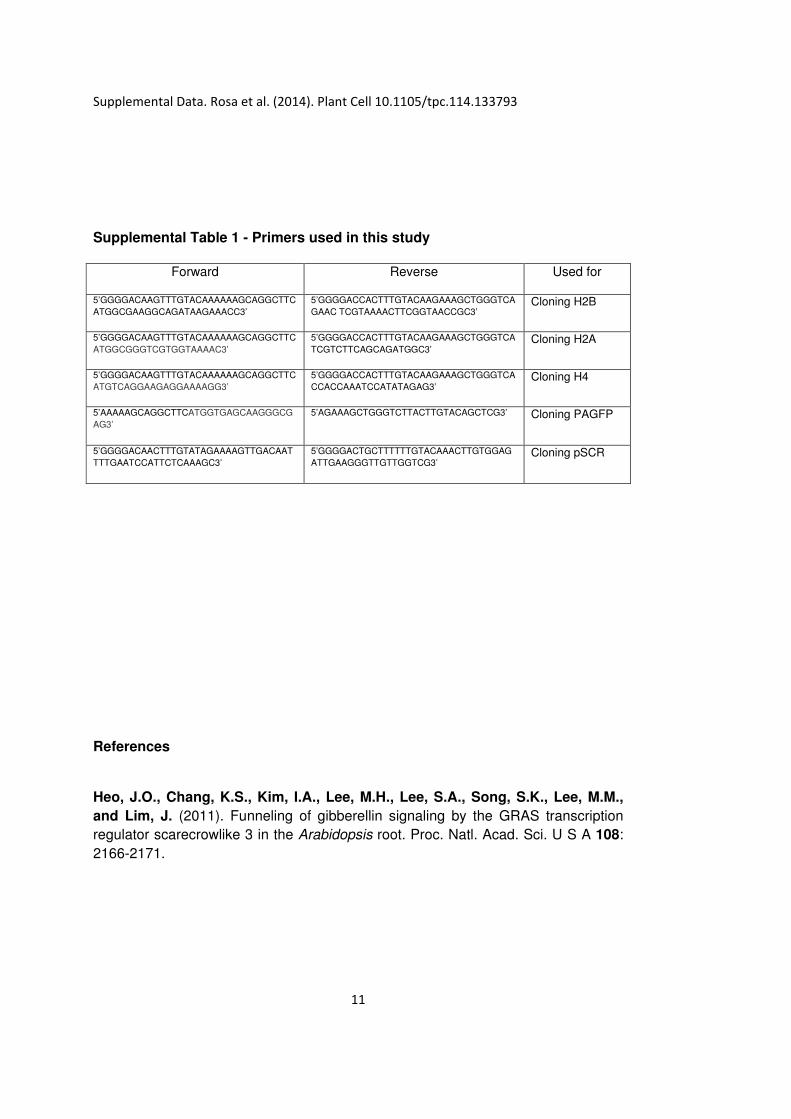
Supplemental Table 1 - Primers used in this study
Forward Reverse Used for
5’GGGGACAAGTTTGTACAAAAAAGCAGGCTTC
ATGGCGAAGGCAGATAAGAAACC3’
5’GGGGACCACTTTGTACAAGAAAGCTGGGTCA
GAAC TCGTAAAACTTCGGTAACCGC3’ Cloning H2B
5’GGGGACAAGTTTGTACAAAAAAGCAGGCTTC
ATGGCGGGTCGTGGTAAAAC3’
5’GGGGACCACTTTGTACAAGAAAGCTGGGTCA
TCGTCTTCAGCAGATGGC3’ Cloning H2A
5’GGGGACAAGTTTGTACAAAAAAGCAGGCTTC
ATGTCAGGAAGAGGAAAAGG3’
5’GGGGACCACTTTGTACAAGAAAGCTGGGTCA
CCACCAAATCCATATAGAG3’ Cloning H4
5’AAAAAGCAGGCTTCATGGTGAGCAAGGGCG
AG3’
5’AGAAAGCTGGGTCTTACTTGTACAGCTCG3’ Cloning PAGFP
5’GGGGACAACTTTGTATAGAAAAGTTGACAAT
TTTGAATCCATTCTCAAAGC3’
5’GGGGACTGCTTTTTTGTACAAACTTGTGGAG
ATTGAAGGGTTGTTGGTCG3’ Cloning pSCR
References
Heo, J.O., Chang, K.S., Kim, I.A., Lee, M.H., Lee, S.A., Song, S.K., Lee, M.M.,
and Lim, J. (2011). Funneling of gibberellin signaling by the GRAS transcription
regulator scarecrowlike 3 in the Arabidopsis root. Proc. Natl. Acad. Sci. U S A 108:
2166-2171.