market analysis for healthy air hvac systems in california
TRANSCRIPT

Arnold Schwarzenegger Governor
MARKET ANALYSIS FOR HEALTHY AIR HVAC SYSTEMS IN CALIFORNIA
PIER
FIN
AL P
ROJE
CT R
EPOR
T
Prepared For: California Energy Commission Public Interest Energy Research Program
Prepared By: Oak Ridge National Laboratory
September 2008 CEC-500-2007-031


Prepared By: Oak Ridge National Laboratory Melissa V. Lapsa Barbara G. Ashdown, Jennifer A. Palmer, Melissa M. Sherrod, Robert L. Wendt, William G. Craddick Oak Ridge, Tennessee 37831 Commission Contract No. BOA #100
Prepared For:Public Interest Energy Research (PIER) California Energy Commission
Bradley Meister, Ph. D. Contract Manager Norm Bourassa Program Area Lead Building End-Use Energy Efficiency Program
Martha Krebs, Ph.D. PIER Director
Thom Kelly, Ph.D. Deputy Director ENERGY RESEARCH & DEVELOPMENT DIVISION
Melissa Jones Executive Director
DISCLAIMER
This report was prepared as the result of work sponsored by the California Energy Commission. It does not necessarily represent the views of the Energy Commission, its employees or the State of California. The Energy Commission, the State of California, its employees, contractors and subcontractors make no warrant, express or implied, and assume no legal liability for the information in this report; nor does any party represent that the uses of this information will not infringe upon privately owned rights. This report has not been approved or disapproved by the California Energy Commission nor has the California Energy Commission passed upon the accuracy or adequacy of the information in this report.

Acknowledgments
The authors would like to acknowledge the people and organizations that took the time to provide input to this market research report. UNICO, Inc.; Centex; ConSol; Premier Homes, Inc.; Pulte Homes; and the Sansum Clinic in Santa Barbara were instrumental in gathering data for this project. JTS Communities, Morrison Homes, and Christopherson Homes assisted by providing invaluable input from their home tour participants. The authors also spoke to many other businesses, organizations, and public agencies who contributed their opinions; these are listed in Table 1. The authors would like to extend a special thank you to Bradley Meister of the California Energy Commission for his input and assistance with this report.
Please cite this report as follows:
Lapsa, Melissa V., Barbara G. Ashdown, Jennifer A. Palmer, Melissa M. Sherrod, Robert L. Wendt, William G. Craddick. 2007. Market Analysis for “Healthy Air” HVAC Systems in California. California Energy Commission, PIER Building End‐Use Energy Efficiency Program. CEC‐500‐2007‐031).
i

ii
Preface
The California Energy Commission’s Public Interest Energy Research (PIER) Program supports public interest energy research and development that will help improve the quality of life in California by bringing environmentally safe, affordable, and reliable energy services and products to the marketplace.
The PIER Program conducts public interest research, development, and demonstration (RD&D) projects to benefit California.
The PIER Program strives to conduct the most promising public interest energy research by partnering with RD&D entities, including individuals, businesses, utilities, and public or private research institutions.
PIER funding efforts are focused on the following RD&D program areas:
• Buildings End‐Use Energy Efficiency
• Energy Innovations Small Grants
• Energy‐Related Environmental Research
• Energy Systems Integration
• Environmentally Preferred Advanced Generation
• Industrial/Agricultural/Water End‐Use Energy Efficiency
• Renewable Energy Technologies
• Transportation
Market Analysis for “Healthy Air” HVAC Systems in California is the final report for the PIER project (contract 500‐2007‐031, BOA No. 100) conducted by Oak Ridge National Laboratory. The information from this project contributes to PIER’s Building End‐Use Energy Efficiency Program.
For more information about the PIER Program, please visit the Energy Commission’s website at www.energy.ca.gov/pier or contact the Energy Commission at 916‐654‐4878.
iii

iv

Table of Contents
Acknowledgements…………………………………………………………………………………….…i
Preface …………………………………………………………………………………………………...iii Abstract…………………………………………………………………………………………………..vii Executive Summary………………………………………………………………………………………1 1.0 Introduction .......................................................................................................................... …...5
1.1. Project Partners ............................................................................................................... …5 1.2. Background Research .................................................................................................... …6 1.3. Market Analysis .............................................................................................................. …6
2.0 Status of Key HVAC Market Participants ........................................................................ …...9 2.1. Consumers ....................................................................................................................... …9 2.2. Builders ............................................................................................................................ …9 2.3. Contractors ...................................................................................................................... …9
3.0 Discussions with Market Intermediaries.......................................................................... ….11 3.1. Utilities ............................................................................................................................. ..11 3.2. Manufacturers/Contractors ........................................................................................... ..14 3.3. Suppliers .......................................................................................................................... ..16 3.4. Builders ............................................................................................................................ ..19 3.5. Various Organizations ................................................................................................... ..22 3.6. Interpretation of Intermediary Feedback .................................................................... ..28
4.0 Feedback from Consumers ................................................................................................. ….31 4.1. Interpretation of Consumer Feedback ......................................................................... ..31
5.0 Conclusions and Recommendations ................................................................................. ….33 5.1. Conclusions ..................................................................................................................... ..33 5.2. Recommendations .......................................................................................................... ..33 5.3. Benefits to California ...................................................................................................... ..34
6.0 References ............................................................................................................................. .…35 7.0 Glossary ................................................................................................................................ ….39 Appendix A Information Tool and Consumer Feedback
Appendix B. “Snapshot” of the HVAC and Air Cleaner Markets
Appendix C. California Climate Zones, Air Pollution, and Related Health Issues
Appendix D. California Population at Risk from Pollution
v

List of Tables
Table 1. Organizations’ estimates of the degree of negative impact of different indoor air pollutants on California residents ................................................................................................. 24
Table 2. Estimated knowledge level of California residents about different indoor air pollutants . ............................................................................................................................................................ 25
vi

Abstract
This report summarizes and analyses data from surveys aimed at understanding the potential market for a commercial product that integrates strategies and systems for improved indoor air quality into an environmentally friendly heating, ventilation, and air‐conditioning unit. Specifically, the resulting healthy air unit would combine ventilation and recirculation strategies with equipment to clean and condition air into the central system that would treat most of the air that circulates in the home. Thus configured, the healthy air unit would offer the opportunity for more effective indoor air improvement and could be integrated with the heating, ventilating, and air‐conditioning (HVAC) products that meet the latest energy‐efficiency standards—thereby providing a more energy‐efficient, convenient, and affordable solution to consumers than existing systems.
On the basis of initial research and discussions with 20 market intermediaries, the team drafted an information tool that was administered to three groups of California consumers: allergy sufferers, residents looking at new homes, and homeowners. Responses from more than 400 consumers indicate significant opportunities to improve air quality in California through an integrated healthy air unit. The predicted favorable response from asthma and allergy sufferers was accompanied by an unexpectedly positive response from those who did not suffer from allergies. Further, 66 percent of respondents expressed a willingness to pay a price premium of $1000–$2000 for a healthy air unit. Based on these data, the team estimated a potential market of 370,000 healthy air units per year, or approximately 50 percent of the annual HVAC market in California. This encouraging estimate speaks to the value of continued efforts to develop and market a healthy air unit system.
Keywords: Energy‐efficient heating, ventilation, and air conditioning, healthy air unit, indoor air quality, integrated heating, ventilation, and air conditioning, energy‐efficient HVAC, integrated HVAC, clean indoor air, improved indoor comfort
vii

viii

Executive Summary
Introduction
Consumers interested in improving indoor air quality can now choose from a large variety of auxiliary equipment, from tabletop dehumidifiers and purifiers to whole‐house particulate filtration systems. Unfortunately, buying individual pieces of equipment can be expensive, and the pieces often fail to work together to improve the overall indoor environment.
A commercial product that integrates strategies and systems for improved indoor air quality into an environmentally friendly heating, ventilation, and air‐conditioning unit—a healthy air unit—could provide a more energy‐efficient, convenient, and affordable solution to consumers. The healthy air unit would combine ventilation and recirculation strategies with systems to clean and condition air into the central heating, ventilation, and air‐conditioning system—thereby taking advantage of a system that already extends throughout the home and treats most of the air that circulates in the home. Thus configured, the healthy air unit would offer the opportunity for more effective indoor air quality improvement and could be integrated with the heating, ventilation, and air‐conditioning products that meet the latest energy‐efficiency standards. However, it was important to have more data on consumer preferences and beliefs were needed to help move the technology from the laboratory to the marketplace.
Purpose
This work helped develop a better understanding of the potential consumer market for a healthy air unit.
Objectives
• Identify potential consumers for the healthy air unit technology.
• Determine consumer beliefs and preferences concerning indoor air quality.
• Identify factors in consumer decisions to purchase heating, ventilation, and air‐conditioning and air‐cleaning technologies.
Approach
Oak Ridge National Laboratory teamed with a heating, ventilation, and air‐conditioning partner, UNICO, Inc., to determine a target audience and develop a strategy for collecting data. The project team analyzed a sample of the California consumer target audience to determine product attributes and enhancements that consumers are willing to pay for when deciding among available heating, ventilation, and air‐conditioning systems. The team also identified relevant interactions between the market research and the current Public Interest Energy Research project to revise California ventilation standards.
To understand the heating, ventilation, and air‐conditioning market and its connection with indoor air quality, the team documented indoor air quality issues and treatable pollutants in California, researched the California market for heating, ventilation, and air‐conditioning
1

systems, Title 24 and associated issues, and reviewed housing market, population, health issues, and climates by region.
In a separate project phase, the team conducted discussions with 20 heating, ventilation, and air‐conditioning market intermediaries—builders, utilities, organizations, and heating, ventilation, and air‐conditioning contractors. On the basis of these discussions, the team drafted an information questionnaire that was administered to three groups:
• 25 respondents from an allergy clinic in Goleta, California (www.city‐data.com/city/Goleta‐California.html) (north of Los Angeles, near Santa Barbara).
• 47 respondents from the Building Industry Association of Superior California Home Tour in Sacramento (www.biasup.org/tour05.htm).
• 335 California homeowners who were contacted by the marketing department of UNICO, Inc.
This tool was used to gather feedback from potential consumers on desirable indoor air characteristics, acceptable price ranges for a “healthy air” unit, other incentives (besides the indoor air quality benefits) that might persuade them to purchase or install a healthy air unit, and situations in which they would most likely install a healthy air unit. Consumers were not asked to prioritize air quality parameters; these were presented as general categories.
Outcomes
In its preliminary data analysis, the project team assumed that only households with an allergic or asthmatic resident would consider buying this product, and then only when equipping a new home or replacing a failed heating, ventilation, and air conditioning. Using data from the United States Census, California Energy Commission, and California Air Resources Board with reasonable assumptions about the replacement market, the team calculated that such households represented a market of 200,000 heating, ventilation, and air‐conditioning units per year, or 27 percent of the entire heating, ventilation, and air‐conditioning market in California.
However, after analyzing information from consumers, the team determined that this market estimate was too low. The predicted favorable response from asthma and allergy sufferers was accompanied by an unexpectedly positive response from consumers who did not suffer from allergies. Further, 66 percent of respondents expressed a willingness to pay a price premium of $1000–$2000 for a healthy air unit. Based on these data, the team increased its market estimate to approximately 370,000 units per year, or approximately 50 percent of the annual heating, ventilation, and air‐conditioning market in California.
Conclusions
These data indicate significant opportunities to improve air quality in California through an integrated heating, ventilation, and air‐conditioning system that would provide a healthy air unit for homeowners. In fact, the market may be as large as 370,000 units per year, or approximately 50 percent of the annual heating, ventilation, and air‐conditioning market in California. This encouraging estimate—along with the very favorable responses to the healthy
2

air unit —suggests that efforts to develop such a system and educate consumers and market intermediaries about the product could prove extremely valuable.
Recommendations
The following findings can be used to guide the healthy air unit development process:
• The healthy air unit should meet energy efficiency ratio minimums to be considered for a rebate program, and must be affordable, have clearly discernable benefits, and be ENERGYSTAR®–compliant.
• Elements that would increase marketability include non‐invasive maintenance, quality service, the potential for substantially improved air quality, and the ability to control humidity, temperature, and ventilation levels and other comfort features.
The following findings can guide efforts to market the healthy air unit:
• Indoor air quality is only one benefit from a heating, ventilation, and air‐conditioning system. Marketing materials and training should also emphasize the healthy air unit’s cost‐efficiency and effectiveness, reasonable cost, reliability, scientific verification of benefits, reduced generation of dust, improved odor of air generated, and ease of maintenance.
• Residents are most likely to install a healthy air unit system when replacing their old system. Therefore, contacts with the local contractors who usually install replacement systems are important. This supports the importance of having a trained installation and sales force.
• When communicating with consumers about a new heating, ventilation, and air‐conditioning system, it is important to use terminology that consumers will understand.
• Marketplace intervention could be enhanced through more education of intermediaries about consumer interests, as well as better information for consumers about marketplace options. The California Energy Commission could provide a forum to more effectively engage intermediaries in the interests of consumers.
Benefits to California
This work confirmed that the potential market in California for a healthy air unit is greater than expected—possibly as high as 50 percent of California’s annual heating, ventilation, and air‐conditioning market. This finding speaks to the value of continued work to develop and market the healthy air unit. Successful development and commercialization of such a unit would provide California residents with a cost‐effective, energy‐efficient, and user‐friendly means of improving the indoor environment within homes, which in turn promises significant health benefits.
3

4

1.0 Introduction The California Energy Commission supports energy research, development, and demonstration (RD&D) projects that will help improve the quality of life in California by bringing environmentally safe, affordable, and reliable energy services and products to the marketplace. Each year, the Energy Commission’s Public Interest Energy Research (PIER) Program awards millions to conduct the most promising public interest energy research by partnering with research development and demonstration (RD&D) organizations including individuals, businesses, utilities, and public or private research institutions.
One area of interest is the development of a commercial product that integrates strategies and systems for improved indoor air quality (IAQ) into an environmentally friendly heating, ventilation, and air conditioning (HVAC) unit. Such a “healthy air” unit (HAU) could provide a more energy‐efficient, convenient, and affordable solution to consumers. By combining ventilation and recirculation strategies with systems to clean and condition air into the central HVAC system, the HAU would make optimal use of a system that already extends throughout the home and treats most of the air that circulates in the home. Thus configured, the healthy air unit would offer the opportunity for more effective IAQ improvement and could be integrated with the HVAC products that meet the latest energy‐efficiency standards.
Through the PIER Program, Oak Ridge National Laboratory (ORNL) and UNICO, Inc., were tasked with identifying potential consumers for the new HAU technology, determining their beliefs and preferences concerning IAQ, and identifying factors in consumer decisions to purchase HVAC and air cleaning technologies. Such data on consumer preferences and decision‐making processes are important elements in moving technology from the laboratory to the marketplace.
1.1. Project Partners The following partners were instrumental to this project:
• ORNL’s Building Technologies Center (BTC). ORNL research in building technologies focuses on advanced space conditioning, refrigeration, thermal distribution, appliances, and building thermal envelope and materials for improved energy efficiency and indoor environmental quality for end‐use in residential and commercial markets. At the BTC, ORNL engineers develop and maintain advanced residential building audits and end‐use monitoring techniques, as well as provide technical assistance in market analysis, household energy budget projections, technology assessment, and resource leveraging. Recently the Department of Energy (DOE) selected the top 100 achievements during its history. The BTC was responsible for five of these achievements, including one judged the second most important. Recent projects include work with the Tuskegee Institute on development of an Affordable Healthy House and field‐testing of advanced HVAC/distribution system designs.
• UNICO Inc. HVAC manufacturer UNICO Inc. was founded in 1985 by a group of contractors with experience in high‐velocity heating and cooling distribution systems.
5
UNICO is located in St. Louis, and distributes its high‐velocity system throughout the United States, Asia, Latin America, and the Caribbean. UNICO already has a significant distribution system in place in California.
1.2. Background Research The technical scope of the market connection project was to develop a market‐research strategy and implementation plan. This plan was developed using data from the California Air Resource Board’s (ARB’s) November 2004 draft report Indoor Air Pollution in California1, subsequent versions of this report2, and information gleaned from an analysis of the HVAC market and asthma/allergy sufferers market in California3. The team evaluated ARB’s list of pollutants to identify which could be reduced or eliminated through the operation of an HAU HVAC system in homes. This listing was then ranked in order of impact to human health (in particular asthma and allergies) using the ARB report and/or other expert sources.
The market analysis strategy used for the market connection project began with documenting IAQ issues and treatable pollutants in California. Researchers then examined the California market for HVAC systems, as well as Title 24 and issues surrounding that legislation. The team reviewed existing equipment, and the housing market, population, health issues, and climates by region (Appendix B).
Analysts then developed an initial tool, found in Appendix A, to gather information from the many groups involved, including consumers, builders, and utilities. Appendix C contains background research on the state’s various climate regions, air pollutants particular to the region, and the number of people with respiratory illnesses, in particular allergies and asthma. Appendix D discusses various California population groups and the pollution‐related health risks associated with those groups.
1.3. Market Analysis This report focuses on work to identify potential HAU consumers and the best method of determining their interests in the potential HAU technology. The market analysis aimed to determine whether consumer interest is sufficient to conduct further R&D into environmentally friendly products, specifically for a residential HVAC system that improves IAQ for asthma and allergy sufferers.
As a first step, the team conducted discussions with 20 HVAC market intermediaries—builders, utilities, organizations, and HVAC contractors (see Section 3 to see the script used and a summary of responses). Based on these talks, the team drafted an information tool (Appendix A) that was administered by market intermediaries to three consumer groups (surpassing the original project scope specifying a sample group of 75 by more than five times):
1. Air Resource Board 2004 2. Air Resource Board 2005 3. Palmer 2005a, Appendix D
6

• The first group (25 allergy patients) was contacted through a large allergy clinic in California that agreed to help with the analysis.
• The second group included home tour attendees (47 prospective or current homeowners). The home tour sponsors were builders and contractors who work with the DOE Building America Team; they agreed to distribute the information tool to tour attendees.
• The third group consisted of 335 homeowners who were contacted by the marketing department of UNICO.
From the responses received from the three groups above, the project team was able to assemble information about the IAQ issues important to consumers and the costs consumers would be willing to pay to address those issues. The results were interpreted and summarized in Section 4 and discussed in detail in Appendix A. Although these results are certainly not meant to represent the entire state of California, they allowed the team to determine whether there was significant consumer interest in the healthy air unit among homeowners.
7

8

2.0 Status of Key HVAC Market Participants 2.1. Consumers The building industry is changing as homebuyers become more demanding. “In California, in particular, consumers are looking for technology solutions that will help them battle high energy costs, natural disasters, and water scarcity. The competitive advantage will go to the builders who can offer greater affordability, comfort, and durability in their homes. New technologies can deliver a lot of that,” says Carlos Martín with the Partnership for Advancing Technology in Housing, a federal program designed to promote innovation that leads to higher‐quality, more‐affordable homes4.
A relatively small percentage of HVAC service and retrofits (less than 5% by current estimates) are the result of an energy management decision by the homeowner. As the price of electricity, home heating oil and natural gas rises, homeowner energy management may be a growing reason for HVAC service/retrofit. Furthermore, public education is still limited in this area5.
2.2. Builders Today’s homebuilders now seek to include some advanced technology in their homes, according to a new survey of 400 U.S. builders. Programmable thermostats, security systems, and zoned HVAC systems top the list of most frequently offered products. Name, reputation of company, and product quality outweigh pricing as top reasons why builders select specific manufacturers’ products to offer their buyers6. Recent research by the U.S. Department of Housing and Urban Development shows that builders consider several factors when deciding to use new technologies:
• Can the technology be easily incorporated into their current process of homebuilding?
• Have other builders reported success with the technology?
• Have homebuyers accepted the technology?
• Is the new technology easy to install and operate?
• Do manufacturers stand behind the product? Do they have a reliable supply chain?
2.3. Contractors The HVAC industry is highly fragmented and defined by a large number of contractors. There are an estimated 75,000 plumbing, heating and air‐conditioning special trade contractors in the United States. Small firms dominate these contractors. Only 8% have 20 employees or more, but they account for over half (56%) of all business done. Appendix B lists the top HVAC contractors in the western United States for 2002. 4. California Builder Magazine 2005a 5. National Energy Management Institute [NEMI] 2004 6. Parks Associates 2004
9

Residential contractors specializing in HVAC only number approximately 20,000. These firms employ more than 130,000 workers. Over the next 5 to 7 years, an additional 25,000 to 30,000 HVAC mechanics are likely to be added to the industry, according to the Bureau of Labor Statistics7.
Perhaps the most significant development in the residential HVAC market is industry consolidation, in part due to changing market structures. Considerable consolidation has occurred among residential HVAC contractors, and manufacturers and distributors are moving further downstream to the homeowner and have also seen significant consolidation. One example is Lennox’s purchase of Service Experts8.
Contractors are an important element in the promotion of high‐efficiency HVAC systems. According to the Electric & Gas Industries Association (EGIA), “Due to the high cost of HVAC replacement, most … contractors typically promote the lowest cost alternative in order to ‘close the deal’ … they know that in the end, the majority of customers will opt for the lowest total cost solution.” Presenting the benefits of environmentally friendly, high efficiency HVAC systems on an equal footing with cost benefits would go a long way towards encouraging homeowners to consider efficiency as well as cost. EGIA recommends that California Public Utilities Commission increase and sustain funding of contractor training and education programs. “A well‐trained and motivated statewide network of home improvement contractors is critical to unlocking the untapped potential that exists throughout California for the replacement of inefficient residential space conditioning with high efficiency HVAC solutions.9”
7. NEMI 2004 8. NEMI 2004 9. EGIA 2003
10

3.0 Discussions with Market Intermediaries Concurrent with the team’s research on the HVAC/air purifier market, the team conducted discussions with 20 market intermediaries, specifically, utilities, builders, organizations, and HVAC contractors and manufacturers (See Appendix B for list). Based on these discussions, analysts developed an information tool designed to elicit feedback from homeowners (Appendix A). Feedback from consumers is interpreted and discussed in the conclusions and recommendations presented in Section 5. Comments are organized in the same order as in the information tool.
3.1. Utilities The following questions and responses represent discussions with California utilities:
• Do you promote HVAC systems through your utility? (Why or why not?) If so, which types of HVAC systems do you support (gas or electric, other reasons)?
o Yes, we promote electric HVAC systems. We do not promote any particular brands, only energy efficient systems with at least a 13 seasonal energy efficiency ratio (SEER) for split systems and 12 SEER for a packaged system. Our rebate offers for energy efficient residential HVAC systems are only for retrofit (replacement) systems, not new construction.
o Yes, we promote HVAC systems through our utility. We do not promote any particular brands; we merely promote high performance, energy‐efficient systems with a high energy efficiency ratio (EER) and SEER. These are systems found in Air‐Conditioning and Refrigeration Institute’s (ARI’s) list of products. In addition, we have been providing rebates for 30 years.
o Yes, we promote energy efficient systems through rebates. We do not promote any specific type of system.
o No, we do not recommend products in general, although we do promote the ENERGY STAR® brand.
• In the current home market, what factors are most important to the typical homeowner/resident with regard to heating and cooling systems?
o A combination of price and comfort are the most important factors to the typical homeowner. Comfort (cooling) is most likely the most important, but homeowners will adjust their thermostats to save money.
o The most important factor is the timing on the retrofit (i.e., when the air conditioner is broken), followed by the price. It is important to work with the industry to make sure that the high performance products are on the stock shelves and that they promote the life‐cycle costs of the products.
11

o The factors indicated by the inquiries we receive through our website and via email are varied, but they often include concerns about the energy cost and safe use of the equipment.
o Homeowners/residents consider customer service to be the most important factor with regard to heating and cooling systems. Also, they may look more at energy efficiency considerations when buying a new home.
• How do you learn about new HVAC systems? How does your company decide to advocate for certain systems?
o Although we don’t promote particular systems, manufacturers do invite us to their companies to learn about new products coming to the market (i.e., efficient systems that use ultraviolet (UV) light to kill the bacteria growth on the evaporator or inside system).
o We are very connected to the industry. For example, manufacturers will come directly to us with an emerging technology. We are also connected to the industry through information from other organizations.
o We do not advocate brands, only energy efficiency.
o We only promote ENERGY STAR® systems.
• Do consumers contact you about HVAC systems? What issues do they have?
o Consumers contact us through our customer service office, website, toll‐free number, office, and radio announcements on a local broadcasting station.
o Consumers contact us through their customer service office and website.
o We receive varied inquiries, including cost of energy and safe use of the equipment, through our website and via email.
o Consumers who contact us are interested in the effects of new technologies.
• Have consumers ever expressed an interest in improving IAQ in their homes? If so, what are the factors that have contributed to their interest?
o Yes the consumers have expressed an interest, most likely because they suffer/or have suffered from allergy, asthma, other sinus respiratory problems.
o Yes, those who have expressed an interest have usually suffered from medical conditions.
o Yes, we have found that the consumers expressing interest are those who are concerned about the health of their children.
o Consumers associate better health and quality of life with improved IAQ.
12

• Do you think indoor air pollution is an issue for homes/residences? Why or why not? Are you familiar with some of the following different types of indoor air pollution?
Group 1 (bacteria, mold, dust mites, animal dander)
Group 2 (plastics, pesticides, flame retardants)
Group 3 (composite wood products, furnishings, perma‐press fabrics, etc.)
Group 4 (solvents, glues, cleaning agents, paint, etc.)
Group 5 (cooking, candles, aerosol sprays, house dust, etc.)
Group 6 (cooking, wood burning)
o Yes, we are familiar, but we do not feel that homeowners/residents are.
o Yes, we are minimally familiar.
• If indoor air pollution is an issue for residents, how would you suggest improving the air quality in the home? How much would this typically cost?
o We do not promote or discuss air quality or products. However, I recently bought a replacement HVAC system for my own home and paid a $1000 for a system that only integrates a UV treatment component.
o It is an issue; however, there are many add‐on products that are not too expensive and are already on the market. We would need to specifically differentiate ourselves and be cost competitive. An aggressive marketing assessment is needed.
• ORNL in collaboration with an HVAC manufacturing company is developing a new HVAC system that provides the benefits of heating and cooling and air quality improvement, with no increase in energy consumption. Would such a system be of value to your customers? Would it be of interest to your company? (Why or why not?)
o Yes, if it meets EER minimums, we would review such a system for a rebate. We also believe that customers would be interested if the system is affordable.
o Yes, it would be of interest to our company if we found it to increase value, and also be competitive price‐wise, along with performing at a high level.
o Yes, it may be of interest to us if we clearly identified the benefits of the HVAC system.
o No, such a system is not applicable to our product line as we engage mainly in the sales of gas furnaces and boilers.
• Would customers be willing to pay an incremental premium for such a system? How much more? $1000–$3000 range?
o Yes, especially those who have family members with asthma or allergies.
13

o Maybe, it would depend on the price of alternative solutions.
3.2. Manufacturers/Contractors The following responses represent discussions with HVAC contractors and manufacturers.
• Tell us about the types of HVAC equipment/systems you offer in your product line (electric vs. gas)? Why these particular lines?
o We offer both gas and electric systems, including heat pump, hot water, water source, and unitary equipment‐DX. Gas is the preferred fuel source, but more people are looking at electric systems with gas prices going up.
o We offer heat pumps, furnaces, air conditioning equipment, and split and packaged systems.
o We offer forced air systems. The California market for this type of HVAC system is not as strong as in other areas of the country and we are not sure why.
o We offer heat pumps, furnaces, thermostats, both split and packaged systems, air cleaners and UV lights. We sell both gas and electric systems, especially gas furnaces and electric heat pumps. We also have dual fuel products, with switching sensors which allow the system to move from one energy source to the other.
o We offer ventilators, humidifiers, air cleaners and air purifiers, and UV lights.
o We offer HVAC equipment/systems that primarily have a 16 SEER.
• What types of heating/cooling equipment are you installing in homes?
o Dual fuel units are more common, though gas heat pumps are usually preferred over electric. Residential consumers are single‐phase versus three‐phase. We are also seeing more high‐efficiency (19 SEER) installations. It seems as though people are staying in homes longer and thus, they are willing to invest in better equipment.
o We are seeing growth in sales of all air quality products. People are more concerned than ever about air quality. Most of the growth is in premium filtration systems. Many of our HVAC units now have 4’ cabinets so that filtration units can be added. We are also working with one of our companies to offer carbon dioxide alarm systems with HVAC units.
o We are installing gas/electric split systems most often. Customers like them because they are quiet and cost effective.
• What do your homeowners/residents like about these systems?
o They like the comfort, warmth, control these systems offer.
14

o These systems run fans to bring in fresh air and the consumers like the ability to vary the speed of the fans, along with the comfort that these systems provide in their homes and businesses.
• What don’t they like about these systems?
o They do not like that the heat pumps aren’t as warm. We also have had complaints about inexperienced installation of duct work causing the system to run improperly.
o They do not like systems that require maintenance, such as systems that require changing filters, etc. Our systems are therefore built to be maintenance‐free, with replacement cartridges, some self‐cleaning, and sensors that alert owners to equipment needs.
• What is the current price range for units you are installing in homes? ($1000–$3000, $3000–$5000, more than $5000?)
o The price range varies based on tonnage and SEER rating, for example, a 3‐ton, 10‐SEER unit costs $1200. People seem to be investing in higher SEER rated equipment. These units are often oversized for the square footage of the house.
o The prices vary by market region and range from $1000 to $7000.
o A replacement with 16‐SEER unit can range from $8000 to $17,000.
• Who are your key customers? (Builders, homeowners, retailers, other?)
o Builders and residential contractors.
o Distributors and dealers. Half the distributors are independently owned and all dealers are. Our focus is on replacement, not new construction.
o Distributors and dealers. We focus on new construction and add‐on.
o Distributors and dealers.
o Homeowners.
• In the current home market, what is most important to your typical homeowner/resident?
o Controlling humidity, quiet operation, and equipment that doesn’t intrude on the yard.
o Reliability and comfort with the ability to control temperature. Also humidity control and IAQ are important issues. IAQ has become more important because respiratory illnesses have increased and people are spending more time indoors. In addition, air filters and room air cleaners are being heavily advertised to homeowners. And the amount of available products has increased along with industry improvement in the quality of these products.
15

o Getting a system fixed fast when things break is very important to the consumer. If they have time to think about the actual system, usually they will prefer more energy efficient products. With regards to IAQ, people who have medical problems are more likely to seek out these products.
o Price, efficiency, and non‐invasive quality service are all important factors for the consumer.
• How do you learn about new HVAC systems? How does your company decide to include new HVAC equipment/systems in your product line?
o We have a research staff that is tasked with tracking down new ideas.
o American Society of Heating, Refrigerating, and Air Conditioning Engineers (ASHRAE) and other industries help keep us up to date. We also develop some internally. One of our employees worked with Carrier and Honeywell before coming to us and provides peer review for the Air Research Committee.
o Our marketing department identifies needs and passes on to R&D. Currently, we are working on 13 SEER mandate and phasing out refrigerant 22 by 2010.
o We invent most of our systems through the United Technologies Research Center in Indiana. We also have consortia of stakeholders and we attend trade shows.
3.3. Suppliers The following responses represent discussions with HVAC suppliers:
• Have homeowners/residents ever expressed an interest in improving IAQ in their homes/residences? If they have expressed an interest, is it because:
They suffer/or have suffered from allergy, asthma, other sinus respiratory problems.
They suffer from other medical conditions.
They are concerned about the health of their children.
They associate better health and quality of life with improved IAQ.
o The biggest issues are mold and mildew, off gases, and pets, as well as general health issues.
o Homeowners are concerned with allergy, asthma, and other sinus respiratory problems. In general, respiratory illnesses are increasing.
o They associate better health and quality of life with improved IAQ.
o Customers always express interest in improving IAQ.
• Do you think indoor air pollution is an issue for homes/residences? Why or why not? Are you familiar with some of the different types of indoor air pollution?
16

Group 1 (bacteria, mold, dust mites, animal dander)
Group 2 (plastics, pesticides, flame retardants)
Group 3 (composite wood products, furnishings, perma‐press fabrics, etc.)
Group 4 (solvents, glues, cleaning agents, paint, etc.)
Group 5 (cooking, candles, aerosol sprays, house dust, etc.)
Group 6 (cooking, wood burning)
o Yes, and homeowners are aware of most of these through television.
o We are familiar with all of them, but we think that Groups 1, 4, and 5 are more familiar to consumers.
o Yes, air pollution is an issue because homes are tighter. People experience problems with sleeping, breathing, and comfort. We are familiar with all these types of air pollutants. Consumers are most sensitive to Group 1 and less so to the other groups. These can all be treated through combination of ventilation, removing air‐born particles, and killing contamination and mold (UV lights).
o We, and consumers, are most familiar with Group I. Dust is a big issue, as is pollen.
• If indoor air pollution is an issue for a resident, how would you suggest improving the air quality in the home? Do you offer/install other equipment for this purpose? How much does this equipment typically cost?
o We have tried different methods. We do not recommend UV light or volatile organic compound (VOC) filters. Bioclimatic filters don’t work (cigarette smoke mitigation). We recommend changing filters frequently and cleaning the coils. We sell pollution control devices to residential contractors to install. We also offer other suggestions: ventilate crawl spaces, use hoods when cooking, run fans, run fan in shower for one hour after shower, and use products without toxic materials.
o To improve air quality in the home, we recommend: a particulate filter and ventilation for outside air.
o To improve air quality, ventilation, humidity control, air cleaning, and air purification are needed. Systems have built‐in UV lights to kill mold growth on coils. Top of the line product includes filtration and contaminant destruction through UV lights; and we offer HVAC systems that can now be controlled remotely through your cell phone or through the Internet.
o Sealing the ductwork is important to improving air quality inside the home.
17
• ORNL, in collaboration with an HVAC manufacturing company, is developing a new HVAC system that provides the benefits of heating and cooling and air quality improvement, with no increase in energy consumption. Would such a system be of value to your customers? Would it be of interest to your company? (Why or why not?)
o Yes, we are always interested in new ideas.
o It could be of interest to us.
o Potentially could be of interest.
o We are interested in further collaboration opportunities with ORNL, but we need to see a return on our investment.
o Yes.
• Would customers be willing to pay an incremental premium for such a system? How much more? $1000–$3000 range?
o Yes.
o Maybe. This range sounds high. We would need to show payback for this increase in cost.
o Probably, and obviously the price would vary.
o It is a tough question to answer. People will probably invest if they perceive they have a problem that can be resolved by this equipment. It also depends on how well a dealer can explain the benefits. These products are “invisible” to customers and they may not perceive a pay‐off.
o Yes. Willingness to pay depends on what the consumer needs and wants to do. Carrier uses focus groups to determine consumer responses to various technologies. Some of these technologies are not yet ready for the market.
o Not sure, probably less than $750.
• What else might be important in offering a new HVAC system with air quality improvement benefits in your product lines?
o It needs to be controllable, as in a smart house concept.
o We have new systems lined up, such as a residential energy recovery ventilator that is set to be released later this year.
o We need to have a good reputation with the manufacturers. Developing a technology and then trying to sell it doesn’t work. We have been unsuccessful at selling heat pumps with integrated water heating.
o The ability to run fan continually would be useful, as would an opportunity to integrate more pieces into system. We are currently designing systems to operate
18

more with different components, such as UV lights. It is also important to look at pressure drops as an indicator of when components need to be changed.
o Documentation.
3.4. Builders The following represents responses from builders in California.
• Tell us more about the types of houses you typically build: (Are you a custom or production builder, numbers of buildings per year, locations, floor space, fuel sources, price range)
o Most of us are production builders whose house sizes range from 1800–2800 ft2.
o We represent a company that works with production builders in the industry.
• In the current home market, what is most important to your typical homebuyer/ homeowner? What are they looking for in the homes you build?
o Buyers usually have to be sold on the importance of HVAC systems or energy efficiency.
o Location, floor plan, and price are overwhelming factors for homebuyers.
o When offered zero‐energy homes, consumers respond positively and are interested; what may be called a latent market response. Builders can do things that will pique the consumer’s interest. For example, one builder (not interviewed) has a program with a healthy‐living emphasis to address “green” consumer options. Consumers may already have a heightened awareness of IAQ concerns due to programs such as these, which are educating customers to look for energy‐efficient and healthier homes.
• What type/brand of HVAC systems are you now installing in your homes?
o Lennox, York, and Carrier are our main brands.
o Specific brands are preferred because manufacturers do a good job of taking care of builders and contractors. They understand the construction business and keep up with the pace.
o Prices ranged from $3,000–$5,000; a range of $9000–$10,000 was given for total installed cost, depending on the home.
• Who makes the decision about what system to install in a home? (homeowner, builder, contractor, other)
o The builder is almost always the one to choose what type/brand of system is chosen for a home.
• How do you learn about new HVAC systems? How does your company decide to try a new HVAC system?
19

o We usually learn about new systems from the contractor or Title 24 designer.
o Companies like ConSol introduce builders to new cutting‐edge technologies such as the DOE Building America (energy efficiency) and Million Solar Roofs (renewable solar energy) programs.
• Have homebuyers ever expressed an interest in improving IAQ in their homes? If they have expressed an interest, is it because
they suffer/or have suffered from allergy, asthma, other sinus respiratory problems
they suffer from other medical conditions
they are concerned about the health of their children
they associate better health and quality of life with improved IAQ
other issues, such as…?
o Customers are rarely interested in IAQ, but when they are, it is for health‐related reasons—allergy, asthma, other respiratory problems.
o IAQ is a non‐issue. Price is more important for young people buying their first home, but older people value health more and are more inclined to be concerned about IAQ.
o National Association of Home Builders has put out information on air quality. Baby boomers are hitting retirement and are more demanding in what they are willing to pay for in terms of the quality of their home. IAQ may rank as an issue, but it is not necessarily a distinguishable factor. Another important factor is that people don’t open windows, and gas cooking and fireplaces can generate high levels of carbon dioxide. Also in the desert, we get a lot of dust.
• Do you think indoor air pollution is an issue for new homes? Why or why not? Are you familiar with some of the different types of indoor air pollution?
o All builders are aware of the different types of indoor air pollutants. Mold is often a concern.
o Some new homes are being misconstrued as too tight – when in fact, it is the ventilation systems that should be emphasized. ASHRAE 62.2 provides minimal requirements for ventilation.
o Homeowners are concerned about security and health. People are not opening windows for increased security and as a result, they are increasing their exposure to ambient IAQ.
o IAQ is an issue. It is an age issue and an economic issue for opposite reasons. Price rules for young people who are stretching to the max just to get into a home. Health
20

is more important to older people and they are typically more interested in improving their situation.
o Buyers are aware mostly of group one. Mold is a real popular issue due to the attorneys. Mold is not a real danger, but a concern. We do extensive training programs for mold mitigation. Manufacturers are considerate of group four. Candles are also an issue as people don’t see them as an IAQ problem. We had one lady who burned at least 50 candles a day, and it was causing problems in her home. Finally we convinced her that it was the candles, but people just don’t think of candles as causing indoor air pollution. Cooking, cleaning and fireplaces issues have been helped with ventilation fans.
o Geographically we are in a high‐allergy area. Mold is also an issue.
• If indoor air pollution is an issue for a homebuyer, how would you suggest improving the air quality in the home? How much would something like that cost?
o We would suggest an air‐to‐air fresh air exchanger, which normally runs from $2000–$3500.
o Various air filters, which are a very inexpensive solutions for many customers.
o Several optional products could be recommended: filters, vents, etc.
o Continuous low‐level exhaust and better quality air filters (for marine and hot‐dry climate regions of California) are perfect because of their low cost.
• ORNL in collaboration with an HVAC manufacturing company is developing a new HVAC system that provides the benefits of heating and cooling and air quality improvement, with no increase in energy consumption. Would such a system be of value to your customers? Would it be of interest to your company? (Why or why not?)
o Maybe, it all depends on the cost.
o Possibly, the cycle time for incorporating in the building process is extremely important, as anything that hold‐ups the process can create chaos.
o Yes, if there were substantial improvement in the air quality.
• Would customers be willing to pay an incremental premium for such a system? How much more? $1000–$3000 range?
o There would probably be no interest from entry‐level customers as many low‐income homeowners can’t afford additional costs.
o Builders need to know they can sell the technology, and the benefits must be clearly defined for there to be interest from the customer.
• What else might be important in offering a new HVAC system with air quality improvement benefits in your homes?
21

o Nighttime automatic ventilation.
o Electronic air cleaners, but this would not a big factor.
o A maintenance program to educate the consumer or an extended warranty.
o Noise, vibration, cost, ease of service, dependability, and quality.
o Educate the customer about the product. This would be especially important if the system has indoor environmental quality feature. Consumers need to know how to use a product to ensure they will get the benefits of the additional costs associated with the product.
3.5. Various Organizations The following represent responses from various types of organizations.
• Tell us more about your organization’s interest in IAQ.
o We provide standards and guidance for IAQ, which are adopted state by state, and issue documents on different issues, including an IAQ position document addressing mold and moisture control. California’s building codes would be referenced under the Secretary of State Office.
o We are involved in IAQ research and public outreach/education.
o We are not focused on IAQ, but on outdoor air pollution by power plants. We are mostly interested in mercury, ozone, and smog.
o We focus on a wide spectrum of respiratory disease, especially asthma.
o We work with state and local asthma coalitions.
o We are seeking to reduce indoor contaminants, reduce asthma attacks, and reduce chemicals that induce asthma problems.
o We work with residences and schools, aiming to educate people about asthma through medical management and reduction, and about triggers in the indoor environment, such as dust, dander, and animal allergens, tobacco smoke, rodents, and cockroaches.
• What do you see as the impact of IAQ on California residents?
o In general (not California‐specific), there is concern over mitigating mold and moisture‐related issues
o There is a tremendous impact from IAQ problems for residents of California. General consumers are asking for recommendations for control devices for mold and moisture due to concern about the impact of mold and sickness. There seems to be an increased awareness of this issue.
22

o There is concern that IAQ significantly affects people because of the time spent indoors (home, children in school). Also, the overall increase in instances of asthma makes IAQ more important than ever; people with allergies and who have an increased risk of cancer or other diseases will be impacted by IAQ.
o IAQ significantly affects people with asthma and respiratory disease.
• We have found that California residents are most concerned about:
Household pesticides for killing ants, roaches.
Chemicals used on pets for flea control, etc., and kitty litter, which is made from asbestos.
Household lead, including candles with lead.
Teflon‐coated pans and cooking equipment which have chemicals that get into the air from overheating. We recommend throwing them out.
Mold causing severe health problems.
Diesel emissions from buses that get into school buildings.
In Cincinnati, we receive concerns from Public Housing residents about the Shelter in Place policy for emergencies. Residents are instructed to turn off their intake air. However, residents don’t have central heating and air cooling systems and would suffer from closing windows.
• Are residents expressing an interest in improving IAQ? If they are expressing interest, is it because (check any that apply):
o they suffer/or have suffered from allergy, asthma, other sinus respiratory problems
o they suffer from other medical conditions
o they are concerned about the health of their children
o they associate better health and quality of life with improved IAQ
o other issues, such as…
(Note: More than one participant checked all.)
• Response by the public is mixed; people tend to respond to media reports of hazards and are not in favor of government‐sponsored ads.
o Often, we receive calls related to solving particular problems. People don’t realize the full scope of the problem.
o Mold and formaldehyde concerns are generally accepted by the public, whereas hazards from cooking, candles, etc., get a mixed response.
23

o People who suffer from allergy and respiratory problems are more concerned with IAQ, as are people who concerned about their children’s health.
• With regard to the different types of indoor air pollution, which types do you think have the greatest negative impact on California residents? List High, Medium, and Low impact.
o Group 1 (bacteria, mold, dust mites, animal dander)
o Group 2 (plastics, pesticides, flame retardants)
o Group 3 (composite wood products, furnishings, perma‐press fabrics, etc.)
o Group 4 (solvents, glues, cleaning agents, paint, etc.)
o Group 5 (cooking, candles, aerosol sprays, house dust, etc.)
o Group 6 (cooking, wood burning)
Table 1 summarizes responses: Table 1. Organizations’ estimates of the degree of negative impact of different indoor air pollutants on California residents
Group 1: bacteria,
mold, dust mites, animal
dander
Group 2: plastics,
pesticides, flame
retardants
Group 3: composite wood
products, furnishings, perma-press fabrics, etc.
Group 4: solvents,
glues, cleaning agents,
paint, etc.
Group 5: cooking, candles,
aerosol sprays, house dust, etc
Group 6: cooking,
wood burning
Org. 1 H M L L M L–M
Org. 2 H H L M M M
Org. 3 H M H* M L L
Org. 4 H L L M L L
Org. 5** H H Unsure H H L
Org. 6 H M H H H H
Org. 7 H M L H M M
*Specified formaldehyde.
**Noted that households are “too clean”; people are using too many harsh cleaners, such as bleach.
Source: Oak Ridge National Laboratory
24

• How knowledgeable are California residents about these pollutants?
(Table 2 summarizes responses.) Table 2. Estimated knowledge level of California residents about different indoor air pollutants
Group 1: bacteria,
mold, dust mites, animal dander
Group 2: plastics,
pesticides, flame
retardants
Group 3: composite
wood products,
furnishings, perma-press fabrics, etc.
Group 4: solvents,
glues, cleaning agents,
paint, etc.
Group 5: cooking, candles, aerosol sprays,
house dust, etc
Group 6: cooking,
wood burning
Org. 1 L–M L–M L–M M M M–H
Org. 2 H L L L L L
Org. 3 M M M M L L
Org. 4 L L L L L L
Org. 5 H M* L L M L
Org. 6 H H L M M H
Org. 7 H L L L L L
* growing” knowledge
Source: Oak Ridge National Laboratory
• How do you learn about new technologies that reduce indoor air pollution?
o Perusing monthly trade journals, newsletters, and newspapers.
o Contacting, or reviewing literature, of other organizations.
o Attending health conferences.
o By word‐of‐mouth communication.
o Visiting allergists’ offices.
o Surfing the Internet.
• How is your organization recommending reducing the impact of indoor air pollution? How are residents responding to these recommendations? How much do these solutions cost?
o We suggest filtration and ventilation system standards through builders. There is a substantial range of cost from opening a window (free) to UV light filtration systems (expensive).
o We offer a hazardous substances policy and indoor pollution guidelines, as well as education and information access.
25

o We suggest controlling indoor pollutants at the source, that is, eliminating the cause rather than treating the air. For example, we would like to ban ozone producing devices from the home.
o We recommend reducing or eliminating VOCs and formaldehyde from building products. Builders are moving away from the “hazardous” products as acceptable alternatives become available.
o We suggest controlling environmental aero‐allergens and avoidance of chemical irritants, tobacco substances, and particulates.
o We recommend integrated pest management, such as avoiding aerosols; using bed covers, washing walls with hot water, and getting rid of carpet.
o We want California ARB regulatory controls, local policies on wood burning, and public information on sources and impacts. There is a need to engage people on policy and to give them more information. People should choose products that lower emissions.
o We believe that a behavior change is necessary. Tenants need to advocate for better IAQ measures with landlords, such as venting and correcting roof leaks, along with low‐cost solutions, such as pillowcases. Residents must be motivated to improve health.
• What do you think about the impact of HVAC systems on indoor air pollution? What impact do these systems have on IAQ?
o These systems have a significant impact. Correct installation will improve quality while bad design and installation lead to problems.
o These systems do not create a big difference because most homes are ‘leaky,’ but they have a bigger impact in offices.
o They reduce aero‐allergen penetration from the outside, reduce dust mite growth through humidity control, and create a positive fresh air exchange.
o From a residential standpoint, the impact on IAQ is very important. In schools, air exchange is critical.
o It is better to control IAQ at the source than to treat the air. However, this approach could be challenging for existing homes and would not address such issues as pollen and external ozone. Many low‐income houses have window units and not central systems.
o Homes are so leaky that these systems don’t make a difference. Having a properly functioning system that is maintained is critical. The filters need to be monitored and changed.
• ORNL in collaboration with an HVAC manufacturing company is developing a new HVAC system that provides the benefits of heating and cooling and air quality improvement, with no increase in energy consumption. Would such a system be of value to California
26

residents? Would it be of interest to your organization? (Why or why not?) Would residents be willing to pay an incremental premium for such a system? How much more? ($1000–$3000 range)
o Residents would be interested because of the energy savings and IAQ impacts.
o It must be seen as cost effective and efficient. The unit would have to put out less dust than current systems and need to be more efficient and cleaner.
o Customers would be willing to pay more, but not much more.
o There are already a number of air filtering and treatment systems on the market, especially the portable room‐sized units.
o Some central systems are also available, and manufacturers are moving to include that capability in their product line.
o It is necessary to carefully define “IAQ” and scientifically verify performance and impact on public health.
o A healthy air system should be a part of energy efficiency for public housing and also be included as a part of a Healthy Homes Initiative.
o The price range seems OK, since a new forced air system for a three‐bedroom tract house runs about $2000. People would value ENERGY STAR® products.
o Make it clear how it would actually improve IAQ.
o Stress how the proposed product would differ from what is currently on the market today.
• What else might be important in offering a new HVAC system with air quality improvement benefits to homes?
o Meeting the standard 62.2 efficiency rating, which is more efficient than current systems, along with forcing out less dust. Other important improvement would be helping the air smell better and contributing to a fresh odor.
o Clarify the benefits of such a system and educate consumers on maintenance.
o People need to take personal responsibility for energy efficiency.
o Many home residents are renters. Landlord tenant rights are affected here and are an important issue.
o Backing from the Environmental Protection Agency and Alliance for Energy could be vital for such improvements to become widespread.
o Filters in mechanical systems must be very accessible to ensure they are changed or cleaned.
27

o Current California building trends put the HVAC unit in the attic and place the filters in a difficult‐to‐reach location.
o Electrostatic precipitators do emit some ozone, but the amount is highly variable with the design of the unit and the cleanliness of the plates. Currently, there is limited data on the best designs.
o Focus on areas such as Fresno and Los Angeles. The Central Valley has a real pollen problem, and Southern California suffers from chemically induced asthma; Riverside is particularly bad.
o San Francisco is a lot better due to the ocean breezes that flush the “bad” air into the Central Valley.
o Formaldehyde probably can’t be treated by filtration. There is a lot of pressure to move to low‐emitting materials in California.
o Smokers are declining in California in general. Those that do smoke tend to smoke outdoors or don’t care about or understand the impact on their fellow residents. These folks would not be customers for your product, but don’t constitute a significant part of the total market.
3.6. Interpretation of Intermediary Feedback The team’s intermediaries, including utilities, builders, HVAC contractors and manufacturers, and organizations, were almost all favorable towards the healthy air HAU. These favorable attitudes and other important feedback are summarized in the responses below.
• Utilities specifically noted that the HAU should meet EER minimums to be reviewed for a rebate program, be affordable, have clearly discernable benefits, and be ENERGYSTAR®–compliant.
• The contractor intermediaries expressed interest, noting that payback would have to be clear for contractors to stand behind the HAU.
• Manufacturers indicated the need for non‐invasive and quality service maintenance. Homeowners do not want to deal with difficult or messy replacement filters or parts. In addition, the consumer ability to control humidity, temperature, and ventilation levels and other comfort features is important.
• Builders noted that the HAU would have to be cost‐competitive, that the cycle time for incorporating HAU into the building process would have to be reasonable, and that the HAU would have to offer a substantial improvement in air quality.
• Organizations expressed interest in the healthy air unit because of the energy savings and IAQ impacts. Specifically, organizations linked the unit’s favorable acceptance with cost‐efficiency and effectiveness, reasonable cost, clear advantages over currently available air treatment systems (central and portable), scientific verification of benefits, reduced
28

generation of dust, improved odor of air generated, ease of maintenance, and an accessible filter.
Among the market intermediaries, the utilities received the least feedback from residential consumers about IAQ, perceiving residents to be most interested in comfort and cost. Both contractors and builders indicated that residential consumers are knowledgeable about some IAQ factors and are most interested in IAQ if they are older and/or experiencing health problems (especially allergies and asthma). Overall, these intermediaries acknowledge that IAQ is only one benefit perceived from an HVAC system and not necessarily a high‐priority consideration.
Manufacturers perceived an increasing consumer interest in IAQ and have responded by developing more systems that can be integrated with their heating and cooling units. They indicated that most consumers are interested in these systems if they have health issues. They also acknowledged that residential consumers are interested in reliability and comfort. Builders recognized the correlation between tightness of construction and IAQ. They also mentioned that residential customers are concerned with security and therefore do not open windows for ventilation. Security is therefore another value that can contribute to consumer interest in IAQ.
Other important marketing factors mentioned through discussions with intermediaries about market adoption of IAQ systems include the following:
• The sales force must be trained to effectively explain the benefits of IAQ systems.
• Consumers need to be better educated about IAQ, particularly with regard to comfort and security
• Systems must be maintained effectively to ensure performance.
Actual interviews with consumers reflect greater overall interest in IAQ across market sectors (and not just those with health or age issues) than perceived by the most of the market intermediaries. The exception is among the organization intermediaries, which largely represent health concerns or consumer advocacy positions. Their responses closely align with the consumer responses.
This disconnect between perceptions of key market intermediaries and consumer interest in IAQ reveals much opportunity for better marketplace intervention through more education of intermediaries about consumer interests, as well as better information for consumers about marketplace options. The California Energy Commission could provide a forum to more effectively engage intermediaries in the interests of consumers.
As discovered in our earlier attempts to support greater market adoption of other energy‐efficient products, consumers have multiple criteria when selecting a system, and are not often willing to accept any one attribute without the benefit of the others. Consumer values that have been cited by intermediaries include overall air comfort, system reliability, and ease of maintenance. In addition, intermediaries pointed out that residents keep their windows closed to enforce personal security, thus exacerbating problems from indoor air pollutants. Thus,
29

personal security is a consumer value that affects IAQ. All these values should all be considered when developing a new product.
30

4.0 Feedback from Consumers The analysis performed by the project team indicates a market in California for an integrated HVAC system that improves IAQ, significant opportunities to improve air quality in California, and a favorable outlook for an integrated HVAC system that would provide a healthy air unit for homeowners.
The project team distributed the information tool developed in this project (Appendix A) among three different groups of consumers, receiving responses from 407 homeowners about IAQ and its effect on health. The team also wanted to gauge consumer feelings about installing an HAU in their homes. The results are summarized graphically by groups:
• One group (n=25) consisted of patients from an allergist’s office waiting room.
• A second group (n=47) was drawn from a home tour (prospective homebuyers/remodelers).
• A third and largest group comprised 335 homeowner members of The National Trust for Historic Preservation, a non‐profit organization focused on preserving America’s architectural heritage.
These groups were then combined (n=407) to show results for all respondents. A series of charts in Appendix 1 depicts the survey results for each group individually and all groups combined. Some charts represent subset groups (“non‐allergy sufferers”) for further interpretation.
The survey distributed to the allergist’s office group and the home tour group is in Appendix A, as is the survey distributed to the third group. The latter differed slightly in that an additional option was added to question 6, which is explained under that item’s feedback discussion.
4.1. Interpretation of Consumer Feedback The survey data show that California consumers are interested in a new HVAC technology that supports improved IAQ and are willing to pay a premium price for it. The original assumption—that only households with an allergic or asthmatic resident would consider buying this product—did not hold: the response from those who did not suffer from allergies was overwhelmingly favorable. Consumer response confirmed the assumption that people would buy an HAU when equipping a new home or replacing a failed HVAC. People also responded that they would be likely to install, or upgrade to, an HAU when remodeling or responding to a health condition in the home. Conclusions regarding the market for the potential HAU technology are listed below:
• Overall feedback from three groups of California residents indicates that 74% are interested in an integrated HVAC system that improves IAQ. The data show that an HAU must provide comfortable, fresh, odor‐ and pollutant‐free air. Across the board, homeowners value all of these qualities for indoor air.
• A total of 66% of the respondents indicated a willingness to pay at least a $1000–$2000 premium for an HAU, which the team considers a potentially viable price range.
31
• Sectors relating to remodeling, replacement, or responding to acute health condition form the bulk (77%) of the HAU market, with 19% associated with new home construction. Therefore, the technology must be easily adapted to a wide range of existing physical conditions.
• Of the respondents, 71% are non‐allergy sufferers, indicating that there is a strong market for IAQ among those without major health issues.
• Residents are most likely to install an HAU system when replacing their old system. Therefore, contacts with the local contractors who usually install replacement systems are important. This supports the importance of having a trained installation and sales force.
• Survey participants assigned almost equal value to each of the attributes they associated with “healthy” air: comfort, freshness, odor‐free, and pollutant‐free. Ensuring that a new HVAC system addresses these attributes is therefore critical. It should be noted that the attribute of comfort was also identified by intermediaries as important. Comfort could therefore be a springboard for marketing efforts by these groups, as well as a point of understanding for consumers.
• Consumer respondents who currently use devices to treat air are in the minority (38%). However, among the group with allergies/respiratory conditions use of devices is high (71%). These statistics confirm the strong market potential for a new IAQ system, and point to a need for more consumer education on this issue.
• Those who use devices are familiar with filtration systems, with a slightly larger group 53%) using filters that treat an entire house and a smaller group (47%) using filters to treat a room. versus a room. However, the survey does not indicate whether some respondents actually use both types of filtration. Also, it should be noted that allergy‐sufferers have a greater tendency to use room units (60%) versus entire‐house filtration (40%). This higher percentage of room use is much higher than for non‐allergy sufferers (47%). When developing a new whole‐house system, comparing its performance to that of room systems would be especially beneficial for people with health issues. In addition, it is not clear that consumers understand the concept of whole‐house systems. When communicating with consumers about a new HVAC system, it is important to use terminology that consumers will understand. Certainly comparing benefits with room and entire house filtration could be a starting point.
32

5.0 Conclusions and Recommendations 5.1. Conclusions These data indicate significant opportunities to improve air quality in California through an integrated HVAC system that would provide a healthy air unit for homeowners. In fact, the market may be as large as 370,000 units per year, or approximately 50% of the annual HVAC market in California. This encouraging estimate—along with the very favorable responses to the HAU—suggests that efforts to develop such a system and educate consumers and market intermediaries about the product could prove extremely valuable.
5.2. Recommendations The following findings can be used to guide the HAU development process:
• The HAU should meet EER minimums to be reviewed for a rebate program, be affordable, have clearly discernable benefits, and be ENERGYSTAR®–compliant.
• Payback would have to be clear for contractors to stand behind the HAU.
• Elements that would increase marketability include non‐invasive maintenance, quality service, the potential for substantially improved air quality, and the ability to control humidity, temperature, and ventilation levels and other comfort features.
• Comparing the performance of a whole house unit to that of a room system would be especially beneficial for people with health issues.
The following findings can guide efforts to market the HAU:
• IAQ is only one benefit perceived from an HVAC system and not necessarily a high‐priority consideration. Marketing materials and training should emphasize the HAU’s cost‐efficiency and effectiveness, reasonable cost, reliability, clear advantages over currently available air treatment systems, scientific verification of benefits, reduced generation of dust, increased comfort, improved odor of air generated, and ease of maintenance.
• Builders mentioned that residential customers are concerned with security and therefore do not open windows for ventilation. Improved security is therefore another value that can contribute to consumer interest in IAQ.
• Residents are most likely to install an HAU system when replacing their old system. Therefore, contacts with the local contractors who usually install replacement systems are important. This supports the importance of having a trained installation and sales force. The sales force must be trained to effectively explain the benefits of IAQ systems.
• When communicating with consumers about a new HVAC system, it is important to use terminology that consumers will understand.
• Consumers need to be better educated about IAQ, particularly with regard to comfort and security.
33
• Marketplace intervention could be enhanced through more education of intermediaries about consumer interests, as well as better information for consumers about marketplace options. The California Energy Commission could provide a forum to more effectively engage intermediaries in the interests of consumers.
5.3. Benefits to California This work confirmed that the potential market in California for a HAU is greater than expected—possibly as high as 50% of the annual HVAC market in California. This finding speaks to the value of continued work to develop and market the HAU. Successful development and commercialization of such a unit in would provide California residents with a cost‐effective, energy‐efficient, and user friendly means of improving the indoor environment within homes, which in turn promises significant health benefits.
34

6.0 References
Air Conditioning, Heating & Refrigeration News (ACHRN). 2004. “June unitary shipments top 1 million,” August 16, Vol. 222, Issue 16, p 1.
ACHRN. 2005. “There goes California,” Feb. 7, Vol. 224, Issue 6, p 70.
ACHRN. 2005. “Trends in utility incentive programs,” April 11, Vol. 224, Issue 15, p 26. http://www.pge.com/res/rebates/central_heat_pumps/index.html
ARI. 2004. www.ceehvacdirectory.org.
American Lung Association (ALA) of California. 2005. State of the Air: 2004. May 10, http://lungaction.org/alert‐description.tcl?alert_id=2804685.
ALA. 2005a. State of the Air: 2005, May. http://lungaction.org/reports/stateoftheair2005.html.
ALA. 2005b. “32 California Counties Fail American Lung Association’s Annual State of the Air Clean Air Test; 31.6 Million Californians Threatened by Dangerous Ozone and/or Particle Pollution Levels,” http://www.californialung.org/press/050428SOTA.html
Asthma and Allergy Foundation of America. 2000. The Costs of Asthma, Asthma and Allergy Foundation 1992 and 1998 Study, 2000 update. http://www.aafa.org/display.cfm?id=8&sub=42#_ftnref18
ARB. 2004. Indoor Air Pollution in California. www.arb.ca.gov/research/indoor/ab1173/ab1173.htm
ARB. 2005. Report to the California Legislature: Indoor Air Pollution in California. http://www.arb.ca.gov/research/indoor/ab1173/finalreport.htm.
ARB. 2004. Children’s Health Study, September. http://www.arb.ca.gov/research/chs/chs.htm
ASHRAE. 2004. The HVAC&R Industry, March 4, Vol. 3, No. 10.
Barnaby, David and Mercia Tapping. “Air Purifiers: Everything You Need to Know but Were Afraid to Ask,” AllergyBuyersClub.com. www.allergybuyersclub.com/acr/acr_53.shtml#a.
Boudreau, G. 2005. HVAC Market in California. Oak Ridge National Laboratory. May.
Bower, John. 1991. “Air Filters.” East West. September/October 1991, p. 28. www.hhinst.com/Artairfilters.html
Clean Air Device Manufacturers Association. 2005. Spoken communication.
California Builder Magazine. 2005a. “More, Better, Faster, Cheaper,” April/May. http://www.cabuilder.com/internal.asp?pid=107
California Builder. 2005. from Computer Reseller News, October 11, 2004, “Hot Profits—HVAC environmental control yields cost savings for homeowners, margins for integrators.”
35

California Energy Commission. http://www.energy.ca.gov/maps/climate_zone_map.html
California Health Interview Survey. 2003. http://www.healthpolicy.ucla.edu/pubs/publication.asp?pubID=83, November.
Desicant Rotors International. 2005. “Energy Conservation in Air Conditioned Space Using Enthalpy Wheels,” May. http://www.drirotors.com/pdf/articles/iaq/enegyconserv_ac_wheels.pdf
Electric & Gas Industries Association (EGIA). 2003. “Pre‐Workshop Statement of the Electric & Gas Industries Association in Preparation for Workshop 2: Consumer Needs, Before the Public Utilities Commission of the State of California,” December 5.
Fischer, J. et al. 2002. Documenting the Effectiveness of Cosorption of Airborne Contaminants by a Field‐Installed Desiccant System, Final Report, SEMCO, Inc. November. (This report investigated cosorption of common indoor and outdoor pollutants as well as moisture adsorption. This approach may be applicable to the HAU.)
Fisk, W. 2004. “Health and Productivity Gains from Better Indoor Environments and Their Implications for the U.S. Department of Energy.”
Harvard University. 2005. The Changing Structure of the Home Remodeling Industry: Improving America’s Housing, January.
Heating/Piping/Air Conditioning Engineering. 2005. HVAC market primed for a comeback: green buildings to play a large role,” Heating/Piping/Air Conditioning Engineering, March, Vol. 77, Issue 3, p 5. Vol. 77, Issue 3, p 5, March.
Industry Outlook. 2005. “Slow, but steady: economic growth will slow a bit during 2005, but appliance demand should hold up reasonably well.”
Mazurkiewicz, Greg. 2004. “Housing Market Is Still Robust, But Is It At Its Peak?” ACHRN. achrnews.com.
Mergers & Acquisitions Report. 2004. “Residential HVAC M&A Percolates.” Dec. 6.
NAW. 2004. “The NAW Economic Forecast 2004.” NAW Distribution Research & Education Foundation, Harvard University’s Joint Center for Housing Studies.
NEMI. 2004. “Residential HVAC Single Family Housing,” January 14.
NEMI. 2004. “Residential HVAC Market Research,” January 14.
ORNL. 2004. November 2004 draft report Indoor Air Pollution in California, and subsequent versions (www.arb.ca.gov/research/indoor/ab1173/ab1173.htm).
Office of Environmental Health Hazard Assessment of California. 2003. http://www.oehha.ca.gov/public_info/facts/airkids.html
Palmer, J.A. 2005a. “Healthy Air” HVAC Systems in California Research: CEC Market Opportunities, California Energy Commission.
36

Palmer, J. A. 2005b. “Healthy Air” HVAC Systems in California Research: Opportunities for Residential Markets by Climate Zone. California Energy Commission.
Parks Associates. 2004. “Builders Shopping for New Products to Differentiate Their Homes.” December 14. http://www.parksassociates.com/press/press_releases/2004/builder1.html
Professional Builder. 2005. “Builders shop to differentiate their homes.” Jan. 2005, Vol. 70, Issue 1, p 204]
Rodale. 1982. Rodale’s New Shelter magazine.
San Diego Regional Energy Office. 2006. http://www.sdenergy.org/eMessages_View.asp?MsgID=157
State of California. 2005. http://www.dof.ca.gov/HTML/FS_DATA/STAT‐ABS/Tables/CITY_COUNTY_LIST10‐03.pdf
TableBase. 2002. “U.S. top 10 contractors for the Midwest, Northeast, South, and West by revenues in dollars, for 2002.”
U.S. Census Bureau. 2005. American Housing Survey.
U.S. Department of Energy. 2005. Building America Program, April 28, 2005. http://www.eere.energy.gov/buildings/building_america/climate_zones.html
Wendt, R. 2006. Oak Ridge National Laboratory, spoken and email communication, February.
Whole House Filters & Purifiers, Whole House Heat Recovery & Energy Recovery Air Exchanger Systems, http://www.inspiredliving.com/airpurifiers/heat‐recovery.htm.
Related Websites
http://www.archenergy.com/pier‐fdd/. California Energy Commission’s PIER Program
http://www.jchs.harvard.edu/publications/remodeling/remodeling2005.html
http://www.lungusa2.org/embargo/sota05/SOTA05_final.pdf
http://www.puritec.com/residential/air/whole_house_air‐packages.htm
http://www.sce.com/RebatesandSavings/Residential/CentralHeatPump/
http://www.sdge.com/residential/single_family_rebates.shtml
http://www.surroundair.com/carbon‐air‐filter.htm. “About Carbon Air Filters.”
http://www.surroundair.com/hepa‐air‐filter.htm. “About HEPA Air Filtration.”
http://www.surroundair.com/ionic‐ozone.htm. “About Ozone Air Purification.”
http://www.surroundair.com/negative‐ions.htm. “About Negative Ions/Air Ionizers.”
http://www.surroundair.com/uv‐light.htm. “About UV Light Air Purification.”
37

38

7.0 Glossary
ACHRN Air Conditioning, Heating & Refrigeration News
ALA American Lung Association
ARB California Air Resources Board
ARI Air Conditioning and Refrigeration Institute
ASHRAE American Society of Heating, Refrigerating, and Air Conditioning Engineers
BTC Building Technology Center
DOE U.S. Department of Energy
EER energy efficiency ratio
EGIA Electric & Gas Industries Association
Energy Commission California Energy Commission
HAU healthy air unit
HVAC heating, ventilation, and air conditioning
IAQ indoor air quality
NEMI National Energy Management Institute
ORNL Oak Ridge National Laboratory
PIER Public Interest Energy Research
R&D research and development
RD&D research, development, and demonstration
SEER seasonal energy efficiency ratio
UV ultraviolet
VOC volatile organic compound
39

40
Appendices
The four appendices to Report, listed below, are available in a separate volume:
• Appendix A Information Tool and Consumer Feedback: CEC‐500‐2007‐031‐APA:
• Appendix B. “Snapshot” of the HVAC and Air Cleaner Markets: CEC‐500‐2007‐031‐APB
• Appendix C. California Climate Zones, Air Pollution, and Related Health Issues: CEC‐500‐2007‐031‐APC
• Appendix D. California Population at Risk from Pollution: CEC‐500‐2007‐031‐APD
41

42

Appendix A. Information Tool and Consumer Feedback


I-1
APPENDIX I: CONSUMER FEEDBACK
This project was conducted by ORNL and UNICO to assess the homeowner market to determine whether there was a need for additional research and development (R&D) for an environmentally friendly heating, ventilation, and air conditioning (HVAC) “healthy air” unit (HAU) in California. From our discussions with HVAC market intermediaries, we developed an information tool requesting feedback from homeowners. We wanted to find out how homeowners felt about indoor air quality and its effect on health. We also wanted to gauge their feelings about installing a healthy air unit in their homes. The information tool was administered by market intermediaries to three groups (the original project scope specified a sample group of 75, but our responses surpassed that by more than five times).
• The first group (25 allergy patients) was contacted through a large allergy clinic in California that agreed to help with our analysis.
• The second group included home tour attendees (47 prospective or current homeowners). The home tour sponsors were builders and contractors who work with our DOE Building America Team; they agreed to distribute the information tool to tour attendees.
• The third group, 335 homeowner members of the National Trust for Historic Preservation, was contacted through our HVAC industry partner, Unico, Inc., which works with the Trust.
Although these results are certainly not meant to represent the entire state of California, they allowed us to determine whether there was significant consumer interest in the healthy air unit among homeowners.
Note: The surveys distributed to the allergist’s office group and the home tour group are at the end of this appendix. The survey distributed to the Unico group, also at the end of this appendix, differed slightly in that an additional option was added to question 6, which is explained under that item’s feedback.

● Comfortable (temperature and humidity)● Fresh (not stale – plenty of oxygen)● Odor free (no objectionable smells)● Pollutant free (pollen, mold, smoke, chemicals)● Other
The graphs illustrating the responses for this question show that people value all of the listed characteristics, with all of the characteristics essentially carrying equal weight. (Most respondents checked all of the first four items. When “Other” was selected, respondents listed “fresh air,” “good circulation,” “mixed with outdoor air,” comfortable (temperature and humidity), plenty of oxygen, and pollutant free (pollen, mold, smoke, chemicals).
1. Which characteristics in your opinion would best describe healthy indoor air? Check all that apply.
Characteristics that describe healthy air (n=25; allergist's office group)
17; 24%
19; 26%14; 19%
20; 28%
2; 3%
a. comfortable
b. fresh
c. odor-free
pollutant free
other
Characteristics that describe healthy air (home tour group; n=47)
27; 21%
34; 26%
34; 26%
33; 25%
3; 2%
a. comfortable
b. fresh
c. odor-free
pollutant free
other
characteristics that best describe healthy air (n=335; UNICO group)
281; 22%
333; 26%301; 24%
334; 26%
21; 2%
comfortable
fresh (not stale, plenty ofoxygen)odor free
pollutant free
other
6
characteristics that best describe healthy air (n=407; all groups)
281, 22%
333, 26%301, 24%
334, 26%
21, 2%
comfortable
fresh (not stale,plenty of oxygen)
odor free
pollutant free
other
I-2
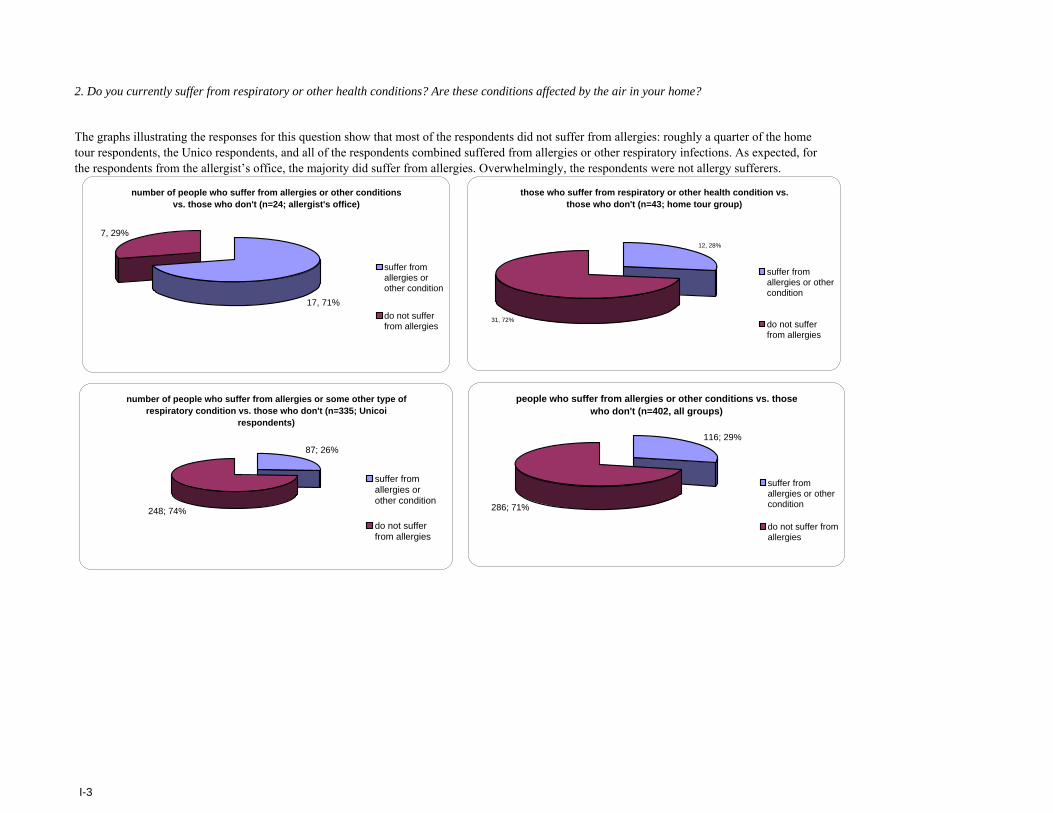
2. Do you currently suffer from respiratory or other health conditions? Are these conditions affected by the air in your home?
The graphs illustrating the responses for this question show that most of the respondents did not suffer from allergies: roughly a quarter of the home tour respondents, the Unico respondents, and all of the respondents combined suffered from allergies or other respiratory infections. As expected, for the respondents from the allergist’s office, the majority did suffer from allergies. Overwhelmingly, the respondents were not allergy sufferers.
number of people who suffer from allergies or other conditions vs. those who don't (n=24; allergist's office)
17, 71%
7, 29%
suffer fromallergies orother condition
do not sufferfrom allergies
those who suffer from respiratory or other health condition vs. those who don't (n=43; home tour group)
12, 28%
31, 72%
suffer fromallergies or othercondition
do not sufferfrom allergies
number of people who suffer from allergies or some other type of respiratory condition vs. those who don't (n=335; Unicoi
respondents)
87; 26%
248; 74%
suffer fromallergies orother condition
do not sufferfrom allergies
people who suffer from allergies or other conditions vs. those who don't (n=402, all groups)
116; 29%
286; 71%
suffer fromallergies or othercondition
do not suffer fromallergies
I-3

As in question 2, respondents who did not use any type of filtering device were in the majority. Again, the respondents from the allergist’s office represented the greatest number of people who use filters in their homes to improve indoor air.
3a. Do you currently use filters and/ or other devices to treat your indoor air? If yes, describe the filters and/or devices you are using.
people who use some type of filtering device in their homes vs. those who do not (n=24,
allergist's office group)
17; 71%
7; 29%use filter or otherdevice to treatindoor air
use no filter
people who use some type of filtering device in their homes vs. those who do not (n=46, home
tour)
15; 33%
31; 67%use filteringdevice of sometypeuse no filteringdevice
people who use filter or other device to treat indoor air vs. those who do not (n=335; UNICO group)
122; 36%
213; 64%
filter
no filter
number of people who use some type of filter in their homes vs. those who do not (n=405, all groups)
154; 38%
251; 62%
filter
no filter
I-4

3b. Do these filters and/or devices treat rooms and/or an entire house?
Most of the respondents used whole-house filtering devices; of the respondents from the allergist’s office, the majority used room-type filters in their homes to improve indoor air. Overall, whole-house systems seem to dominate.
people who use a whole-house filtering device vs. those who use a room device (n=123, UNICO group)
67; 54%
56; 46%
whole-house
room
people who use filtering device-- whole house vs. room (n=153, all groups)
81; 53%
72; 47%
whole-house
room
people who use a whole-house filtering device vs. those who use a room-type device (n=15, allergist's
office)
6; 40%
9; 60%
whole house
room
people who use a whole-house filter vs. those who use a room filter (n=15, home show group)
8; 53%
7; 47%
whole house
room
I-5

For all of the groups, the majority of people were interested in the HAU by a large margin, except for the allergist’s office group, which was almost evenly split (see first four graphs below in item 4).
The data on non-allergy sufferers was reviewed and revealed overall an overwhelmingly positive interest in the HAU (see last four graphs below in item 4). Among non-allergy sufferers, the group from the allergist’s office was almost evenly split on interest in the HAU.
4. Would you be interested in a whole house heating and cooling system that provided “healthy air” with the characteristics you described in item 1 above (comfortable, fresh, odor free, pollutant free, other)?
those interested in HAU vs. those who are not (n=24; allergist's office group)
13; 57%
10; 43%
interested in HAU
not interested inHAU
those interested in HAU vs. those not interested (n=46; home show group)
41; 89%
5; 11%
interested inHAU
not interested inHAU
those interested in HAU vs. those not interested (n=327, Unicoi group)
240
87
interested inHAU
not interested inHAU
those interested in HAU vs. those not interested (n=395, all groups)
293; 74%
102; 26%
interested in HAU
not interested in HAU
I-6
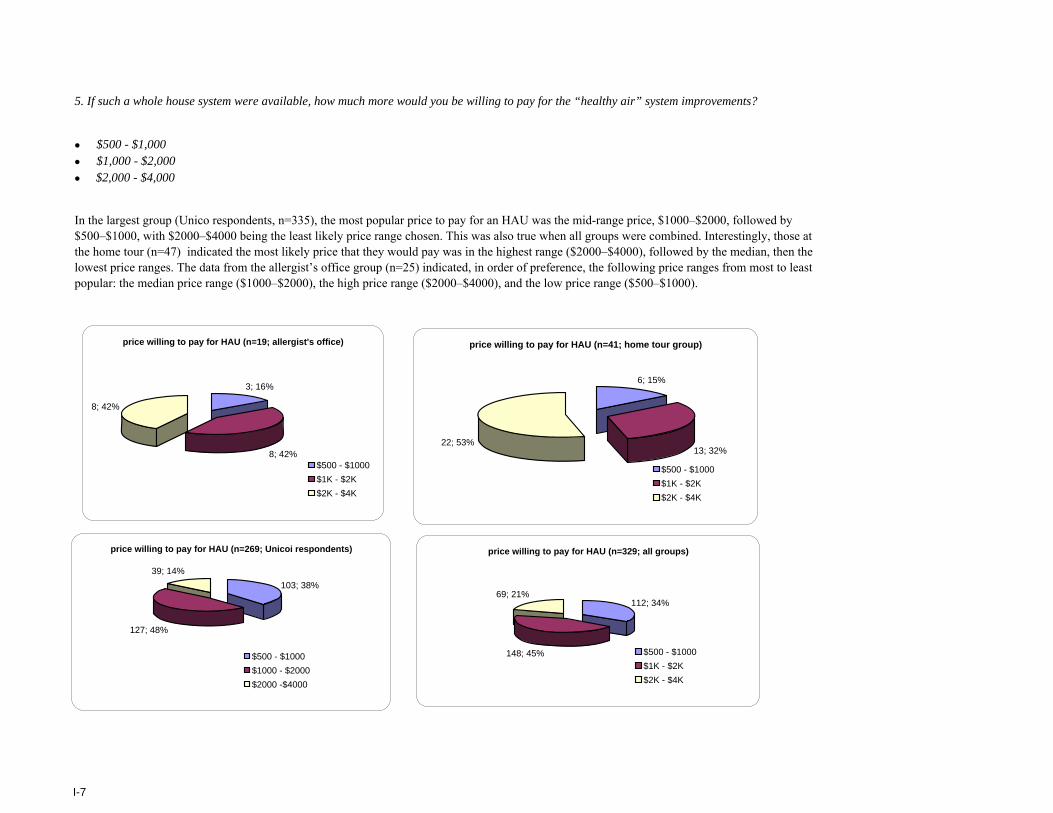
● $500 - $1,000● $1,000 - $2,000● $2,000 - $4,000
5. If such a whole house system were available, how much more would you be willing to pay for the “healthy air” system improvements?
In the largest group (Unico respondents, n=335), the most popular price to pay for an HAU was the mid-range price, $1000–$2000, followed by $500–$1000, with $2000–$4000 being the least likely price range chosen. This was also true when all groups were combined. Interestingly, those at the home tour (n=47) indicated the most likely price that they would pay was in the highest range ($2000–$4000), followed by the median, then the lowest price ranges. The data from the allergist’s office group (n=25) indicated, in order of preference, the following price ranges from most to least popular: the median price range ($1000–$2000), the high price range ($2000–$4000), and the low price range ($500–$1000).
price willing to pay for HAU (n=19; allergist's office)
3; 16%
8; 42%
8; 42%
$500 - $1000
$1K - $2K
$2K - $4K
price willing to pay for HAU (n=41; home tour group)
6; 15%
13; 32%22; 53%
$500 - $1000
$1K - $2K
$2K - $4K
price willing to pay for HAU (n=269; Unicoi respondents)
103; 38%
127; 48%
39; 14%
$500 - $1000
$1000 - $2000
$2000 -$4000
price willing to pay for HAU (n=329; all groups)
112; 34%
148; 45%
69; 21%
$500 - $1000
$1K - $2K
$2K - $4K
I-7

● Income tax deduction as medical expense● Partial coverage under medical insurance● 5-year product warranty● Other
For the group from the home tour, the income tax deduction as a medical expense was chosen most often as an incentive to install/purchase an HAU, followed by the 5-year product warranty, responding to an acute medical condition in the home, then partial coverage under medical insurance. The allergist’s office group’s responses were similar, except that partial coverage under medical insurance ranked over the warranty.
On the information tool that was sent to the Unico respondents, the choice “pollutant free (pollen, mold, smoke, chemicals)” was added. On the chart for all groups combined, the results for that choice are all representative of the Unico group. Unico responses ranked in order of importance from most to least as follows: pollutant free, income tax deduction, 5-year warranty, and partial coverage under medical insurance.
6. What other incentives might encourage you to purchase a “healthy air” whole house heating and cooling system?
other incentives for purchasing/installing an HAU (n=47; home show group)
45; 36%
35; 29%
35; 29%
7; 6%
Income taxdeduction as medexpense
Partial coverageunder medinsurance
5-yr productwarranty
Other
other incentives for purchasing installing an HAU (n=25; allergist's office group)
13; 37%
12; 34%
8; 23%
2; 6%
Income taxdeduction asmed expense
Partial coverageunder medinsurance
5-yr productwarranty
Other
other incentives for purchasing a healthy air unit (n=335)
185; 27%
109; 16%174; 25%
190; 27%
36; 5%income tax ded
part cov under med exp
5-yr warranty
pollutant free
other
other incentives to purchase/install an HAU (n=407, all groups)
230; 28%
144; 18%209; 26%
190; 23%43; 5%
income tax ded
part cov under med exp
5-yr warranty
pollutant free
other
I-8

● Buying a newly constructed home● Remodeling your existing home● Replacing your worn-out heating and cooling system● Responding to acute medical conditions in your household● Other
7. When would you most likely install/upgrade to a “healthy air” whole house heating and cooling system?
The results of this question were fairly similar for each group. The order of preference, from most to least, among respondents was as follows: they would be most likely to install an HAU when replacing a worn-out system, remodeling an existing home, buying a new home, and responding to acute medical conditions of a family member.
time most likely to install/upgrade to an HAU (n=25; allergist's office)
13; 30%
12; 29%
8; 19%
7; 17%2; 5%
Buying newlyconstructed home
Remodeling existinghome
Replacing worn-outsystem
Responding to acutemedical conditions inyour home
Other
time most likely to install/upgrade to an HAU (n=47)
26; 26%
19; 19%26; 26%
24; 24%
5; 5%
Buying newlyconstructed home
Remodeling existinghome
Replacing worn-outsystem
Responding to acutemedical conditions inyour home
Other
time most likely to install/upgrade to an HAU (n=335; UNICO group)
129; 19%
142; 21%
243; 38%
120; 18%28; 4%
buying new home
remodeling
replacing system
responding to acutemedical condition(s) inhome
other
time most likely to install/upgrade to an HAU (n=407; all groups)
129; 19%
142; 21%
243; 38%
120; 18%28; 4%
buying new home
remodeling
replacing system
responding to acutemedical condition(s)in home
other
I-9

I-10
Information Tool Distributed to Allergist’s Office and Home Tour Respondents
Homeowner Information Tool for “Healthy Air” HVAC Feedback Your responses to the following questions will assist the California Energy Commission learn more about what is important to you as a California homeowner/ resident about your home’s heating and cooling systems and indoor air quality (IAQ). The results will be compiled and individual responses will remain anonymous. Thanks for your time in contributing to this study. Which characteristics in your opinion would best describe healthy indoor air? Check all that apply. Comfortable (temperature and humidity) Fresh (not stale – plenty of oxygen) Odor free (no objectionable smells) Pollutant free (pollen, mold, smoke, chemicals) Other______________________ Do you currently suffer from respiratory or other health conditions? Yes / No Are these conditions affected by the air in your home? Yes / No Do you currently use filters and/ or other devices to treat your indoor air? Yes / No If yes, describe the filters and/or devices you are using. __________________ Do these filters and/or devices treat rooms and/or an entire house? Room / Entire house Would you be interested in a whole house heating and cooling system that provided “healthy air” with the characteristics you described in item 1 above (comfortable, fresh, odor free, pollutant free, other)? Yes / No If such a whole house system were available, how much more would you be willing to pay for the “healthy air” system improvements? $500 - $1,000 $1,000 - $2,000 $2,000 - $4,000 What other incentives might encourage you to purchase a “healthy air” whole house heating and cooling system? Income tax deduction as medical expense Partial coverage under medical insurance 5-year product warranty Other ______________________ When would you most likely install/upgrade to a “healthy air” whole house heating and cooling system? Buying a newly constructed home Remodeling your existing home Replacing your worn-out heating and cooling system Responding to acute medical conditions in your household Other _______________________

I-11
Information Tool Distributed to Unico Respondents
Your responses to the following questions will assist the California Energy Commission in learning more about what is important to you as a California homeowner/resident in regards to your home's heating and cooling systems and indoor air quality (IAQ). The results will be compiled, and individual responses will remain anonymous. Thanks for your time in contributing to this study.
1. Which characteristics in your opinion would best describe healthy indoor air? Check all that apply.
Comfortable (temperature and humidity)
Fresh (not stale - plenty of oxygen)
Odor free (no objectionable smells)
Pollutant free (pollen, mold, smoke, chemicals)
Other 2. Do you currently suffer from respiratory or other health conditions?
YES NO Are these conditions affected by the air in your home?
YES NO 3. Do you currently use filters and/or other devices to treat your indoor air?
YES NO If yes, describe the filters and/or devices you are using.
Do these filters and/or devices treat rooms and/or an entire house?
Room Entire 4. Would you be interested in a whole house heating and cooling system that provided "healthy air" with the characteristics you described in item 1 above (comfortable, fresh, odor free, pollutant free, other)?
YES NO 5. If such a whole house system was available, how much more would you be willing to pay for the "healthy air" system improvements?
$500 - $1,000

1-12
$1,000 - $2,000
$2,000 - $4,000 6. What other incentives might encourage you to purchase a "healthy air" whole house heating and cooling system?
Income tax deduction as medical expense
Partial coverage under medical expense
5-year product warranty
Pollutant free (pollen, mold, smoke, chemicals)
Other 7. When would you most likely install/upgrade to a "healthy air" whole house heating and cooling system?
Buying a newly constructed home
Remodeling your existing home
Replacing your worn-out heating and cooling system
Responding to acute medical conditions in your household
Other

Appendix B. “Snapshot” Of The HVAC and Air Cleaner Markets


APPENDIX II. “SNAPSHOT” OF THE HVAC AND AIR CLEANER MARKETS
The term HVAC refers to the equipment, distribution system, and controls that provide heating, ventilation, and air conditioning for buildings. HVAC systems are the primary energy consumers in buildings. In addition to the energy costs, HVAC systems affect the health, comfort, and productivity of building occupants. Improving HVAC performance saves energy and promotes a healthier, more comfortable environment. Since 2001, the California Energy Commission (CEC) has increasingly emphasized energy demand reductions. Changes made since that time reduced electricity demand nearly 150 megawatts (MW) each year. “The 2005 standards are expected to reduce electric demand by another 180 MW each year. Like energy savings, demand savings accumulate each year.” (ACHRN 2005) 1. CALIFORNIA’S HVAC MARKET AND TITLE 24 California's Title 24 revisions went into effect October 1, 2005, and promise to affect the home-building industry. The revisions mandate that homeowners, contractors, and designers look at buildings as total efficiency packages, instead of focusing solely on the efficiency of the equipment that goes in them. Within the standard, there are specific requirements for residential new construction and replacement/renovation work. There are credits and trade-outs, and mandates that vary according to CEC climate zone (20 in all; see Appendix II). Builders get energy credits for installing high-efficiency airdistribution systems—fans, motors, and ductwork. Some of Title 24's mandates are in line with current HVAC market offerings, such as the standard's prohibition against installing fan-powered furnaces with continuously burning pilot lights, and the required use of thermostatic expansion valves (TXVs) on all air conditioners and heat pumps. In the case of air conditioner efficiencies, Title 24 is also in compliance with next year's federally mandated efficiency minimums, requiring a minimum of 13 SEER (seasonal energy-efficiency ratio). (California wholesalers should have a large stock of 13-SEER equipment to handle demand.) Mandatory duct repair, high-efficiency air distribution systems, and audits by certified energy raters go beyond requirements in most other states. (ACHRN 2005)] 2. HVAC MARKET OVERVIEW Demand for HVAC equipment in the United States is projected to grow steadily in the next four years, according to a new study from The Freedonia Group, a Cleveland-based industrial market research firm. The size of the U.S. HVAC market is expected to reach $12 billion in 2007, with annual growth rates of 2.4%. This growth is projected to be fueled by the expected rebound in nonresidential construction as well as ongoing residential remodeling. The nonresidential market is expected to be a large factor in the growth, accounting for 60% of sales in value terms. Further gains will be restrained by projected declines in the number of new single-unit housing completions between 2002 and 2007. Competition from imported equipment and maturing markets for many types of HVAC equipment will also restrain demand. Today, there is tremendous interest in the green-buildings market. HVAC manufacturers want to know how to position their products to take advantage of this trend. “Engineers and architects want solid information on the performance of green buildings (i.e., economic costs and benefits), and they want to know how they can get owners over any first-cost hurdles.” (HPAC Engineering 2005). 2.1 U.S. HVAC Shipments The HVAC unitary market is affected more by replacements of existing units than by the installation of new ones. The Air-Conditioning and Refrigeration Institute (ARI) reports that more than 87 percent of new U.S. homes are built with central air. “Although the industry benefits from a strong new housing market, it is affected more by the installed base of more than 70 million units,” ARI stated (ACHRN 2004).

II-2
According to ARI's figures, factory shipments for residential and light commercial units soared 14 percent above June 2003, which set the previous record of 946,416 units. This year’s numbers included 236,433 heat pumps, “a new single-month record in that category and a 24-percent increase over last June.” (ACHRN 2004).
The year-to-date 1,028,000 is up 18 percent from the January–June period in 2003. Driven in part by the relatively low initial costs of these systems, warm air furnace shipments represent half of all heating equipment shipments. Within the warm air furnace segment, electric versions are projected to post the strongest average annual growth. Among the major heating equipment segments, heat pumps accounted for the second largest share of shipments. Growth will be driven by how well heat pumps can provide efficient heating and cooling in moderate climates and serve as a low-cost supplementary heating system in colder climates.
Shipments of unitary air conditioners represent about three-quarters of all cooling equipment shipments. Packaged terminal air conditioners and chillers are projected to post above-average annual gains, benefiting from their use in industrial and commercial markets, two areas expected to rebound over the forecast period (ASHRAE 2004).
ARI reported that combined U.S. factory shipments of central air conditioners and air-source heat pumps were down 1% to 405,251 compared to shipments from the same month last year (ARI 2005).
In the National Association of Wholesalers–Distributors (NAW)’s “Forecast 2004”, a comparison chart highlights the anticipated revenue and employment growth among 18 different industries. Of these, plumbing and HVAC distributors, at 4.7% and 0.9%, respectively, rank at the bottom in terms of expected growth in 2004.
Within the HVAC industry, growth is forecast to be highest in the east south-central region of the U.S. and slowest in the Pacific states. According to the report, distributors who sell primarily in the residential market will likely suffer from declining new-home starts and a drop in remodeling spending. On the other hand, the outlook for commercial and industrial construction is positive (NAW 2004).
2.2 HVAC Systems in the Remodeling Market In the residential HVAC equipment market, there are two major sectors: new construction and residential retrofit. Currently, 66 percent of the activity is in the retrofit area, which includes energy upgrades, replacements, add-ons, and remodeled units. According to Harvard University’s Joint Center for Housing Studies, homeowner spending on systems/equipment totaled $15.4 billion in 2003. This includes electrical, plumbing, and HVAC (JCHS 2005). The product decision of residential customers investing in major HVAC retrofit is most heavily influenced by their home improvement contractor, unlike residential customers purchasing low- to mid-cost energy-efficiency products such as lighting and home appliances, which gain much of their energy- efficient product information from utility marketing campaigns, widespread retail advertising, and in-store point-of-purchase marketing material. The home improvement contractor is the most influential entity in specifying the type and efficiency of equipment installed when customers replace or upgrade their central heating and cooling equipment.
According to testimony before the California Public Utilities Commission, “a well trained, motivated and educated statewide network of home improvement contractors is critical to assure that the massive, untapped potential that exists within the energy efficient HVAC retrofit market is captured.” (CPUC 2005).
2.3 U.S. HVAC Equipment Sales Table 1 illustrates U.S. HVAC equipment industry sales by product category/product type in dollars and presents a percent change forecast for 2004 and 2005. Table 2 lists the top HVAC contractors in the western United States for 2002.

II-3
Table 1. U.S. HVAC equipment industry sales (by product category/product type in dollars and percent change
forecast for 2004 and 2005; Source: Industry Outlook 2005)
Forecast: HVAC Product 2005* 2004** % chg. 2005 vs.
2004 A/C Unitary: total 5,500,000 5,480,000 0.4% Heat pumps: total 1,900,000 1,870,000 1.6% Furnaces (central): total
3,547,954 3,677,467 -3.5%
Gas 3,424,293 3,543,122 -3.4% Oil 123,661 134,345 -8.0% Water heaters: total 9,677,030 9,641,586 Residential: total 9,531,538 9,489,015 0.4% Gas 4,962,325 4,970,537 -0.2% Electric 4,569,213 4,518,478 1.1% Commercial: total 145,492 152,571 -4.6% Gas 93,276 94,807 -1.6% Electric 52,216 57,764 -9.6% Grand total: 20,624,984 0,669,053 -0.2% Product 2003 % chg. 2004
vs. 2003
Water heaters: total 9,692,574 -0.5% Residential: total 9,554,45 -0.7% Gas 5,124,265 -3.0% Electric 4,429,880 2.0% Commercial: total 138,429 10.2% Gas 90,292 5.0% Electric 48,137 20.0% Grand Total 19,892,127 3.9%
*Projection ** Estimate Source: Air-Conditioning and Refrigeration Institute (ARI)
and Gas Appliance Manufacturers Association (GAMA).

II-4
Table 2. Top HVAC Contractors in the West (by revenues in dollars, for
2002) (TableBase 2002)
Rank Company/Location $ in millions
6 Kinetic Systems Inc., Santa Clara, CA 591.7
18 Air Conditioning Co., Glendale, CA 300.7
19 Southland Industries, Irvine, CA 265
22 Scott Co. of California, San Leandro, CA 200
24 Harder Mechanical Contractors Inc., Portland, OR
175.5
25 JH Kelly LLC, Longview, WA 170
30 Chas Roberts Air Conditioning Inc., Phoenix, AZ
132
31 Beutler Heating & Air Conditioning Inc., McClellan Park, CA
129.6
36 McKinstry Co., Seattle, WA 113.8
47 A.O. Reed & Co., San Diego, CA 81.12
3. RESIDENTIAL MARKET
The housing market has been booming, but many in the industry believe that it has “topped out.” With housing activity “flattening in 2005,” says David Seiders, chief economist for the National Association of Home Builders (NAHB). Seiders forecast a drop in housing in 2005 of about 4.2 percent to 1.85 million units, down from the 1.935 million projected for this year. Sales of new single-family homes are predicted to drop 5.2 percent from a record of more than 1.16 million this year to about 1.1 million in 2005 (achrnews.com 2004). Players in the residential HVAC market have three key advantages over the rest of the building products market. First, Asian markets are not a threat since HVAC companies require established distribution networks with trained installation professionals. Second, due to the sheer weight of HVAC products, the cost of shipping them overseas is high. Third, HVAC companies are such large, low-cost operations, it is difficult for new competition to gain a foothold. That barrier to entry lowers the risk for buyers (M&A 2004). Table 3 illustrates HVAC system use in the United States from 1999–2001. Table 4 shows expenditures for residential HVAC systems in the Pacific Rim states from 2000–2005; Table 5 shows the same for the entire United States. Figure 1 breaks down the residential market into the single-family market (new construction and improvements). Improvements are then broken down into retrofit or service; retrofit is further broken down into equipment breakdown, home remodeling, and energy management.

II-5
Table 3. HVAC System Use 1999–2001 (Source: U.S. Census Bureau 2002)
Forced Warm-air Furnace Central Air Conditioning 1999 (%) 2001 (%) 1999 (%) 2001 (%)
United States 59 60 52 55 Northeast 40 40 23 25 South 55 57 74 77 Midwest 78 79 54 57 West 63 63 39 41
Table 4. Residential HVAC Expenditures and Forecast
(Millions of Current Dollars) for Pacific rim states (Source: NEMI 2004)
2000 2001 2002 2003 2004 2005
Retrofit $512 664 618 664 634 746
Service 685 650 680 725 785 756
Total 1197 1314 1297 1389 1419 1502
% change 6 10 -1 7 2 6
Table 5. Residential HVAC Expenditures (Millions of current dollars)
(Sources: U.S. Census Bureau/Construction Labor Research Council/FMI Market Research)
1998 1999 2000 2001 2002 2003 2004 2005
Retrofit 5076 4177 5645 7181 6305 6728 6210 7339
Service 5053 5462 5222 5029 4927 5256 5556 5975
Total 10,129 9639 10,867 12,210 11,232 11,984 11,766 13,315
4. REBATES: ENERGY-EFFICIENCY INCENTIVES
The Electric and Gas Industries Association (EGIA) is an advocate of residential energy-efficiency rebate programs. Rebates are highly effective incentives, encouraging residential customers to purchase energy-efficient appliances and other moderately priced high-efficiency products. Appliance retailers and their customers have embraced these programs and value them greatly. However, rebates are only moderately effective in addressing the substantial opportunity that exists to influence homeowner investment in high-efficiency HVAC equipment. In the case of HVAC replacement, for the tens of thousands of customers annually requiring financing, rebates alone are not enough. EGIA stated in its pre-workshop statements regarding the potential for energy efficiency before the Public Utilities Commission of the State of California, “The Commission should augment its existing statewide HVAC rebate programs with a sustained low-interest, energy-efficient home improvement financing program.” The report states also that …the majority of homeowners require financing to fund an HVAC retrofit” (EGIA 2003).
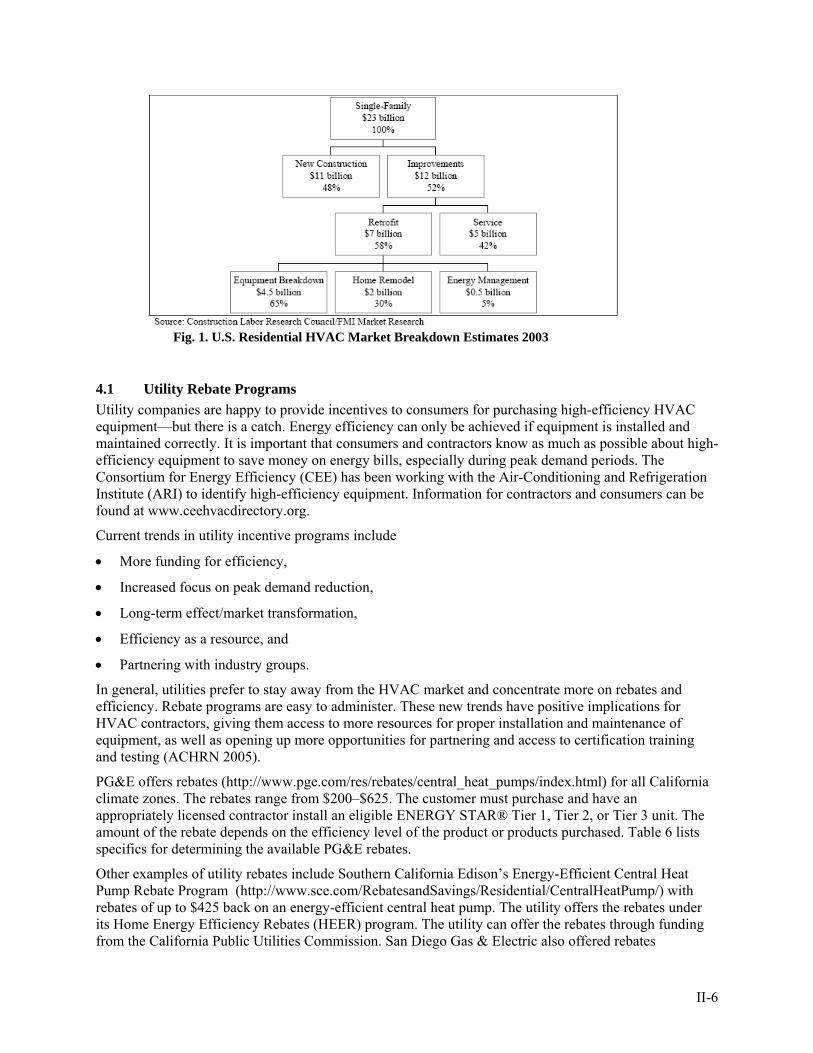
II-6
4.1 Utility Rebate Programs Utility companies are happy to provide incentives to consumers for purchasing high-efficiency HVAC equipment—but there is a catch. Energy efficiency can only be achieved if equipment is installed and maintained correctly. It is important that consumers and contractors know as much as possible about high-efficiency equipment to save money on energy bills, especially during peak demand periods. The Consortium for Energy Efficiency (CEE) has been working with the Air-Conditioning and Refrigeration Institute (ARI) to identify high-efficiency equipment. Information for contractors and consumers can be found at www.ceehvacdirectory.org.
Current trends in utility incentive programs include
• More funding for efficiency,
• Increased focus on peak demand reduction,
• Long-term effect/market transformation,
• Efficiency as a resource, and
• Partnering with industry groups.
In general, utilities prefer to stay away from the HVAC market and concentrate more on rebates and efficiency. Rebate programs are easy to administer. These new trends have positive implications for HVAC contractors, giving them access to more resources for proper installation and maintenance of equipment, as well as opening up more opportunities for partnering and access to certification training and testing (ACHRN 2005).
PG&E offers rebates (http://www.pge.com/res/rebates/central_heat_pumps/index.html) for all California climate zones. The rebates range from $200–$625. The customer must purchase and have an appropriately licensed contractor install an eligible ENERGY STAR® Tier 1, Tier 2, or Tier 3 unit. The amount of the rebate depends on the efficiency level of the product or products purchased. Table 6 lists specifics for determining the available PG&E rebates.
Other examples of utility rebates include Southern California Edison’s Energy-Efficient Central Heat Pump Rebate Program (http://www.sce.com/RebatesandSavings/Residential/CentralHeatPump/) with rebates of up to $425 back on an energy-efficient central heat pump. The utility offers the rebates under its Home Energy Efficiency Rebates (HEER) program. The utility can offer the rebates through funding from the California Public Utilities Commission. San Diego Gas & Electric also offered rebates
Fig. 1. U.S. Residential HVAC Market Breakdown Estimates 2003
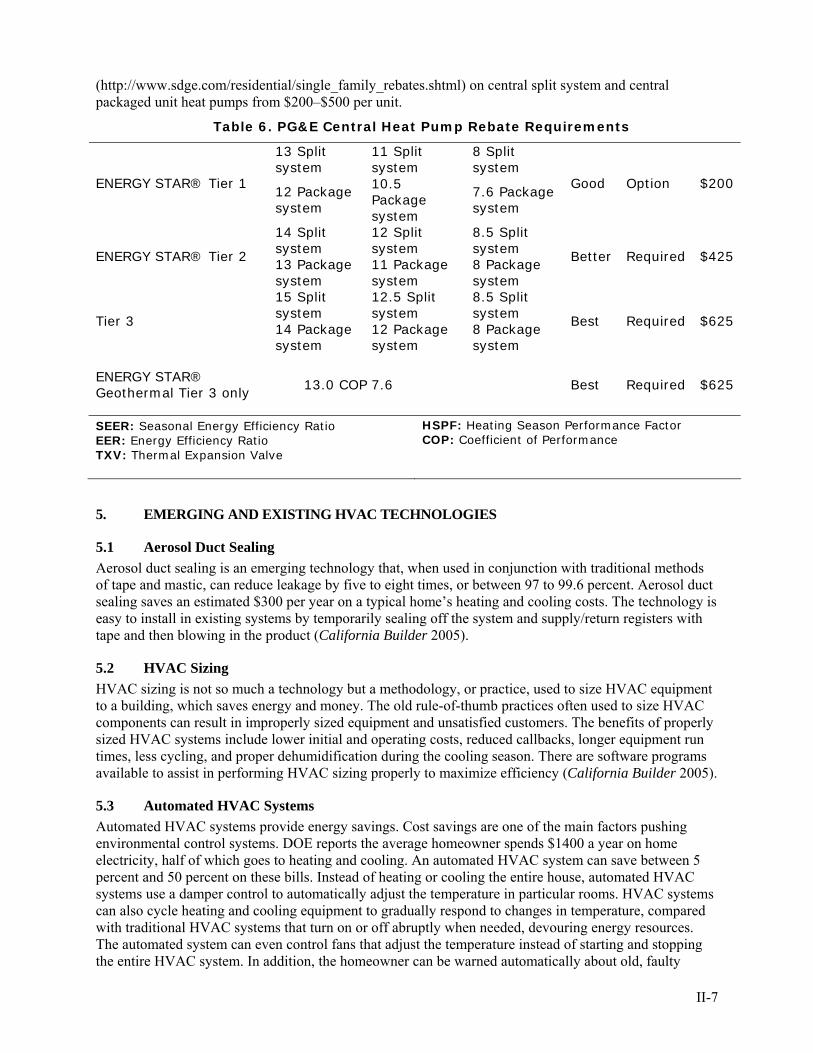
II-7
(http://www.sdge.com/residential/single_family_rebates.shtml) on central split system and central packaged unit heat pumps from $200–$500 per unit.
Table 6. PG&E Central Heat Pump Rebate Requirements
13 Split system
11 Split system
8 Split system
ENERGY STAR® Tier 1 12 Package system
10.5 Package system
7.6 Package system
Good Option $200
14 Split system
12 Split system
8.5 Split system ENERGY STAR® Tier 2
13 Package system
11 Package system
8 Package system
Better Required $425
15 Split system
12.5 Split system
8.5 Split system Tier 3
14 Package system
12 Package system
8 Package system
Best Required $625
ENERGY STAR® Geothermal Tier 3 only
13.0 COP 7.6 Best Required $625
SEER: Seasonal Energy Efficiency Ratio EER: Energy Efficiency Ratio TXV: Thermal Expansion Valve
HSPF: Heating Season Performance Factor COP: Coefficient of Performance
5. EMERGING AND EXISTING HVAC TECHNOLOGIES
5.1 Aerosol Duct Sealing Aerosol duct sealing is an emerging technology that, when used in conjunction with traditional methods of tape and mastic, can reduce leakage by five to eight times, or between 97 to 99.6 percent. Aerosol duct sealing saves an estimated $300 per year on a typical home’s heating and cooling costs. The technology is easy to install in existing systems by temporarily sealing off the system and supply/return registers with tape and then blowing in the product (California Builder 2005).
5.2 HVAC Sizing HVAC sizing is not so much a technology but a methodology, or practice, used to size HVAC equipment to a building, which saves energy and money. The old rule-of-thumb practices often used to size HVAC components can result in improperly sized equipment and unsatisfied customers. The benefits of properly sized HVAC systems include lower initial and operating costs, reduced callbacks, longer equipment run times, less cycling, and proper dehumidification during the cooling season. There are software programs available to assist in performing HVAC sizing properly to maximize efficiency (California Builder 2005).
5.3 Automated HVAC Systems Automated HVAC systems provide energy savings. Cost savings are one of the main factors pushing environmental control systems. DOE reports the average homeowner spends $1400 a year on home electricity, half of which goes to heating and cooling. An automated HVAC system can save between 5 percent and 50 percent on these bills. Instead of heating or cooling the entire house, automated HVAC systems use a damper control to automatically adjust the temperature in particular rooms. HVAC systems can also cycle heating and cooling equipment to gradually respond to changes in temperature, compared with traditional HVAC systems that turn on or off abruptly when needed, devouring energy resources. The automated system can even control fans that adjust the temperature instead of starting and stopping the entire HVAC system. In addition, the homeowner can be warned automatically about old, faulty

II-8
HVAC equipment that needs repair or other problems. Cutting a home's energy use can also result in tax breaks in some states and insurance savings. For example, insurance carrier AIG offers customers savings of up to 18 percent on home insurance through the Connected Hearth Internet Gateway monitoring solution, developed by Amagansett, NY-based Connected Hearth.
California legislation requiring “zero energy homes” is driving the interest in automated HVAC systems even further.” Zero energy homes, “must cut the amount of energy they purchase by 70 percent. Automated HVAC systems and other means are being considered to attain this goal” (Computer Reseller News 2004).
6. RESIDENTIAL AIR CLEANING DEVICES
Air cleaning devices are manufactured by many companies in the United States and they vary widely in design, methods of operation, cost and level of efficiency. Air cleaners can either be incorporated into the central HVAC system or moved from room to room as portable units such as small tabletop units or larger portable room consoles.
6.1 Central Filtration Systems
Air cleaning systems can also be installed in the central heating or air-conditioning systems of a residence or in an HVAC system. These units are commonly referred to as "in-duct" units, although this term is actually a misnomer since they are not located in the distribution ductwork, but rather in unducted return air grilles or ducted return air plenums. The term "central filtration system" will be used in this document. This type of unit provides building-wide air cleaning and, by continuously recirculating building air through the unit, can potentially clean the air throughout the entire air handling system, ductwork and rooms. However, with these types of units, the HVAC fan must be in constant operation for air cleaning to occur since the airborne contaminants must be captured and carried back to the centralized filter for capture and retention. Thus, central filtration systems must be operated with the fan "on" for constant air movement through the HVAC system. Generally, residential HVAC systems operate only on intermittent fan to maintain a comfortable indoor temperature.
6.2.1 Whole-house HEPA systems A true HEPA filtering system must allow no more than 3 particles out of 10,000 to penetrate the filter, which can be found on standard central (whole house) filtration systems and on portable units. HEPA air purifier filters consist of tiny glass fibers that produce a consistency similar to blotter paper. This means that a HEPA purifier is like a tremendous high-pressure system, with air is forced through the filtration system under great pressure. This makes HEPA filters an expensive proposition in a residence. With powerful fans and engine horsepower, HEPA in a home can be an enormous and consistent drain on electricity. (Purity Planet 2005, http://www.purityplanet.com/)
HEPA effectiveness is best measured by air displacement effectiveness. Air displacement describes the amount air moved, measured in cubic feet per minute (cfm). Purifiers with high air-displacement HEPA filters are best for recovery of smaller particles such as bacteria, pharmaceutical dust, lead paint or asbestos fibers. A small room purifier may offer as little as 80 cfm, while a whole house system may offer 500 to 80,000 cfm (Purity Planet 2005).
6.2.2 Photocatalysts for volatile organic compounds (VOCs) Photocatalysts for the destruction of indoor air pollutants, including VOCs and gaseous inorganic pollutants such as nitrous oxides, carbon monoxide, and hydrogen cyanide, are currently in development (Heller 1996). Photocatalytic air cleaners are composed of a photocatalyst, an ultraviolet (UV) light source that illuminates the catalyst surface, and a fan that passes air over the catalyst surface. The photocatalyst absorbs photons of UV light to drive oxidation and reduction reactions on the catalyst surface. These reactions reportedly convert organic pollutants to carbon dioxide and water. Reports of initial tests show the technology capable of rapidly destroying toxic components of tobacco smoke such as formaldehyde, acrolein, and benzene.

II-9
6.2.3 Catalytic chemical air filters Another mechanism for chemical filtration involves the catalytic conversion of one volatile compound into another, less hazardous, compound. For example, harmful ozone can be catalytically converted on a carbon surface into oxygen (Weschler et al. 1994). This mechanism occurs on the surface of adsorbent media to which specific catalysts have been added. Catalytic chemical air filters are advantageous in that active adsorption surface sites are recycled through catalysis rather than consumed by captured pollutants. Catalytic panels are being developed that effectively remove nitrogen dioxide, ozone, and carbon monoxide from ambient air at room temperature; however, they are not yet available for residential application. Possibly, their use could be extended to aldehydes and ketones as well, because these compounds contain the carbonyl group present in carbon monoxide. These catalytic chemical air filters may prove useful in cleaning intake air in areas where ambient air quality standards are not met.
6.2.4 UV light technology Using UV light waves to clean air is rapidly gaining popularity as a safe and highly effective alternative to other home air purifiers. UV light purifiers are especially effective when used in combination with central air conditioning systems in the home. UV purifiers attach to your central air and heating system and use small mercury vapor lamps to generate UV waves that actually kill mold, bacteria, fungus, yeast, and other airborne pollutants. These and other substances can accumulate on any heating and cooling component, reducing airflow. Microbial growth on fin surfaces increases the pressure drop across the coil, increasing fan horsepower requirements and electrical power consumption. A thin 0.002-inch layer can reduce airflow by as much as 9 percent (SDREO 2006). UV lights help minimize accumulation, allowing the HVAC system to operate at its peak efficiency levels and killing potential contaminants at their source before they reach the air. The lights are mounted inside your system, focused on the moist cooling coil. They help keep the system free of airborne contaminants, destroying them before they can circulate, cleaning air in the home, including ducts and vents. UV systems emit no odors or ozone. UV purifiers can cost from $300–$500 and can usually be installed by the homeowner. The higher up-front cost of these units, however, is offset by the lack of costly filters to replace, and consumers who pay to have their air ducts cleaned will have no need to do so after installing a UV light system (Purity Planet 2005).
6.2.5 Electronic Air Cleaners Many of the airborne particles that easily pass through typical furnace filters can be trapped and removed by electronic air filtration systems, helping to improve indoor air quality. Such systems can capture particles as small as 0.01 microns and help minimize the damage that airborne pollutants can cause. The collection plates can simply be rinsed off when dirty.
Electronic air cleaners use an electrical field to trap particles. Much like mechanical filters, electronic air cleaners can be installed as central filtration systems or purchased as a portable unit with a fan. Electrostatic precipitators, the most common type of electronic air cleaners, use two stages to draw air in with an electrode or wire and collect the particulate on plates. The simplest form of the electronic air cleaner is the negative ion generator, which creates static charges to remove airborne particles. All the particulates in a room become attracted to surfaces, depositing themselves on walls, floors, tabletops, curtains, and even occupants. Using this kind of air-filtering system requires consistent vacuuming and cleaning to remove settled material. More advanced units are theoretically designed to reduce particulate settling in a room. These filtration systems create negative ions within a space that air flows, and then suck back the charge particles into the cleaner by a fan.
Electronic air cleaners can produce ozone as either a byproduct or intentionally, as is the case with ozone generators. This has been a concern lately for experts concerned about air quality, since ozone can be a potent lung irritant and exposure to elevated levels can be dangerous for people with asthma and other chronic lung diseases. The benefits of electronic air cleaners are that, unlike HEPA filters, their energy costs are generally low. The constant airflow through the unit helps lengthen the time between replacement filters. However, these units can become less efficient with use and require frequent cleaning.

II-10
6.3 TABLETOP UNITS
Until recently, small, inexpensive, tabletop appliance-type units have typically been quite popular in terms of unit sales (CADM, spoken communication). They generally contain small panels of dry, loosely packed, low-density fiber filters upstream of a high-velocity fan. Tabletop units may also consist of a fan and an electronic or other type of filter. Small tabletop units generally have limited airflow and inefficient panel filters. Most reviews have shown these table top units to be relatively ineffective (Consumer Reports 1992 and Fox 1994). The combination of low filter efficiency and low airflow in these units causes them to provide essentially no cleaning when assessed for impact on the air of the entire room (Nelson et al. 1988).
Performance tests of 12 tabletop units were reported by Rodale's New Shelter magazine (1982). Tests were conducted in a 1200-ft3 room in which cigarette smoke was mechanically generated. Nine of 12 units reduced smoke levels by less than 24%, compared to a 17% decline that occurred by settling in the absence of the air cleaners. The researchers concluded that effectiveness of tabletop units in removing smoke particles was marginal at best and differed little from using no device at all. Similar results were reported by Offerman et al. (1985).
Consumer Reports magazine (1992) also tested nine tabletop units and found that, because they can move only small amounts of air, they suffice only for a very small room or a portion of a room. Two of the tabletop units tested were ozone generators. Both of these units were judged "not acceptable" because they produced harmful levels of ozone and did not have automatic controls to limit ozone output.
6.4 ROOM UNITS
Another major type of residential air cleaner is the larger, yet portable, devices designed to clean the air in a specific size room. Due to their larger and more effective filters or collecting plates, these larger portable room air cleaners are considerably more effective in cleaning the air in a room than the tabletop units (Consumer Reports 1992, Fox 1994) and have become increasingly popular in the past several years, exceeding the tabletop units in consumer sales (CADM, spoken communication). Room-size air cleaners are generally utilized when continuous, localized air cleaning is necessary (Consumer Reports 1992 and Fox 1994). Most units may be moved from room to room to reduce pollutant concentration levels as needed. Similar to the tabletop units, room units also incorporate a variety of air cleaning technologies. Table 7 presents retail prices and capacity for several different room units.
Table 7. Air Cleaners— Comparison of Retail Price and Capacity
Brand Model # Price ($) Coverage per ft2 HEPA Source
Lowe's
Hunter 30735 198.00 196 Yes Website (www.lowes.com)
Hunter Quietflo 216 30216 138.00 330 Yes website Hunter Quietflo 90 30090 68.98 155 Yes website
Home Depot
Enviracaire 60001 199.00 225 Yes Website (www.homedepot.com)
Honeywell 50250 169.00 374 Yes website Enviracaire 60000 149.00 150 No website Honeywell 17005 119.00 196 Yes Local store Honeywell 50100 89.98 154 Yes Local store
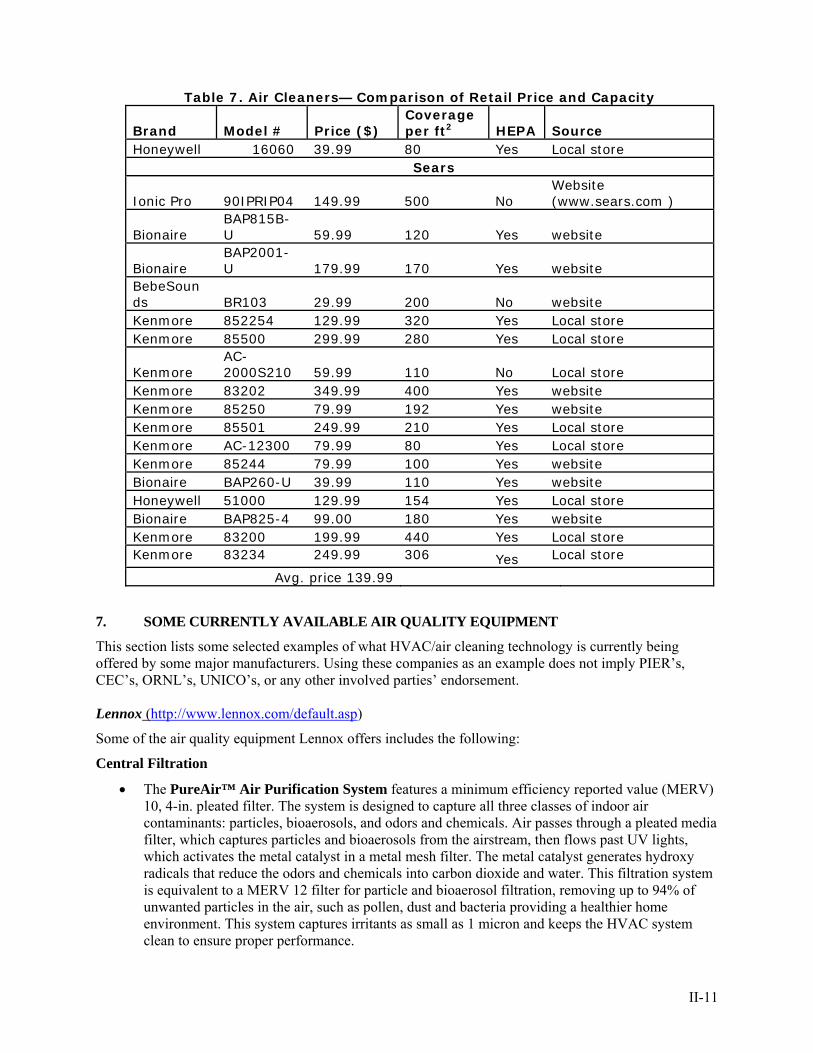
II-11
Table 7. Air Cleaners— Comparison of Retail Price and Capacity
Brand Model # Price ($) Coverage per ft2 HEPA Source
Honeywell 16060 39.99 80 Yes Local store Sears
Ionic Pro 90IPRIP04 149.99 500 No Website (www.sears.com )
Bionaire BAP815B-U 59.99 120 Yes website
Bionaire BAP2001-U 179.99 170 Yes website
BebeSounds BR103 29.99 200 No website Kenmore 852254 129.99 320 Yes Local store Kenmore 85500 299.99 280 Yes Local store
Kenmore AC-2000S210 59.99 110 No Local store
Kenmore 83202 349.99 400 Yes website Kenmore 85250 79.99 192 Yes website Kenmore 85501 249.99 210 Yes Local store Kenmore AC-12300 79.99 80 Yes Local store Kenmore 85244 79.99 100 Yes website Bionaire BAP260-U 39.99 110 Yes website Honeywell 51000 129.99 154 Yes Local store Bionaire BAP825-4 99.00 180 Yes website Kenmore 83200 199.99 440 Yes Local store Kenmore 83234 249.99 306 Yes Local store
Avg. price 139.99 7. SOME CURRENTLY AVAILABLE AIR QUALITY EQUIPMENT
This section lists some selected examples of what HVAC/air cleaning technology is currently being offered by some major manufacturers. Using these companies as an example does not imply PIER’s, CEC’s, ORNL’s, UNICO’s, or any other involved parties’ endorsement. Lennox (http://www.lennox.com/default.asp)
Some of the air quality equipment Lennox offers includes the following:
Central Filtration
• The PureAir™ Air Purification System features a minimum efficiency reported value (MERV) 10, 4-in. pleated filter. The system is designed to capture all three classes of indoor air contaminants: particles, bioaerosols, and odors and chemicals. Air passes through a pleated media filter, which captures particles and bioaerosols from the airstream, then flows past UV lights, which activates the metal catalyst in a metal mesh filter. The metal catalyst generates hydroxy radicals that reduce the odors and chemicals into carbon dioxide and water. This filtration system is equivalent to a MERV 12 filter for particle and bioaerosol filtration, removing up to 94% of unwanted particles in the air, such as pollen, dust and bacteria providing a healthier home environment. This system captures irritants as small as 1 micron and keeps the HVAC system clean to ensure proper performance.
II-12
• The Healthy Climate® Electronic Air Cleaner features filtration equivalent to a MERV 12 filter for particle and bioaerosol filtration for effective particle-removing performance. It removes up to 94% of unwanted particles in the air, such as pollen, dust, and bacteria, capturing irritants as small as 1 micron and keeps the HVAC system clean to ensure proper performance.
• The High-Efficiency Particulate Air (HEPA) Filtration System features a true HEPA System, meaning the entire system has been tested to meet industry standards for particle/bioaerosol filtration. It is up to 99.97% efficient in removing particles and bioaerosols down to 0.3 micron. It has a sealed bypass design to contain particles and prevent them from escaping. A carbon canister is optional for trapping and removing odors.
Filter Products
• The Healthy Climate ™ Indoor Air Quality High-Efficiency Particulate Air (HEPA) System (HEPA-20, -40, -60) – 99.97% efficiency rating for removing small, breathable particles at 0.3 micron. Combats particles, bioaerosols and odors/chemical vapors (optional carbon canister removes odors and chemical vapors MERV 16+)
• Lennox also offers the Healthy Climate ™ High-Efficiency Media Air Cleaner and the Healthy Climate™ Box Media Air Cleaner; the High-Efficiency Media Filter and the Healthy Climate™ Air filter.
UV Lights
• Healthy Climate™ Germicidal Light – sterilizes surfaces, reduces concentrations of airborne bioaerosols by 50% within as little as 45 minutes. The light intensity is up to 7 times more powerful than competitor’s units. Available in 2,000microWatts, 1050, and 776.
Carrier (http://www.residential.carrier.com/) Air Filtration Systems
• Infinity Air Purifier (GAPA): Captures and kills harmful bacteria, viruses, mold and allergens. Our best solution for enhanced indoor air quality.
• Better: Performance Electronic Air Cleaner (EACB): removes particles as small as 0.01 micron • Performance Filter Cabinet and Air Filter(FILCAB, FILCC): removes particles down to 0.3
microns • Performance EZ Flex Cabinet Air Filter (EZXCAB): Most efficient and effective air filter • UV Lamps (UVLCC2LP, UVLCC1LP): kills bacteria and mold growing on the indoor coil
Trane
• Trane CleanEffects™ - removes 99.98% of airborne allergens down to 0.3 microns. (list price: $1195)
• Perfect Fit Whole-House Electronic Air Cleaner (list price: $550 –replacement filters $129.99) American Standard
• AccuClean™ Whole-House Air Filtration System – removes 99.98% or allergens from filtered air, down to 0.3 microns in size (dust, pollen, pet dander, dust mite, mildew, mold, lint, fungus, most tobacco smoke, cooking grease, bacteria)
• Perfect Fit Air ™Cleaner – electronic model is 99% efficient at removing airborne particle.

Appendix C. California Climate Zones, Air Pollution, and Related Health Issues


III-1
APPENDIX III: CALIFORNIA’S CLIMATE ZONES, AIR POLLUTION, AND RELATED HEALTH ISSUES
The U.S. Department of Energy Building America Program has assigned climate zones based on the county in which the site is located. California’s Building America climate zones are divided into four categories comprising 58 counties within the state. These categories are cold, hot-dry, mixed-dry, and marine.
The California Energy Commission established more specific climate zones, 16 in all, that represent a geographic area for which an energy budget is established. The CEC website describes an energy budget as “the maximum amount of energy that a building, or portion of a building…can be designed to consume per year.” (www.energy.ca.gov/maps/climate_zone_map.html)
BUILDING AMERICA CLIMATE ZONES
California’s Building America climate zones are divided into four categories comprising 58 counties within the state. These categories are cold, hot-dry, mixed-dry, and marine.
• A cold climate is generally defined as a region with approximately 5,400 heating-degree days (65°F basis) or more and fewer than approximately 9,000 heating degree days (65°F basis).
• A hot-dry climate is generally defined as a region that receives less than 20 in. (50 cm) of annual precipitation and where the monthly average outdoor temperature remains above 45°F (7°C) throughout the year.
• A mixed-dry climate is generally defined as a region that receives less than 20 in. (50 cm) of annual precipitation, has approximately 5,400 heating degree days (50°F basis) or less, and where the average monthly outdoor temperature drops below 45°F (7°C) during the winter months.
• A marine climate is generally defined as a region that meets all of the following criteria:
⎯ A mean temperature of coldest month between 27°F (-3°C) and 65°F (18°C) ⎯ A warmest month mean of less than 72°F (22°C) ⎯ At least 4 months with mean temperatures more than 50°F (10°C) ⎯ A dry season in summer. The month with the heaviest precipitation in the cold season
has at least three times as much precipitation as the month with the least precipitation in the rest of the year. The cold season is October through March in the Northern Hemisphere and April through September in the Southern Hemisphere Relationships between Defined Climate Zones
Fig. 1. California’s Building America climate zones

III-2
Table 1. CEC Climate Zones/Building America City/Climate Zone
Correlation
CEC City Building America Climate Zone
CZ 1: Arcata Humboldt Marine
CZ 2: Santa Rosa
Sonoma Marine
CZ 3: Oakland
Alameda Marine
CZ 4: Sunnyvale
Santa Clara Marine
CZ 5: Santa Maria
Santa Barbara Marine
CZ 6: Los Angeles Los Angeles Hot-Dry
CZ 7: San Diego San Diego Hot-Dry
CZ 8: El Toro
Orange Hot-Dry
CZ 9: Pasadena
Los Angeles Hot-Dry
CZ10: Riverside
Riverside Hot-Dry
CZ11: Red Bluff Tehama Hot-Dry
CZ12: Sacramento
Sacramento Hot-Dry
CZ13: Fresno Fresno Hot-Dry
CZ14: China Lake
Kern Hot-Dry
CZ15: El Centro
Imperial Hot-Dry
CZ16: Mount Shasta Siskiyou Cold Climate
CEC CLIMATE ZONES
Table 1 above defines the California Energy Commission (CEC) climate zones (CZ1–CZ16). The California climate zones shown in this map are not the same as what might be more commonly referred to as a “desert” or “alpine” climate. These zones are based on energy use, temperature, weather, and other factors and essentially designate a geographic area that has similar climatic characteristics. The Title 24 energy efficiency standards explain it as follows: "The Energy Commission established 16 climate zones that represent a geographic area for which an energy budget is established. These energy budgets are the basis for the standards.... (An) energy budget

III-3
is the maximum amount of energy that a building, or portion of a building...can be designed to consume per year.”
“The Energy Commission originally developed weather data for each climate zone by using unmodified (but error-screened) data for a representative city and weather year (representative months from various years). The Energy Commission analyzed weather data from weather stations selected for (1) reliability of data, (2) currency of data, (3) proximity to population centers, and (4) non-duplication of stations within a climate zone.
"Using this information, they created representative temperature data for each zone. The remainder of the weather data for each zone is still that of the representative city.”
CEC does not identify a mixed-dry climate zone. Following is a list of counties with cities comprising the Mixed-Dry climate zone.
• Amador County: Amador, Ione, Jackson, Plymouth, Sutter Creek
• Calaveras County: Angels Camp • El Dorado: Placerville, South Lake Tahoe • Inyo County: Bishop • Lake County: Clearlake, Lakeport • Mariposa County: undefined • Trinity County: undefined • Tuolumne County: Sonora
CALIFORNIA AIR POLLUTANTS
Indoor Air Pollution Indoor air pollution can cause a variety of impacts on human health, from irritant effects to respiratory disease, cancer, and premature death. Indoor air pollutants can be elevated to levels that may result in adverse health effects. The major indoor pollutants that can substantially affect Californians’ health are listed below, along with their sources and associated health impacts. The health impacts of greatest significance include asthma, cancer, premature death, respiratory disease and symptoms, and irritant effects.
Sources of major indoor air pollutants:
• Asbestos • Biological agents: bacteria, fungi, viruses, house dust mites, animal dander, cockroaches,
microbial VOCs • Carbon monoxide • Endocrine disruptors: phthalates, DDT, chlordane, heptachlor, o-phenylphenol, PBDEs • Environmental tobacco smoke (ETS) • Formaldehyde, other aldehydes • Lead • Nitrogen dioxide • Organic chemicals • Ozone
Fig. 2. CEC climate zones
III-4
• Particulate matter • Polycyclic aromatic hydrocarbons (PAH) • Radon
Criteria Air Pollutants Several common air pollutants are regulated under the state and federal Clean Air Acts and are known as “criteria” air pollutants. Two of the most widespread criteria pollutants are particulate matter (PM) and ozone. PM consists of microscopic particles less than one-seventh the width of a human hair. These particles come from a variety of both manmade and natural sources, such as diesel engines, smoke from fireplaces as well as forest and agricultural fires, and dust from tilled farmland. PM can bypass the body’s natural defenses and penetrate deep into the lungs. The elderly, children, and people with existing respiratory or cardiac diseases are considered to be especially sensitive to the harmful effects of PM. Recent studies suggest that PM may exacerbate asthma and cause coughs and other respiratory symptoms in children; also that prolonged exposure to PM may also affect the growth and functioning of children’s lungs. (ARB 2004). Researchers found that as children grow up in smoggier areas, there is a notable lag in lung function growth (ALA 2004).
Ozone is the major component of urban smog. It is formed by chemical reactions in the atmosphere involving sunlight and various gases in motor vehicle exhaust and industrial emissions. Ozone is a powerful respiratory irritant that can cause lung inflammation, transient decreases in lung function, shortness of breath, chest pain, wheezing, coughing, and exacerbation of respiratory illnesses such as asthma. Long-term and repeated ozone exposures may lead to chronically reduced lung function.
California Environmental Protection Agency’s Office of Environmental Health Hazard Assessment (OEHHA) provides detailed analyses of health information on PM, ozone, and other common pollutants to the California Air Resources Board (ARB), which sets ambient air quality standards for those pollutants. These air quality standards have been established at levels intended to protect the health of all Californians. Unfortunately, PM and ozone levels in most urban areas of California frequently exceed the ambient air quality standards. ARB and local air districts operate regulatory programs under state and federal requirements to reduce airborne levels of these pollutants to the ambient air quality standards.
Other “criteria pollutants” include nitrogen dioxide, carbon monoxide, lead, sulfur dioxide, sulfates and hydrogen sulfide. More than 200 chemicals are currently listed as toxic air contaminants in California.
Current Methods of Treating Pollutants The ARB-identified pollutants we focus on in this task can be effectively treated with one or more of the following currently available methods. The HAU could also effectively control these focus pollutants. • Air filtration/particulates – high-efficiency particulate air (HEPA) or electrostatic air filters
can effectively remove particles (including fine dust, smoke, mold, and pollen) down to 0.3 microns in size.
• Air sterilization – Germicidal UV light is effective in sterilizing germs, viruses, bacteria, and fungi (like mold) in the air stream.
• Air filtration/gases – Activated carbon filters trap odors and chemicals. Some of the ARB-listed indoor pollutants that are effectively filtered include formaldehyde, ozone, nitrogen dioxide, organic chemicals, and other gases found in the home.

III-5
• Pollutant exhaust and fresh (outside) make-up air– This method works effectively as long as the quality of the outside air is acceptable (e.g., no ozone, low pollen, and particulates). It is effective at controlling most airborne pollutants. However, during seasons when heating or cooling is required, this method can result in excessive utility costs and added wear on the home’s HVAC systems if run continuously.
• Humidity control – This method can effectively reduce the potential for mold development and dust mite infestation. It has little impact on other forms of indoor pollution.
CALIFORNIA AIR QUALITY
State of the Air: 2004 Of California's 58 counties, 34 failed 1 or more of 3 clean air tests graded in the American Lung Association State of the Air: 2004 report (ALA 2004), which details where and why high levels of microscopic, soot-like particles increase the risk of premature death for millions of people, including those with cardiovascular or lung disease. According to the report, 24.3 million people in California are at risk from ozone air pollution (smog), 30.3 million people in the state are at risk from short-term exposure to particle pollution, and 22.7 million Californians are at risk from year-round exposure to particle pollution levels.
California cities dominate the lists of most polluted cities in the nation for both particle and ozone pollution. Of the 25 worst cities for short-term levels of particle pollution, 10 are in California, as are 7 of the worst 25 for year-round particle levels and 9 of the worst 25 for ozone. Los Angles-Long Beach-Riverside top the list as the worst cities in the country for all three measures. Fresno-Madera follows close behind as second-worst cities in the country for both ozone pollution and short-term particle pollution.
California counties receiving F grades (for ozone, particle pollution, or both) are: Alameda, Amador, Butte, Calaveras, Contra Costa, El Dorado, Fresno, Imperial, Inyo, Kern, Kings, Los Angeles, Madera, Mariposa, Merced, Nevada, Orange, Placer, Plumas, Riverside, Sacramento, San Bernardino, San Diego, San Francisco, San Joaquin, Santa Barbara, Santa Clara, Solano, Stanislaus, Sutter, Tehama, Tulare, Tuolumne, and Ventura.
Research proves that people with chronic diseases like asthma, chronic bronchitis, emphysema, and cardiovascular disease are at an increased risk of death when particle pollution is high. Studies have linked particle pollution to asthma attacks, lung cancer, heart attacks, and strokes. Long-term exposure to particle pollution can also profoundly affect lung development in children and young adults. Studies have demonstrated stunted lung growth in children living in polluted areas (ALA 2005).
State of the Air: 2005 Of California’s 52 counties with air quality monitoring stations, 32 received failing grades in the American Lung Association State of the Air: 2005 report (ALA 2005). The report ranks the cities and counties with the dirtiest air and provides county-level report cards on the two most pervasive air pollutants: particle pollution and ozone (more commonly called smog). According to the report, more than 31.6 million Californians are breathing air with dangerously high levels of particle pollution and/or ozone.
California counties receiving F grades on one or more of the three pollutant lists (in alphabetical order) are: Alameda, Amador, Butte, Calaveras, Contra Costa, El Dorado, Fresno, Imperial, Kern, Kings, Los Angeles, Madera, Mariposa, Merced, Nevada, Orange, Placer, Plumas, Riverside, Sacramento, San Bernardino, San Diego, San Francisco, San Joaquin, Santa Barbara, Santa Clara, Stanislaus, Sutter, Tehama, Tulare, Tuolumne, and Ventura.

III-6
California has 14 of the top 25 ozone-polluted counties, 11 of the top 25 counties polluted with short-term particle pollution, and 9 of the top 25 counties polluted with long-term particle pollution. California counties on one or more of the three pollutant lists are (in alphabetical order): El Dorado, Kern, Kings, Fresno, Los Angeles, Mariposa, Merced, Nevada, Orange, Placer, Riverside, Sacramento, San Bernardino, San Diego, Stanislaus, Tulare, and Ventura.
Grade shifts experienced in some counties, compared to last year’s report, are as follows (listed by pollutant): Ozone: Orange and Santa Clara Counties grades dropped from a D to an F; Shasta County’s grade dropped from a B to a C; and San Luis Obispo County’s grade dropped from an A to a B. 24-Hour Particle Pollution: Butte, Inyo, Solano, and Ventura Counties improved their grades from an F to a D; San Luis Obispo and Yolo Counties improved their grades from a C to a B; Calaveras and Lake Counties improved their grades from a B to an A; Mendocino County’s grade dropped from an A to a B. Annual Particle Pollution: Imperial and San Joaquin Counties grades improved from failing to passing.
“This report, based on data gathered by air quality monitoring stations, reflects that too many Californians are breathing too much bad air on too many days,” said John Balmes, M.D., who serves on the American Lung Association of California’s Clean Air Technical Advisory Group and is a pulmonary physician and professor of medicine at the University of California, San Francisco. “The threat may be invisible to the human eye, but it is real, can make people sick and even kill. This is why the American Lung Association is fighting to protect the Clean Air Act and oppose federal administration efforts to weaken it,” Balmes said.
CALIFORNIA INDOOR AIR QUALITY AND HEALTH
Public awareness of indoor air pollution and its effect on health is limited (ARB 2005). Those who are chronically ill and under a doctor’s care are probably more aware of the impact of indoor air pollution than are those who only suffer occasionally from respiratory problems. In the United States, approximately 90 percent of the population (around 260 million people) are affected annually by communicable respiratory disease; 53 million (20%) by allergies; and 16 million (6%) by asthma. The annual cost of allergies and asthma is ~$15 billion or $300 average per person with allergies (W. Fisk 2004). According to 2001 data, 11.9% of Californians, or 3.9 million people, have asthma (CHIS 2003); that number has dramatically increased over the past few decades.
The ARB report contains descriptions of physical symptoms of allergy sufferers and projections of increases in premature death and disease (e.g., ~6,500 deaths and 17,000 serious, non-fatal illnesses per year resulting from outdoor exposure to high levels of particulate matter).
The California Air Resources Board (ARB) identifies the pollution sources common in most residences operating under “normal conditions.” These sources include:
• biological agents (bacteria, mold, dust mites, animal dander);
• endocrine disrupters (plastics, pesticides, flame retardants);
• formaldehyde and related chemicals (composite wood products, furnishings, permanent-press fabrics, etc);
• organic chemicals (solvents, glues, cleaning agents, paint, etc);
• particulate matter (cooking, candles, aerosol sprays, house dust, etc); and,
• polycyclic aromatic hydrocarbons (cooking, wood burning).
We looked at existing technologies (Sect. 3.5) used to mitigate these sources and investigated whether that could be accomplished through a residential HVAC system.
III-7
Although not considered “usual” pollutants, carbon monoxide (CO), nitrogen dioxide (NO2), and other nitrogen oxides were identified as a more limited problem associated mostly with malfunctioning equipment (ARB 2005). Treatment methods for “normal condition” pollutants may also succeed for those pollutants identified as “not usual.” However, because of the more limited occurrence, these pollutants were not specifically investigated.
Environmental tobacco smoke (ETS) is noted to cause or contribute to not only death but virtually all respiratory and many other illnesses. Potentially purifying the indoor air with an HAU is not likely to be a health benefit for smokers. Whether it helps their family members would depend on the healthy air system’s ability to purge ETS quickly from the air stream before it could be inhaled “second hand” by nonsmokers. This may be technologically feasible, but would probably be very costly. Lifestyle changes (giving up smoking or limiting smoking to outdoors) are more practical solutions to second-hand exposure to ETS.
Some pollutants have limited impact in California residences. Radon exposure is limited to areas with small populations. Asbestos is limited to older homes and cannot be effectively treated via the air stream; neither can lead be effectively treated in this way. For these reasons, radon, asbestos, and lead were not specifically investigated as part of this task.
CALIFORNIA HEALTH ISSUES AND AFFECTED POPULATIONS
American Lung Association, Region 9 Air pollution issues vary greatly in the Region 9 states (Arizona, California, Hawaii, and Nevada). Although California has led the nation in efforts to reduce air pollution over the past three decades, it remains the state with the most serious problems. By contrast, Hawaii continues to rank as one of the states with the least ozone and particle pollution. California cities and counties continue to dominate the list of places with the highest number of high air pollution days. Los Angeles-Long Beach-Riverside, CA continues to sit at the top of “most polluted” lists.
Riverside and San Bernardino top the lists of most polluted counties. Eight other metropolitan areas from California made the list of the worst cities for short-term particle pollution: Fresno-Madera, CA at 2nd; Bakersfield, CA, at 3rd; Sacramento- Arden-Arcade-Truckee, CA-NV at 7th; Visalia-Porterville, CA at 9th; Hanford-Corcoran, CA at 15th; Modesto, CA at 19th, San Diego-Carlsbad-San Marcos, CA at 20th and San Jose-San Francisco-Oakland, CA at 23rd. Most of these same cities rank highest in year-round particle pollution as well: Bakersfield, CA at 2nd; Visalia- Porterville, CA at 3rd; Fresno-Madera, CA, at 5th; Hanford-Corcoran, CA at 7th and Merced, CA tied at 18th.
On the list of most ozone-polluted cities, eight CA cities follow Los Angeles-Long Beach-Riverside, CA at the top: Bakersfield, CA ranked at 2nd; Fresno-Madera, CA at 3rd; Visalia-Porterville, CA at 4th; Merced, CA at 5th; Sacramento-Arden-Arcade-Truckee, CA-NV at 7th; Hanford-Corcoran, CA at 13th; Modesto, CA at 16th; and El Centro, CA at 24th.
On the list of most polluted counties, California has 11 on the list of the worst for short-term particle pollution. Riverside County tops the list in 1st most polluted, followed by Fresno (3rd), Kern (4th), Los Angeles (6th), San Bernardino (8th), Orange (10th), Sacramento (12th), Tulare (19th), Kings (24th), and 25th, San Diego. Nine counties are on the list of most polluted year-round by particles: Riverside in 1st place; San Bernardino, 2nd; Los Angeles, 3rd; Kern, 4th, Tulare, 5th; Fresno, 7th, Orange 9th; Kings, 10th; and Merced, tied for 24th. California also had good news about air quality as well. Two counties ranked on the list of the cleanest counties year-round for particle pollution: Lake, tied for 4th, and Inyo placed at 15th. Two cities, Redding and El Centro, tied for 23rd cleanest city for year-round particle pollution.

III-8
Some of the same counties rank among the worst for ozone pollution as well, led by San Bernardino County, which had more unhealthful days in 2001–2003 than it had in 2000–2002. Following San Bernardino County are these 13 counties: Kern, 2nd; Fresno, 3rd; Riverside, 4th; Tulare, 5th; Los Angeles, 6th; Merced, 7th; El Dorado, 9th; Sacramento, 10th; Nevada, 12th; Ventura, 13th; Placer and Mariposa (tied), 20th; and Kings (22nd). Some good news: California had 13 counties on the list of cleanest counties in the nation for ozone: Glenn, Lake, Marin, Mendocino, Monterey, Napa, Plumas, San Francisco, San Mateo, Santa Cruz, Siskiyou, Solano, and Sonoma County. In addition, Salinas, CA, landed on the list of least polluted cities for ozone.
Four counties in California had higher numbers of ozone days that lowered their grades. Eight counties improved their short-term particle pollution grades by recording fewer unhealthful days. Four counties—Butte, Inyo, Solano and Ventura—improved from an F to a D. Most of the 11 counties with continuing year-round particle pollution problems had slightly lower levels in 2001–2003.
An estimated 4.2 million people in California (or 12% of total population) live with lung diseases like asthma, emphysema, and chronic obstructive pulmonary disease (COPD) and more than 35,000 of them will die prematurely this year as a result (ALA 2005).
The total quantity of air pollutants emitted indoors is less than that emitted by outdoor sources. However, once emitted, indoor air pollutants are diluted much more slowly, due to the partial trapping effect of the building shell. Additionally, indoor emissions occur in closer proximity to people: Californians, like others from industrialized nations, spend most of their time indoors.
California adults spend an average of 87 percent of their time indoors, and children under 12 years of age spend about 86 percent of their time indoors. Most of the time spent indoors is spent in the home. However, working adults spend about 25 percent of their time at other indoor locations such as office buildings, stores, and restaurants, primarily for work, and children spend about 21 percent of their time in school on a school day. Senior individuals spend a great deal of time in their homes. Because of these time budgets, the trapping effect of buildings and people’s proximity to indoor sources of emissions, there is a much higher likelihood that people will be exposed to indoor pollutants than outdoor pollutants. Investigators have calculated that pollutants emitted indoors have a 1000-fold greater chance of being inhaled than do those emitted outdoors (Smith 1988, Bennet et al. 2002, Lai et al. 2000).
Homes and schools are critical exposure microenvironments, especially for children and seniors. These groups are more sensitive to the adverse effects of some pollutants, and spend most of their time indoors.
Air Pollution’s Health Effects The State of the Air: 2005 cites recently published studies showing that as ozone levels increase, the risk of premature death increases as well. Ozone air pollution is a powerful respiratory irritant that can actually cause chemical burns on lung tissue. Symptoms include shortness of breath, chest pain when inhaling deeply, wheezing, and coughing.
The studies also found that ozone triggers asthma attacks and increases the need for emergency room visits and hospital admissions. Children, the elderly, and those with asthma or other lung diseases are most at risk from the high ozone levels that occur too frequently in California. “Breathing in ozone burns the lungs like teargas would burn your eyes,” according to John Balmes, a member of the American Lung Association of California’s Clean Air Technical Advisory Group and a pulmonary physician and professor of medicine at the University of California, San Francisco.
III-9
Particle pollution is a mixture of microscopic solids and aerosols that has been found to take months to years off a person’s life. In addition to children, the elderly, and those with asthma, other lung diseases or heart disease, the State of the Air: 2005 report now adds diabetics to the list of groups most at risk from particle pollution, based on increased evidence of their vulnerability to these tiny particles. Particle pollution has also been shown to induce heart attacks and strokes, cause lung cancer, trigger asthma attacks, and increase the need for medical care and hospital visits. The 2005 ARB report estimates that California residents are exposed to dangerously high levels of particle pollution.
When inhaled, tiny particle pollution can lodge deep into the lungs and has been linked to increased asthma attacks, increased hospitalizations for respiratory and heart conditions, and lung cancer. Recent research has also linked exposure to relatively low levels of particle pollution with premature death.
“The dangerous thing about these fine particles is that they are smaller than the width of a human hair and tiny enough to penetrate the body’s natural defense systems,” said Balmes. “This means when you inhale these particles, they embed themselves deep in the lungs. Some may even pass through the lungs to the blood. Studies link particle pollution to increased risk of asthma attacks, heart attacks and strokes, lung cancer, and premature death, to name just a few of the ways this tiny army attacks.”
Health Effects of Indoor Pollutants Transportation, building materials, appliances, consumer products, plastics, and pesticides impart obvious benefits to society. However, it is noted that the use of many beneficial or desirable products can have a down side – the emission of a variety of chemicals that can have an adverse impact on human health. The impact on health depends on the toxicological properties of the chemical and the exposure and absorbed dose an individual may receive (ARB 2005).
Significant health issues include:
• Asthma • Cancer • Irritant and other effects • Increased respiratory and heart disease • Premature death
At-Risk Groups Many groups are especially susceptible to the health effects of indoor pollutants. These include infants and the elderly, those with heart and lung diseases, people with asthma, and individuals who have developed extreme sensitivity to chemicals. Unfortunately, these are the people who often spend the most time indoors.
Significant at-risk categories include:
• Children under 18 • Adults over 65 • Asthma/allergy sufferers • Individuals with lung disease • Individuals with heart disease • Diabetics

III-10
Adult and Pediatric Asthma Over 3.1 million children and over 8.4 million adults with asthma live in parts of the United States with very high levels of ozone. Over 4.6 million adults and nearly 1.7 million children with asthma live in areas with high levels of short-term particle pollution. Three and a half million adults and nearly 1.3 million children with asthma live in counties with unhealthful levels of year-round particle pollution. An estimated 2.3 million residents of California suffer from asthma, including over half a million children; total population of asthmatics about 8% (2% pediatric asthma and 6% adult asthma) (ALA 2005).
Over 16.3 million adults age 65 and over and nearly 36.7 million children age 18 and under live in counties with unhealthful ozone levels. Over 8.8 million seniors and over 19.7 million children live in counties with unhealthful short-term levels of particle pollution. Over 6.7 million seniors and nearly 15.1 million children live in counties with unhealthful levels of year-round particle pollution. Total population in California that falls within this category is 37% (26.6% under 18 and 10.6% over 65) (ALA 2005).
Chronic Bronchitis and Emphysema Over 4.2 million people with chronic bronchitis and 1.5 million with emphysema live in counties with unhealthful ozone levels. Nearly 2.3 million people with chronic bronchitis and 802,000 with emphysema live in counties with unhealthful levels of short-term particle pollution. Over 1.7 million people with chronic bronchitis and over 610,000 with emphysema live in counties with unhealthful year-round levels of particle pollution. Total population in California that falls within this category is 4% (3% chronic bronchitis and 1% emphysema) (ALA 2005).
Cardiovascular Disease and Air Pollution Over 18.3 million Americans with cardiovascular diseases live in areas with unhealthful levels of short-term particle pollution; 13.9 million live in counties with unhealthful levels of year-round particle pollution. Cardiovascular diseases include heart disease, heart attacks and strokes. Total population in California that falls within this category is 23% (ALA 2005).
Diabetes and Air Pollution Over 3.6 million Americans with diabetes live in areas with unhealthful levels of short-term particle pollution; 2.8 million live in counties with unhealthful levels of year-round particle pollution. Research indicates that diabetics face risks from particle pollution’s threat to their cardiovascular systems. Total population in California that falls within this category is 5% (ALA 2005). Appendix III lists California population at risk by group.

Appendix D. California Population at Risk From Pollution


IV-1
APPENDIX IV: CALIFORNIA POPULATION AT RISK FROM POLLUTION
The following graphs illustrate different population groups in California and their corresponding health risks.
Of the total population in California, 37% fall into the at-risk category for age. Figures 1 and 2 illustrate graphically the percent of at-risk population by age for each county in California.
% Total At-Risk Population by Ageper County in California
25%
30%
35%
40%
45%
50%
Ala
meda
Am
ador
Butte
Cala
vera
s
Colu
sa
Contr
a C
osta
Del N
ort
e
El D
ora
do
Fre
sno
Gle
nn
Hum
bold
t
Imperial
Inyo
Kern
Kin
gs
Lake
Lassen
Los A
ngele
s
Madera
Marin
Mariposa
Marin
Mendocin
o
Merc
ed
Modoc
Mono
40% or greater
Source: American Lung Association State of the Air:2005
% Total At-Risk Population by Age
per County in California
25%
30%
35%
40%
45%
50%
Monte
rey
Napa
Nevada
Ora
nge
Pla
cer
Plu
mas
Riv
ers
ide
Sacra
mento
San B
enito
San B
ern
ard
ino
San D
iego
San F
rancis
co
San J
oaquin
San L
uis
Obis
po
San M
ate
o
Santa
Barb
ara
Santa
Cla
ra
Santa
Cru
z
Shasta
Sie
rra
Sis
kiy
ou
Sola
no
Sonom
a
Sta
nis
laus
Sutter
Teham
a
Trinity
Tula
re
Tuolu
mne
Ventu
ra
Yolo
Yuba
40% or greater
Source: American Lung Association State of the Air:2005 Figs. 1 & 2. Percent of total at-risk population by age for each county in California.

IV-2
Distribution of Health Sensitive Groups by County
Health sensitive groups include groups with pediatric asthma, adult asthma, chronic bronchitis, emphysema, CV disease, and diabetes; t = 34, n = 52 greater than 40%. Of the total population in California, 40% fall into the at-risk category for health. Figures 3 and 4 illustrate graphically the percent of at-risk population by health for each county in California.
% Total At-Risk Population by Healthper County in California
25%
30%
35%
40%
45%
50%
55%
60%
Ala
meda
Am
ador
Butte
Cala
vera
s
Colu
sa
Contr
a C
osta
Del N
ort
e
El D
ora
do
Fre
sno
Gle
nn
Hum
bold
t
Imperial
Inyo
Kern
Kin
gs
Lake
Lassen
Los A
ngele
s
Madera
Marin
Mariposa
Marin
Mendocin
o
Merc
ed
Modoc
Mono
40% or greater
Source: American Lung Association State of the Air:2005
% Total At-Risk Population by Health per County in California
25%
30%
35%
40%
45%
50%
55%
60%
Monte
rey
Napa
Nevada
Ora
nge
Pla
cer
Plu
mas
Riv
ers
ide
Sacra
mento
San B
enito
San B
ern
ard
ino
San D
iego
San F
rancis
co
San J
oaquin
San L
uis
Obis
po
San M
ate
o
Santa
Barb
ara
Santa
Cla
ra
Santa
Cru
z
Shasta
Sie
rra
Sis
kiy
ou
Sola
no
Sonom
a
Sta
nis
laus
Sutter
Teham
a
Trinity
Tula
re
Tuolu
mne
Ventu
ra
Yolo
Yuba
40% or greater
Figs. 3 & 4. Percent of total at-risk population by health for each county in California.
Source: American Lung Association State of the Air:2005

IV-3
Distribution of At-Risk Groups by County
Figures 5 and 6 present the percent of total at-risk population by county in California.
% Total At-Risk Population per County in California
25%
30%
35%
40%
45%
50%
55%
60%
Ala
me
da
Am
ad
or
Bu
tte
Ca
lave
ras
Co
lusa
Co
ntr
a C
osta
De
l No
rte
El D
ora
do
Fre
sn
o
Gle
nn
Hu
mb
old
t
Imp
eri
al
Inyo
Ke
rn
Kin
gs
La
ke
La
sse
n
Lo
s A
ng
ele
s
Ma
de
ra
Ma
rin
Ma
rip
osa
Ma
rin
Me
nd
ocin
o
Me
rce
d
Mo
do
c
Mo
no
Health Age
Source: American Lung Association State of the Air:2005
% Total At-Risk Population per County in California
25%
30%
35%
40%
45%
50%
55%
60%
Monte
rey
Napa
Nevada
Ora
nge
Pla
cer
Plu
mas
Riv
ers
ide
Sacra
mento
San B
enito
San B
ern
ard
ino
San D
iego
San F
rancis
co
San J
oaquin
San L
uis
Obis
po
San M
ate
o
Santa
Barb
ara
Santa
Cla
ra
Santa
Cru
z
Shasta
Sie
rra
Sis
kiy
ou
Sola
no
Sonom
a
Sta
nis
laus
Sutter
Teham
a
Trinity
Tula
re
Tuolu
mne
Ventu
ra
Yolo
Yuba
Health Age
Source: American Lung Association State of the Air:2005 Figs. 5 & 6. Percent of total at-risk population by county in California.

IV-4
Distribution of At-Risk Population by Building America Climate Zones
The following graphs (Figs. 7–10) illustrate the percentage of total at-risk population by Building America Climate (cold, hot/dry, marine, mixed/dry) zones.
% Total At-Risk Population in Cold Climates (1% Tpop)per County in California
25%
30%
35%
40%
45%
50%
55%
60%
Lassen
Modoc
Mono
Nevada
Plu
mas
Sie
rra
Sis
kiy
ou
Age Health
40% or greater, t=5 by Health, t=2 by
Source: American Lung Association State of the Air:2005
% Total At-Risk Population in Hot-Dry Climates (76% Tpop)per County in California
25%
30%
35%
40%
45%
50%
55%
60%
Bu
tte
Co
lusa
Co
ntr
a C
ost
a
Fre
sn
o
Gle
nn
Imp
eri
al
Ke
rn
Kin
gs
Lo
s A
ng
ele
s
Ma
de
ra
Me
rce
d
Ora
ng
e
Pla
cer
Riv
ers
ide
Sa
cra
me
nto
Sa
n B
ern
ard
ino
Sa
n D
ieg
o
Sa
n J
oa
qu
in
Sh
ast
a
So
lan
o
Sta
nis
lau
s
Su
tter
Te
ha
ma
Tu
lare
Yo
lo
Yu
ba
Age Health40% or greater, t=11by Health, t=8 by Age
Source: American Lung Association State of the Air:2005
Figs. 7 & 8. Percent of total at-risk population by Building America climate zone for cold and hot/dry climate zones.

IV-5
Figs. 9 & 10. Percent of total at-risk population by Building America climate zone for marine and mixed/dry climate zones.
% Total At-Risk Population in Mixed-Dry Climates (3% Tpop)per County in California
25%
30%
35%
40%
45%
50%
55%
60%
Am
ador
Cala
vera
s
El D
ora
do
Inyo
Lake
Mariposa
Trinity
Tuolu
mne
Age Health40% or greater, t=36 by Health, t=1 by
Source: American Lung Association State of the Air:2005
% Total At-Risk Population in Marine Climates (22% Tpop)per County in California
25%
30%
35%
40%
45%
50%
55%
60%A
lam
eda
Del N
ort
e
Hum
bold
t
Marin
Marin
Mendocin
o
Monte
rey
Napa
San B
enito
San F
rancis
co
San L
uis
Obis
po
San M
ate
o
Santa
Barb
ara
Santa
Cla
ra
Santa
Cru
z
Sonom
a
Ventu
ra
Age Health40% or greater, t=12 by Health
Source: American Lung Association State of the Air:2005

IV-6
Respiratory Conditions by County
Figures 11 and 12 illustrate the 10 counties with the highest total at-risk population with respiratory conditions.
Total At-Risk Population with Respiratory Conditionsper County in California
0
10
20
30
40
50
60
70
80
90
100
Ala
meda
Am
ador
Butte
Cala
vera
s
Colu
sa
Contr
a C
osta
Del N
ort
e
El D
ora
do
Fre
sno
Gle
nn
Hum
bold
t
Imperial
Inyo
Kern
Kin
gs
Lake
Lassen
Los A
ngele
s
Madera
Marin
Mariposa
Marin
Mendocin
o
Merc
ed
Modoc
Mono
Thou
sand
s
Chronic Bronchitis Adult Asthma Pediatric Asthma Emphysema
Source: American Lung Association State of the Air:2005
Total At-Risk Population with Respiratory Conditionsper County in California
0
10
20
30
40
50
60
70
80
90
100
Monte
rey
Napa
Nevada
Ora
nge
Pla
cer
Plu
mas
Riv
ers
ide
Sacra
mento
San B
enito
San B
ern
ard
ino
San D
iego
San F
rancis
co
San J
oaquin
San L
uis
Obis
po
San M
ate
o
Santa
Barb
ara
Santa
Cla
ra
Santa
Cru
z
Shasta
Sie
rra
Sis
kiy
ou
Sola
no
Sonom
a
Sta
nis
laus
Sutter
Teham
a
Trinity
Tula
re
Tuolu
mne
Ventu
ra
Yolo
Yuba
Thou
sand
s
Chronic Bronchitis Adult Asthma Pediatric Asthma Emphysema
Source: American Lung Association State of the Air:2005
Figs. 11 & 12. Percent of total at-risk population with respiratory conditions for each county in California.