market developments - st. louis fed 3^5 developments in the corporate and municipal bond markets 6-7...
TRANSCRIPT

^ " . - / 2 ^ 4 I I
DECONTROLLED: AFTER SIX MOUTHS i vi
cmwm • L . 5 . 8 Conf ident ia l ( F . R . ) O c t o b e r 2 0 . 1 9 6 9
. _ . - v
\ •A V (\AfM
MARKET DEVELOPMENTS
Capital Markets Section, Division of Research and Statistics, Board of Governors of the Federal Reserve System, Washington, D. C.
Digitized for FRASER http://fraser.stlouisfed.org/ Federal Reserve Bank of St. Louis

INDEX
3^5 Developments in the Corporate and Municipal Bond Markets
6-7 Capital Market Y ie lds
8-13 Capital Market Volume
14-17 Stock Market
18-33 Mortgage Market
SYMBOLS:
e Estimate
p Preliminary
r Revised
n.a. Not avai lable
Digitized for FRASER http://fraser.stlouisfed.org/ Federal Reserve Bank of St. Louis

TABLE 1: Yields, Volume and Reception
CORPORATE BOND MARKET YIELDS VOLUME 2
WEEK ENDING: MOODY'S PER CENT 'SEASONED GROSS SOLD BY END BONDS SCHEDULED
NEW ISSUE1 Aaa OFFERINGS OF WEEK WITHIN 28 DAYS
1969 - Sept. 5 7.90 7.05 204 90 1,179 12 8.02 7.12 310 100 982 19 8.04 7.16 291 93 775 26 8.13 7.19 353 74 548
Oct. 3 8.22 7.28 195 75 871 10 8.10 7.37 89 76 928 17 7.95 7.39 . 207 97 798
n. a. n.a. 300e n.a. n.a.
MUNICIPAL BOND MARKET YIELDS VOLUME2
WEEK ENDING: MOODY'S BOND BUYER PER CENT 1 SEASONED SEASONED 20 . GROSS SOLD BY END 1 BONDS SCHEDULED Aaa BOND INDEX OFFERINGS OF WEEK 1 WITHIN 28 DAYS
1969 - Sept. 5 5.80 6.37 86 80 547 12 5.85 6.33 132 77 545 19 5.85 6.25 100 78 462 26 5.82 6.08 126 72 626
Oct. 3 ! 5.83 6.19 119 72 745 10 5.80 6.14 342 79 454 17 5.75 5.92 300 59 528 24 n.a. n.a. 350e n.a. n.a.
1 Derived by adjusting to a Aaa basis, new issues of* publicly-offered corporate bonds with call protection, rated A, Aa, or Aaa by Moody's Investors Service (except serial and convertible issues, offerings of natural gas pipeline and foreign companies, and bonds guaranteed by the Federal Government.) ^
2 Millions of dollars unless otherwise indicated. .
Note: Sc-u footnotes to Table 3
Digitized for FRASER http://fraser.stlouisfed.org/ Federal Reserve Bank of St. Louis
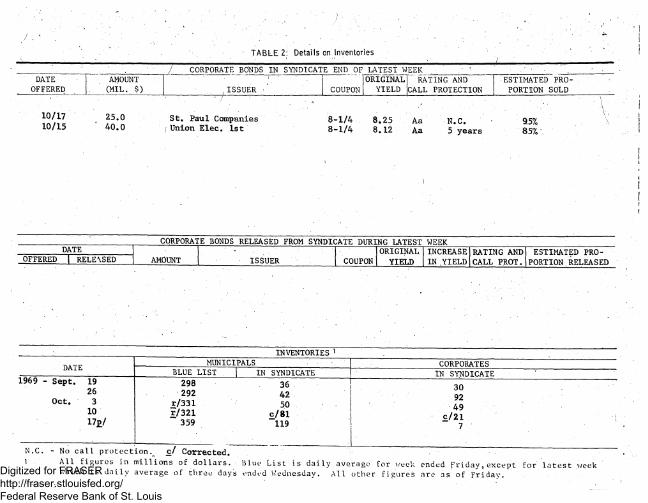
TABLE 2: Details on Inventories • 1 • I
) CORPORATE BONDS IN SYNDICATE END OF LATEST WEEK DATE
OFFERED AMOUNT (MIL. $) ,ISSUER COUPON
[ORIGINALT RATING AND ( YIELD (CALL PROTECTION
ESTIMATED PRO-PORTION SOLD
10/17 10/15
25.0 " 40.0
St. Paul Companies / Union Elec. 1st
8-1/4 8-1/4
8.25 Aa N.C. 8.12 Aa 5 years
• • . ' . v . 95% \ 85%
CORPORATE BONDS RELEASED FROM SYNDICATE DURING LATEST WEEK DATE ORIGINAL INCREASE
OFFERED LRELEXSED AMOUNT ISSUER COUPON YIELD IN YIELD ESTIMATED PRO-
DATE
1969 - Sept. 19 26
Oct. 3 10 17j>/
INVENTORIES 1
MUNICIPALS BLUE LIST
CORPORATES IN SYNDICATE IN SYNDICATE
298 292
r/331 7/321 359
36 42 50
c/81 119
30 92 •49
c/21
N.C. - No call protection.n c/ Corrected. 1 All figures in millions of dollars.
which is daily average ^ . Blue List i c vie
of three day's ended Wednesday daily average for week ended Friday,except for latest week lay. All other figures are as of Friday. Digitized for FRASER
http://fraser.stlouisfed.org/ Federal Reserve Bank of St. Louis

BONDS IN SYNDICATE Millions of dollars
200
I n i MUNICIPAL BONDS IN SYNDICATE
100
300
200
100
JUN. SEPT. 1969
Digitized for FRASER http://fraser.stlouisfed.org/ Federal Reserve Bank of St. Louis

TABLE 3: High Grade Bond Yields.
DATE NEW ,
CORPORATE Aaa1
MOODY'S SEASONED CORPORATE
Aaa2
U.S. GOVERNMENT 20-YEAR
CONSTANT MATURITIES 3 .
. BOND. BUYER1S SEASONED
MUNICIPALS 4
1967 - High Low
6.55(12/8) 5.11(2/10)
6.24(2/29) 5.00(2/10)
5.73(11/7) 4.48(1/20)
4.45(12/7) 3.40(2/2)
1968 - High Low
7.02(12/13) 6.13(8/30)
6.55(1/27) 5.95(9/13)
5.90(1/20) 5.18(8/9)
4.85(1/26) 4.07(8/8)
1969 - High Low
8.22(10/3) 6.90(2/21)
7.39(10/17) 6.55(1/3)
6.77(10/17) 5.96(1/24)
6.37(9/4) 4.82(1/28)
1969 - Sept. 19 26
8.40 ^ 8.13
7.16 7.19
6.55 6.64
6.25 6.08
Oct. 3 10
x17£/
8.22 8.10 7.95*%
7.28 7.37 7.39"
6.77 6.54 6.38
6.19 6.14 5.92
1 New corporate issues, with call protection, adjusted (as described in footnote 1 of Table 1) to a Aaa basis.
2 Weekly average of daily figures.. Average term of bonds included is 22-24 years.
3 Weekly average of daily figures. 4 Thursday figures. The average rating of the 20 bonds used in this index
falls midway between the four top groups as classified by Moody's In-vestors Service.
Note--Highs and lows are for individual series and may be on different dates for different series.
Digitized for FRASER http://fraser.stlouisfed.org/ Federal Reserve Bank of St. Louis

HIGH GRADE BOND YIELDS
1965 1966 1967
J\ Per cent | I I I I I I I I I I I I M I I I I I A ' I 8
NEW CORPORATE Aaa t
r MOODY'S CORPORATE Aaa
U S. GOVT. 20 YR CONSTANT MATURITIES
BOND BUYER MUNICIPAL
I I M I I I I I I. I I I I I I I I I:! I I
1969 1968
Digitized for FRASER http://fraser.stlouisfed.org/ Federal Reserve Bank of St. Louis

TABLE 4: Long-term Corporate and State and Local Government Security Offerings and Placements
(In millions of dollars)
GROSS PROCEEDS
PERIOD - CORPORATE1 | STATE AND LOCAL 2
1969p 1968p 1967 j 1969 p 1968 p 1967
January February March
2,075 2,045 2,098
1 ,771 1,608 1,799 .
- 1,684 1,418 2,362
I 1,263 1 988 ! 540
1,178 1,158 1,404
1,492 1,236 1,450
\ i|| 2,748
2,076 2,480
1,428 1,866 2 ,411
2,015 1,518 2 ,674
j 1 ,800. I 1,113 ; 711
1,318 1,143 1,395
1,130 1,254 1,497
• July c
August September
2,450 l , 6 0 0 e 2,480e
2,143 1,432 1,557
2,589 2 ,481 1,763
j 1,063 790 525e
1,469 1,699 1,444
950 860
1,340
October November December
2,129 1,767 2,054
2,409 1,500 2,385
2,230 1 ,021 1,115
975 1 ,401 1,182
1st Quarter , 2nd Quarter 3rd Quarter 4th Quarter
6,218 7,304 6,530e
5,178 5,704 5,133 5,950
5,464 6,208 6,832 6,294
2 , 7 9 1 3,624 2,378e
3,740 3,856 4 ,612 4,366
4 ,177 ' 3 , 8 8 1 3,150 1 3,557 j
1st half Three quarters Year
13,522 20,052e
10,882 16,015 21,965
11,672 18,504 24,798
6,415 8,793e
7,956 12,008 16,574
8,059 ; 11,209 14,766
Excluding finance companies 3
1st Quarter 2nd Quarter 3rd Quarter 4th Quarter
5,107 5,427 4 ,785 5,654
5,308 6,063 6,584 5,859
Year 20,973 23,814
Securities and Exchange Commission estimates of gross proceeds. Investment Bankers Association of America estimates of principal amounts. Total gross proceeds excluding offerings of sales and consumer finance companies. ,
Digitized for FRASER http://fraser.stlouisfed.org/ Federal Reserve Bank of St. Louis

TABLE 5: New Corporate Security Issues, Type of Issue and Issuer (In millions of dollars)
.QUARTER OR
MONTH
1968 - III
IV 1969 - I
lie/ H i e /
1968 - Sept. Oct. Nov. Dec.
1969 - Jan. Feb. Mar. Apr. May-June July
Aug. Aug ,ej
GROSS PROCEEDS BY TYPE OF ISSUE
5,133 5,951 6,218 7,304 6,530
1,556 2,129 1,767 2,055 2.075 2,045 2,098 2,748 2.076 2,480 2,450 1,600
Sept.t/2,480
2,606 2,555 2,657 3,411 3,209
727 1,009
939 607 980 842 835
1,268 871
1,272 1,279
700 1,230
PUBLICLY PRIVATELY OFFERED PLACED
1,361 1,922 1,540 1,623 1,141
433 595 362 965 636 395 509 649 510 464 591 500 550
COMMON AND
PFD. STOCK
1,166 1,474 2,023 2,268 1,679
.. . \
398 525 466 483 460 808 755 830 694 744 579 40d 700
MEMO: ISSUES INCLUDED
FOREIGN CONVERTIBLE
124 113 215 227 n.a.
28 24 49 40 103 74 38
. 62 28 137 132 n.a. n.a.
1,037 1,657 1,160 490 1,825 902 1,712 1,435 319 2,483
1,355 1,407 1,346 . 473 2,993 1,077 1,723 1,878 432 3.266
706 1,831 1,362 721 2,617
221 365 211 326 376 578 401 430 463 184 206 200 300
GROSS PROCEEDS BY TYPE OF ISSUER
MFG.. PUBLIC UTILITY
453 640 421 651 403 513 491 513 569 641 881
250 700
475 674 443 319 627 315 404 784 392 702 492
450 420
1 Other issuers are extractive, railroad and other transportation, real estate and finance, and commercial and other. Source: Securities and Exchange Commission. Quarterly supplements are avail-able. - '
COMMUNI-CATIONS
156 115 162 41 186 56
231 44 197 191 286
175 260
OTHER
472 700 741
1,044 860
1,161 972
1,405 915 946 792
725 1,100
Digitized for FRASER http://fraser.stlouisfed.org/ Federal Reserve Bank of St. Louis

TABLE 6: Large Long-term Public Security Issues for New Capital (Other than U.S. Treasury) 1
October 1 through October 17. 1969 / AMOUNT
/ (MILLIONS ISSUER TYPE y OF MATURITY
DOLLARS)
Corporate
Northern States Pwr. Co. Illinois Power Company Columbia Gas System Inc. Nashua Corporation General Public Utilities Corporation
\ General Telephone Co. of Illinois
Dayton Pwr. &, Light Co. Family Finance Corp. Pennsylvania Pwr. & Light Company
St. Paul Companies, Inc. Appalachian Pwr. Company Imperial Corp. of America Union Electric Company Household Finance
COUPON RAT:: OR
K K i 1..TKR-I ST.COST
OFFKR-INC
'YIELD
V Moont1. RAT INI,
1st mtg. 45.0 1999 8.00 8. 35 Aa 1st mtg. 35.0 1999 8.35 8. 35 Aa Debs. 50.0 1994 9.00 8. 95 A Debs. 15.0 1989 9-1/4 9. ,25 Baa
Com. stk. 28.8
1st mtg. 15.0 1999 9.00 8, ,80 A 1st mtg. 30.0 1999 8-1/4 8. ,25 Aa Debs. 40.0 1989 9-1/2 9-1/2 N.R.
Com. stk. 25.0 Notes i 25.0 1974 8-1/4 8. ,25 N.R. 1st mtg/ 60.0 1999 8-1/2 8. 36 A Com. stk. 19.2
8-1/2
1st mtg. 40.0 1999 8-1/4 8. 12 Aa Debs. 75.0 1975 8-3/4 8. 81 N.R.
Digitized for FRASER http://fraser.stlouisfed.org/ Federal Reserve Bank of St. Louis

TABLE 6: Large Long-term Public Security Issues for New Capital (Other than U.S. Treasury)1
(continued) October 1 through October 17, 1969.
' AMOUNT COUPON
(MILLIONS RATI: OR OFFER- MOOMY'.
ISSUER TYPE ' OF MATURITY N K I i.iTER- ING RAT I N(.
DOLLARS) 1 ST COST YIELD
State & local Government
Michigan, State of Bonds 30.0 1973-78 5.49 5.20-5.50 Aa New York State Dorm. Auth. Rev. 18.6 1970-2000 6.85 5.60-690 N.R. New York State Dorm. Auth. Rev. 5.6 1970-2000 6.87 5.60-6.90 N.R. New York State Bonds 84.0 1970-89 5.87 5.20-6.15: Aa Hawaii, State of Rev. 45.0 1972-94 7.04 5.80-7.00 N.R. Los Angeles Dept. of Wtr. and Power Rev. 39.0 1970-99 6;22 5.20-6.25 Aa
Chicago, Illinois Bonds 20.0 1971-79 5.95 5.40-5.85 A-l Washington Co., Tennessee G.O. 15.2 1971-90 6.31 5.35-6.38 Aa Warren Consolidated Sch. Dist., Michigan Bonds 13.0 1970-1998 6.00 6.00 Baa
Los Angeles Co. Flood Control District Bonds 5.0 1970-95 5.87 5.00-5.90 Aa
Los Angeles Co. Flood Control District Bonds 10.0 1970-95 5.91 5.00-5.90 Aa
Washington, State of G.O. & Rev. 4.0 1974-85 5.65 5.10-5.80 Aa Washington, State of G.O. & Rev. 20.1 1971-80 5.55 5.10-5.80 Aa New York, New York G .O . 49.5 1971-74 6.70 5.75-6.20 Baa-1 New York, New York G.O. 61.9 1971-80 6.40 5.75-6.35 Baa-1 New York, New York G.O. 48.6 1971-84 6.40 5.75-6.40 Baa-1
Digitized for FRASER http://fraser.stlouisfed.org/ Federal Reserve Bank of St. Louis

TABLE 6: Large Long term Public Security Issues for New Capital (coiitmm rb (Other than U.S. Treasury)'
(continued) October 1 through October 17 j 1969
ISSUER
Other
F.N.M.A. F.N.M.A. Federal Land Banks Tennessee Valley Atith. Federal Home Loan Bank
AMOUNT (MILLIONS
OF DOLLARS)
MATURITY
Debs. 200.0 1972 Debs. 400.0 1971 Bonds 232.4 1971 Bonds 100.0 1994 Consol. bds. 250.0 1971
COUPON RATE OR
NET INTER-EST COST
8.70 8-3/4 8.45 8-1/4 8.20
OITKR-i;..c
VILLI)
8.70 8.75 8.45 8.25 8.20
MOODY'S RATING
Aaa
Rights offering. \ Includes corporate and other security offerings of $15 million and over; State and local security offerings of $10 million and over. In case of State and local government securities, G.O. denotes gem-raI ohli gat i on; '<ev.-Ut., revenue,obligations secured only by income from public utilities; Rev. -Q. -lit. , revenue bonds secured only by income from quasi - ut i lities ; Rev. -S .T . , revenue bonds secured by revenue from specific taxes only; Rev.-Rent., revenue bonds secured solely by lease payments. Includes foreign government and International Bank for Reconstruction and Development issues and non-quaranteed issues by Federal Agencies.
Digitized for FRASER http://fraser.stlouisfed.org/ Federal Reserve Bank of St. Louis

TABLE 7: Forthcoming Large Long-term Public Security Offerings for New Capital (Other than U.S. Treasury)1
As of October 20. 1969. AMOUNT
(MILLIONS APPROXIMATE DATE ISSUER TYPE OF OF OFFERING
DOLLARS)
Corporate
Texas Eastern Transmission Corporation .
Associates Investment Co. Southern California Edison
. - Company Mountain States Telephone and Telegraph
Data Processing Financial and General Corporation
Consumers Pwr. Company First & Merchants Corp. Pacific Pwr. & Light Signal Companies, Inc. Wisconsin Electric Pwr. Co. Northern Natural Gas Co. Alabama Pwr. Company Tucson Gas & Elec. Co. Consolidated Natural Gas Co. Collins and Aikeman Investment Properties Association
National Health Enterprises Inc.
Consumers Pwr. Company Cleveland-Electric , Illuminating Public Service Elec. & Gas Company
South Central Bell Telephone Company
Iowa Elec. Light & Pwr. Co. *Iowa Pwr. & Light Co. *Public Service Co., Ind. *Pacific Gas & Elec. Co. *Boston Edison Company *Louisiana Pwr. & Light Co.
Debs. 30.0 October 20
1st pipeline 50.0 October 20 Sr. debs. 35.0 October 21
1st & ref. 100.0 October 21
Debs. ^ 100.0 October 22
Conv. sub. debs. 35.0 October 22 Prf. stk. 35.0 October 23 Conv. sub. debs. 20.0 October 24 1st mtg. 20.0 October 27 S.F. debs. 100.0 October 28 Bonds \ 40.0 October 28 S.F. debs. 50.0 October 28 Bonds 35.0 October 29 Bonds 15.0 October 29 Debs. 30.0 October 30 Conv. debs. 15.0 October
Bonds 78.8 October
Debs. 15.0 October Bonds 55.0 November 5
Bonds 30-60.0 November 6
Debs. 60.0 November 6
Debs. 125.0 November 12 Bonds 20.0 November 13 Bonds , 15.0 November 17 Bonds 40.0 November 18 Bonds 80.0 November 19 Bonds 50.0 November 20 Bonds 25.0 November 25
Digitized for FRASER http://fraser.stlouisfed.org/ Federal Reserve Bank of St. Louis

TABLE 7: Forthcoming Large Long-term Public Security Offerings for New Capital
'QTcontlnula)TreaSUrY)' As of October 20, 1969. AMOUNT
(MILLIONS APPROXIMATE DATE ISSUER TYPE OF OF OFFERING
DOLLARS) State & local Government
Louisiana, State of Bonds 15.0 October 20 Alabama, State of Bonds 13.0 October 21 Philadelphia S/D, Pa. Bonds 60.0 October 21 Detroit City S/D, Michigan Bonds 18.0 October 21 Jackson Co. Missouri Bonds 33.0 October 21 Pittsburgh, Pennsylvania Bonds 10.0 October 21 Connecticut, State of G.O. 75.0 October 23 Wayne Co., Michigan Bonds 20.0 October 23 *Puerto Rico Bonds 50.0 October 23 •Henerico Co., Virginia G.O. 15.0 October 28 Dade Co. Board of Public Instruction, Florida Rev. 13.4 October 29
N.Y.S. Housing Finance Agency Bonds 95.0 October 29
•Marion Co., Indiana G.O. 15.5 October 30 Vermont, State of V.P. 25.0 November 6 *Albany, Co., New York Bonds 70.0 November 6 •Pennsylvania High Ed. Fac.
Authority Bonds 13.7 November 6 *Anne ArundelCo., Maryland V.P. 12.0 November 13 * Pennsylvania Sch. Bldg. Auth. Bonds 52.7 November 18 *St. Paul, Minnesota G.O. 11.5 November 18 *Dallas, Texas G.O. & Rev. 45.9 November 19 *Jersey City, New Jersey G.O. 10.0 - November 25 •Richmond, Virginia G.O. 38.0 December 3
Other
•Housing Assistance Admin. Bonds 139.3 / November 16
* Included in table for first time. . 1 Includes corporate and other issues of $15 million and over; State and local
Government issues of $10 million and over. 2 Includes foreign government and International Bank for Reconstruction and
Development issues and non-guaranteed issues of Federal Agencies. Postponed this week were: Uris Building Corporation - 35.0; cancelled because
of market conditions. State of Washington - 15.0; two bids rejected due to high interest rate.
Digitized for FRASER http://fraser.stlouisfed.org/ Federal Reserve Bank of St. Louis

14
TABLE 8: Stock Prices and Volume
STOCK PRICES 1 TRADING 1 VOLUME 2
DATE " S&P 5003 D.J. - IND. AMEX4 NYSE AMEX
1967 - High 97.59(9/25) 943.08(9/25) 24.52(12/29) 60.7(8/14) 33.5(10/27) Low 80.38(1/3) 786.41(1/3) 13.78(1/27) 27.41(1/6) 8.3(1/6)
1968 - High 108.37(11/29) 985.21(12/3) 33.24(12/20) 82.1(6/7) 45.4(6/7) Low 87.72(3/5) 825.13(3/21) 22.00(3/22) 34.0(2/23) 14.1(2/23)
1969 - High 105.94(5/16) 968.85(5/14) 32.91(1/3) 82.6(10/17) 38.4(5/9) Low 91,96(7/25) 801.96(7/29) 25.02(7/29) 32.8(4/4) 12.9(4/4)
1969 - Sept. 5 93.64 819.50 26.34 35.6 12.4 12 94.35 824.25 26.38 54.0 19.6 19 95.19 830.39 26.77 56.3 20.2 26,
94.16 824.18 26.63 54.0 19.2
Oct. 3 93.19 808.41 26.57 51.3 35.3 10 93.56 806.96 26.71 52.2 18.2 17& 96.25 836.06 27.66 82.6 29.9
l Figures other than highs and lows are Fridays only. Highs and lows are for the year and are not necessarily for Fridays.
2 Total number of shares traded per week (millions of shares). In the past, trading was normally conducted 5 days a week for 5 1/2.hours per day, or 27 1/2 hours per week. From August 8 through August 20, 1967, daily trad-ing was reduced to 4 hours per day or 20 hours per week. A 20-hour week was also in effect from' January 22 through March 1, 1968. From June 30 through December 31, 1968, the exchanges were open 5 1/2 hours for 4 days
. a week or 22 hours. From January 3 through July 3, 1969, the exchanges were open 4 hours each day, 20 hours per week. Beginning July 7, 1969 the exchanges have been open 4 1/2 hours each day, 22 1/2 hours per week. NYSE is New York Stock Exchange; AMEX is American Stock Exchange.
3 1941-43 = 1 0 .
4 Average dollar value of shares listed.
Digitized for FRASER http://fraser.stlouisfed.org/ Federal Reserve Bank of St. Louis

STOCK PRICES AND TRADING VOLUME D J S&P AM EX Weekly (Ind) (500)
1300 130 1260 126 STOCK PRICES
1220 122
1180 118
1140 114
AMEX PRICE LEVEL INDEX / y~|
29
1100 110 S&P's 500
1060 106
1020 102
25
940 94 19
17.
860 86 D.J. IND. 820 82
780
740 74
— • 1 — ; - r AMEX TRADING VOLUME (TOTAL FOR WEEK)
40
20
- NYSE TRADING VOLUME (TOTAL FOR WEEK)
iiislliL,!!.!!:!:!!;,!!!,!:!,!!!!!!::!!,!.!!...:!;,:.-!!.
1966 1967 1968 1969 1965
Digitized for FRASER http://fraser.stlouisfed.org/ Federal Reserve Bank of St. Louis
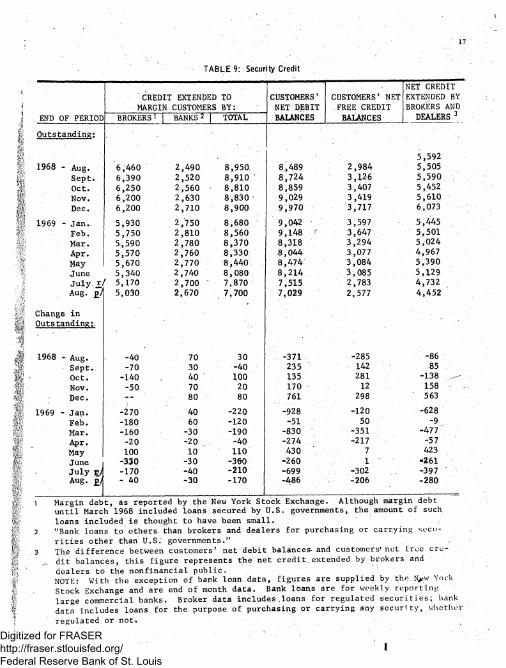
TABLE 9: Security Credit
NET CREDIT CREDIT EXTENDED TO CUSTOMERS' CUSTOMERS' NET EXTENDED BY MARGIN CUSTOMERS BY: NET DEBIT FREE CREDIT BROKERS AND
END OF PERIOD BROKERS 1 | BANKS 2 j TOTAL BALANCES BALANCES DEALERS 3
Outstanding:
5,592 1968 - Aug. 6,460 2,490 8,950. 8,489 2,984 5,505
Sept. 6,390 2,520 8,910 • 8,724 3,126 5,590 Oct. 6,250 2,560 8,810 8,859 3,407 5,452 Nov. 6,200 2,630 8,830 9,029 3,419 5,610 Dec. 6,200 2,710 8,900 9,970 3,717 6,073
1969 - Jan. 5,930 2/750 8,680 9,042 3,597 5,445 . Feb. 5,750 2,810 8,560 9,148 r 3,647 5,501 Mar. 5,590 2,780 8,370 8,318 3,294 5,024 Apr. 5,570 2,760 8,330 8,044 3,077 4,967 May 5,670 2,770 8,440 8,474 3,084 5,390 June 5,340 . 2,740 8,080 8,214 3,085 5,129 J u l y . £ / 5 , 1 7 0 2,700 7,870 7,515 2,783 4,732 Aug. £./ 5,030 2,670 7,700 7,029 2,577 4,452
Change in Outstanding:.
1968 - Aug. -40 70 30 -371 -285 -86 Sept. -70 30 -40 235 142 85 Oct. -140 40 100 135 281 -138 Nov. -50 70 20 170 12 158 Dec. -- 80 80 761 298 563
1969 - Jan. -270 40 -220 -928 -120 -628 Feb. -180 60 -120 -51 50 "9 Mar. -160 -30 -190 -830 -351 -477 Apr. -20 -20\ -40 -274 -217 -57 May 100 10 110 430 7 423 June -330 -3'0 -360 -260 1 -261 July v) -170 -40 -210 -699 -302 -397 Aug. £/ - 40 -30 -170 -486 -206 -280
Margin debt, as reported by the New York Stock Exchange. Although margin debt until March 1968 included loans secured by U.S. governments, the amount of such loans included is thought to have been small. "Bank loans to others- than brokers and dealers for purchasing or carrying secu-rities other than U.S. governments." The difference between customers' net debit balances and customers'net free cre-dit balances, this figure represents the net credit.extended by brokers and dealers to the nonfinancial public. NOTE: With the exception of bank loan data, figures are supplied by the. N^w York Stock Exchange and are end of month data. Bank loans are for weekly reporting large commercial banks. Broker data includes .loans for regulated securities; bank data includes loans for the purpose of purchasing or carrying any security, whether
regulated or not-.
I
Digitized for FRASER http://fraser.stlouisfed.org/ Federal Reserve Bank of St. Louis

TABLE 10: Savings Flows at Nonbank Depositary Intermediaries ($ millions)
. MUTUAL SAVINGS BANKS ' SAVINGS & LOAN ASSOCIATIONS TOTAL REGULAR DEPOSITS 3 NET . SHARE CAPITAL NET /' DEPOSITS NET
DATE „ ANNUAL NEW ANNUAL NEW. .» • ANNUAL NEW NET GROWTH MONEY2 NET GROWTH MONEY 2 NET GROWTH MONEY 2
FLOW RATE 1 FLOW RATE 1 FLOW RATE 1 i
1966 Not Seasonally Ad justed
1966 2,557 4.9 227 3,584 3.2 -552 6,141 3.8 -325 1967 5,082 9.3 2,376 10,687 9.4 6,129 15,769 9.4 8,505 1968 4,186 7.0 1,143 7,396 5.9 2,676 11,582 6.3 3,819 1969 to date 1,346 — -155 2,261 - - -277 3,607 -432
1968 - July 186 — «. 64 -588 -606 -402 _ _ -542 Aug. 238 - - 181 389 — — 366 627 547 Sept. 505 -38 1,133 348 1,638 - - 310
1969 - July -164 -266 -1,110 _ _ / -1,122 -1,274 -1,388 Aug. 95 — — 24 3 __ -15 98 -9 Sept. 300 -280 821 — — -120 1,121 - - -400 Sept.
Seasonally Ad lusted 1969 -
Apr. 160 3.0 — — 190 1.7 350 2.1 May 357 6.6 — — 498 4.5 — — 855 5.2 June 178 3.3 — — 491 4.4 __ 669 4.0 July -47 -0.9 — — -40 -0.4 -87 -0. 5 Aug. 191 3.6 4- — 275 2.5 466 2.8 Sept. j>/ 165 3.0 444 4.0 609 3.7
1 Annual growth.rate for monthly data is the annualized monthly percentage increase in deposits. 2 Net New Money is new deposits net of both withdrawals and interest. Data for S&Ls are for
insured associations only, which represent 96% of industry total resources. 3 Regular deposits at mutual savings banks exclude items such as Christmas club and certain
escrow accounts, which represent a very small part of total deposits. SOURCE: National Association of Mutual Savings Banks and Federal Home Loan Bank Board.
Digitized for FRASER http://fraser.stlouisfed.org/ Federal Reserve Bank of St. Louis
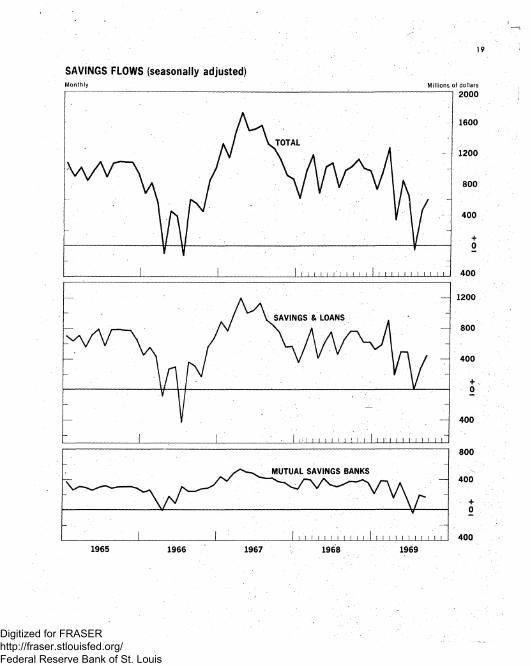
SAVINGS FLOWS (seasonally adjusted) Monthly
TOTAL
Millions of dollars
2000
1600
1200
800
400
— ' —
__ v\
/ V SAVINGS & LOANS
i r\ / —
1 1 ' • i i : " i i i ' i ' i i 1 i i i
800
400
400
800
400
400
MUTUAL SAVINGS BANKS
[ I l I l ll II 1 I I I l l 1 1 l l l l 1965 1966 1967 1968 1969
Digitized for FRASER http://fraser.stlouisfed.org/ Federal Reserve Bank of St. Louis

TABLE 11: Mortgage Commitments at Selected Thrift Institutions 1
OUTSTANDING COMMITMENTS NET CHANGE . ALL MUTUAL ALL MUTUAL
DATE TOTAL SAVINGS & .SAVINGS TOTAL SAVINGS & SAVINGS LOAN BANKS LOAN BANKS
ASSOCIATIONS (N.Y. STATE) ASSOCIATIONS (N.Y. STATE) (Billions of Dollars, Sea sonally Adjusted) 1/
1968 - Aug. 9.0 6.1 2.9 .16 .16 Sept. 9.1 6.2 2.9 .14 .10 .04 Oct. 9.5 6.4 3.0 .35 .22 .13 Nov. 9.7 6.5 3.2 .27 .10 .17 Dec. 9.7 6.6 3.1 -.01 .08 -.10
1969 - Jan. 9.9 6.7 3.2 .15 .08 .07 Feb. 10.1 6.9 3.2 .25 .22 .03 Mar. 10.3 l 7.0 3.3 .17 .09 , .08 Apr. 10.5 7.2 ' 3.3 .19 .18 .01 May 10.3 7.1 3.2 -.19 -.10 -.09 June 10.2 7.0 3.2 -.09 -.05 -.04 July 9.9 6.8 3.1 -.28 -.21 -.08 Aug.j>/ . 9.5 6.5 3.0 -.43 -.32 -.11
\ Based on data from Federal Home Loan Bank Board and Savings Banks Associations of New York. State. Data for savings banks and S&L's include a minor amount of non-residential commitments. S&L commitments include loans improcess. Net changes are derived directly from unrounded outstandings levels as reported and after seasonal adjustment by Federal Reserve. Subtotals may not add to totals because of rounding. ;
Digitized for FRASER http://fraser.stlouisfed.org/ Federal Reserve Bank of St. Louis

MORTGAGE COMMITMENTS OUTSTANDING (seasonally adjusted) Monthly . Billions of dollars
TOTAL
S&L'S
N.Y.-MSB'S
* Includes building loans beginning August 1967
1970 1964 1966 1968 1962 1960
Digitized for FRASER http://fraser.stlouisfed.org/ Federal Reserve Bank of St. Louis
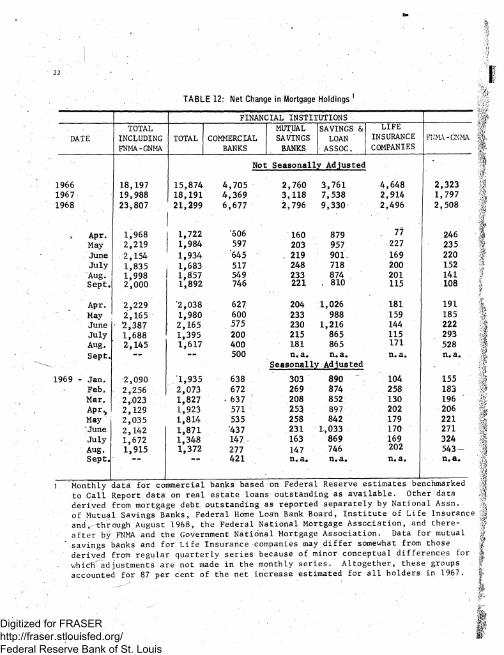
TABLE 12: Net Change in Mortgage Holdings 1
FINANCIAL INSTITUTIONS TOTAL MUTUAL SAVINGS & LIFE
DATE INCLUDING TOTAL COMMERCIAL SAVINGS LOAN ' INSURANCE FNMA-GNMA
FNMA-GNMA BANKS BANKS ASSOC. COMPANIES
Not Seasonally Adjusted
1966 18,197 15,874 4,705 2,760 3,761 4,648 2,323 1967 19,988 18,191 4,369 3,118 7,538 2,914 1,797 1968 23,807 21,299 6,677 2,796 9,330 2,496 2,508
Apr. 1,968 1,722 606 160 879 77 246 May 2,219 1,984 597 203 957 227 235 June 2,154 1,934 645 . 219 901. 169 220 July 1,835 1,683 517 248 718 200 152 Aug. 1,998 1,857 549 233 874 201 141 Sept. 2,000 1,892 746 221 . 810 115 108
Apr. 2,229 2,038 627 204 1,026 181 191 May 2,165 1,980 600 233 988 159 185 June • '2,387 2,165 575 230 1,216 144 222 July 1,688 1,395 200 215 865 115 293 Aug. 2,145 1,617 400 181 865 171 528 Sept. — — 500 n.a. n.a. n.a. n.a. Sept.
Seasonally Adjusted
1969 - Jan. 2,090 1,935 638 303 890 " 104 155 Feb. 2,256 2,073 672 269 874 258 183 Mar. 2,023 1,827 ? 637 ; 208 852 130 196 Apr., 2,129 1,923 571 253 897 202 206 May 2,035 1,814 535 258 842 179 221 June 2,142 1,871 '437 231 1,033 170 271 July 1,672 1,348 147. 163 869 169 324 Aug. 1,915 1,372 277 147 746 202 543-Sept. 421 n.a. n.a. n.a. n.a.
to Call Report data on real estate loans outstanding as available. Other data derived from mortgage debt outstanding as reported separately by National Assn. of Mutual Savings Banks, Federal Home Loan Bank Board, Institute of Life Insurance and, through August 1968, the Federal National Mortgage Association, and there-after by FNMA and the Government National Mortgage Association. Data for mutual savings banks and for Life Insurance companies may differ somewhat from those derived from regular quarterly series because of minor conceptual differences for xvhictf adjustments are not made in the monthly series. Altogether, these groups accounted for 87 per cent of the net increase estimated for all holders in 1967.
Digitized for FRASER http://fraser.stlouisfed.org/ Federal Reserve Bank of St. Louis

NET CHANGE IN MORTGAGE HOLDINGS (seasonally adjusted) Monthly Bill ions of dollars.
3.0
2.5 TOTAL, INCL FNMA - GNMA
2.6
FINANCIAL INSTITUTIONS 1.5
1966 1967 1968 1969
Digitized for FRASER http://fraser.stlouisfed.org/ Federal Reserve Bank of St. Louis

TABLE 13: Net Increases in Mrrtaaoe Debt Outstanding 1
Billions o f dollars, SAAR 2
1-to 4- MULTI- MULTI-AND QUARTER TOTAL RESIDENTIAL FAMILY FAMILY COMMERCIAL COMMERCIAL FARM
1965 - I 24.9 18.6 15.1 3.5 4.2 8.0 2.2 II 25.2 18.5 15.1 3.5 4.5 8.1 2.1 III 25.8 19.3 15.5 3.8 4.4 - 8.4 2.2 IV 26.6 19.6 15.8 3.8 4.6 7.9 2.4
1966 - I 28.3 19.0 14.7 4.3 6.9 11.6 2.4 II 24.2 15.6 12.1- 3.5 6.5 10.0 2.2 III 18.4 10.8 8.3 2.6 5.4 8.3 2.1 IV 15.6 .'9.5 7.2 2.3 4.3 6.2 1.7
1967 - I p 15.5 9.9 " " 6.8 3.0 3.8 7.3 1.8 H p 20.4 13.7 10.5 3.3 4.8 8.1 1.9 III ,26.3 19.1 15.3 3.8 4.8 8.8 2.4 IVp 28.6 20.9 16.5 4.4 5.1 8.8 2.6
1968 - IP 26.9 18.2 15.4 . 2.8 6.2 9.4 2.4 IIP 25.8 17.9 14.8 3.1 5.7 8.7 2.3 Hit 25.8 17 . 7 14.1 3.5 6.4 10.2 1.8 IVp 31.3 21.5 17.0 4.5 8.1 11.8 1.7
1969 - Ip 30.2 21.6 18.0 3.6 6,4 10.4 2.2 H P 28.4 20.7 16.5 4.2 5.3 9.4 2.4 I I I P 26.6 19.5 15.6 3.8 5.1 9.2 2.0
1 Derived from data on mortgage debt outstanding from Federal Deposit Insurance Corporation, Federal Home Loan Bank Board, Institute of Life Insurance, National Association of Mutual Savings Banks, Departments of Commerce and Agriculture, Federal National Mortgage Association, Federal Housing Administration, Veterans Administration and Comptroller of the Currency.
. Separation of non-farm mortgage debt by type, of property, where not available and interpolations and extrapolations, where required, estimated by Federal Home Loan Bank Board and the Federal Reserve.
2 Residential mortgage debt includes nonfarm only and is sum of 1-to 4-family, and multifamily mortgage debt combined.
Digitized for FRASER http://fraser.stlouisfed.org/ Federal Reserve Bank of St. Louis

NET INCREASES IN MORTGAGE DEBT OUTSTANDING Billions of dollars, seasonally adjusted annual rate Quarterly
TOTAL
TOTAL RESIDENTIAL
Z\
/ 1-4 FAMILY
COMMERCIAL
MULTIFAMILY
1969 1967
Digitized for FRASER http://fraser.stlouisfed.org/ Federal Reserve Bank of St. Louis

TABLE 14: FNMA Weekly "Auction" Results
COMMITMENTS IN.$ MILLIONS IMPLICIT'YIELD2(per cent) ACCEPTED
WEEK . TOTAL. TOTAL 90- 6- 1-YEARN 9.0- 6- 1-YEAR 1
ENDED OFFERED DAY M0NTH & OVER DAY MONTH & OVER
Sept. 2 252.5 150.5 22.9 94.8 32.9 8.33 8.34 8.21 8 242.7 152.4 29.0 98.7 24.6 8.34 8.36 8.22 15 241.8 144.8 33.4 81.7 29.7 8.36 8.40 8.24 22 247.5 145.1 38.1 72.6 34.3 8.40 8.44 8.27 29 257.7 144.2 45.5 ' 69.5 29.2 8.45 8.48 8.30
Oct. 6 251.0 147.4 41.1 66.0 40.3 8.50 8.52 8.34 13 217.7 145.7 48.6
' «, 5 0 , 1 46.9 8.54 8.59 8.39
20£ f
J 1;
(135.0)3/ -
Note: Under the FNMA auction system, approved sellers of Government-underwritten mortgages bid for FNMA forward purchase commitments, sub-ject to an over-all dollar limit announced by FNMA in advance. Bids accepted by FNMA are for delivery at the seller's option, and .at any time within the specified period. Bids on proposed homes relate to construction not yet started on which mortgages may be delivered only after completion and occupancy.
1 For "proposed construction" of new homes only.
2 Average secondary market yield after allowance for commitment fee and required purchase and holding of FNMA stock, assuming prepayment of 15 years for 30-year Government-underwritten mortgages. Yields shown are gross, before deduction of 50 basis points fee paid by investors to servicers.
3 FNMA announced limit of accepted bids for next week's auction. Digitized for FRASER http://fraser.stlouisfed.org/ Federal Reserve Bank of St. Louis

FN MA WEEKLY "AUCTION" RESULTS
AMOUNT OF ACCEPTED BIDS BY COMMITMENT PERIOD
1 YEAR AND OVER
3 MONTHS
Per cent
" IMPLICIT YIELD 6-MONTH COMMITMENTS
8.6
— 1 - 8.0
i i i i i 1 , 1 ' : ' i .i i i i i r i . i r .i
7.4
6.8 $ Millions
- I - 400
- • l \ r \ / v -
300
Z / \ TOTAL BIDS RECEIVED / \ As / V - 200
y - / \ j
1 I I 1 1 1 1
/ T O T A L BIDS ACCEPTED
1 1 ' 1 1 1 1 ! 1 1 1 1
100
0 JUNE AUG. OCT. DEC. FEB. APR.
1968
JUNE AUG.
1969 OCT- DEC.
Digitized for FRASER http://fraser.stlouisfed.org/ Federal Reserve Bank of St. Louis

TABLE 15: Private Housing Starts and Permits
DATE
STARTS
SEASONALLY ADJUSTED ANNUAL RATE
-TOTAL 1-FAMILY 2 OR MORE
UNADJUSTED
TOTAL TYPE OF FINANCING FHA VA I OTHER
BUILDING PERMITS (SEASONALLY ADJUSTED ANNUAL RATE) 2
1968 - Sept. Oct. Nov. Dec.
1969 - Jan. Feb. Mar. Apr. May June . July Aug. 2/ Sept .£/
1,592 1,570 1,733 1,509
1,878 1,686 1,584 1,563 1,509 1,469 ,371 ,383 1,518
944 965 905 922
1,066 975 828 797 883 808 765 720 837
648 605 828 585
812 711 756 766 626 661 606 663 681
134.3 140.8 127.1 96.4
101.5 90.0 131.9 159.0 155.5 147.3 125.2 124; 9 127.2
18.6 4.6 21.4 5.3 17.5 4.2 16.3 4.4
14.2 13.2 18.9 23.0 21.1 21.5 20.8 22.4 .17.9
3.8 3.5 3.9 4.4 4.3 4.6 4.7 4.2 4;8
111.1 114.0 105.4 75.7
83.5 73.3
109.1 131.6 130.1 121.2 99.7 98.3
104.5
1,393 1,378 1,425 1,463
1,403 1,477 1,421 1,502 1,323 1,340 1,228 1,245 1,181
Total starts are Census estimates including farm for both permit-issuing and nou-issuing areas. A dwelling unit is started when excavation begins; all units in an apartment structure are considered started at that time. FHA and VA starts are units started under commitments by these agencies to insure or guar-antee the mortgages. As reported by FHA and VA, a unit is started when a field office receives the first compliance inspection report, which is made before footings are poured in some cases but normally after the foundations have been completed. Other starts are derived as a residual, although total and FHA and VA starts are not strictly comparable in concept or timing; other starts in-clude both units financed by conventional mortgages and units without mortgages. Building permits before January 1963 are Census estimates for about 10,000 areas identified.as having a local building permit system in 1959. Estimates beginning January 1963 are for approximately 12,000 and beginning January 1967 13,000, or all known permit-issuing places. Unlike starts, seasonally adjusted building per-mits reflect direct adjustment for differences in the number of working days per month, as well as other differences in timing and coverage.
Digitized for FRASER http://fraser.stlouisfed.org/ Federal Reserve Bank of St. Louis

PRIVATE HOUSING STARTS AND PERMITS Monthly,annual rates Mill ions of units
SEASONALLY ADJUSTED 2.0
HOUSING STARTS 1.6
1.2
BUILDING PERMITS (in issuing areas) .
PER CENT OF UNADJUSTED TOTAL STARTS MULTI-FAMILY
GOVERNMENT UNDERWRITTEN
1963 1965 1969
Digitized for FRASER http://fraser.stlouisfed.org/ Federal Reserve Bank of St. Louis

TABLE 16: Mortgage and Bond Yields 1
FHA CONVEN- SPREAD BE- . NEW SPREAD BETWEEN MORTGAGES 2 TIONAL TWEEN YIELDS Aaa COR- YIELDS ON NEW
; DATE M0RT- , ON CONV. & PORATE CORPORATE BONDS 25-YEAR 30-YEAR GAGES FHA MORT- BONDS AND
3 GAGES 4 FHA MORTGAGES
1957 - High 5.63 n . a . 6.00 .47 4.94 1.58
1958 - Low 5.35 n.a. 5.55 .15 3.65 .88 1959-60 - High 6.26 n . a . 6.30 .23 . 5.25 1.69 1961-66 - Low 5.43 5.44 5.80 .25 4.41 .77 1966 - High 6.73 6.81 6.70 .30 5.82 1.16 1967 - High n. a . 6.81 6.65 .11 6.51 1.28
Low n. a. 6.29 6.40 -.12 5.18 .27 1968 - High n. a . 7.52 7.40 .12 6.79 1.20
Low n. a. 6.78 6.75 -.27 6.15 .26
1969 - Mar. n.a. 8.05 7.65 -.40 7.37 .68 Apr. n.a. 8.06 7.75 -.31 7.17 _ .89 May n. a. 8.06 7.75 -.31 7.22 .84 June n.a. 8.38 8.00; -.35 7.58 .77 July n. a. 8.36 8.10 -.26 7.63 .73 AUg. n.a. 8.36 8.20 -.16 7.65 .71 Sept. n.a. 8.40'" 8.25— -.15 7.98 .42
1 Neither mortgage nor bond yields include allowance for servicing costs which are much higher for mortgages than for bonds. Generally, bonds pay interest semi-annually; mortgages, monthly. Mortgage yields, if computed as equivalent to a semi-annual interest investment, would be slightly higher than given in the table. •, ...
2 Based on FHA-field-office opinions about average bid prices in the private secondary market for new-home mortgages for immediate delivery. Separate data available for 25-year and--beginning July 1961--30-year mortgages with minimum downpayments, weighted by probable volume of transactions. Yields computed by FHA, assuming prepayment period of 12 years for 25-year mortgages and 15 years for 30-year mortgages. Over the period for which they can be compared, the movement of the two mortgage yield series has been similar. Dashed lines indicate periods of adjustment to changes in contractual interest rates'. '
3 Based on FHA-field-office opinion on typical interest rates (rounded) on con-ventional first mortgages prevailing in the market areas of insuring office . cities. Beginning with April 1960, rate relates only to new-home mortgages; prior to that date, rate related to both new as well as existing-home mort-gages. Dashed line indicates this change in the series.
4 See note .for Table 1.
Digitized for FRASER http://fraser.stlouisfed.org/ Federal Reserve Bank of St. Louis

MORTGAGE AND BOND YIELDS Monthly
HOME MORTGAGES: CONVENTIONAL
FHA
Aaa CORPORATE BONDS: NEW ISSUES A / V /
Y I E L D S P R E A D (FHA MORTGAGE VS. NEW ISSUE Aaa CORPORATE BONDS) Basis points
~ 200
100
1962 1964 1968 1966 1970
Digitized for FRASER http://fraser.stlouisfed.org/ Federal Reserve Bank of St. Louis

32
TABLE 17: Conventional Mortgage Terms 1
NEW HOMES EXISTING HOMES CON- FEES & LOAN/ CON- FEES & LOAN/ TRACT CHARGES EFFEC- MATURITY PRICE LOAN TRACT CHARGES EFFEC- MATU- PRICE LOAN
DATE RATE (PER TIVE (YEARS) RATIO AMT. RATE (PER TIVE RITY RATIO AMI. (PER CENT) RATE (PER ($000) (PER CENT) RATE (YEARS) . (PER ($000: CENT) 2 3 CENT) CENT) 2 3 CENT)
($000:
li68
Aug. - 7.10 0.87 7.24 25.5 73.6 22.6 7.12 0.85 7.26 22.7 73.0 18.6 Sept. 7.10 0.87 7.24 25.5 74.2 22.1 7.11 0.82 7.25 22.6 72.6 18.3 Oct. 7.09 0.88 7.23 25.6 74.5 22.7 7.09 0.84 7.22 22.5 72.4 18.3 Nov. 7.07 0.84 7.21 25.4 74.1 22.5 . 7.07 0.82 7.21 22.7 72.9 18.9 Dec. 7.09 0.89 7.23 25.9 74.0 24.7 7.09 0.85 7.23 23.3 73.2 20.4
1969
Jan. 7.16 0.84 7.30 25.6 73.6 24.1 7.18 0.86 7.32 22.8 72.6 20.0 Feb. 7.26 0.81 7.39 25.6 ,73.3 23.5 7.28 0.86 7.42 22.9 72.8 19.6 Mar. . 7.32 0.93 7.47 25.8 *73.8 24.0 7.35 0.84 7.49 23.0 72.7 20.2 Apr. 7.47 0.96 7.62 25.4 72.6 24.8 7.46 0.85 7.60 23.0 71.8 19.9 May 7.50 0.88 7.65 25.8 73.2 25.0 7.54 0.83 7.68 22.7 7,1.9 19.7 June 7.62 0.84 7.76 25.6 73.0 24.9 7.64 0.86 7.79 22.8 71.4 20.1 July 7.76 0.92 7.91 25.5 72.0 24.5 7.79 0.91 7.94 22.8 71.7 20.1 Aug. 2/ 7.85 0.85 7.99 25.2 72.4 24.4 7.89 0.93 8.04 22.7 71.2 19.9
Compiled by Federal Home Loan Bank Board in cooperation with Federal Deposit Insurance Corporation. Data are weighted averages based on probability sample survey of charac-teristics of conventional first mortgages originated by major institutional lender
'groups (including mortgage companies) for purchase of single family homes. Data ex-clude loans for refinancing, reconditioning or modernization; construction loans to home-builders; and permanent loans which are coupled with construction loans to owner-builders. Related series on conventional mortgage rates only, based on unweighted opinions of field-office directors of the Federal Housing. Administration, are available somewhat sooner than the results of the FHLBB-FDIC survey, and are included-in Che case of new home mortgage rates--in Table 16.
Fees and charges--expressed as a percentage of the principal mortgage amount — include loan commissions, fees, discounts, and other charges which provide added income to the lender and are paid by the borrower. They exclude any closing costs related solely to transfer of property ownership.
Includes fees & charges amortized over a 10 year period in addition to the contract interest rate.
Digitized for FRASER http://fraser.stlouisfed.org/ Federal Reserve Bank of St. Louis

CONVENTIONAL MORTGAGE TERMS Monthly Years
MATURITY
NEW
EXISTING
20
LOAN/PRICE RATIO
NEW
EXISTING
70
65 1965 1967 1969 1963
* CHANGE IN SERIES
Digitized for FRASER http://fraser.stlouisfed.org/ Federal Reserve Bank of St. Louis