market power of middlemen final draft
TRANSCRIPT

Market Power
of Middlemen The Case of Quinoa in Bolivia
Tutor: Mats Lundahl
Examiner: Örjan Sjöberg
Discussant: Jian Kang
Presentation: May 27th 2011, 13:15
Location: Stockholm School of Economics
Abstract:
The role of middlemen has been much debated throughout the years. Some claim
them to be greedy exploiters of poor producers while others view them as facilitators
of trade. One key component for whether they have the ability to exploit producers is
the market power they possess. This thesis studies the competition among middlemen
in Bolivia in order to determine what market power they have. Additionally, the effects
of distance are studied to determine whether middlemen operating further away from
a marketplace have stronger market power. This is done through analysis of qualitative
data based on interviews on location in Bolivia with both producers and middlemen.
Producers located near the marketplace sell directly to it while those located further
out are dependent on middlemen. The market power of middlemen operating at the
more remote distances is however determined by the competition at the marketplace.
Due to specific characteristics of quinoa as well as a large increase in external demand
competition among middlemen is very high throughout Bolivia.
Keywords: Middlemen, market power, competition, distance, quinoa
David Risselborn*
Master’s Thesis
Stockholm School of Economics, Department of Economics

ii
Table of Contents
Abbreviations .......................................................................................................................................... iv
1. Introduction ......................................................................................................................................... 1
1.1 Introduction to Bolivia ................................................................................................................... 2
1.2 Quinoa ........................................................................................................................................... 3
1.3 Commercialization of quinoa ........................................................................................................ 4
1.4 Motivation of study area ............................................................................................................... 4
1.5 Research question and limitations ................................................................................................ 5
2. Methodology ....................................................................................................................................... 5
2.1 Research method .......................................................................................................................... 5
2.2 Primary data/interviews ................................................................................................................ 6
2.3 Selection of locations .................................................................................................................... 7
2.4 Potential weaknesses in the data gathered .................................................................................. 7
3. Competition among middlemen – a theoretical background ............................................................. 8
3.1 Perfect competition ....................................................................................................................... 9
3.2 Competition and producer welfare ............................................................................................... 9
3.3 Competition and distance ........................................................................................................... 10
4. Empirics ............................................................................................................................................. 12
4.1 Location and transportation ........................................................................................................ 12
4.1.1 Santuarío de Quillacas .......................................................................................................... 12
4.1.2 Colcha “K” ............................................................................................................................. 12
4.1.3 San Agustín ........................................................................................................................... 12
4.2 Marketing of quinoa .................................................................................................................... 14
4.2.1 The near village .................................................................................................................... 14
4.2.2 The middle village ................................................................................................................. 15
4.2.3 The remote village ................................................................................................................ 16
4.3 Number of middlemen ................................................................................................................ 17
4.4 General competition ................................................................................................................... 18
4.5 The role of producer associations ............................................................................................... 19
4.6 Competition at the marketplace ................................................................................................. 20
4.7 Development of prices and quantity ........................................................................................... 21
4.7.1 Prices .................................................................................................................................... 21
4.7.2 Production ............................................................................................................................ 22

iii
5. Analysis - Market power of middlemen on the Bolivian quinoa market .......................................... 23
5.1 Characteristics of quinoa ............................................................................................................. 23
5.2 Overall market power.................................................................................................................. 24
5.3 Competition at the marketplace ................................................................................................. 25
5.4 Competition near the marketplace ............................................................................................. 27
5.5 Competition at a medium distance from the marketplace ......................................................... 28
5.6 Competition at a long distance from the marketplace ............................................................... 29
6. Conclusion ......................................................................................................................................... 30
7. Reflections ......................................................................................................................................... 31
8. References ......................................................................................................................................... 32
8.1 Interviews .................................................................................................................................... 33
Appendix 1 – Full list of quinoa producing locations and variables ...................................................... 34
Appendix 2 – Interview guide for buyers and sellers ............................................................................ 35
Appendix 3 – Illustration of quinoa grains and plants........................................................................... 36

iv
Abbreviations
ANAPQUI – Asociación Nacional de Productores de Quinua
APQUISA – Asociación De Productores De Quinua, Salinas
ASPASA – Asociación De Productores Agropecuarios San Antonio
CECAOT – Central de Cooperativas Agropecuarias Operación Tierra
CEDEINKU – Centro de Desarrollo Integrado K'uichi
FAO – Food and Agriculture Organization
FAUTAPO – Fundacíon Apoyo a las Universidades de Tarija y Potosí
PRO-RURAL – Asociación Boliviana para el Desarollo Rural

1
1. Introduction
“Me encantan!” (I love them), was the answer from one consultant with much experience from
working with the rural poor of Bolivia upon being asked his opinion of middlemen. While he
recognized that there are some issues with middlemen he nonetheless believed their profits to be
small and their services to be more important than the risk for exploitation of producers. Not
everyone in Bolivia share this positive view. Another consultant, working with capacity building in the
far south of Bolivia, called middlemen “a mafia and necessary evil” that, if possible, should be
eliminated in favor of direct links between producers and markets. Not surprisingly, this is a view
shared by many producers as well. The Chief Executive of PRO-RURAL nuanced the picture by saying
that middlemen have an important role to play in a complicated marketing chain as producers are
too small and lack sufficient volumes to market their own quinoa. Obviously the picture of
middlemen is far from clear-cut.
Middlemen have a bad reputation all around the world and especially so in the marketing of
agricultural products in developing countries. Mainly by using their assumed monopsonistic position
and the low bargaining power of producers middlemen are thought to take advantage of producers
by offering them prices far below the market value (Pokhrel & Thapa, 2007). This has on a regular
basis led to calls from policymakers, NGOs and producers for the elimination of the middleman as he
is thought to be exploiting the poor producers through his behavior.
Several studies have over the years, however, found that the marketing margins of middlemen are
fair and not excessive once costs and alternative investments are taken into account. One recent
example is a study of Nepalese marketing of mandarins by Pokhrel and Thapa (2007) which failed to
find any support for middlemen exploiting producers. This has also been the conclusion of several
geographically diverse studies of agricultural markets (Scott, 1985; Enete, 2009; Hayami et al., 1999).
In a report on Bolivian potato farming Jones (1984) instead found that the role of middlemen had an
overall positive impact on producers and should be taken into consideration when policy for rural
development was made. If middlemen are indeed not exploiting producers they can be argued to
provide valuable services such as transportation of goods and market access that other actors are
either unable or unwilling to provide.
At the same time there are studies with conflicting results. Mérel, Sexton and Suzuki (2009) list a
number of studies that have found agricultural markets in developing countries to suffer from buying
firms with much bargaining power, collusion among traders and a lack of markets for producers.
Pokhrel and Thapa (2007) also refer to several studies that describe how middlemen cheat producers
through monopolistic behavior and by using information asymmetries regarding prices to their
advantage etc. Middleman monopsony power is suggested to come partly from the better access to
credit and information regarding prices and partly due to the distances, and thus transportation costs,
faced by many small producers (Flores et al. 1980, quoted in Scott, 1985). As noted by Osborne
(2005) imperfect competition among traders in Ethiopia led to excessive profit margins for traders
and lower prices paid to the producers.
It is thus difficult to generalize on the role of middlemen; evidence in some instances points to them
providing valuable services for rural communities without exploiting the producers whereas they in
other instances do take advantage of their position. Granted, variations exist among the producers

2
and markets that might help explain the different results from various studies. Fafchamps and Vargas
Hill (2005) found that producers facing great distances to the market and who only supply small
volumes of produce were more likely to sell their crops at the farmgates to middlemen than directly
at the market due to the high transportation costs involved. Being located further away from the
market could also reduce the availability of information regarding market prices which would
increase the risk of monopsonistic middlemen taking advantage of the producers. However, if
competition exists among the middlemen their market power would be reduced as producers would
have more possibilities of selling their crops and consequently reducing the risk of them being
exploited (Pokhrel & Thapa, 2007).
Using the Bolivian quinoa market as a case study this thesis will try to answer what the market power
of middlemen trading in quinoa is like and how this changes with distances. Is there less competition
among middlemen the further away from the market you get? And does this provide a possible
foundation for increased exploitation of the producers?
1.1 Introduction to Bolivia
Bolivia is one of the poorest countries in South America and the people living in the area called the
Altiplano (a highland plateau with altitudes around 4000 meters above sea level. constituting the
western part of Bolivia) are thought to be the poorest in the country (Deveaux et al., 2007). While
the production of quinoa (a type of grain, similar to rice) constitutes only a minor part of the total
agricultural production in Bolivia it is very important for the poor communities living on the Altiplano
as it is one of few crops that can be grown in the dry and barren environment of the Altiplano. More
than 60% of the population on the southern Altiplano make their living out of agricultural production
and another 25% are indirectly involved. It is estimated that some 80% of the 70 000 farm units in
Bolivia that produce quinoa are small scale producers with very limited economical resources and
consume a majority of the production (Rojas et al., 2004). According to Crespo et al. (2001) 15 000 of
all quinoa producers regularly contribute quinoa for sale in addition to amounts produced for on-
farm consumption but only 2000 produce quinoa mainly for sale and not consumption.
Most of the latter are found on the southern Altiplano where quinoa is the primary crop for
producers as opposed to in the northern part. It is further estimated that up to 85% of the income of
producers on the southern Altiplano derives from the production of quinoa, making it very important
to them given the high dependence on farming (Collao, 2001). Due to the distances and under-
developed infrastructure on the Altiplano quinoa transportation costs are almost twice as high as for
other parts of the country, and with many roads being impassable in the rainy season this has a
negative effect on the prices received by producers (Crespo et al., 2001). Bolivia is currently the
world’s largest producer of quinoa and the Bolivian government has also recognized it as an impor-
tant crop for the development of the country (Tapia, 2010). With increasing popularity, in Bolivia and
in the world, the demand for quinoa in the coming five years is expected to surpass the supply, which
will only increase the importance of the crop for the Bolivian producers (Soraides, 2008).
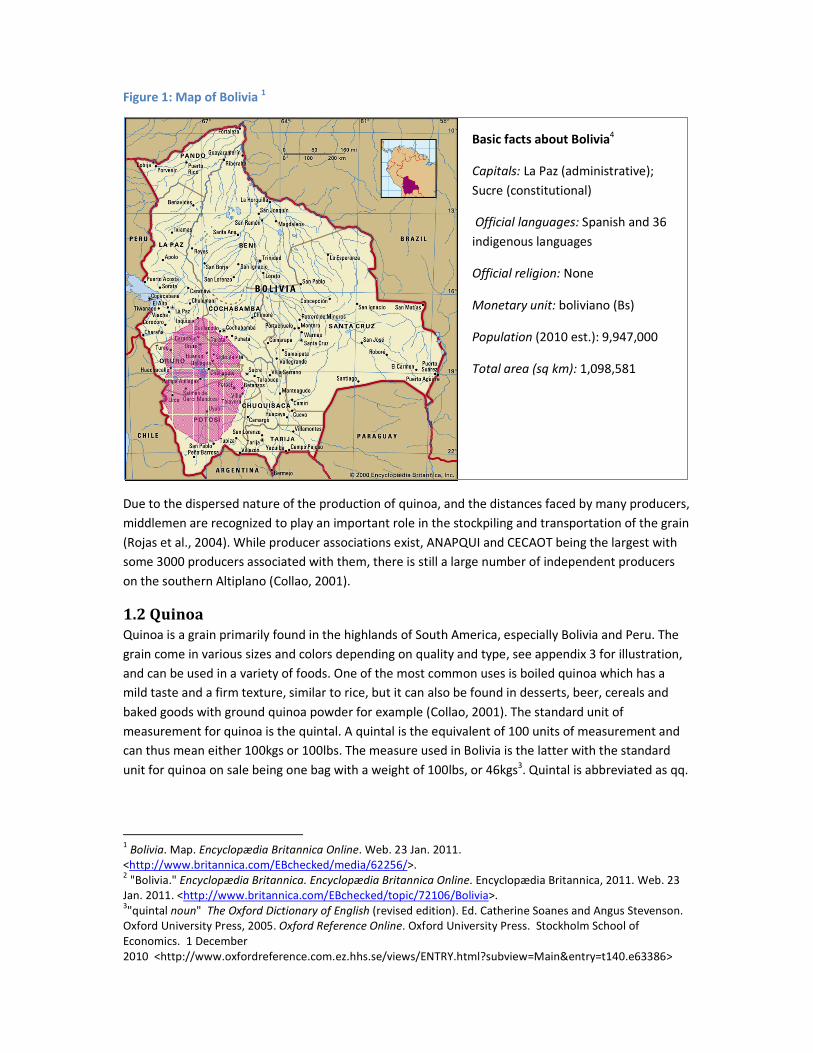
Figure 1: Map of Bolivia 12
Due to the dispersed nature of the production of quinoa, and the distances faced by many producers,
middlemen are recognized to play an important role in the stockpiling and transportation of the grain
(Rojas et al., 2004). While producer associations exist, ANAPQUI and CECAOT being the largest with
some 3000 producers associated with them, there is still a large number of independent producers
on the southern Altiplano (Collao, 2001).
1.2 Quinoa
Quinoa is a grain primarily found in the highlands of South America, especially Bolivia and Peru. The
grain come in various sizes and colors depending on quality and type, see appendix 3 for illustration,
and can be used in a variety of foods. One of the most common uses is boiled quinoa which has a
mild taste and a firm texture, similar to rice, but it can also be found in desserts, beer, cereals and
baked goods with ground quinoa powder for example (Collao, 2001). The standard unit of
measurement for quinoa is the quintal. A quintal is the equivalent of 100 units of measurement and
can thus mean either 100kgs or 100lbs. The measure used in Bolivia is the latter with the standard
unit for quinoa on sale being one bag with a weight of 100lbs, or 46kgs3. Quintal is abbreviated as qq.
1 Bolivia. Map. Encyclopædia Britannica Online. Web. 23 Jan. 2011.
<http://www.britannica.com/EBchecked/media/62256/>. 2 "Bolivia." Encyclopædia Britannica. Encyclopædia Britannica Online. Encyclopædia Britannica, 2011. Web. 23
Jan. 2011. <http://www.britannica.com/EBchecked/topic/72106/Bolivia>. 3"quintal noun" The Oxford Dictionary of English (revised edition). Ed. Catherine Soanes and Angus Stevenson.
Oxford University Press, 2005. Oxford Reference Online. Oxford University Press. Stockholm School of
Economics. 1 December
2010 <http://www.oxfordreference.com.ez.hhs.se/views/ENTRY.html?subview=Main&entry=t140.e63386>
Basic facts about Bolivia4
Capitals: La Paz (administrative);
Sucre (constitutional)
Official languages: Spanish and 36
indigenous languages
Official religion: None
Monetary unit: boliviano (Bs)
Population (2010 est.): 9,947,000
Total area (sq km): 1,098,581
4
While all quinoa grown on the southern Altiplano belong to the same type of quinoa, Quinoa Real, a
distinction is sometimes made by buyers between different classes depending on the size of the grain
and the purity of the quinoa. Most quinoa sold through middlemen is, however, of the highest grade
(Ofstehage, 2010).
1.3 Commercialization of quinoa
A majority of conventional (i.e. not organic) quinoa is sold at the weekly market in Challapata,
located in the middle of the southern Altiplano (Soraides, 2008). Organic quinoa, on the other hand,
is almost exclusively sold through the producer associations such as ANAPQUI or directly to exporting
companies. Soriano et al. (2006) in their study of the commercialization of quinoa identified several
different channels available to producers. Options range from small scale rural assemblers who act in
local communities to professional middlemen that process several truck loads per week to individual
producers selling directly at a market place. Other forms of commercialization include truckers who
simply bring the quinoa of groups of producers to the market as well as itinerant traders not
primarily involved in the quinoa trade (Ofstehage, 2010).
1.4 Motivation of study area
The choice of Bolivia and quinoa as a case study of the market power of middlemen and how this
changes with distance is based on several factors.
A first criterion for this kind of study is that middlemen play a significant role in the marketing of the
crop. The small scale production of quinoa in combination with limited economic resources provides
a possibly lucrative market for middlemen as the producers should have less opportunities to market
their crops themselves due to a lack of volume and/or means of transportation. This would thus
indicate that middlemen play an important role in marketing and are not simply acting as
supplements to other channels. The composition of quinoa producers is also very similar to that of
previous studies on middlemen and their behavior with, among other factors, many small scale
producers acting independently. Quinoa is also set to play an important role in the development of
the area which makes the results interesting for future policy and studies. The importance of the
crop should additionally make it easier to gather data as there is a large pool of producers to choose
from when gathering information. Finally, the prevalence of underdeveloped infrastructure provides
a suitable setting for investigating the effects of distance as this will likely have an impact on the
methods chosen by producers for selling their crops.
While Bolivia as a country is rather large the relevant area is on the contrary quite small. As described
above, the production, trading and commercialization of conventional quinoa is mainly focused on
the southern area and is specifically centered on the town of Challapata. This provides a clear hub
from which distances and trading patterns can be researched which is preferred over a market where
several centers of commercialization exists. With only one center through which a majority of the
crop passes it becomes easier to isolate the role of distance in the marketing as there are no
competing centers to discount for. Furthermore, the existence of various marketing channels, such as
direct selling, middlemen and producer organizations provides a competitive landscape with a wide
range of actors. Another basic criterion for this kind of study is the prevalence of competition in the
studied market which is why a large number of competing ways for commercialization increases the
likelihood of different levels of competition throughout the area. As these actors are also primarily

5
found in one area and not spread out over the whole country which will further facilitate interviews
and data gathering.
1.5 Research question and limitations
This thesis seeks to increase the empirical knowledge of the interaction between producers of
agricultural products and the middlemen who buy these products. The most frequent critique of
middlemen is their abuse of market power which leads to exploitation of producers through an
unfair distribution of economic surpluses. With a starting point in some theoretical models this study
will perform a case study of the Bolivian quinoa market in order to answer the following question:
What market power do middlemen hold, in the case of Bolivian quinoa, and how does it change with
distance?
Market power is here primarily taken to mean to what extent middlemen have the ability to set
prices according to their own preference as opposed to being determined by the market. Specifically,
the market power of middlemen will be measured by comparing the competition among middlemen
as the existence of competition is perhaps the clearest indicator of the prevailing market power.
Studying the market power at the various distances will also help to understand what the market
power of middlemen in Bolivia is as a whole through a bottom-up approach. This thesis will thus be
centered around the following set of sub-questions:
• What is the overall market power of middlemen in Bolivia?
• What is the competition like at the central marketplace?
• What is the competition like near the marketplace?
• What is the competition like at a medium distance from the marketplace?
• What is the competition like at a long distance from the marketplace?
2. Methodology
This study is based on data gathered from three different quinoa growing locations in Bolivia and
follows an inductive approach where the observed activities of middlemen and producers are
analyzed with the aid of the theoretical framework presented.
2.1 Research method
Given the lack of quantitative data available for Bolivia in general, and the quinoa market in
particular, this thesis is mainly founded on qualitative data obtained through interviews and surveys
with relevant sources. Where ever possible, quantitative data have been obtained but given available
resources and time for the thesis, as well as the scope, this is rather brief in nature and only serves to
paint a broader picture. Qualitative information was gathered on location in Bolivia during eight
weeks in October and November of 2010. Primary data from these interviews are complemented by
secondary data from previously published reports and studies, mostly from local organizations and
NGOs. A thorough literature review of the workings of middlemen in other markets was carried out
before departure in order to gain familiarity with the subject.
6
2.2 Primary data/interviews
Initial interviews were held with representatives of organizations that have a comprehensive
knowledge of the situation in the Bolivian Altiplano and the farming communities there to provide a
general background. For the macro-perspective of agricultural production in Bolivia, PRO-RURAL, a
local organization working for the development of rural Bolivia through financing of local mid-sized
businesses, was approached. This organization was also the commissioner of one of the most recent
reports on the quinoa market. In its role as financer for mid-sized businesses it provided information
on the current marketing process of quinoa but also on the business climate for the export
businesses which all tend to be of larger size. Another useful resource was FAUTAPO, an
organization present in large parts of Bolivia doing development work mainly through education. One
of their most recent programs is focused on increasing the production and productivity of quinoa.
This organization provided access to local sources and information about the micro-level situation of
the quinoa market. To complement this, ANAPQUI, the largest producer organization for quinoa
growers was approached to provide details on the situation for small-scale and individual producers.
It has been shown that the presence of producer organizations usually has an impact on the
competition among other middlemen in a market and it will thus be interesting to see what role they
play in the Bolivian quinoa marketing. While other producer organizations exist in Bolivia, due to its
size and importance ANAPQUI is taken to be representative of all of them. Furthermore, the director
of the private consultancy Desarollo Económico Rural, who is the author of a recent report
investigating the marketing practices of quinoa in Bolivia, was hence able to provide valuable details
on this topic.
Most primary data were however gathered from the producers of quinoa, the sellers, and the
middlemen buying it. In total, 20 producers of quinoa were interviewed in their respective villages as
well as 10 producers who visited the central marketplace. Using data from both buyers and sellers
allows for triangulation of the obtained data, comparing answers from both sides to construct a more
holistic picture of the competition in the market for middlemen. Due to the itinerant nature of rural
buyers of quinoa the majority of interviews with buyers were conducted in Challapata, the main
market for the quinoa trade in Bolivia. A total of 25 buyers were interviewed. While not all buyers
operate out of this marketplace a reasonable number of them do and the objective was to gain an
understanding of the purchasing behavior of buyers as well as their perception of competition in the
market. As there might however be a risk of bias in the answers of the middlemen, due to their
potentially non-competitive behavior, the emphasis was put on the data gathered through interviews
with the producers of quinoa.
For the initial and general interviews, open ended questions were used so as not to lead the
interviewees too much while giving the interviews a semi-structured approach. Interviews at the
market in Challapata as well as in the villages followed a structured interview guide to provide cross-
examination possibilities and coherent answers from different locations. While the aim has not been
to obtain a statistically significant number of responses, a handful of respondents in each location
should provide sufficient data to draw conclusions on purchasing behavior and competition among
middlemen. The main focus of these questions was on the number of buyers available at each
location, alternative selling channels, ease of doing business and perceived competition/bargaining
power among buyers from the sellers’ perspective. (For the complete interview guide, see appendix
2.) Respondents were chosen at random to avoid biases in the collected data and to provide a
representative sample of producers. As it can be hypothesized that larger producers, as measured by

7
their landholdings, are more likely to have their own means of transportation or established
relationships with buyers the respondents of the survey include producers of varying sizes for each
location.
2.3 Selection of locations
In a study of transportation costs and crop choices in Kenya, Omamu (1998) divided his sample into
three categories, one at a short distance from the market, one at a medium distance and one at a
long distance from the market as measured in distance. This study follows a similar approach with
respondents in three different locations, using Challapata as the geographical center since a majority
of the quinoa sold through middlemen pass through there. The selection of locations is made
through a combination of distance measures and characteristics of the local communities. Using data
from a comprehensive report on the situation among quinoa growers on the southern Altiplano
(FAUTAPO, 2009) eleven quinoa producing regions were identified and graphically plotted onto the
map presented on page 13. Using the plotted map each location was assigned to either of the three
distance categories.
In order to attempt to isolate distance as the main difference between the locations a set of
comparables were created to reduce the eleven potential locations to the desired three, (see
appendix 1 for a full list of locations and variables). It is assumed that the two most important criteria
for middlemen who travel around in search of quinoa is the volume available for sale in a given area
and how easily this volume can be gathered.
Table 1: Selection of locations
Location Production /
producer
(qq)
HA/family Production,
estimated
(qq)
Proportion
for sale (%)
Producers as
members of
associations
Quinoa
producers /
population
Santuarío de
Quillacas
36 3,30 57586 94% 21% 27%
Colcha "K" 35 2,66 81468 92% 11% 19%
San Agustín 28 2,19 12369 90% N/A 19%
Source: FAUTAPO (2009), compiled by author
Available volume is a function of the land per family growing quinoa, total production in the area and
production per producer (quintals produced per year). The ease of buying is based on the proportion
of produced quinoa that is available for sale, the prevalence of competing buyers in the form of
producer cooperatives and/or associations and the density of producers as a share of the whole
population in the area.
While areas such as Salinas García Mendoza and Llica produce large quantities of quinoa there is also
a risk that they attract more attention from middlemen due to their reputation as high-producing
areas, making them outliers. This in conjunction with the relatively higher presence of producer
associations such as ANAPQUI and APQUISA makes them less suitable for a comparison with other
areas despite other similarities.
2.4 Potential weaknesses in the data gathered
As in other developing countries, prices and markets in Bolivia are subject to rapid change.
Information can also be somewhat unreliable, including previous studies as many have lacked the

8
scientific stringency of published articles. In order to compensate for this and to verify the accuracy
great care has been taken to cross-reference the information with that of other studies when
possible. Another potential source of inconsistency is the selection of locations. These have been
chosen based on the methodology described above in order to reduce the importance of other
factors. It can, however, not be guaranteed that other factors than those selected, although the most
likely, guide the decisions of middlemen of where to go. Factors such as existing relationships with
producers in the area, quality of the quinoa or total volume available could potentially have an
impact on the choices made by middlemen. It is however not the purpose of this thesis to investigate
the reasons for why middlemen visit villages. The selection of locations has also been made on a
municipal level while, due to time constraints, only the main village of each chosen location could be
visited. This could potentially open for inconsistency between individual villages in the municipality.
While the results thus cannot with certainty be said to apply to all locations no indication has been
found that great differences would exist.
While the sample size from each location is not sufficient to statistically test the statements of
respondents it should be adequate enough to eliminate individual opinions and/or knowledge. This
can also be noticed in the, surprisingly, high consistency among answers received in all locations. As
the respondents represent both small and large producers in all locations, which would arguably be
the single largest source of different marketing behavior, this ought not to be a problem of any
greater concern.
3. Competition among middlemen – a theoretical background
According to The Oxford Dictionary of English a middleman is “a person who buys goods from
producers and sells them to retailers or consumers”4. The term middlemen and/or middleman will in
this thesis thus refer to the actors buying quinoa from the producers for resale to either other
middlemen and/or consumers. The primary focus of this thesis is on the actors closest to the
producers, the ones buying at the farmgates, but middlemen acting further up the supply chain will,
to some extent, also be analyzed.
Venkataraman (1971) notes that there are several hypotheses that can be set up and tested in order
to determine market competition, integration and efficiency. One such hypothesis is that the larger
the amount of traders competing for a market share is, the higher competition will be. The size and
number of buyers thus becomes important in order to determine competition although size can, he
also notes, be difficult to establish. A second, and more common method, is to study the margins
prevailing between different stages of the marketing chain. If the price difference between stages of
the marketing is not significantly different from the costs associated with merchandising and
transporting the good it would support the hypothesis that integration is good and competition on
the market is high (Venkataraman, 1971). While this thesis will utilize both methods, emphasis will be
4 "middleman noun" The Oxford Dictionary of English (revised edition). Ed. Catherine Soanes and Angus
Stevenson. Oxford University Press, 2005. Oxford Reference Online. Oxford University Press. Stockholm School
of Economics. 1 December
2010 <http://www.oxfordreference.com.ez.hhs.se/views/ENTRY.html?subview=Main&entry=t140.e48353>

9
put on the first one as such information can be more easily obtained as it should be more well-known
to producers than prices and margins.
3.1 Perfect competition
While often described as a theoretical situation rarely seen in real life, perfect competition still
makes a good foundation for analyzing the competition in a market. For a market to display perfect
competition the following four conditions need to be fulfilled: (1) Both buyers and sellers need to be
price takers. The proportion of the total output handled by each buyer and seller is so small that they
have no impact on the price. (2) Products also have to be homogeneous, thus making price the main
determinant for a purchase. A single market price thus exist and any deviation from this will lose all
sales, or in the case of buyers, all possibility to buy. (3) Buyers need to be able to freely enter and exit
markets depending on whether they can make a profit or not. (4) Full information regarding prices
and quality has to be available to buyers and sellers (Pindyck & Rubinfeld, 1997).
Pindyck and Rubinfeld (1997) also note that although perfect competition usually exists in markets
with many sellers/buyers it may also exist in markets with fewer actors under certain conditions. One
such condition is a very elastic demand for the product, making the demand curve almost flat. Firms
may also act as if there is high competition despite low numbers of actors as they may want to
prevent entry of other firms, something that would drive prices towards the competitive equilibrium.
Furthermore they also note that agricultural markets are one of few examples where this kind of
competition has been found.
3.2 Competition and producer welfare
As mentioned in the introduction, imperfect competition among middlemen has been shown to lead
to lower prices for producers as well as excessive profit margins for the middlemen in some cases
(Osborne, 2005). According to Lundahl (1979) the monopsonistic or oligopolistic behavior of
middlemen who control the marketing of agricultural products in developing countries is “a frequent
and often powerful explanation of peasant poverty”. This monopsonistic or oligopolistic power of
middlemen stems from a situation where producers face too few buyers for their crops and are thus
forced to accept the price offered by the buyer, or not sell at all. In some cases this has led to the
existence of so called “missing markets” where producers opt for subsistence farming instead of
participation in the market (Caballero, 1982; Lopez and You, 1993).
The amount of traders in a market is an indicator of the amount of competition, with more traders
leading to higher levels of competition (Venkataraman, 1971; Barrett, 1997). It is nevertheless
important to keep in mind that there may still exist collusion among the traders, even if there are
large numbers of them (Mérel, Sexton & Suzuki, 2009). In their study of marketing of raw cashew
nuts in Mozambique, McMillan et al. (2002) demonstrate how the amount of traders affects the price
pass-through to producers under imperfect competition. The following section is based on their work.
Assuming a marketing chain with three stages (for example rural assemblers, wholesalers and
exporters) and the associated prices p1, p2 and p3, the share of the border price received at the
farmgate can be expressed by the following equation:
��
�∗�1 − ��= �
�ε
1 + ��
ε
1 + �
�ε
1 + �ε�
10
With �∗�1 − �� being the exogenous border price received after tax, n the amount of traders in each
stage and ε the price elasticity of supply. Assuming that sellers behave competitively while buyers
have monopsony power, producers in the first stage supply Q=Q�p1� and are faced with n1 rural
assemblers who decide the price p1. In the next step the rural assemblers face the wholesalers and
the process is repeated in the same way.
This expression shows us several important things:
The costs of imperfect competition are multiplied when there are several stages that act
independently of each other, what is termed the double-marginalization effect.
Also, as the number of traders increases towards infinity in each step the price pass-through
increases as well, leading to �∗�1 − �� = ��. Increasing competition in just one step does however
not lead to significant increases in the price pass-through to producers. Even if there are thousands
of rural assemblers and wholesalers but only a few exporters, producers will not receive more than a
minor portion of the price. Likewise, if there is only one trader at the farmgate, producers won’t
receive more than 20% of the border price5. McMillan et al. note that the number of traders that is
most important to determine producer welfare is the number of traders the producer has access to,
not the total amount in the whole country.
Finally, McMillan et al. concludes that the number of traders available to producers is “intricately tied
to the welfare of the farmer”. One major factor affecting the number of traders available to a
particular producer is however the transportation costs faced by traders. Natural oligopsony or
monopsony can be created when there are significant costs in marketing due to geographically vast
markets. Studying rice producers in Madagascar, it was found that the number of producers having
access to just one trader was five times as high in the areas that had poor infrastructure compared to
areas with better infrastructure (Barrett, 2008).
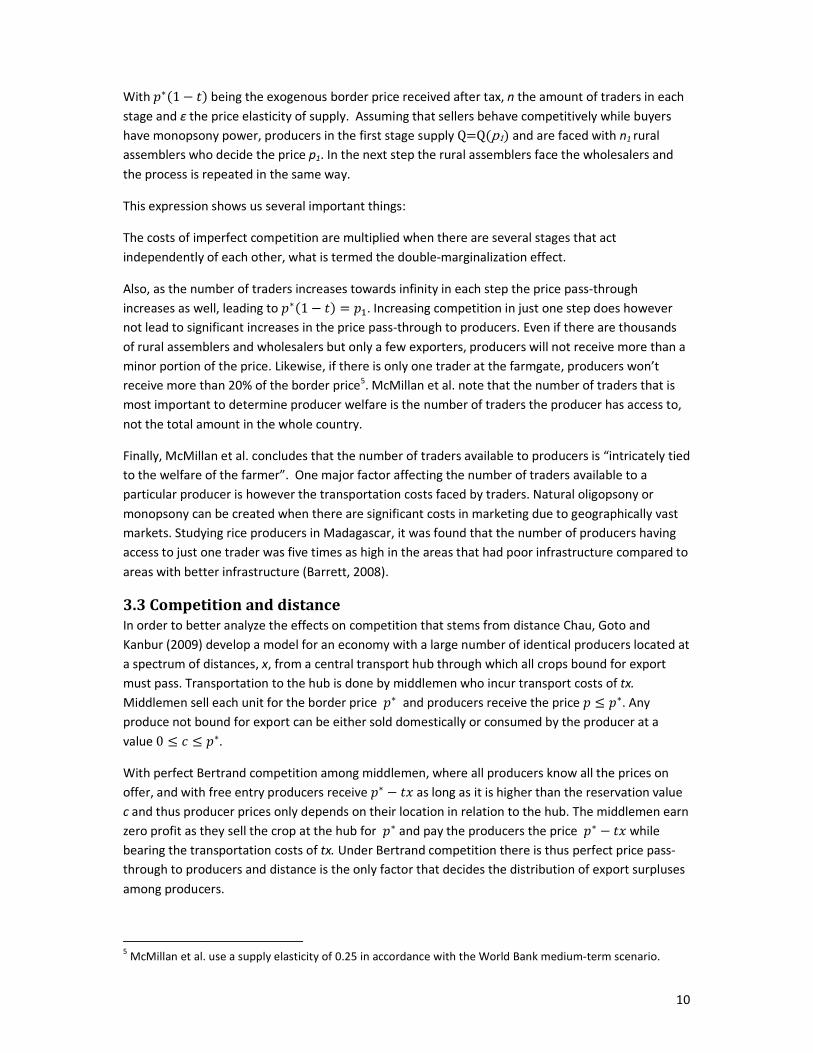
3.3 Competition and distance
In order to better analyze the effects on competition that stems from distance Chau, Goto and
Kanbur (2009) develop a model for an economy with a large number of identical producers located at
a spectrum of distances, x, from a central transport hub through which all crops bound for export
must pass. Transportation to the hub is done by middlemen who incur transport costs of tx.
Middlemen sell each unit for the border price �∗ and producers receive the price � ≤ �∗. Any
produce not bound for export can be either sold domestically or consumed by the producer at a
value 0 ≤ � ≤ �∗.
With perfect Bertrand competition among middlemen, where all producers know all the prices on
offer, and with free entry producers receive �∗ − �� as long as it is higher than the reservation value
c and thus producer prices only depends on their location in relation to the hub. The middlemen earn
zero profit as they sell the crop at the hub for �∗ and pay the producers the price �∗ − �� while
bearing the transportation costs of tx. Under Bertrand competition there is thus perfect price pass-
through to producers and distance is the only factor that decides the distribution of export surpluses
among producers.
5 McMillan et al. use a supply elasticity of 0.25 in accordance with the World Bank medium-term scenario.

11
For all locations located at a distance greater than � = ��∗ − ��/� the border price received by
middlemen is insufficient to cover the cost of transportation and producers located here will thus sell
their crops domestically or consume it at value c.
Next, Chau et al. consider a more realistic situation where there is no longer perfect Bertrand
competition but where buyers can take advantage of sellers’ incomplete knowledge of the prices on
offer6. Middlemen offer a price to the producer and the producer ranks the prices on offer and
chooses the highest one available. Middlemen’s earnings, �∗ − �� − �, are thus dependent on the
price p offered to producers and the probability of the bid being accepted as the highest in
competition with other bids. For a given location with a concentration of middlemen, λ� = M�/N
where M� is the number of middlemen at distance x and N the number of producers, the probability
of striking a match will be higher the fewer competing offers there are. As the number of middlemen
in an area increases the price offered to producers will get closer to �∗ − �� while the lower the
number of middlemen, the closer to the reservation value c the price will get, reducing the
middlemen’s market power.
The market power of middlemen, λ�, is a function of the profit they can make and the fixed cost for
visiting each producer, K:
λ� =M�
N= max {ln
�∗ − �� − �
!, 0}
From this expression we can see that an increase in the border price will lead to higher competition
while market power decreases with an increase in distance as this incurs higher costs for the
middlemen. With free entry, ! = 0, it can be shown that middleman market power disappears and
the Bertrand outcome is reached. With entry costs being positive however, the area served by
middlemen will be smaller than under Bertrand competition and will lead to some producers not
being served.
Chau et al. thus show that middleman market power depends on location and that this decides the
concentration, or number, of middlemen present at each location. This model predicts that the areas
closest to the hub will be served exclusively by middlemen, areas outside of the profitable range of
middlemen will be served by non-profits and the areas in-between will be served by a mix of the two.
Producers located at more remote locations, but that are still served by middlemen, risk receiving an
unequally small share of the surplus due to the stronger market power of middlemen in such
locations.
6 See Chau, Goto and Kanbur (2009) for full evidence.

12
4. Empirics
The following paragraphs give a brief, general, description of the studied locations in order to put the
gathered data into context. Each location was selected according to the process described in the
method chapter and visited during the early planting season in October and November which is a
time when producers are accessible for interviews in the villages. Throughout the thesis the central
marketplace of Challapata will be referred to as “the marketplace”.
All three locations are located near the salt flats of southern Bolivia and share the same climatic
conditions, mainly dry and dusty, even though there exist some variations in the types of quinoa
grown. While differences in quality should be taken into account when analyzing the purchasing
behavior of middlemen the main distinction made is usually whether the quinoa is conventional or
organic. As most organic quinoa is sold directly to producer cooperatives or large processing
companies this, however, constitutes only a minor part of the quinoa traded by local middlemen and
is not directly relevant for this study.
4.1 Location and transportation
4.1.1 Santuarío de Quillacas
The village of Santuarío de Quillacas is located about two hours by either bus or pickup truck from
the marketplace with a population of close to 2500 inhabitants (FAUTAPO, 2009). A paved road is
currently under construction, reaching about halfway to the village as measured from the
marketplace. This will be extended to the communities located west of Quillacas in the near future,
replacing the current dirt road. Due to this position on the main road to the other communities
Quillacas sees a lot of through traffic and several buses and/or trucks passes every day as well as a
reasonably large amount of private vehicles willing to provide transportation. As in all the other
studied areas the production of quinoa is of great importance to the local economy. Throughout the
thesis this location will be referred to as the “near village”.
4.1.2 Colcha “K”
Located on the northern shores of the Uyuni salt flats, Colcha “K” is only connected to the main road
heading north towards the marketplace by a rough dirt road that partially runs through the salt flat.
In the dry season the journey to Uyuni, which is the nearest market place of importance, takes about
two to four hours. Travel times in the wet season are substantially longer as the salt flat is then
covered by water, reducing speeds. From Uyuni it is another six to seven hours to the marketplace.
Buses run once a day every second day to Colcha “K” from Uyuni and private transportation is scarce
with the occasional vehicle passing/leaving. The road continues to other communities but given their
increasing remoteness transportation options are few although not non-existent. Colcha “K” will be
referred to as the “middle village”.
4.1.3 San Agustín
At a distance of more than five hours from Uyuni, with an additional six or seven to the marketplace,
San Agustín is located the furthest away of the three studied locations. In terms of transportation
this is by far the most remotely located location of the three with only one bus per week reaching the
village, leaving on Wednesdays and returning on Fridays. Located at the end of the road in a hilly
area San Agustín sees little other traffic than that destined for the village, limiting transportation

Figure 2: Graphical illustration of quinoa producing areas in southern Bolivia
alternatives. Occasional vehicles leave for a nearby village, one hour away, from where it is possible
to find onward transportation but this is a cumbersome and time-consuming venture, especially
without prior arrangements. Throughout this thesis San Agustín will be referred to as the “remote
village”.
2
4
5 7
9
10
1
8
6
3
11
11
Area visited by middlemen from Challapata
Challapata
Santiago de Huari
Santuarío de Quillacas
Pampas Aullagas
Colcha “K”
San Pedro de Quemes
San Agustín
San Pablo de Lipez
Salinas de Garci Mendoza
Tahua
Uyuni
Llica
1
2
3 7
6
5
4 8
9
10
10
11

14
4.2 Marketing of quinoa
4.2.1 The near village
Irrespective of location a quinoa producer has the choice to either sell directly at the marketplace,
sell through a middleman, or directly to an end consumer such as a company, producer association
or individual consumer. While two of the latter might be considered middlemen as well this thesis
focuses on the middlemen who are acting between these actors and the producers. The data shows
that marketing practices of quinoa producers in the three locations are distinctly different.
Producers in the near village, located a short distance from the marketplace, with few exceptions
bring their quinoa directly to the weekly market where they sell to small scale buyers in the street.
None of the interviewed producers found it neither difficult nor expensive to sell directly at the
marketplace and cited the readily available transportation options as a main contributing factor.
While some producers own their own vehicles, mainly small pick-up trucks, others pay passing trucks
or buses for taking their loads. At the time of research the going rate for transportation per quintal
ranged from Bs. 5 to 10, or 1-2% of the price paid per quintal of quinoa at the marketplace. Small
producers, selling smaller volumes, also reported utilizing public transportation and thus only paying
for the passage and not a transportation fee per sack.
Middlemen visit the near village every few weeks, wishing to buy quinoa, and while most producers
sell the majority of their crops directly at the marketplace they have no reservations against selling it
to middlemen in the village. This is stated to be due to the fact that prices offered in the village are
the same or just slightly lower than the ones offered at the marketplace, the difference roughly being
equivalent to the transportation costs. All producers interviewed were well aware of the current
prices at the marketplace and several also exhibited a good understanding of how the marketing
mechanisms work. Information regarding current prices is obtained either through phone or by
Table 2: Data gathered from quinoa producers in southern Bolivia
Location Ha./
prod.
Always sells to
the same buyer
Aware of
marketplace price
Normal place of
sale
Transportation
cost Bs./ quintal
(mode)
Near village 10 No Yes Marketplace
Near village 6 No Yes Marketplace 5 (truck)
Near village 2 No Yes Marketplace Own truck
Near village 2 No Yes Marketplace 5 (truck)
Near village 1 No Yes Marketplace 5-10 (truck)
Near village 1 No Yes Marketplace 3 (bus)
Near village 1 No Yes Marketplace 3 (bus)
Middle village 10 No No Village -
Middle village 8 No Yes Village -
Middle village 8 No No Village -
Middle village 5 No Yes Village 5 (truck)
Middle village 4 No No Village -
Middle village 2 No No Village -
Middle village 2 No No Village -
Middle village 2 No No Village -
Remote village 8 No No Village -
Remote village 5 No No Village -
Remote village 5 No No Village -
Remote village 2 No No Village Own truck
Remote village 2 No No Village -

15
talking to other producers and/or villagers who recently visited the marketplace. While several
producers expressed a desire to sell directly to consumers there were no direct accusations of
middlemen taking advantage of their position. Or, as one producer put it, “it is easy to sell but harder
to get a good price”. Producers sell smaller quantities for necessity throughout the year in order to
buy other products such as rice, sugar and foods etc. but there exists no distinguishable difference in
the marketing behavior of such sales as compared to sales for commercialization.
While there is a local producer cooperative it currently only coordinates the occasional joint
transportation of quinoa but does not provide any other services. The main objective of the
cooperative instead is related to infrastructural projects such as irrigation systems and the building of
a local processing plant for cleaning and sorting the quinoa. This is hoped to increase the prices
received as this is currently done by the buyers at the marketplace and/or directly by the processing
companies.
Marketing of quinoa in the near village through middlemen is highly dependent on the availability of
visiting middlemen. Producers are indifferent between selling through middlemen or directly at the
marketplace and will sell to the former as long as prices are corresponding to what they could
receive at the marketplace.
4.2.2 The middle village
While producers located near the marketplace sell their crops directly to the actors there this option
is not as readily available to producers in the middle village. The predominant method of selling the
crops, irrespective of size of the producer, is instead through sales at the farm gate to middlemen.
These middlemen come every few weeks with a truck as part of a tour of the area, in addition to
buying quinoa they also sell staple goods and other supplies. It is important to note that not all
middlemen act through the marketplace but that some sell directly to companies in La Paz and Oruro
for example, there are however no indications that their behavior would be any different than for
other middlemen. Given the infrequency of these visits and the lack of goods for sale in the village,
producers sometimes find themselves forced to visit Uyuni, the nearest town, for stocking up on
supplies. While the market for quinoa is limited in Uyuni with mainly one buyer, the processing
company Real Andina, producers view this as an alternative should the need be too great. As
described above, transportation options exist but are significantly more expensive than in the near
P
R
O
D
U
C
E
R
S
MIDDLEMEN
M
A
R
K
E
T
L
O
C
A
L
ASSOCIATIONS EXPORT MARKETS
MIDDLEMEN
Figure 3: Options available for producers to market quinoa

16
village as both buses and private vehicles charge Bs. 20, or four times as much, for transportation to
the nearest market.
The awareness of prices is considerably lower in the middle village as producers rarely visit the
marketplace themselves and primarily receive price information from the middlemen. Cell-phone
coverage is scarce and limits the possibilities for communicating with buyers at the market.
Producers claim that prices paid in the village would be around Bs. 50 lower than at the market but
these claims remain un-substantiated due to a lack of recent sales to compare with. Prices also tend
to fluctuate more in and around the period before the planting season as stockpiles are unloaded
onto the market (Soriano, 2010) further making it difficult to compare. The prices paid by middlemen
are however the same as non-members receive if selling to the local cooperative, CECAOT.
Membership in producer organizations such as CECAOT is, however, very low in the region, barely
reaching 10% according to data from FAUTAPO (2009), but the number varies within different
communities in the region.
Producers located at a medium distance thus sell the majority of their produce to middlemen directly
in the village, not by visiting a market themselves. This is supported by spot-checks in nearby villages
where similar behavior was identified. Interesting to note is however that producers in a village
located near the main road, about one hour from the middle village in the direction of the
marketplace, reported occasional selling at the marketplace.
Table 3: Share of producers in a community that are part of an association
Santiago de
Huari
Pampa
Aullagas
Salinas de
Garcia
Mendoza
Uyuni San Pedro de
Quemes
San Pablo de Lipez
5% 10% 54% 33% N/A 60%
Santuarío de
Quillacas
Tahua Llica Colcha "K" San Agustín
21% 9% 58% 11% N/A
Source: FAUTAPO, 2009
4.2.3 The remote village
As can be seen from table 3 membership in an association is higher for the locations further away
from the market place such as Llica and San Pablo de Lipez. This corresponds very well to the
situation in the remote village where the president of CEDEINKU, the local producer association
affiliated with ANAPQUI, estimates that a full 80% of the quinoa sold by local producers is sold
through her organization. As with all producer cooperatives it offers a fixed price of Bs. 700 per
quintal, independent of the season of the year, to their members. Non-members are, however,
welcome to sell to the association as well – as long as they meet the requirements regarding quality
and adhere to the norms regulating the use of pesticides.
The remaining 20% is sold to visiting middlemen but the frequency of these visits is far lower than for
the locations closer to the market. Only every second month middlemen make the detour to the
remote village, despite claim of the producers that the quality of their quinoa is higher than in other
regions. Many of the sales to the middlemen are, however, necessity sales since the middlemen also
provide one of the few channels for goods coming in to the village. While some producers bring their

17
quinoa to be sold in a nearby village, located near the main road to Chile, the situation there is
similar to the remote village with a majority being sold to the associations. Similarly to the other
locations, producers in the remote village do not find it particularly difficult to sell their quinoa, or as
one producer explained: “Selling is not difficult, but getting a good price is.” While no exact numbers
exist on the difference in price paid by the middlemen who visit the remote village producers believe
the difference to be less than Bs. 100 per quintal. This has, however, not been verified. A local
consultant working with capacity building for quinoa producers confirmed that the situation in the
remote village is typical for most of the communities in southern Bolivia – most of the quinoa is sold
through associations and the rest to visiting middlemen. Interesting to note is that the consultant’s
image of the middleman as “a necessary evil” was not shared by the president of CEDEINKU. As
noted by Ofstehage (2010) in a study of the communities in the remote village, middlemen not only
act as buyers of quinoa but also as providers of banking services, news bringers and suppliers of
staple goods.
These findings are supported by data from the marketplace where 85% of the street buyers report
buying exclusively from producers, not from other middlemen. In addition to this they report that
producers from within 4-5 hours, or up to 150-200km, away come to sell directly, which corresponds
to the greatest distance most of them travel in search of quinoa. Only one of the close to 30
interviewed buyers claimed to travel to the locations furthest away from the marketplace. A spot-
check of sellers at the market also provides support for this as none of the sellers came from the
communities located the furthest away. Instead, they all came from within the area specified by the
buyers. While several sellers reported selling most of their crop directly at the market there were
also producers who normally sold through associations or to middlemen in their villages. With few
exceptions the sales were made out of necessity, something that is easily explained by the time of
the year, as the main harvest usually is during the months of May and June (Tapia, 2010). The
volumes offered for sale ranged from two to twenty quintals, with an average of close to ten quintals
per seller, something which appears high with an average production per producer of 37 quintals per
year. Sellers of smaller quantities reported selling quinoa individually but several of the ones selling
greater quantities were selling quinoa on behalf of relatives and/or neighbors in addition to their
own quantity.
4.3 Number of middlemen
Table 4: Number of middlemen in the villages
Number of middlemen, range 2-3 4-5 6-7 >7
Producer's replies:
Near village 0 4 1 0
Middle village 3 5 0 0
Remote village 2 2 1 0
Total 28% 61% 11% 0%
Middlemen's replies:
Marketplace 20% 50% 10% 20%
While the reliance on middlemen for selling quinoa differs between locations, there is no significant
difference in the number of buyers. Even though respondents found it difficult to specify the exact
amount of buyers visiting, as this is not a static number and, among other things, depends on the
18
harvest available, there is a striking similarity among the numbers reported. Independent of location,
there are, on average, no less than two and no more than five middlemen visiting the producers’
communities looking to buy quinoa. These data are supported by the middlemen themselves who
report the same numbers with few exceptions when asked to specify the number of competitors
they face while buying in the villages. An adjustment of the data for an exceptional outlier7 renders
an average of six competing middlemen per location visited by the interviewed middlemen, and a
majority stating that they face approximately five competitors. Important to note is that these are
the middlemen who mainly operate in the areas closest to the marketplace, at distances up to four
or five hours away, and thus not in the middle or remote villages. Yet data from the middle village is
in line with this finding as neither this location is visited by any more than five and no less than two
middlemen, with similar results for the remote village and a neighboring village. For the annual fair
held in the middle village in September the number was slightly higher with seven middlemen
visiting; three from La Paz and two from Cochabamba and Tupiza respectively but no buyers from the
marketplace.
One difference between the different locations, however, is the frequency of the visits of middlemen.
While the near village is visited every few weeks by potential buyers this number is positively
correlated with distance as the remote village is only being visited every two months or so. The
number of concurrently visiting middlemen at any given time is only more than one in exceptional
cases, such as after a particularly good harvest. Only one buyer interviewed indicated that there
would be fewer competitors and more favorable terms for buyers in the more remote locations. The
distinction made was, however, the same as described above: instead of five competitors there
would only be two or three.
Middlemen on average visit 20 to 50 different communities on a typical buying tour where they
travel by truck from village to village, usually spending 1-3 days in the field. Some apply minimum
and maximum volumes desired for a trip as they recognize that any trip is associated with costs for
transportation, accommodation and time spent, the limits usually being dependent on how much a
truck can carry. All middlemen interviewed claim that the locations visited differ from time to time
but many at the same time acknowledge having relationships and contacts with certain communities.
Communications are mostly by cell-phone, something that effectively would exclude areas such as
the middle village and the remote village as there is no or very limited coverage in those areas.
The number of middlemen has, according to all interviewed, increased in the past few years and
increased competition among buyers. Higher prices of quinoa has attracted more buyers, something
that can be seen especially at the marketplace where the smallest buyer claim to buy just 13 quintals
per month, to be compared to the average of around 400 quintals. As noted by one middleman, a
price of Bs. 500 entails substantial capital investments and limits entry into the business.
4.4 General competition
Producers and middlemen alike unanimously characterize the competition between buyers of quinoa
as being very high, independent of location and size of the producer. While the number of buyers in
each location appears quite low, especially taking the time between visits into consideration, any
7 While the question asked was ”How many other middlemen do you face per location?” some respondents
with higher than average answers may have interpreted the question as the total number encountered on a
buying trip.
19
suggestion of collusion on behalf of the middlemen were fiercely disputed by them. Or, as one
indignant buyer stated: “This is business”.
Whereas some bonds may exist between buyers and sellers, such as sellers calling a buyer they have
done business with before, there exists no loyalty towards particular middlemen among the
producers. No producer reported selling to the same buyer all the time, instead they sell to the
highest bidder, sometimes turning down offers hoping for a better one to come along, storing the
quinoa in the meantime (Silguer, 2010). One producer reported storing about half the harvest for
necessity sales throughout the year while selling the remaining half at the time of harvest. Because
of its physical properties, quinoa can be kept in storage for longer times than more perishable crops.
The middlemen are clearly aware of this possibility and more than one stated that they were forced
to adapt their prices to the requirements of the producers “as they will just sell to someone else
otherwise”. According to Pedro Mamani, Area Responsible for Producers at FAUTAPO, this change in
bargaining power among the producers was first seen two or three years ago and is linked to the
increase in demand for quinoa (Mamani, 2010). While middlemen may have certain areas they
frequent more often than others there is no loyalty to one area in particular, they instead visit
different areas each time, mainly depending on where there is quinoa available.
While associations such as ANAPQUI require their producers to comply with strict rules for
certification they nonetheless provide an alternative to middlemen for producers.
4.5 The role of producer associations
Producer associations such as CECAOT and ANAPQUI were created in the late 1970s and early 1980s
to safeguard the economic and social rights of quinoa producers as well as to increase the
development of the areas where these producers lived8. As mentioned before, the associations only
work with certified, or organic, quinoa and pay their members a fixed price of Bs. 700. The largest
association, ANAPQUI, operates 50 regional storage centers in 8 regions together with their regional
affiliates for which they coordinate transportation to their processing plant at the marketplace. Once
processed the quinoa is exported to the European and American markets (Alanoca, 2010).
Being a member of a producer organization does not prevent producers from selling part of their
produce to middlemen. These sales are often necessity sales as the associations do not provide a
barter system like some middlemen that use quinoa as a mean of payment for other goods. This kind
of trade is however not barter in its strictest sense as the price of quinoa is converted to Bolivianos
and then matched to the price of the good bought by the producer (Ofstehage, 2010). Aside from
possible cooperation regarding transportation and marketing of quinoa, being part of an organization
also gives a legal status which facilitates doing business with others. As in any other country,
registered companies are more reluctant to do business with unregistered actors, thus, being part of
an organization facilitates contracts and tax payments. It also makes the undertaking of joint projects
for infrastructure such as irrigation systems and the construction of deposits for storing quinoa easier
(Silguer, 2010).
Despite these benefits and the long history of producer associations far from all producers are part of
them as seen in table 3. The Secretary General of ANAPQUI put forward the idea that the
requirements put on producers may act as a deterrent for some that prefer to have more freedom in
8 http://www.quinua.com.bo/index.php?Vent=20s

20
their production or simply are unable to meet the requirements. In order to sell organic quinoa a
certification is required which adds an additional cost for the producers. Less flexible arrangements
for payment, and sometimes delayed payments, further contribute to producers selling to
middlemen that pay upfront instead. ANAPQUI is currently not operating at full capacity and has
room for more producers, and actively encourages it, “our gates are open” as the Secretary General
says, but does not view other associations as competitors. While he admits scale being a key issue for
them their non-profit foundation at the same time puts less emphasis on profitability (Alanoca, 2010).
4.6 Competition at the marketplace
Table 5: Survey of middlemen at the marketplace
qq./month Mostly sells
quinoa to
% bought direct
from producer
# of other
middlemen at
marketplace
Visits villages
to buy quinoa
Furthest
distance for
visits
13 Wholesaler9 100% - No -
20 Wholesaler 100% - No -
100 Wholesaler 100% 50 Yes 4-5h
150 Wholesaler 80% - Yes 2-3h
200 Company 100% 50-70 Yes 4-5h
200 Different 100% - No -
300 Different 100% - No -
300 Wholesaler 100% - Yes 4-5h
300 Wholesaler 100% - Yes 4-5h
300 Peru 100% 50-70 Yes 4-5h
400 Company 95% - Yes No limit
400 Company 80% - Yes 7h
400 Company 100% 70 Yes 4-5h
400 Peru 100% 50 Yes 2-3h
500 Company 100% - No -
500 Company 100% - Yes 2-3h
700 Different 100% - Yes 1-1,5h
1000 Company 100% - Yes 4-5h
2000 Company 80% - Yes 4-5h
What is here referred to as the marketplace is indisputably the most important trading center for
quinoa on the southern Altiplano of Bolivia. Most of the quinoa traded here is of conventional kind
and destined for the border market in Desaguadero for further export to Peru (Soriano et al., 2006).
It is difficult to estimate the total amount of buyers as smaller actors constantly come and go,
depending on financial capabilities and supply (Mamani, 2010) but the local association of quinoa
buyers has some 70 members. Likewise, estimates made by the middlemen themselves range from
around 50 to 70 buyers. These numbers display only a minor change from what Soriano et al. found
in 2006 when they estimated there to be three large wholesalers, some 30 small to medium sized
wholesalers, and around 50 to 100 small irregular buyers. Classifications on whether a buyer is a
large or small wholesaler is based on volume processed per week with the former handling, on
average, four to six truck loads of quinoa and the latter one or two loads (Soriano et al., 2006). On
Saturdays and Sundays some 30 middlemen wait outside their shops and on the streets to the east of
the main market with portable scales and thick wads of cash. The average buyer is handling 400
quintals per month but the range goes from just short of 15 to 2000 quintals. The latter is to be
9 Wholesaler refers to the three largest wholesalers at the marketplace.

considered a large wholesaler due to the high volume processed and also reported buying 20% of her
volume from other middlemen as opposed to the others who mainly buy directly from producers.
Smaller wholesalers, especially those processing less than 300 quintals per month, primarily sell their
quinoa to one of the three larger wholesalers that operate out of the marketplace and bring the
quinoa to the Peruvian border in Desaguadero for informal exports. While many of the larger
middlemen sell to several different buyers, including the large wholesalers and the Peruvian border
market, a common buyer is one of the processing companies that will then either export or sell
domestically. The only observable cooperation, or even interaction, among the middlemen in the
street is the trucks that arrive around lunchtime to gather the purchased quinoa and transport it to
their respective storage location.
On a given day the prices offered by the buyers are virtually identical. At the time of research all
buyers quoted Bs. 500 per quintal as their standard price although some acknowledged that they
sometimes could make exceptions. The margins for middlemen trading in quinoa bruta, i.e. where no
value is added to the product, are around Bs. 5-30 per quintal. If washing, sorting or other processing
takes place margins rise to Bs. 50-100. While all of these middlemen wish to increase the volume
purchased the prices paid to them by the buyers further upstream prevent any raises in prices paid
to the producers. All producers interviewed at the market were perfectly aware of prices paid and
appeared to choose buyer depending on the availability of the buyer, i.e. ease of selling.
In addition to being the main center for the quinoa trade the marketplace also provides all kinds of
goods and attracts not just quinoa sellers. Weekends sees a significant increase in available
transportation with minibuses, buses and private vehicles offering fares to visiting customers.
4.7 Development of prices and quantity
4.7.1 Prices
The price of organic quinoa has been increasing steadily over the past decade but a dramatic increase
occurred in the year 2008. At the same time the spread between the border price and market price
140 160 170
255
N/A
255 275
700
339 364 376 404 425 417 441
743
2001 2002 2003 2004 2005 2006 2007 2008
Bs/
qu
inta
l
MoM, September
Figure 4: Price development, organic quinoa 2001-2008
Producer price Export price
Source: FAUTAPO (2009); FAO (2010); Soraides (2008), compiled by the author

22
decreased significantly, as can be seen by figure 4. While these prices are for organic quinoa and
most middlemen trade in conventional the prices tend to correlate. In October 2010 the observed
difference between prices offered to producers for organic and conventional quinoa was about 29%
but this number naturally fluctuates with the changes in price for conventional quinoa. Earlier
studies by Collao (2001) and Crespo (2001) identified a 20-25% premium for organic quinoa, a
premium which is partly due to the higher costs associated with certifying quinoa. Some producers
claimed that the price was unusually low at the time of this study indicating the difference could
have been smaller in recent years. FAUTAPO (2009) for example observed a difference of 8-10% in
their report for the year 2008.
While previous studies have found that the difference between the prices paid in the villages and
those at the marketplace are small they have not specified whether this is true for all distances. Two
popular ways to increase these margins do, however, exist. One such way is to keep the bags
supplied by the producers and by doing so adding the value of the bag to the margin. Use of faulty
scales in order to be able to offer a, seemingly, higher price have also been reported (Soriano, 2010;
Ofstehage, 2010).
4.7.2 Production
Table 6: Statistics on production, 2000 - 2009
Year 2000 2001 2002 2003 2004 2005 2006 2007 2008 2009
Area (Ha) 36847 37223 37817 38289 38649 39302 42431 45454 46369 48136
Yield (Hg/Ha) 6455 6259 6393 6512 6387 6412 6333 5852 5859 5874
Production
(TM)
23785 23299 24179 24936 24688 25201 26873 26601 27169 28276
Domestic (TM) 22349 21176 22160 22134 20942 20375 19121 16145 16970
Export (TM) 1436 2123 2019 2802 3746 4826 7752 10456 10199
Export Value
(1000, USD)
1801 2411 2328 3085 4266 5573 8914 13107 23028
Source: FAO (2010)
Bolivia has seen a large increase in the land harvested for quinoa, increasing with some 30% since the
year 2000. Yields for the corresponding period have however gone down. A clear gain can also be
seen in the volume of exports which have increased sevenfold with especially large increases since
2007. Numbers for the informal exports to Peru are hard to come by but Alcala (2007) put the
number at 25% of total production which is somewhat higher than the 17% and 10% that Soriano
(2006) and Crespo (2001) respectively put it at.
23
5. Analysis - Market power of middlemen on the Bolivian quinoa market
While it is rare to find markets that are perfectly competitive the criteria for such a market is a useful
starting point for determining what competition on a market is like. The most straightforward
indicator of the degree of competition is the number of middlemen available per producer, as
studied by Chau et al. as well as McMillan et al. Another way, as described by Venkataramanan, is to
analyze the margins of middlemen in order to deduce what the market power in a given area is. Low
margins indicate that there is high competition among buyers which in turn would mean that the
market power of middlemen is low. Throughout the following chapter both methods will be utilized
in order to provide as clear a picture as possible of the market power of middlemen in each of the
three studied locations in Bolivia.
The three locations all display different dependence on middlemen for marketing of quinoa, much
like the model of Chau et al. predict, but the observed market power of middlemen does not
correspond to that predicted by the models. First, the area closest to the hub/marketplace is in the
model expected to be served exclusively by middlemen, this is not the case in Bolivia. Instead
producers in the nearest area sell the majority of their crop directly to the market. Second, and in
line with the model, the remote village is primarily served by producer associations without an
explicit profit generating purpose. Their main purpose is instead to assist the development of the
local communities and enhance production of quinoa. As predicted by the model the studied area in
between these other areas is primarily served by middlemen and while associations exist in this area
as well the proportion of membership is lower than for the remote village. There does not appear to
exist any area in southern Bolivia which is not covered by the activities of either associations or
middlemen.
While the remote area is indeed served primarily by associations, middlemen still operate in the area
although their role may be less significant than in the other areas. Especially sales for necessity are
still done through middlemen in these areas as well which could provide middlemen with an
opportunity to take advantage of potential market power. The importance of distance is analyzed by
studying competition at the three separate locations. Given the importance of the marketplace this is
analyzed separately.
5.1 Characteristics of quinoa
Quinoa to a large extent fulfills the requirements of the homogeneous product needed for perfect
competition to potentially exist. All quinoa grown on the Altiplano belong to the same specie and
middlemen mainly trade in the highest grade quality, making differences in quality of the quinoa sold
negligible. The greatest distinction made is instead the one between organic and conventional
quinoa. Most of the trade in organic quinoa is however not managed by middlemen but by producer
associations or companies. Conventional quinoa traded by middlemen can thus be argued to be a
very homogeneous product which is also supported by the uniform prices offered at the marketplace.
Were there to be large differences in quality such a uniform price could reasonably not be sustained.
Quinoa is in addition to this also a highly mobile product. Due to the possibility of storing quinoa for
longer periods of time without it perishing it can be transported longer distances than a more
perishable product could. Quinoa can be described as a “high value, low volume” product as a
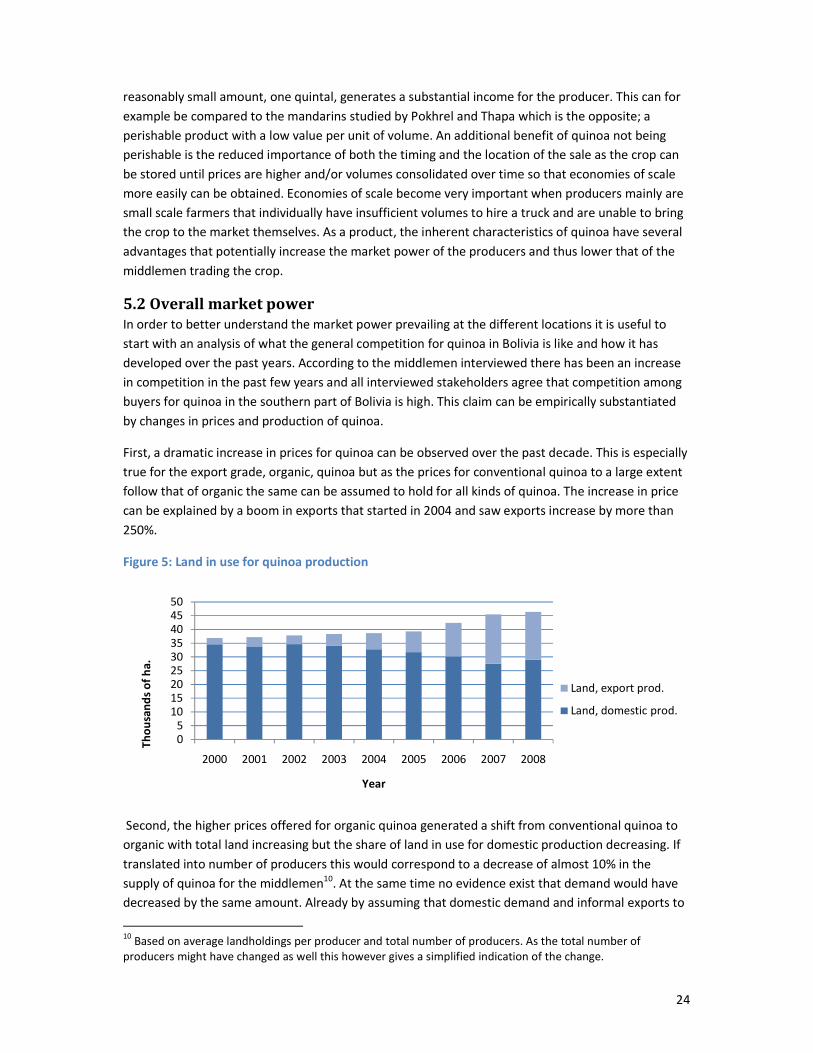
24
reasonably small amount, one quintal, generates a substantial income for the producer. This can for
example be compared to the mandarins studied by Pokhrel and Thapa which is the opposite; a
perishable product with a low value per unit of volume. An additional benefit of quinoa not being
perishable is the reduced importance of both the timing and the location of the sale as the crop can
be stored until prices are higher and/or volumes consolidated over time so that economies of scale
more easily can be obtained. Economies of scale become very important when producers mainly are
small scale farmers that individually have insufficient volumes to hire a truck and are unable to bring
the crop to the market themselves. As a product, the inherent characteristics of quinoa have several
advantages that potentially increase the market power of the producers and thus lower that of the
middlemen trading the crop.
5.2 Overall market power
In order to better understand the market power prevailing at the different locations it is useful to
start with an analysis of what the general competition for quinoa in Bolivia is like and how it has
developed over the past years. According to the middlemen interviewed there has been an increase
in competition in the past few years and all interviewed stakeholders agree that competition among
buyers for quinoa in the southern part of Bolivia is high. This claim can be empirically substantiated
by changes in prices and production of quinoa.
First, a dramatic increase in prices for quinoa can be observed over the past decade. This is especially
true for the export grade, organic, quinoa but as the prices for conventional quinoa to a large extent
follow that of organic the same can be assumed to hold for all kinds of quinoa. The increase in price
can be explained by a boom in exports that started in 2004 and saw exports increase by more than
250%.
Figure 5: Land in use for quinoa production
Second, the higher prices offered for organic quinoa generated a shift from conventional quinoa to
organic with total land increasing but the share of land in use for domestic production decreasing. If
translated into number of producers this would correspond to a decrease of almost 10% in the
supply of quinoa for the middlemen10. At the same time no evidence exist that demand would have
decreased by the same amount. Already by assuming that domestic demand and informal exports to
10
Based on average landholdings per producer and total number of producers. As the total number of
producers might have changed as well this however gives a simplified indication of the change.
05
101520253035404550
2000 2001 2002 2003 2004 2005 2006 2007 2008
Th
ou
san
ds
of
ha
.
Year
Land, export prod.
Land, domestic prod.

25
Peru were unchanged the reduced supply of available quinoa would drastically increase the
competition among middlemen trading in conventional quinoa. As indications exist that the share of
conventional quinoa exported to Peru in fact increased during this period there is reason to believe that
the increase in competition was even greater than this suggests.
While no data is explicitly available for the difference between prices paid to producers of
conventional quinoa and the corresponding export prices this data exist for organic quinoa (see
figure 4). Given how prices for conventional quinoa follow that of organic quinoa the same reduction
in spreads can be assumed to hold for conventional. There is thus support for competition among
middlemen trading conventional quinoa can being high and their margins low. Their market power,
as a whole, would consequently be low as well.
5.3 Competition at the marketplace
The composition of middlemen acting out of the marketplace is limited to only three kinds: large
wholesalers, small wholesalers and small-scale traders. The latter group is presumably not involved
on a regular basis and previous studies have found it difficult to determine their numbers. In the
remaining two groups there is estimated to be about three large wholesalers and 30 to 50 small
wholesalers, the majority thus being small to medium sized actors. Consequently, there is a large
number of both sellers and buyers present at the marketplace which should mean that neither have
high possibilities of setting prices. This appears especially true for the smaller wholesalers.
Margins on quinoa bruta, quinoa resold without any value added, are reported to be about 1-6% per
quintal and all interviewed buyers claim to be unable to offer higher prices. Given transportation
costs it can be assumed that the majority of quinoa traded at the lower margins is resold at the
marketplace and not transported to other locations. This kind of “intra-marketplace trade” is
primarily conducted by the smallest wholesalers, those handling less than 300 quintals per month,
and the buyer is usually one of the large wholesalers at the marketplace. Wholesalers handling
amounts in the range of 400 to more than 1000 quintal per month report selling to companies
outside the marketplace to a greater extent. This creates two groups of buyers at the market: smaller
middlemen who act as consolidators of volume for the large wholesalers and larger buyers who
independently are able to “export” the quinoa to outside the marketplace. About 50% of the
interviewed middlemen fall into the category of small actors selling to the large wholesalers, this was
corroborated by one of the large wholesalers who confirmed that she purchases 20% of her volume
from other middlemen.
There are no or low costs associated with entering the lowest segment of the market, buying and
selling quinoa at the marketplace. As these buyers do the majority of their business at the
marketplace they incur no other costs than the opportunity cost of their time and the cost of
procuring the quinoa as business is done in the street and only requires transportation within the
marketplace. Low loyalty among the producers in who they choose to sell to further reduces any
barriers to entry for potential competitors. Competition among smaller buyers at the marketplace
thus displays many of the characteristics of a highly competitive market with many small buyers and
sellers trading a homogeneous product with perfect information of competing offers and with no or
low costs for entry and exit. The upper limit for what price they can offer is decided by the prices
offered to them by those whom they sell to, i.e. the large wholesalers. Under these circumstances
the ability to set prices for the smallest wholesalers is low and they are operating near zero profit.

26
However, as the product is homogeneous no middleman can offer a price lower than that offered by
the smallest wholesalers. As this price ultimately depends on the price offered by the large
wholesalers it appears that the larger wholesalers could hold some market power. Their numbers are
also significantly lower at only a handful and their operations require substantial amounts of capital
and possibly the ownership of a truck or similar.
The large wholesalers also buy directly from producers and thus they display some pricing power
through the existence of a margin between the quinoa bought directly from producers and that from
other middlemen as they could offer this price directly to producers. Medium-sized wholesalers at
the same time reported margins of 1-6% with, as concluded above, the lower percentiles being for
intra-marketplace trade. The medium-sized wholesalers sell their quinoa to the same buyers as the
large ones with the amount sold being the only significant difference. These same margins therefore
should also apply to the large wholesalers and their pricing power is thus equivalent to the difference
between the street price offered to producers and the price offered to smaller middlemen. As shown
above this is in the lower range of 1-6%, or Bs. 5-10 per quintal, which is to be considered low. The
lower margins earned by large wholesalers when buying from other middlemen can be explained by
the value consolidation of volume has to them. By using smaller middlemen as consolidators of
volume the larger buyers decrease the number of transactions needed and reduces time spent per
transaction as the sorting and weighing is already completed.
Although the margins higher up in the marketing chain weren’t studied some evidence exists that
supports the case above. As producers in the near area are indifferent between selling in the village
or at the marketplace given a price difference of �� middlemen from the marketplace cannot offer a
price lower than �∗ − �� as they go out. This leads to middlemen earning the same or less profit on
each quintal they buy outside the marketplace, as they would offer �∗ buying at the market, unless
they can take advantage of economies of scale and decrease their cost of transportation per unit to
less than that of the producers, ��. Given the already low transportation costs, around 1-2% of the
price per quintal, this will require large amounts per trip. Despite this, a majority of the middlemen
report visiting villages and producers in the first area in search of quinoa to buy. Assuming all types of
middlemen are profit maximizing agents who wish to increase their earnings this behavior indicates
that the only way for them to increase their profit is through processing higher volumes, even if this
comes at a higher cost.
While collusion and price fixing could exist between all the buyers at the marketplace the
homogeneity and mobility of the product would attract the upstream buyers, i.e. processing
companies and traders from the Peruvian border market, to come to the marketplace as long as the
difference in price was greater than their transportation cost. Margins for wholesalers selling to
either processing companies or the Peruvian border market should thus not be in excess of 6% of the
price paid to producers. In addition to the above, prices are uniform and known by all actors at the
marketplace.
All of the above leads to the conclusion that competition among buyers at the marketplace is close to
perfect. Even larger wholesalers, with their smaller number and higher entry barriers, only seem to
have very limited market power over the producers at the marketplace.

27
5.4 Competition near the marketplace
This area encompasses villages and producers located up to five hours away from the marketplace.
Producers in the near village independently of size all reported primarily selling directly at the
marketplace with only occasional sales for convenience to middlemen in the village. This was
confirmed by the buyers at the marketplace where a majority of the middlemen purchased all their
quinoa directly from producers who brought quinoa to the market. The buyers identified an area
within a radius of four to five hours from the marketplace as the source of all sales to them, this area
also with few exceptions corresponded to the area they themselves were willing to visit in search of
quinoa. Further support for this geographical division are the spot-checks of sellers performed at the
market which confirmed that producers from quite large distances away were present. While it could
be the case of a black swan, no seller came from outside the area defined above and the following
should thus be applicable to the entire area.
Producers in the near village described competition among visiting middlemen as “high” despite the
numbers of middlemen not exceeding five. Solely based on this it could thus appear that there is a
large amount of small sellers with relatively few buyers. With transportation costs to the
marketplace between five and ten Bolivianos per quintal, or 1-2% of the market price, and with a
time consumption of a few hours the opportunity cost for the producer is, however, low to bring the
quinoa directly to the marketplace. The direct access to the marketplace effectively makes the
competition among middlemen operating in this area equal to those trading at the marketplace.
Since even the smallest of producers, those normally most likely to need the assistance of
middlemen, face no problems in selling quinoa directly the dependence on middlemen for marketing
is to be considered very low. As the marketplace also trades in all kinds of goods it can be believed
that producers may visit the market for stocking up on supplies and other goods as well which
further reduces the opportunity cost associated with selling at the market. Additionally, frequent
visits to the market also facilitate a better knowledge of prices, either through firsthand accounts,
through neighbors and/or family, or via phone which also increases the bargaining power of the
producer. Producers in the near village were all fully aware of prices and costs associated with selling
their quinoa.
The strong bargaining power of producers in the near area is further demonstrated by how the
reported difference in prices between the near village and the market equals that of the
transportation cost, making producers indifferent to where they sell their quinoa. While not all
buyers operate out of the marketplace those who don’t will need to offer the same or higher price as
the producer can receive by selling directly at the market in order to strike a deal as producers are
perfectly aware of the competing offers from other buyers.
In effect, the competition throughout the whole first area is determined by the competition that
exists at the marketplace and producers will never earn less than the difference between the price
offered at the marketplace minus the cost of transportation as long as they can sell straight to the
market. This is mainly explained by the proximity to the marketplace and the ease with which
producers can transport their quinoa and themselves there.
28
5.5 Competition at a medium distance from the marketplace
Dependence on middlemen for marketing of quinoa is much greater outside the zone with ability to
sell directly at the marketplace. In the middle village middlemen constitute the primary channel for
selling quinoa with all interviewed producers selling through them in the village. The high
dependence on middlemen combined with low price awareness and limited transportation options
fulfill several of the prerequisites for a situation where middleman market power potentially could be
high and competition low.
Producers in the middle village, however, claim there to be high competition in their areas as well.
Once again using the model presented by Chau et al. the concentration of middlemen should,
through the interplay between transportation and the fixed costs for visiting one additional producer,
go down and increase middleman market power. More remote areas should thus see lower numbers
of middlemen. This is, however, not the case.
While exact numbers of middlemen for each location are difficult to specify due to their informal
nature it is clear that there is no less than two middlemen or more than five operating in each of the
locations. Both McMillan et al. and Chau et al. emphasize that the important number is the number
of buyers the producers have access to, in the latter’s case so that they can rank the various offers
and choose the highest. With the decreasing frequency of visits for the more remote locations it is
unlikely that there is any more than one middleman present at the same time throughout much of
the year. Through this way of reasoning the number of simultaneous offers available to the producer
should be one. It is, on the other hand, possible to store quinoa for sale at a later point in time. The
visits of middlemen, albeit infrequent, also appear to be rather predictable in time, i.e. there is no
doubt that there will be more visits by others in the future. This is something producers can leverage
in order to increase their own bargaining power as they are able to wait for a better offer if the first
offer received wasn’t satisfactory, unless there is an immediate need to sell their harvest. The
importance of the frequency of visits is thus reduced and it can be argued that it is in fact the total
number of visiting middlemen that is relevant. This number is still relatively low at no more than five
middlemen regularly visiting the village but it still provides the possibility of competition.
A prisoner’s dilemma type of situation where collusion would be better for the middlemen can easily
be imagined. The probability of striking a deal is, however, dependent on the actions by the other
buyers while these are unobservable to the others given the difference in time of the visits. Failing to
strike deals will lead to the middleman incurring the higher costs of visiting the remote location
without being able to purchase the required amount to make up for the transportation costs. While
no margins were directly observed due to the lack of recent sales to compare with it is possible to
make some general assumptions. Given the high competition prevailing in the area nearest the
marketplace and the virtually non-existent margins there it can be argued that the existence of
higher margins further away would attract buyers from the nearer area. Producers do not show any
loyalty in who they sell to but are driven by the highest price on offer and middlemen similarly claim
not to have any specific relations with certain areas. This would indicate that margins are no different
for the more remote locations once adjusted for distance specific costs.
Despite the low number of buyers in the area and low awareness of prices the storability of quinoa
weakens the bargaining power of the middlemen. With competition being very high in the areas
closer to the marketplace were buyers not to offer acceptable prices to the producers this would

29
attract middlemen from the nearer areas as there are low barriers to entry. With the middlemen
being aware of this their willingness to strike a deal by offering a price more acceptable to the
producer would increase. Competition in this area is thus not the result of many competing buyers
but rather a protective behavior from those already present.
The opportunity for producers to decline offers when selling quinoa decreases when the sales are
made for necessity purchases. These potentially higher margins for the middlemen need however to
be put in relation to the opportunity cost for the producer. While not the whole profit from selling
quinoa is likely to be spent on purchases from the middleman it is reasonable to presume that at
least a fair percentage of small sales are for this purpose. Obtaining these goods through other
channels would naturally also incur certain costs, such as traveling to the nearest town, which needs
to be taken into account.
Overall, the market power of middlemen at the medium distance is low as well.
5.6 Competition at a long distance from the marketplace
Although producers in the remote village mainly sell through associations, other locations at a similar
distance display lower percentages of producers affiliated with associations. These unaffiliated
producers would be left with middlemen as the main option for commercialization in the same way
as can be seen in the middle village. It is therefore reasonable to assume that there still exists a
market for middlemen in this area as well, although not as large as for the areas located at a medium
long distance from the marketplace. Aside from the higher transportation costs and more limited
role of middlemen there appear to be no difference between the most remote village and the middle
village.
Similar to the middle village producers in the remote village claim that there is high competition and
the number of middlemen in the remote village is no different than in the middle village despite
being located significantly further away. The same arguments presented for the middle village are
therefore also valid for the remote village. The main incentive for middlemen to operate on margins
equal to those of other areas is to protect their business from entry of other competitors. The
associated opportunity costs are higher for this area which would make it less attractive to
middlemen but this would be compensated through, slightly, lower prices.
There is therefore nothing that suggests that the market power of middlemen at the long distance
from the market place is any different than that at a medium distance. As this was concluded to be
no different from the near area nor the market place, competition appears to be high throughout
Bolivia and the market power of middlemen consequently low.

30
6. Conclusion
Similar to many other places in the world there exist different opinions on the role of middlemen and
their potentially exploitative behavior in the market for quinoa in Bolivia. Some call them an evil
mafia while others recognize them being an important part in the marketing of quinoa for producers
who lack sufficient capital and/or volume to do so themselves. Producers are keen on cutting out the
role of the middleman in order to sell directly to the consumers but none give the impression of
being exploited by the middlemen. Instead, producers in all three locations studied claim that
competition is high among middlemen and they have no difficulties to sell their quinoa. Some
middlemen indeed go as far as to claim that they are being squeezed between producers exercising
their bargaining power and processing companies setting prices. This picture is supported by many of
the findings of this thesis.
Over the past decade prices on quinoa have more than doubled and exports have displayed a
dramatic increase. As much of this demand have been for organic quinoa this has led to more
producers shifting to organic instead of conventional, thus reducing the supply available for
middlemen handling the latter while demand has gone up. The increased competition can be
observed at the marketplace for quinoa in southern Bolivia where a situation that can be described
as near perfect competition exist among the wholesalers operating there. This high competition
comes from low costs associated with trading in quinoa which means no or low barriers to entry or
exit exist, a homogeneous product and a high demand from outside markets. Prices offered at the
marketplace are uniform and the margins earned by the wholesalers are in the range of 1-6%,
including for those who transport the quinoa large distances. Given the intense competition
middlemen have very low market power and possibilities of offering prices below those decided by
the market.
This situation is extended to the area located within four to five hours of the marketplace as
producers there have the possibility of selling directly at the marketplace. Middlemen operating in
this area are thus exposed to the same competition prevailing at the marketplace, effectively
eliminating any market power they might have over producers. As distances increases so does the
dependence on middlemen for selling quinoa. There is however no observable increase in the market
power of middlemen despite this. Instead, the number of middlemen operating in the most remote
village is the same as the number of middlemen in the nearest. This is explained by the high
competition prevailing in the area closer to the marketplace and the spillover of competition larger
profits in the more remote areas would generate. The physical properties of quinoa help to sustain
the bargaining power of the producers as it can be stored in expectation of better offers and a low
volume still generates a significant profit, as well as making it cheaper to transport.
The conclusion is that the market power of middlemen trading quinoa in Bolivia is low. While the
dependence on middlemen increases with distance the competitive situation and their market power
does not. Instead, competition appears uniform in all quinoa producing areas. There does thus not
exist any evidence that middlemen are taking advantage of their position and are exploiting
producers, irrespective of how remote the village is.

31
7. Reflections
The low market power of middlemen trading quinoa in Bolivia is most likely strongly correlated to the
large increases in price and demand that the market has experienced over the past years. Due to this
high external demand middlemen are willing to travel throughout the entire area in search of quinoa
to buy. While high demand for a product is not unique to the case of quinoa and Bolivia some key
differences however exist that separates quinoa from many other agricultural products and
strengthens the position of the producers.
The first such difference is the fact that quinoa is almost exclusively produced in Bolivia and Peru and
that no quinoa is imported to Bolivia. This geographical concentration of production strengthens the
position of exporting companies as they face little or no competition from other parts of the world.
While Peruvian coffee is readily substituted by coffee from Central America or Indonesia for example,
there are no substitutes for quinoa from other parts of the world. As control of the supply thus is
limited to Bolivia and Peru, control of prices is also to a larger extent concentrated here. This leads to
a potentially lucrative market which attracts more competitors and in turn leads to a trickling down
of competition to eventually reach the stage of the producer.
Second, the physical properties of quinoa are somewhat different from many other crops.
Specifically the ability to store quinoa for longer amounts of time, as opposed to mandarins or
tomatoes to mention only two, increases the producers bargaining power as the immediate need to
sell the crop after harvest is not the same. Middlemen trading in perishable goods are able to
leverage this when offering prices as producers are faced with the choice of selling to a bad price or
risk losing the whole crop. For quinoa this is the reverse as producers are able to withhold supply of
the crop until a sufficient price is offered. While this does not take into consideration the potential
need for producers to sell their crop due to financial reasons this is a problem all producers face,
independent of crop.
Bolivia also has a long history of producer associations acting on behalf of the producers. These have
been active for more than 30 years and have, if nothing else, provided an alternative for producers.
While currently dealing with organic quinoa this has still increased the competition for land available
for production, something that will have had direct effects on the volumes available for middlemen
trading conventional quinoa too. Without the increase in demand from the export markets the
benefits of the associations would however have been mainly limited to the member of the
organizations.
Despite being a competitive market there are still ways middlemen in Bolivia cheat producers. The
mentioned tampering of scales and handling of bags are but two ways. None of these however
appear widespread as no producers mentioned these problems, which likely also is an effect of the
high competition and the low loyalty among producers when it comes to who they sell to.
The role of the middleman, in this case at least, is that of an agent providing a service like any other
at prices decided by the market forces. With middlemen functioning like this there is no need to
strive to eliminate their role, instead they can indeed provide valuable services and products to the
rural communities.

32
8. References
Alcala, F. F. P. (2010) “Local development through the interaction in international business contract
mechanism: A case of Bolivian quinoa producers.” Research paper. Bolivian Central Bank
Workshop, Cochabamba.
Barrett, C.B. (1997), “Food Marketing Liberalization and Trader Entry: Evidence from Madagascar.”
World Development. Vol. 25, No. 5, 763-77. Barett, C. B. (2008), “Smallholder market participation: Concepts and evidence from eastern and
southern Africa.” Food Policy, Vol. 33, No. 4, 299-317.
Caballero, J. M. (1982), “La situación del campesinado andino y las decisiones de pólitica económica.”
In Lajo, M. et al. (eds), Agricultura y alimentación. Bases de un nuevo enfoque. Lima: Pontificia
Universidad Católica.
Chau, N. H., Goto, H. and Kanbur, R. (2009), “Middlemen, Non-Profits, and Poverty”. Working Paper
No 55931. Department of Applied Economics and Management, Cornell University.
Crespo, F., Brenes, E. R. and Madrigal, K. (2001), “El cluster de quinua en Bolivia: Diagnóstico
competitivo y recomendaciones estratégicas.” Working paper. Proyecto Andino de Competitividad, Instituto Centroamericano de Administración de Empresas.
Collao, R. P. (2001), “La cadena productiva de la quinoa.” Available [online]:
http://www.infoagro.net/shared/docs/a5/cproandinos3.PDF [2010-10-11]. Research paper.
World Bank.
Deveaux, A., Velasco, C., Lopez, G., Bernet, T., Ordinola, M., Pico, H., Thiele, G., and D.Horton (2007),
“Collective action for innovation and small farmer market access: The Papa Andina experience.”
Working paper No. 68. CAPRi.
Enete, A.A. (2009), “Middlemen and Smallholder Farmers in Cassava Marketing in Africa.”
Tropicultura, Vol. 27, No. 1, 40-44.
Fafchamps, M., Vargas, R. H. (2005), “Selling at the Farmgate or Traveling to Market.” American
Journal of Agricultural Economics, Vol. 87, No. 3, 717-734.
FAO (2010). Faostat. Retrieved Jan 2010, from Food and Agriculture Organization of the United
Nations: http://faostat.fao.org
FAUTAPO (2009), Situación Actual al 2008 de la Quinua Real en el Altiplano Sur de Bolivia. Oruro and
Potosi.
Hayami, Y., Kikuchi, M. and Marciano, E. B. (1999), “Middlemen and peasants in rice marketing in the
Philippines.” Agricultural Economics, Vol. 20, No. 2, 79-93.
Jones, J. R. (1984), “The Role of Middlemen in Potato Production in Cochabamba, Bolivia. Financial
aspects of Sharecropping.” Invited Paper for Research and Development Workshop.
International Potato Center, Cali.
Lopez, R.A., and You, Z. (1993), “Determinants of Oligopsony Power: The Haitian Coffee Case.”
Journal of Development Economics, Vol. 41, 275–84.
Lundahl, M. (1979), Peasants and poverty: a study of Haiti. London: Croom Helm.
Mérel, P. R., Sexton, R. J. and Suzuki, A. (2009), “Optimal Investment In Transportation Infrastructure
When Middlemen Have Market Power: A Developing Country Analysis.” American Journal Of
Agricultural Economics, Vol. 91, No. 2, 462-476.
McMillan, M., Welch, K. H. and Rodrik, D. (2002), “When Economic Reform Goes Wrong: Cashew in
Mozambique.” NBER Working Paper 9117, NBER. Cambridge, MA.

33
Ofstehage, A. (2010), The Gift of the Middleman – An ethnography of quinoa trading networks in Los
Lipez of Bolivia. Master Thesis. Department of Rural Development Sociology. Wageningen
Universtiy and Research Centre.
Osborne, T. (2005), “Imperfect Competition in Agricultural Markets: Evidence from Ethiopia.”
Journal of Development Economics, Vol. 76, 405-28.
Omamu, S. W. (1998), “Transport Costs and Smallholder Cropping Choices: An Application to Siaya
District, Kenya.” American Journal of Agricultural Economics, Vol. 80, No. 1, 116-123.
Pindyck, R. S. and Rubinfeld, D. L. (1997), Microeconomics, 4th
edition. New Jersey: Prentice Hall.
Pokhrel, D. M. and Thapa, G. B. (2007), “Are marketing intermediaries exploiting mountain farmers in
Nepal? A study based on market price, marketing margin and income distribution analyses.”
Agricultural Systems, Vol. 94, No. 2, 151-164.
Rojas, W., Soto, J. L., and Carrasco, E. (2004), “Study on the social, environmental and economic
impacts of quinoa promotion in Bolivia”. Research paper. PROINPA Foundation, La Paz.
Scott, G. J. (1985), Markets, myths, and middlemen: A study of potato marketing in Central Peru.
Lima: International Potato Center.
Santos, M. (1976), “Articulation of modes of production and the two circuits of urban economy.”
Pacific Viewpoint. Paper. Department of Geography, Victoria University of Wellington.
Soraide, D. L. (2008), “Comercializacion de la quinoa real producida en el Altiplano Sur de Bolivia.”
Discussion Paper. FAUTAPO, Oruro and Potosi.
Soriano, R., Soliz, C., Mamani, D., Gutierrez, E., Aguilar, E. (2006), “Demanda financiera del sector ‘no
visible’ de la cadena quinoa.” Study. The Dutch Embassy, La Paz.
Venkataramanan, L. S. (1971), “Middlemen’s Margin”. Economic and Political Weekly, Vol. 6, No. 39,
2050-2051.
8.1 Interviews
Alancoa, M. A. B. Seceretary General “ANAPQUI”, Asociacion Nacional De Productores De Quinoa
(ANAPQUI). Mamani, P. M. Area Responsible for Producer Contacts, Fundacioón AUTAPO (FAUTAPO)
Silguer, J. C. President, ASPASA.
Soriano, R. L. Independent Consultant, Desarollo Económico Rural.
Tapia, M. L. Area Coordinator for Rural Development Services and Products, Asociación Boliviana
para el Desarollo Rural (PRO-RURAL).
Additionally, 30 producers and 25 middlemen were interviewed in their respective village or at the
marketplace. These interviews are non-attributed due to their informal nature and relative brevity.

34
Municipality Santuario de
Quillacas
Tahua Santiago
de Huari
Uyuni Salinas de
Garcia Mendoza
Llica Colcha "K" Pampa
Aullagas
San Pedro de
Quemes
San Agustín San Pablo
de Lipez
Distance from
Challapata
Short Short Short Medium Medium Medium Medium Medium Long Long Long
Production/
producer, qq
36 14 5 82 69 52 35 16 65 28 6
HA/family 3,30 1,00 0,51 6,87 6,25 4,35 2,66 1,55 5,46 2,19 0,53
Total
production,
quintals
57586 8708 11775 162428 192250 59337 81468 11200 12700 12369 192
Share of
quinoa for sale
94% 87% 85% 96% 97% 95% 92% 89% 96% 90% 61%
Yield, qq/ha 11 14 9 12 11 12 13 10 12 13 12
Municipal
area, km2
1827 9356 2084 9584 5819 7286 18412 1187 4193 2304 14188
Land in use for
quinoa, ha.
3310 646 1242 12975 17045 4816 5957 1133 925 964 16
Municipal
population
2265 1497 7712 19648 5761 3133 7733 1602 587 1313 2412
No. of
producing
families
1585 620 2577 1970 2798 1137 2358 722 194 435 30
No. of
permanent
producers
620 228 374 1193 1194 629 1439 244 98 254 15
Producers /
municipal
population
27% 15% 5% 6% 21% 20% 19% 15% 17% 19% 1%
Population
density
1,24 0,16 3,7 2,05 0,99 0,43 0,42 1,35 0,14 0,57 0,17
Membership in
association
327 54 134 657 1524 657 266 75 284 N/A 18
Ap
pe
nd
ix 1
– F
ull list o
f qu
ino
a p
rod
ucin
g lo
catio
ns
an
d v
aria
ble
s

35
Appendix 2 – Interview guide for buyers and sellers
Structured questions to middlemen at the marketplace:
1. How many quintals do you trade per month?
2. To whom do you normally sell the quinoa?
3. From what area do the sellers come? (Measured in time and/or distance)
4. How many percent do you buy direct from producers?
5. How many other middlemen are there at the marketplace?
6. Do you visit villages in search of quinoa to buy?
7. What area do you normally visit then? (Measured in time and/or distance)
8. How many competing middlemen operate in the same villages as you?
9. How many villages do you visit?
10. Is there a minimum/maximum volume you require in order to undertake a tour?
11. Are there fewer or more competitors now than two years ago?
12. Do you buy from the same or different sellers?
13. What margins do you have on your buyers?
14. Do you process quinoa yourself?
15. Why don’t you offer a higher price at the marketplace?
16. Other information?
Structured questions to producers at the marketplace:
1. Where do you come from?
2. How many quintals did you sell?
3. Did you sell for someone else than just you? Who?
4. What price were you paid?
5. What type of quinoa did you sell?
6. How do you usually sell quinoa?
7. How many middlemen usually come to your village?
8. Other information?
Structured questions to producers in the villages:
1. How many hectares do you use for quinoa?
2. Have you sold quinoa in the past three months?
3. What price were you paid?
4. What type of quinoa did you sell?
5. To whom did you sell?
6. Do you know the current price at the marketplace?
7. Where/to whom do you usually sell quinoa?
8. How much does transportation cost to the marketplace?
9. How many middlemen visit this village, on average? (1, 2-3, 4-5, >5, >10)
10. Do you perceive it to be high competition among middlemen here?
11. Other information?

36
Appendix 3 – Illustration of quinoa grains and plants
Quinoa grains. Photo: Emily Barney Quinoa. Photo: The Dabble
Quinoa plants. Photo: twiga269