market squid (loligo opalescens) in the …...while on shore, they eliminate waste in the form of...
TRANSCRIPT

LOWRY AND CARRETTA: MARKET SQUID AS SEA LION PREY CalCOFl Rep., Vol. 40, 1999
MARKET SQUID (LOLIGO OPALESCENS) IN THE DIET OF CALIFORNIA SEA LIONS (ZALOPHUS CALIFORNIANUS)
IN SOUTHERN CALIFORNIA (1981-1995) MARK S. LOWRY AND JAMES V. CARRETTA
Southwest Fishenes Science Center National Manne Fishenes Service, NOAA
P.O. Box 271 La Jolla, California 92038-0271
ABSTRACT California sea lion (Zulophus calijoyniunus) scat and
spewing samples collected at three rookeries in south- ern California during 1981-95 were used to determine how sea lions utilized the market squid (Lol&o opalescens) resource. The samples revealed that market squid is one of the most important prey of sea lions in southern California, occurring in 35% to 44% of scat samples from San Nicolas Island (SNI), San Clemente Island (SCI), and Santa Barbara Island (SBI). It is eaten by sea lions throughout the year, but most often during fall and win- ter, and patterns suggest periods of high and low con- sumption associated with prevailing oceanographic conditions and, possibly, with squid abundance and movements. Percent frequency of occurrence values for market squid in scat samples collected seasonally from SNI were positively correlated with those from SCI (Y = 0.78), and samples collected during summer at SBI were positively correlated with summer samples from SCI ( Y = 0.82) and SNI (Y = 0.85). Landings of market squid at ports in southern California and percent oc- currence values of market squid in scat samples collected seasonally were positively correlated for SNI ( Y = 0.66) and SCI ( Y = 0.74), but not for summer samples from SBI ( Y = 0.25). Sea lions eat squid with dorsal mantle lengths from 10 to 235 mm (mean = 127 mm). Signif- icant seasonal, annual, and interisland differences ( P < 0.001) were found in the size of squid consumed by sea lions. Significant differences ( P < 0.001) were found in size of squid between scats and spewing, and between individual samples.
INTRODUCTION Market squid (Loligo opulescens) is one of the most
common prey species for California sea lions (Zulophus cul$ovniunus) in southern Cahfornia (Antonelis et al. 1984; Lowry et al. 1990, 1991). Sea lions eat squid through- out the year, but predominantly during autumn and win- ter, and its presence in their diet varies from year to year (Lowry et al. 1990, 1991). A spring and summer study at San Miguel Island showed that sea lions eat squid with
[Manuscript received 1 Feburary 1999.1
196
a dorsal mantle length of 62 to 185 mm (mean = 127 mm; Antonelis et al. 1984).
In 1995, the sea lion population along the U.S. Pacific coast was estimated at 167,000 to 188,000 individuals, with an average annual growth rate of 8.3% since 1983 (Barlow et al. 1997). Sea lions are also found in west- ern Mexico from the U.S.-Mexico border to central Mexico, and in the Gulf of California (Le Boeuf et al. 1983), but there is no current abundance estimate for sea lions south of the U.S.-Mexico border.
Numbers of sea lions in southern California fluctu- ate during the year. More are present at rookeries (fig. 1) during the summer breeding season, and fewer during autumn and winter. Adult females generally remain in the area throughout the year to nurse their pups, and ju- veniles either remain near rookeries or travel north or south along the coast (Bartholomew 1967; Huber 1991). After the summer breeding season, subadult and adult males from U.S. rookeries migrate north (some as far as British Columbia, Canada) and those from western Baja California, Mexico, migrate into and through southern California (Bartholomew 1967; Bigg 1988).
Studies at San Miguel Island have shown that adult female sea lions forage between 10 and 100 kni (mean = 54.2 km, SD = 32.4 km, n = 9) from the rookery (Antonelis et al. 1990), and dwe to average depths of 31.1 to 98.2 m, with maximum dlves between 196 and 274 m (Feldkamp et al. 1991). Laboratory studies indicated that sea lions travel at an estimated speed of 10.8 km/hr (Feldkamp 1985), and that one- and two-year-old sea lions have an initial defecation time averaging 4.2 hours (Helm 1984). Adult females spend 1.6-1.9 days on land and 1.7-4.7 days at sea (Heath et al. 1991). Feeding experiments on California sea lions that were fed mar- ket squid revealed that (1) 80% of squid beaks (i.e., mandibles) pass through the gastrointestinal tract within 48 hours and 95% within 96 hours; (2) squid remains may be spewed within 20 to 48 hours; and (3) all beaks are not regurgitated when squid remains are spewed- some pass through the gastrointestinal tract (Hawes 1983; Orr 1998). It is reasonable to assume, therefore, that scat and spewing samples collected at haul-outs represent a sample of feeding within 100 km of the haul-out site.
LOWRY AND CARRETTA: MARKET SQUID AS SEA LION PREY CalCOFl Rep., Vol. 40, 1999
34"
33"
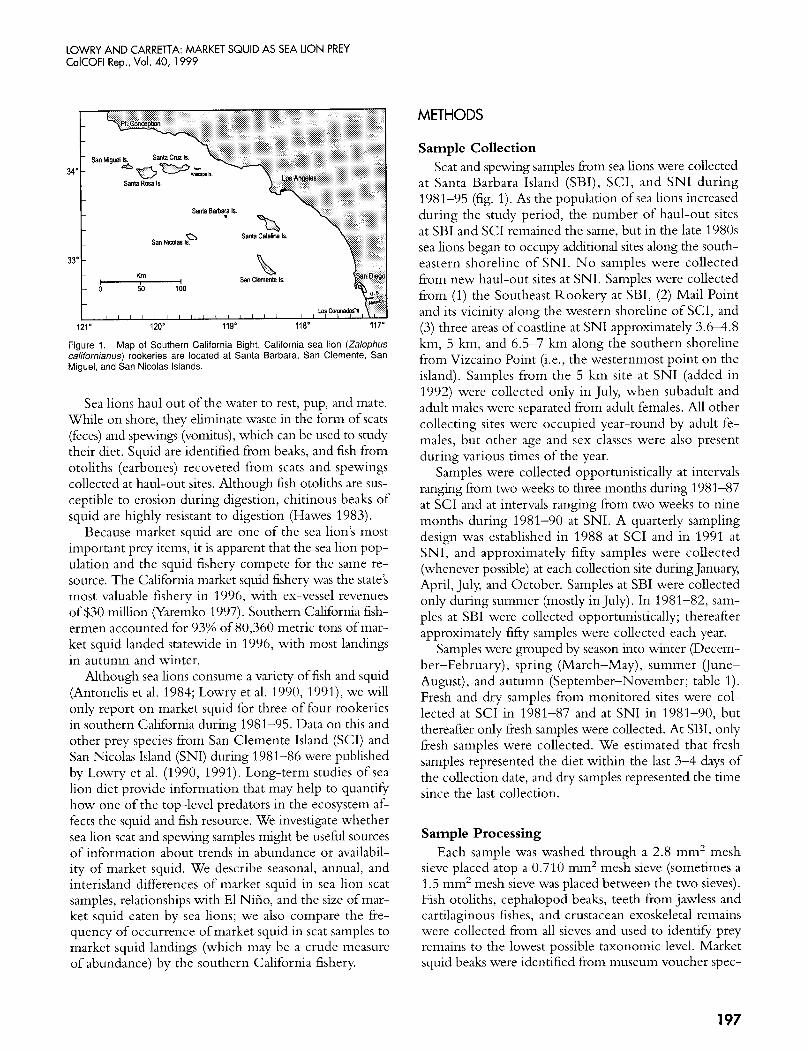
Figure 1. Map of Southern California Bight. California sea lion (Zalophus californianus) rookeries are located at Santa Barbara, San Clemente, San Miguel, and San Nicolas Islands.
Sea lions haul out of the water to rest, pup, and mate. While on shore, they eliminate waste in the form of scats (feces) and spewings (vomitus), whch can be used to study their diet. Squid are identified from beaks, and fish from otoliths (earbones) recovered from scats and spewings collected at haul-out sites. Although fish otoliths are sus- ceptible to erosion during digestion, chitinous beaks of squid are highly resistant to digestion (Hawes 1983).
Because market squid are one of the sea lion's most important prey items, it is apparent that the sea lion pop- ulation and the squid fishery compete for the same re- source. The California market squid fishery was the state's most valuable fishery in 1996, with ex-vessel revenues of $30 d o n (Yaremko 1997). Southern Cahfornia fish- ermen accounted for 93% of 80,360 metric tons of mar- ket squid landed statewide in 1996, with most landmgs in autumn and winter.
Although sea lions consume a variety of fish and squid (Antonelis et al. 1984; Lowry et al. 1990, 1991), we will only report on market squid for three of four rookeries in southern California during 1981-95. Data on this and other prey species from San Clemente Island (SCI) and San Nicolas Island (SNI) during 1981-86 were published by Lowry et al. (1990, 1991). Long-term studies of sea lion diet provide information that may help to quantify how one of the top-level predators in the ecosystem af- fects the squid and fish resource. We investigate whether sea lion scat and spewing samples might be useful sources of information about trends in abundance or availabil- ity of market squid. We describe seasonal, annual, and interisland differences of market squid in sea lion scat samples, relationships with El Niiio, and the size of mar- ket squid eaten by sea lions; we also compare the fre- quency of occurrence of market squid in scat samples to market squid landings (which may be a crude measure of abundance) by the southern California fishery.
METHODS
Sample Collection Scat and spewing samples from sea lions were collected
at Santa Barbara Island (SBI), SCI, and SNI during 1981-95 (fig. 1). As the population of sea lions increased during the study period, the number of haul-out sites at SBI and SCI remained the same, but in the late 1980s sea lions began to occupy adhtional sites along the south- eastern shoreline of SNI. No samples were collected from new haul-out sites at SNI. Samples were collected from (1) the Southeast Rookery at SBI, (2) Mail Point and its vicinity along the western shoreline of SCI, and (3) three areas of coastline at SNI approximately 3.6-4.8 km, 5 km, and 6.5-7 km along the southern shoreline from Vizcaino Point (i.e., the westernmost point on the island). Samples from the 5 km site at SNI (added in 1992) were collected only in July, when subadult and adult males were separated from adult females. All other collecting sites were occupied year-round by adult fe- males, but other age and sex classes were also present during various times of the year.
Samples were collected opportunistically at intervals ranging from two weeks to three months during 1981-87 at SCI and at intervals ranging from two weeks to nine months during 1981-90 at SNI. A quarterly sampling design was established in 1988 at SCI and in 1991 at SNI, and approximately fifty samples were collected (whenever possible) at each collection site during January, April, July, and October. Samples at SBI were collected only during summer (mostly in July). In 1981-82, sam- ples at SBI were collected opportunistically; thereafter approximately fifty samples were collected each year.
Samples were grouped by season into winter (Decem- ber-February), spring (March-May), summer (June- August), and autumn (September-November; table 1). Fresh and dry samples from monitored sites were col- lected at SCI in 1981-87 and at SNI in 1981-90, but thereafter only fiesh samples were collected. At SBI, only fresh samples were collected. We estimated that fresh samples represented the diet within the last 3-4 days of the collection date, and dry samples represented the time since the last collection.
Sample Processing Each sample was washed through a 2.8 mm2 mesh
sieve placed atop a 0.710 mm2 mesh sieve (sometimes a 1.5 mm2 mesh sieve was placed between the two sieves). Fish otoliths, cephalopod beaks, teeth from jawless and cartilaginous fishes, and crustacean exoskeletal remains were collected from all sieves and used to identify prey remains to the lowest possible taxonomic level. Market squid beaks were identified from museum voucher spec-
197
L O W R Y AND CARREllA: MARKET SQUID AS SEA LION PREY CalCOFl Rep., Vol. 40, 1999
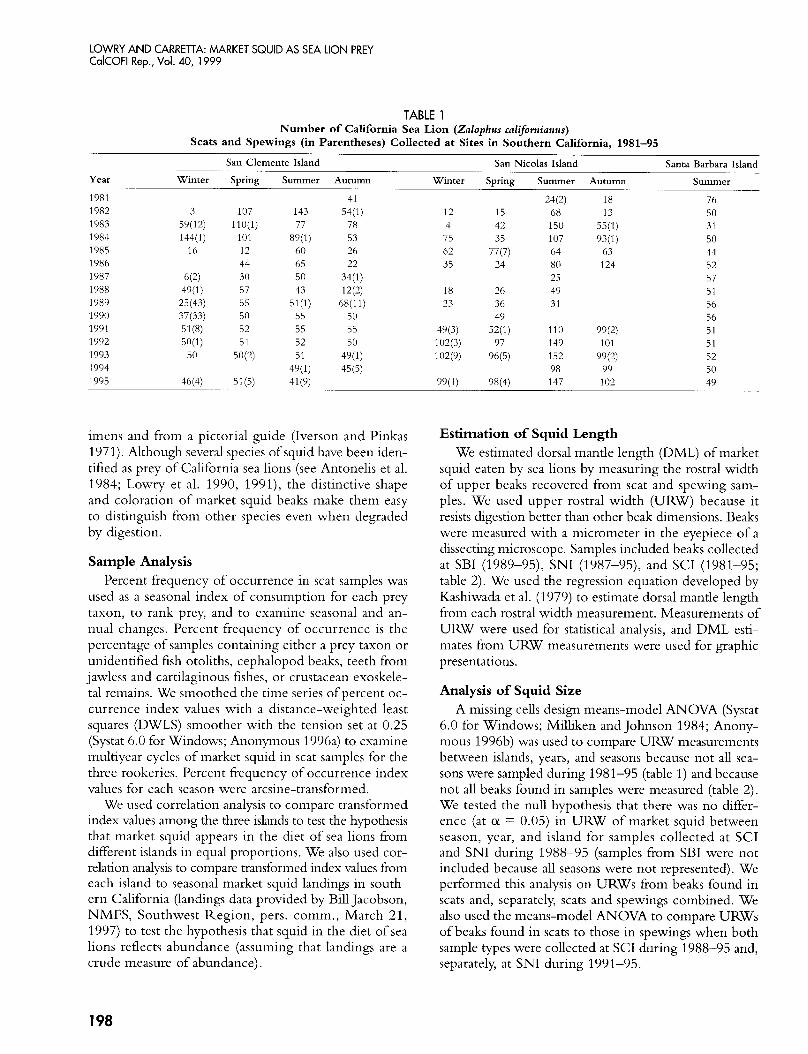
TABLE 1 Number of California Sea Lion (Zafophus californianus)
Scats and Spewings (in Parentheses) Collected at Sites in Southern California, 1981-95
San Clemente Island San Nicolas Island Santa Barbara Island Year
1981 1982 1983 1984 1985 1986 1987 1988 1989 1990 1991 1992 1993 1994 1995
~
~
Winter Spring Summer Autumn Winter Spring Summer Autumn Summer
3 59(12) 144(1)
16
6(2) 49U)
37(33) 51(8) 50(1)
25(43)
5 0
46(4)
107
101 12 44 30 57 55 50 52 51
110(1)
W 2 )
51 (5) ~
143 77
60 65 50 43
51(1) 55 55 52 51
89U)
49U) 41(9)
41
78 53 26 22
54U)
34U) 12(2)
68(11) 50 55 50
49U) 45(5)
imens and from a pictorial guide (Iverson and Pinkas 1971). Although several species of squid have been iden- tified as prey of California sea lions (see Antonelis et al. 1984; Lowry et al. 1990, 1991), the distinctive shape and coloration of market squid beaks make them easy to distinguish from other species even when degraded by digestion.
Sample Analysis Percent frequency of occurrence in scat samples was
used as a seasonal index of consumption for each prey taxon, to rank prey, and to examine seasonal and an- nual changes. Percent frequency of occurrence is the percentage of samples containing either a prey taxon or unidentified fish otoliths, cephalopod beaks, teeth from jawless and cartilaginous fishes, or crustacean exoskele- tal remains. We smoothed the time series of percent oc- currence index values with a distance-weighted least squares (DWLS) smoother with the tension set at 0.25 (Systat 6.0 for Windows; Anonymous 1996a) to examine multiyear cycles of market squid in scat samples for the three rookeries. Percent frequency of occurrence index values for each season were arcsine-transformed.
We used correlation analysis to compare transformed index values among the three islands to test the hypothesis that market squid appears in the diet of sea lions from different islands in equal proportions. We also used cor- relation analysis to compare transformed index values from each island to seasonal market squid landings in south- ern California (landings data provided by Bill Jacobson, NMFS, Southwest Region, pers. comm., March 21, 1997) to test the hypothesis that squid in the diet of sea lions reflects abundance (assuming that landings are a crude measure of abundance).
12 4 75 62 35
18 23
49(3) 102(3) 102(9)
99U) ~
24P) 15 68 42 150 35 107
77(7) 64 24 80
25 26 49 36 31 49
97 149
98 98(4) 147
W 1 ) 110
96(5) 152
18 13
55U) 93U)
63 124
99P)
99P) 101
99 102
76 50 31 50 44 52 57 51 56 56 51 51 52 50 49
Estimation of Squid Length We estimated dorsal mantle length (DML) of market
squid eaten by sea lions by measuring the rostral width of upper beaks recovered from scat and spewing sam- ples. We used upper rostral width (URW) because it resists hgestion better than other beak dimensions. Beaks were measured with a micrometer in the eyepiece of a dissecting microscope. Samples included beaks collected at SBI (1989-95), SNI (1987-95), and SCI (1981-95; table 2). We used the regression equation developed by Kashiwada et al. (1979) to estimate dorsal mantle length from each rostral width measurement. Measurements of URW were used for statistical analysis, and DML esti- mates from URW measurements were used for graphic presentations.
Analysis of Squid Size A missing cells design means-model ANOVA (Systat
6.0 for Windows; Milliken and Johnson 1984; Anony- mous 1996b) was used to compare URW measurements between islands, years, and seasons because not all sea- sons were sampled during 1981-95 (table l) and because not all beaks found in samples were measured (table 2). We tested the null hypothesis that there was no differ- ence (at a = 0.05) in URW of market squid between season, year, and island for samples collected at SCI and SNI during 1988-95 (samples from SBI were not included because all seasons were not represented). We performed this analysis on URWs from beaks found in scats and, separately, scats and spewings combined. We also used the means-model ANOVA to compare URWs of beaks found in scats to those in spewings when both sample types were collected at SCI during 1988-95 and, separately, at SNI during 1991-95.

LOWRY AND CARREllA: MARKET SQUID AS SEA LION PREY CalCOFl Rep., Vol. 40, 1999
TABLE 2 Number of Beaks Measured from Scats and Spewings (in Parentheses) for Estimating
Dorsal Mantle Length of Market Squid (Loligo opalescens) Consumed by California Sea Lions, 1981-95
San Clemente Island San Nicolas Island Santa Barbara Island
Year Winter Sunns? Summer Autumn Winter Spring Summer Autumn Summer
1981 1982 1983 1984 1985 1986 1987 1988 1989 1990 1991 1992 1993 1994 1995
54(98)
74(22)
152 443 442 37 1
274(3) 274
736
39 3 1
317 13 13 53 167 112 10
1(34)
145
434 70 1
47 27 42 25 181 23 31 10 51
56(38) 154
127 16 40
4
42 87
216 159 171 91 235 247
10 19 6 62 96 2 78
250 408 221(83) 748 995 627 11 120 1,332 718 133(4) 400 899
31 446 1,048 671 702 556
434 335 163 10 35 88 95
TABLE 3 Frequency of Occurrence of Common Prey Found in California Sea Lion Scat Collected Seasonally at San Clemente
(n = 2,543) and San Nicolas Islands (n = 2,980), and in Summer at Santa Barbara Island (n = 736), 1981-95
Scientific name
Enyaulis mordax Lolip opalescens Merluccius produrtus Tvachurus symmetricus Sebastes jordani Pleuroncodes planipes Scom ber japonicus Sardinops sagax
Common name
Northern anchovy Market squid Pacific whiting Jack mackerel Shortbelly rockfish Pelagic red crab Pacific mackerel Pacific sardine
San Clemente Island San Nicolas Island Santa Barbara Island
n
1,155 895 63 1 63 1 328 301 264 122
%
45.4 35.1 24.8 24.8 12.8 11.8 10.3 4.7
~
n
897 1,323
93 1 659 423 244 463 37 1
%
29.4 44.3 31.2 22.1 14.1 8.1
15.5 12.4
n
360 315 290 147 100 72 59 73
Yo
48.9 42.7 39.4 19.9 13.5 9.7 8.0 9.9
We examined size of squid within individual scat and spewing samples to see if scat and spewing samples had beaks &om sidar-sized squid. We assigned a unique sam- ple code number to each scat and spewing sample. There were insufficient spewing samples from most collections for this analysis (table 1), but seven collections had an adequate number of spewing samples: (1) winter 1989 at SCI, (2) autumn 1989 at SCI, (3) winter 1990 at SCI, (4) winter 1991 at SCI, (5) autumn 1994 at SCI, (6) summer 1995 at SCI, and (7) winter 1993 at SNI. We used a nested ANOVA for each collection to test the hypothesis that there was no difference (at (Y = 0.05) in URW of squid found between sample types (i.e., scats and spewings) and individual samples (sample was nested within sample type). Graphic representations of these comparisons were chosen for two of the seven collec- tions (autumn 1989 at SCI and winter 1990 at SCI).
RESULTS
Market Squid in the Diet of California Sea Lions Market squid was found in 35.1% to 44.3% of scat
samples, and represented the most common or second
most common prey taxon found at three southern California rookeries during 1981-95 (table 3 ) . Other common prey of sea lions were northern anchovy (Engruulis mordax); Pacific whiting (Merluccius productus); jack mackerel (Euchurus symmetricus); shortbelly rockfish (Sebustes jorduni); Pacific mackerel (Scomber japonicus); Pacific sardine (Surdinops sugax); and pelagic red crab (Pleuroncodes plunipes, consumed only during El Niiio periods). Sea lions ate market squid year-round, but pre- dominantly during autumn and winter (table 4).
Smoothed seasonal percent occurrence index data in- dicated fewer squid in sea lions' diet during and imme- diately after moderate and severe El Niiio episodes (1983-84 and 1992-93) and more squid in 1989-90 and 1995 (fig. 2). The sharpest decline occurred in 1984 and the first half of 1985, during or just after the 1983-84 El Niiio period in California. We found market squid in scat samples of sea lions from different rookeries in sirmlar proportions. Percent fi-equency of occurrence val- ues for market squid in scat samples from SCI were pos- itively correlated with those from SNI (Y = 0.78) and SBI ( r = 0.82), and samples from SNI were positively correlated with samples from SBI (Y = 0.85). Seasonal
LOWRY AND CARREllA: MARKET SQUID AS SEA LION PREY CalCOFl Rep., Vol. 40, 1999
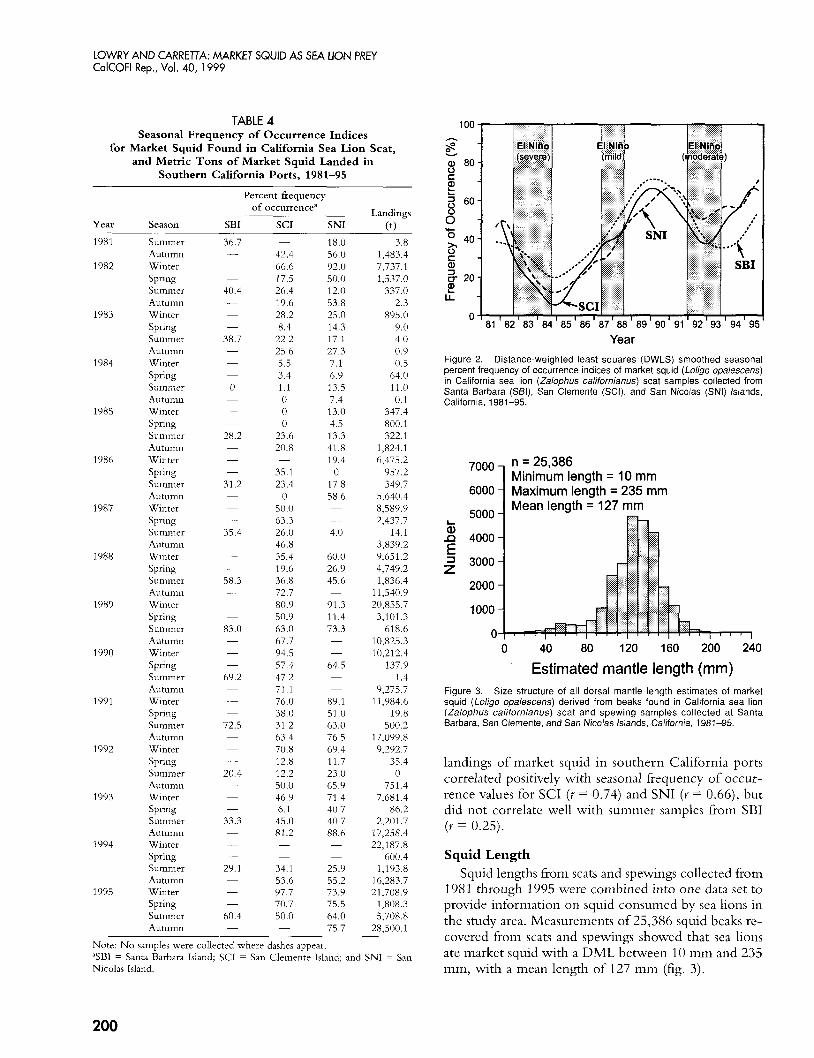
TABLE 4 Seasonal Frequency of Occurrence Indices
for Market Squid Found in California Sea Lion Scat, and Metric Tons of Market Squid Landed in
Southern California Ports, 1981-95
Year Season SBI
1981
1982
1983
1984
1985
1986
1987
1988
1989
1990
1991
1992
1993
1994
1995
Summer Autumn Winter Spring Summer Autumn Winter Spring Summer Autumn Winter Spring Summer Autumn Winter Spring Summer Autumn Winter Spring Summer Autumn Winter Spring Summer Autumn Winter Spring Summer Autumn Winter Spring Summer Autumn Winter Spring Summer Autumn Winter Spring Summer Autumn Winter Spring Summer Autumn Winter Spring Summer Autumn Winter Spring Summer Autumn Winter Spring Summer Autumn
Percent frequency of occurrencea
SCI -
42.4 66.6 17.5 26.4 19.6 28.2 8.4
22.2 25.6 5.5 3.4 1.1 0 0 0
23.6 20.8
35.1 23.4
0 50.0 63.3 26.0 46.8 35.4 19.6 36.8 72.7 80.9 50.9 63.0 67.7 94.5 57.4 47.2 71.1 76.0 38.0 31.2 63.4 70.8 12.8 12.2 50.0 46.9 6.1 45.0 81.2
-
- -
34.1 53.6 97.7 70.7 50.0 -
- Landings SNI (t)
18.0 56.0 92.0 50.0 12.0 53.8 25.0 14.3 17.1 27.3 7.1 6.9 13.5 7.4 13.0 4.5 13.3 41.8 19.4
0 17.8 58.6 -
-
4.0
60.0 26.9 45.6
91.3 11.4 73.3
-
-
-
-
64.5 -
-
89.1 51 .0 63.0 76.5 69 4 11.7 23.0 65.9 71.4 40.7 40.7 88.6 - -
25.9 55.2 73.9 75.5 64.0 75.7
3.8 1,483.4 7,737.1 1,537.0
337.0 2.3
895.0 9.0 4.0 0.9 0.5
64.0 11.0 0.1
347.4 800.1 322.1
1,824.1 6,475.2
957.2 349.7
5,640.4 8,589.9 2,437.7
14.1 3,839.2 9,651.2 4,749.2 1,836.4
11,540.9 20,855.7 3,101.3
618.6 10,825.3 10,212.4
137.9 1.4
9,275.7 1 1,984.6
19.8 500.2
17,099.8 9,292.7
35.4 0
751.4 7,681.4
86.2 2,201.7
17,258.4 22,187.8
600.4 1,193.8
16,283.7 21,708.9
1,808.3 5,708.8
28,500.1
Note: No samples were collected where dashes appear 5 B I = Santa Barbara Island; SCI = San Clemente Island; and SNI = San Nicolas Island.
Year Figure 2. Distance-weighted least squares (DWLS) smoothed seasonal percent frequency of occurrence indices of market squid (Loligo opalescens) in California sea lion (Zalophus californianus) scat samples collected from Santa Barbara (SBI), San Clernente (SCI), and San Nicolas (SNI) Islands, California, 1981-95.
n = 25,386 Minimum length = 10 mm
7000 6000 rl Maximum length = 235 mrn
5000 & E
4000
2 3000
2000
looo] 0
Mean length 127 rnm
0 40 80 120 160 200 240
Estimated mantle length (mm) Figure 3. Size structure of all dorsal mantle length estimates of market squid (Loligo opalescens) derived from beaks found in California sea lion (Zalophus californianus) scat and spewing samples collected at Santa Barbara, San Clemente, and San Nicolas Islands, California, 1981-95.
landings of market squid in southern California ports correlated positively with seasonal frequency of occur- rence values for SCI (Y = 0.74) and SNI ( Y = 0.66), but did not correlate well with summer samples from SBI ( Y = 0.25).
Squid Length Squid lengths from scats and spewings collected from
1981 through 1995 were combined into one data set to provide information on squid consumed by sea lions in the study area. Measurements of 25,386 squid beaks re- covered from scats and spewings showed that sea lions ate market squid with a DML between 10 mm and 235 mm, with a mean length of 127 mm (fig. 3).
200
LOWRY AND CARRETTA: MARKET SQUID AS SEA LION PREY CalCOFl Rep., Vol. 40, 1999
n 2 4 0 _ I ---- SNI E E SNI - v 200- ----
SCI 5
I I I I I I I I I I I . n 2 4 0 - E E 5
I I I I ' I I I I ' -
AUTUMN - SCI SUMMER 200: - cs)
SBI - - - - . cs)
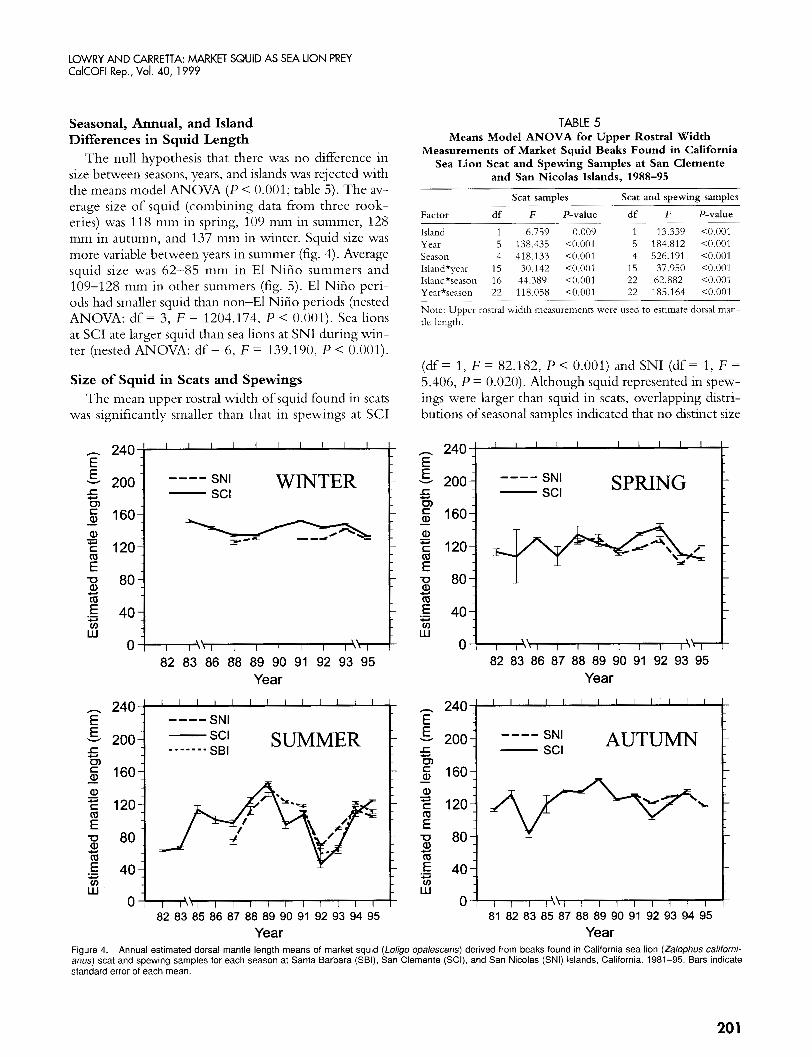
Seasonal, Annual, and Island Differences in Squid Length
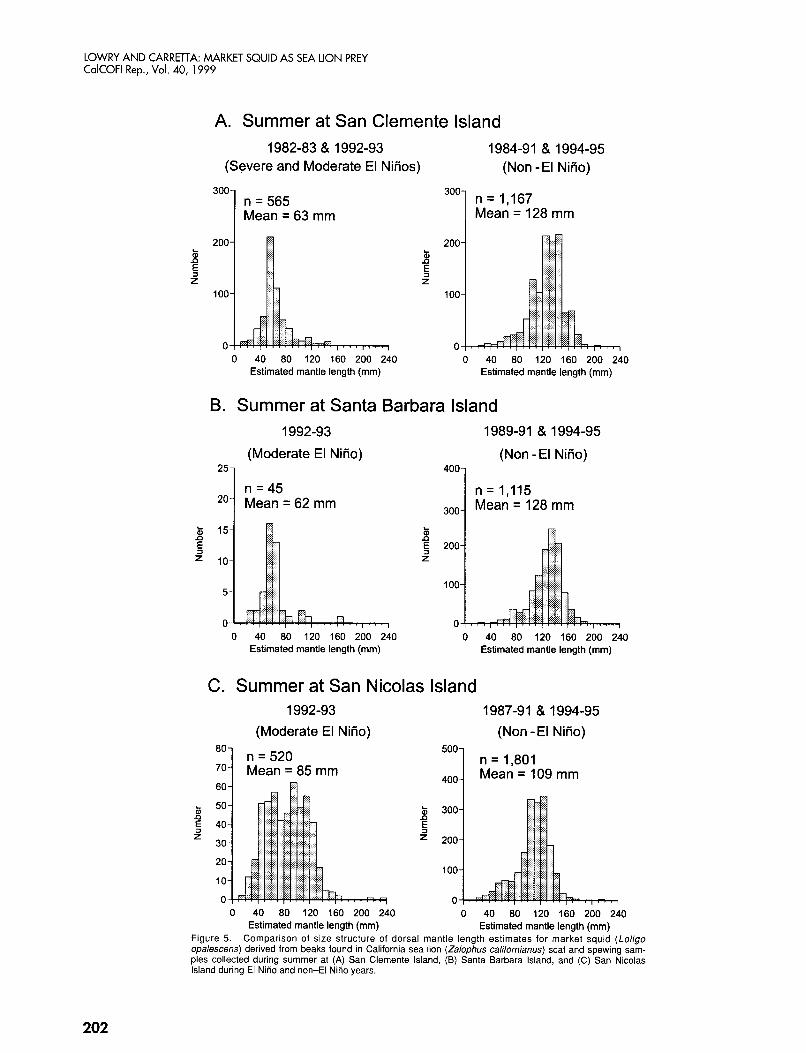
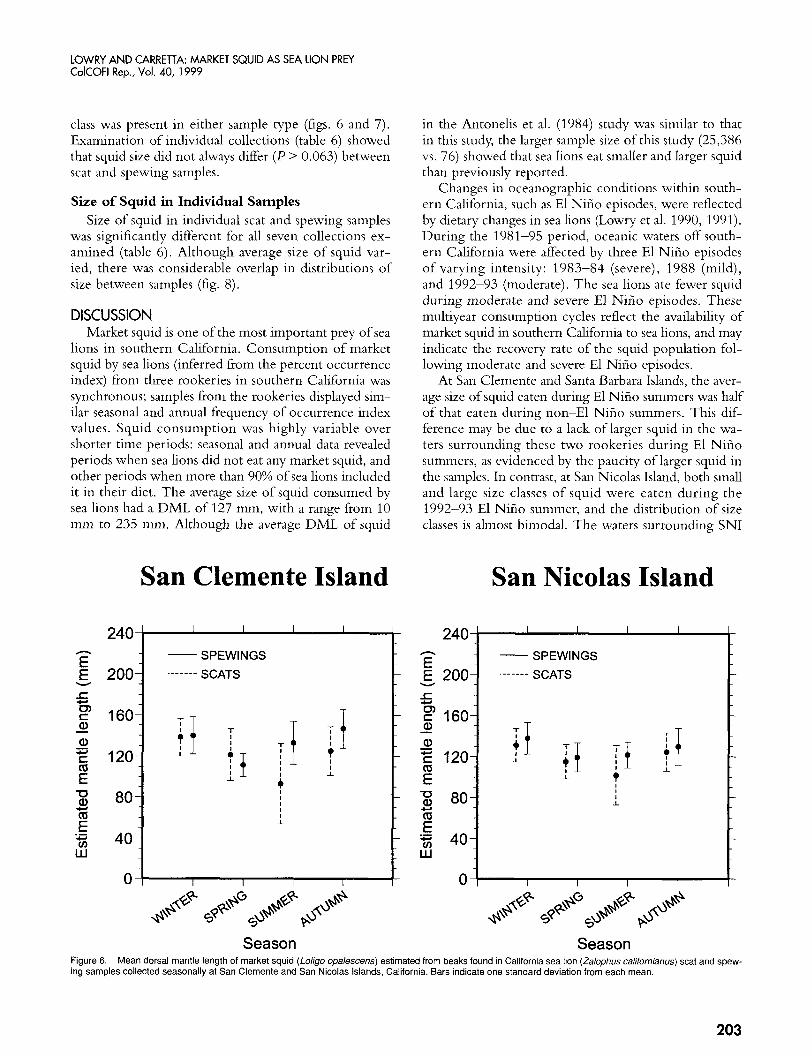
The null hypothesis that there was no difference in size between seasons, years, and islands was rejected with the means model ANOVA ( P < 0.001; table 5). The av- erage size of squid (combining data from three rook- eries) was 118 mm in spring, 109 min in summer, 128 mm in autumn, and 137 mm in winter. Squid size was more variable between years in summer (fig. 4). Average squid size was 62-85 mm in El Niiio summers and 109-128 mm in other summers (fig. 5). El Niiio peri- ods had smaller squid than non-El Niiio periods (nested ANOVA: df = 3, F = 1204.174, P < 0,001). Sea lions at SCI ate larger squid than sea lions at SNI during win- ter (nested ANOVA: df = 6, F = 139.190, P < 0.001).
Size of Squid in Scats and Spewings The mean upper rostral width of squid found in scats
was significantly smaller than that in spewings at SCI
e 240
-
-
5 5 160
E 120 E
cs)
a,
m
0 s
SNI WINTER ---- SCI -
s \ \ \ \
I I ' \ I I I I I I I I I I 1 0 I I I I ' \ I I I 1 I I I I I
82 83 86 88 89 90 91 92 93 95 Year
TABLE 5 Means Model ANOVA for Upper Rostral Width
Measurements of Market Squid Beaks Found in California Sea Lion Scat and Spewing Samples at San Clemente
and San Nicolas Islands, 1988-95
Scat samples Scat and spewing samples
Factor df F P-value df F P-value
Island 1 6.759 0.009 1 13.339 <0.001 Year 5 138.435 <0.001 5 184.812 <0.001 Season 4 418.133 <0.001 4 526.191 <0.001 Island*year 15 30.142 <0.001 15 37.950 <0.001 Island*season 16 44.389 <0.001 22 62.882 <0.001 Year*season 22 118.058 <0.001 22 185.164 <0.001
Note: Upper rostral width measurements were used to estimate dorsal man- tle length.
(df = 1, F = 82.182, P < 0.001) and SNI (df = 1, F = 5.406, P = 0.020). Although squid represented in spew- ings were larger than squid in scats, overlapping distri- butions of seasonal samples indicated that no distinct size
240
E SPRING SNI SCI
2001 ---- - 1604 t
80 i 82 83 86 87 88 89 90 91 92 93 95
Year
20 1
LOWRY AND CARRETTA: MARKET SQUID AS SEA LION PREY CalCOFl Rep., Vol. 40, 1999
A. Summer at San Clemente Island 1982-83 & 1992-93 1984-91 & 1994-95
(Severe and Moderate El NiAos) (Non -El NiAo)
n = 565 Mean = 63 rnrn
n = 1,167 Mean = 128 rnrn
0 40 80 120 160 200 240 0 40 80 120 160 200 240 Estimated mantle length (mm) Estimated mantle length (mm)
B. Summer at Santa Barbara Island 1992-93 1989-91 & 1994-95
(Moderate El Niiio) (Non -El NiAo) 4001 251
n =45 2o Mean=62rnrn 1 n = 1,115
Mean = 128 mm
0 40 80 120 160 200 240 Estimated mantle length (mm)
0 40 80 120 160 200 240 Estimated mantle length (mm)
C. Summer at San Nicolas Island 1992-93
(Moderate El NiAo) 1987-91 & 1994-95
(Non -El NiAo) 500
Mean = 109 rnrn 400
5 300 n s = 200
100
0 0 40 80 120 160 200 240 0 40 80 120 160 200 240
Estimated mantle length (mm) Estimated mantle length (mm) Figure 5. Comparison of size structure of dorsal mantle length estimates for market squid (Loligo opalescens) derived from beaks found in California sea lion (Zalophus californianus) scat and spewing sam- ples collected during summer at (A) San Clemente Island, (B) Santa Barbara Island, and (C) San Nicolas Island during El NiAo and non-El NiAo years.
202
LOWRY AND CARREllA: MARKET SQUID AS SEA LION PREY CdCOFl Rep., Vol. 40, 1999
240
200:
160-
120-
80-
40-
n .
class was present in either sample type (figs. 6 and 7). Examination of individual collections (table 6) showed that squid size did not always differ ( P > 0.063) between scat and spewing samples.
Size of Squid in Individual Samples Size of squid in individual scat and spewing samples
was significantly different for all seven collections ex- amined (table 6). Although average size of squid var- ied, there was considerable overlap in distributions of size between samples (fig. 8).
I I I I
- SPEWINGS
SCATS -
- 7 Ti T T 1 t i -
I o f I I ; I
I
+ I
I
- I I I I
-
DISCUSSION Market squid is one of the most important prey of sea
lions in southern California. Consumption of market squid by sea lions (inferred from the percent occurrence index) from three rookeries in southern California was synchronous; samples from the rookeries displayed sim- ilar seasonal and annual frequency of occurrence index values. Squid consumption was highly variable over shorter time periods: seasonal and annual data revealed periods when sea lions did not eat any market squid, and other periods when more than 90% of sea lions included it in their diet. The average size of squid consumed by sea lions had a DML of 127 mm, with a range from 10 mm to 235 mm. Although the average DML of squid
n
E E 200- 5 F 160-
- a F 120-
80-
- 40-
W
a -
i!
.- 2 c,
v) W
n
n
E E 5 W
m t: a -
- - SPEWINGS
SCATS -
-
i f T i - + I I I
t I
I I I
-
-
in the Antonelis et al. (1984) study was similar to that in this study, the larger sample size of this study (25,386 vs. 76) showed that sea lions eat smaller and larger squid than previously reported.
Changes in oceanographic conditions within south- ern California, such as El Niiio episodes, were reflected by dietary changes in sea lions (Lowry et al. 1990, 1991). During the 1981-95 period, oceanic waters off south- ern California were affected by three El Niiio episodes of varying intensity: 1983-84 (severe), 1988 (mild), and 1992-93 (moderate). The sea lions ate fewer squid during moderate and severe El Niiio episodes. These multiyear consumption cycles reflect the availability of market squid in southern Cahfornia to sea lions, and may indicate the recovery rate of the squid population fol- lowing moderate and severe El Niiio episodes.
At San Clemente and Santa Barbara Islands, the aver- age size of squid eaten during El Niiio summers was half of that eaten during non-El Niiio summers. This dif- ference may be due to a lack of larger squid in the wa- ters surrounding these two rookeries during El Niiio summers, as evidenced by the paucity of larger squid in the samples. In contrast, at San Nicolas Island, both small and large size classes of squid were eaten during the 1992-93 El Niiio summer, and the distribution of size classes is almost bimodal. The waters surroundmg SNI
San Clemente Island San Nicolas Island
V I I I I I I V I I I 1
Season Season Figure 6. ing samples collected seasonally at San Clemente and San Nicolas Islands, California. Bars indicate one standard deviation from each mean.
Mean dorsal mantle length of market squid (Loligo opalescens) estimated from beaks found in California sea lion (Zalophus californianus) scat and spew-
203

LOWRY AND CARREllA: MARKET SQUID AS SEA LION PREY CalCOFl Rep., Vol. 40, 1999
A. AUTUMN 1989 AT SCI
SCATS SPEWINGS SCATS AND SPEWINGS 250 1
Mean = 144 mm L 200 n 0
s z 100
0 0 40 80 120 160 200 240 0 40 80 120 160 200 240 0 40 80 120 160 200 240 Estimated mantle length (mm) Estimated mantle length (mm) Estimated mantle length (mm)
WINTER 1990 AT SCI B. SCATS SPEWINGS SCATS AND SPEWINGS
1501 500 1 600 1 I n=442 4
8 100
E n
z 50
0 0 40 80 120 160 200 240 C
n = 1,346 Mean = 144 mm
) 40 80 I 2 0 I 6 0
500 1 n = Mean = 144 mm !
I 240
Estimated mantle length (mm) Estimated mantle length (mm) Estimated mantle length (mm)
Size structure of dorsal mantle length estimates of market squid derived from beaks found in California sea lion (Zalophus Cali- Figure 7. fornianus) scat and spewing samples collected at San Clemente Island, California, during ( A ) autumn 1989 and (B) winter 1990.
TABLE 6 Results of ANOVA Tests on Upper Rostral Width Measurements of Market Squid Beaks Recovered from
Individual California Sea Lion Scat and Spewing Samples at San Clemente Island (SCI) and San Nicolas Island (SNI)
Source of variation SS df MS F-ratio P-value Source of variation SS df MS F-ratio P-value Winter 1989 at SCI Winter 1993 at SNI Type” Sampleb (type)
Autumn 1989 at SCI
Error
Type Sample (type)
Error
Winter 1990 at SCI Type Sample (type)
Error
Winter 1991 at SCI Type Sample (type)
Error
0.631 0.631 23.908 <0.001 3.457 37 0.093 3.542 <0.001
72.083 2,733 0.026
0.796 0.796 30.355 <0.001 4.531 33 0.137 5.238 <0.001
23.068 880 0.026
0.028 0.028 1.108 0.293 2.584 53 0.049 1.951 <0.001
43.320 1,733 0.025
0.003 0.003 0.080 0.777 1.845 22 0.084 2.679 <0.001
20.883 667 0.031
Type 0.139 Sample (type) 3.894
Error 29.758
Autumn 1994 at SCI
Sample (type) 1.300 Error 10.577
Summer 1995 at SCI Type 0.082 Sample (type) 1.432
Error 10.817
Type 0.648
0.139 5.262 0.022 47 0.083 3.126 4 . 0 0 1
1,123 0.026
0.648 2o.478 <o.oni 17 0.076 2.416 <0.001
334 0.032
0.082 3.464 0.063 22 0.065 2.744 <0.001
456 0.024
”Scats and spewings. bIndividual samples (nested within scats and spewings).
204

LOWRY AND CARREllA: MARKET SQUID AS SEA LION PREY CalCOFl Rep., Vol. 40, 1999
SCATS n E 240 I ' ' ' ' I ' ' ' ' I ' ' " I " " I ' ' " I ' " "
Y AUTUMN 1989 AT SCI 5 200
Cr, 160 m c
Q)
1 i 0 5 10 15 20 25 30
Sample code number
SPEWINGS n E 2 4 0 ' ' I ' I ' I ' I ' I ' I ' I
v AUTUMN 1989 AT SCI
Sample code number
n
Y I I
$ 0 3 25 30 35 40 45 50 55 60
Sample code number Sample code number
Figure 8. Mean dorsal mantle length of market squid (Loligo opalescens) estimated from beaks found in individual California sea lion (Zalophus californianus) scat and spewing samples collected at San Clemente Island (SCI), California, during autumn 1989 and winter 1990. Bars indicate one standard deviation from each mean.
were relatively cooler and more productive than the waters around SBI and SCI during summer 1992 and 1993 (Hayward et al. 1994), and it is possible that larger market squid moved to more productive waters in re- sponse to El Niiio. Shifts in the distribution of pelagic forage species in response to El Niiio episodes, and the negative effects of these prey shifts on sea lion popula- tions have been well documented (Costa et al. 1991; DeLong et al. 1991; Feldkamp et al. 1991; Francis and Heath 1991).
The fact that small size classes were also consumed at San Nicolas Island during the 1992-93 El Niiio may reflect a need for sea lions to augment their diet with smaller sizes of prey (and alternative species) that would be ignored during years of plentiful prey. Alternative hypotheses that may partially explain the smaller size
classes of market squid eaten during El Niiio summers are (1) oceanographic changes associated with El Niiio result in a temporal shift (delay) in the spawning cycle of market squid; and (2) growth rates are slowed as a result of nutritional stress caused by declines in prey for- age of market squid.
The percentage of scat samples with market squid yields the frequency of occurrence index which depicts sea lion consumption and the availability of squid to sea lions. The close correlation of this index to market squid landings in southern California (a crude measure of abundance) implies that the index may indicate mar- ket squid abundance. Spewings are not included in this index because the same animal may have deposited both sample types on the collection grounds. A better oc- currence index might include lenses and squid pens (i.e.,
205
LOWRY AND CARREllA: MARKET SQUID AS SEA LION PREY CalCOFl Rep., Vol. 40, 1999
gladius) with beaks, because beaks are sometimes absent in scat samples (Bigg and Fawcett 1985).
Length-composition data showed significant differ- ences between size of squid found in scats and in spew- ing. These hfferences were very small and were probably detected because of the large sample size and high sta- tistical power. Differences in average size of squid found in these samples are likely to have little or no biological importance. Therefore, we derived the size structure of the market squid consumed by sea lions from beaks col- lected from both scats and spewings.
We have not attempted to estimate the biomass of market squid or other species eaten by California sea lions. Estimating biomass consumption by sea lions in southern California would be difficult for several rea- sons. (1) The population of sea lions fluctuates through- out the year. (2) The percentage of market squid in the diet of sea lions is highly variable through time. (3 ) Although timing, length, and distance of foraging trips are known for adult female sea lions (Feldkamp et al. 1989; Heath et al. 1991), they are not known for juveniles or subadult and adult males. (4) Consumption by age and sex is not documented. (5) Although beaks have been found to resist digestion (Hawes 1983), degra- dation rates of hard parts for other prey species must be determined. Once this information is known, models can be developed for estimating consumption of market squid and other species of commercial value that are preyed on by sea lions for a given region.
There are problems with using California sea lions to sample prey populations that commonly occur in their diet. First, presence-absence data (i.e., percent frequency of occurrence) is not a good index of abundance be- cause it cannot go beyond 100% due to nonlinearity. Special modeling approaches to estimate population abun- dance, such as that used for sardine by Mangel and Smith (1990), would have to be developed for sea lion scat pres- ence-absence data to index abundance of fish and squid. Second, scat and spewing samples have to be indepen- dent if they are to be used to predict size structure of squid and fish populations. There is no way to deter- mine from scat and spewing samples if a sea lion, or a group of sea lions, fed on the same school of squid (or fish) or on multiple schools during a foraging trip, nor is it possible to determine where they foraged. The dif- ference in sizes of squid in individual scat and spewing samples suggests that scat and spewing samples are in- dependent. Also, time differences in deposition of sam- ples and their location a t the rookery may reflect sea lions’ foraging on different schools.
ACKNOWLEDGMENTS We would like to thank Jan Larson of the Natural
Resources Office, Naval Air Station North Island, San
Diego, for allowing us to collect samples at San Clemente Island; Ron Dow of the Environmental Division, Naval Air Station Point Mugu, for allowing us to collect sam- ples at San Nicolas Island; and to Kate Faulkner of the Channel Islands National Park, Ventura, for allowing us to collect samples at Santa Barbara Island. We are also indebted to many people for helping us collect and process samples: Sallie Beavers, Terry Farley, Lisa Ferm, Roberta Folk, John Francis, Jim Gilpatrick, Sandra Hawes, Carolyn Heath, Morgan Lynn, Chuck Oliver, Joyce Sisson, Dave Skordal, Brent Stewart, Jeannie Wexler, Robin Westlake, Pam Yochem, and others. Henry Orr helped with the art, and N. C. H. Lo with statistics. This paper was reviewed by Jay Barlow, Larry Jacobson, Marci Yaremko, and an anonymous reviewer.
LITERATURE CITED Anonymous. 1996a. SYSTAT 6.0 for Windows: Graphics. SPSS Inc., 444
North Michigan Avenue, Chicago, IL 6061 1. . 1996b. SYSTAT 6.0 for Windows: Statistics. SPSS Inc., 444 North
Michigan Avenue, Chicago, IL 6061 1. Antonelis, G. A,, Jr., C. H. Fiscus, and R. L. DeLong. 1984. Spring and
summer prey of California sea lions, Zulophus cal@rnianus, at San Miguel Island, California, 1978-79. Fish. Bull., U.S. 82:67-76.
Antonelis G. A,, Jr., B. S. Stewart, and W. F. Perryman. 1990. Foraging charactenstics of female northern fur seals (Callorhinus ursinus) and California sea lions (Zaluphus cal$wnianus). Can. J. Zool. 68:150-158.
Barlow, J.. K. A. Forney, P. S. Hill, R. L. Brownell Jr., J. V. Carretta, D. P. DeMaster, F. Julian, M. S. Lowry, T. Ragen, and R. R. Reeves. 1997. U S . Pacific marine mammal stock assessments: 1996. NOAA Tech. Memo. NMFS, NOAA-TM-NMFS-SWFSC-248, p. 223.
Bartholomew, G. A. 1967. Seal and sea lion populations of the Channel Islands. Iw Proceedings of the Symposium on the biology of the California Islands, R. N. Philbrick, ed. Santa Barbara, Calif.: Santa Barbara Botanic Garden, pp. 229-243.
Bigg, M. A. 1988. Status of the California sea lion, Zalophus cul$rnianus, in Canada. Can. Field-Nat. 102:307-314.
Bigg, M. A., and I . Fawcett. 1985. Two biases in diet detemlmation ofnorth- ern fur seals (Cullorhinus ursinus). In Marine mammals and fisheries, J. R. Beddington, K . J. H. Beverton, and D. M. Lavigne, eds. London: George M e n 8i Uiiwin, pp. 284-291,
Costa, D. P., G. A. Antonelis, and R. L. DeLong. 1991. Effects of El Nifio on the foraging energetics of the California sea lion. In Pinnipeds and El Nifio. Responses to environmental stress, F. Trillmich and K. A. Ono, eds. Berlin, Germany: Springer-Verlag, 293 pp.
DeLong, R. L., G. A. Antonelis, C. W. Oliver, B. S. Stewart, M. S. Lowry, and P. K. Yochem. 1991. Effects of the 1982-83 El Nifio on several population parameters and diet of California sea lions on the California Channel Islands. In Pinnipeds and El Nifio. Responses to environmental stress, F. Trillmich and K. A. Ono, eds. Berlin, Gemiany: Springer-Verlag, 293 pp.
Feldkamp, S. D. 1985. Swimming and diving in the California sea lion, Zalophus ral$irninnns. Ph.D. diss., Univ. Calif., San Diego, 175 pp.
Feldkamp, S. D., R. L. DeLong, and G. A. Antonelis. 1989. Divingpattems of California sea lion (Zalophus cu/@rniunus). Can. J . Zool. 67:872-883.
. 1991. Effects ofEl Nifio 1983 on the foraging patterns ofCalifornia sea lions (Zalophus cal@rnianus) near San Miguel Island, California. In Pinnipeds and El Nifio. Responses to environmental stress, F. Trillmich and K. A. Ono, eds. Berlin, Germany: Springer-Verlag. Pp. 146-155.
Francis, J., and C. Heath. 1991. Population abundance, pup mortality, and copulation frequency in the California sea lion in relation to the 1983 El Nifio on San Nicolas Island. In Pinnipeds and El Nifio. Responses to en- vironmental stress, F. Trillmich and K. A. Ono, eds. Berlin, Germany: Springer-Verlag. 293 pp.
Hawes, S. D. 1983. An evaluation of California sea lion scat samples as in- dicators ofprey importance. M.A. thesis, San Francisco State Univ. 50 pp.
206
LOWRY AND CARREllA: MARKET SQUID AS SEA LION PREY CalCOFl Rep., Vol. 40, 1999
Hayward, T. L,, A. W. Mantyla, R. J. Lynn, P. E. Smith, and T. K. Chereskin. 1994. The state of the California Current in 1993-1994. Calif. Coop. Oceanic Fish. Invest. Rep. 35:19-35.
Heath, C. B., K. A. Ono, D. J. Boness, and J. M. Francis. 1991. The influ- ence of El Nifio on female attendance patterns in the California sea lion. In Pinnipeds and El Nitio. Responses to environmental stress, F. Trillnllch and K. A. Ono, eds. Berlin, Germany: Springer-Verlag. Pp. 138-145.
Helm, R. C . 1984. Rate of digestion in three species of pinnipeds. Can. J.
Huber, H. R. 1991. Changes in the distribution of California sea lions north of the breeding rookeries during the 1982-83 El Nitio. In Pinnipeds and El Nifio. Responses to environmental stress, F. Trillmich and K. A. Ono, eds. Berlin, Germany: Springer-Verlag. Pp. 129-1 37.
Iverson, I. L. K., and L. Pinkas. 1971. A pictorial guide to beaks of certain eastern Pacific cephalopods. Calif Dep. Fish Game Fish Bull. 152:83-105.
Kashiwada J., C. W. Recksiek, and K. A. Karpov. 1979. Beaks of the mar- ket squid, Lo/@ opalescem, as tools for predator studies. CaM Coop. Oceanic Fish. Invest. Rep. 20:65-69.
LeBoeuf, B. J., D. Aurioles, R. Condit, C. Fox, R. Gisiner, R. Romero, and F. Sinsel. 1983. Size and distribution of the California sea lion pop- ulation in Mexico. Proc. Calif. Acad. Sci. 43:77-85.
ZOO^. 62:1751-1756.
Lowry, M. S., C. W. Oliver, C. Macky, and J. B. Wexler. 1990. Food habits of California sea lions, Zalophus californianus, at San Clemente Island, California, 1981-86. Fish. Bull., U.S. 88509-521.
Lowry, M. S., B. S. Stewart, C. B. Heath, P. K. Yochem, and J. M. Francis. 1991. Seasonal and annual variability in the diet of California sea lions, Zalophus cal@rnianus, at San Nicolas Island, California, 1981-86. Fish. Bull.,
Mangel, M., and P. E. Smith. 1990. Presence-absence sampling for fisheries management. Can. J. Fish. Aquat. Sci. 47:1875-1887.
Milliken, G. A,, and D. E. Johnson. 1984. Analysis of messy data, vol. 1: designed experiments. New York: Van Nostrand Reinhold.
Orr, A. J. 1998. Foraging characteristics and activity patterns of California sea lion (Zalophus californianus californianus) in the Bay of La Paz, Baja California Sur, Mexico. M.S. thesis, Calif. State Univ. Fresno, 116 pp.
Yaremko, M. 1997. Market squid. In Review of some California fisheries for 1996, F. Henry and D. Hanan, eds. Calif. Coop. Oceanic Fish. Invest. Rep. 38:ll.
U.S. 89:331-336.
207