market transparency report - tradeweb · market transparency report december 2015 ... fm a m j j a...
TRANSCRIPT
www.tradeweb.com
1177 Avenue of the Americas
New York, NY 10036
866.645.7524
© 2015 Tradeweb Markets LLC. All rights reserved.
Monthly Guide to the U.S. Retail Fixed Income Markets
Market Transparency Report
December 2015 As of December 31, 2015
© 2015 Tradeweb Markets LLC. All rights reserved. 2
Market Report
Overview
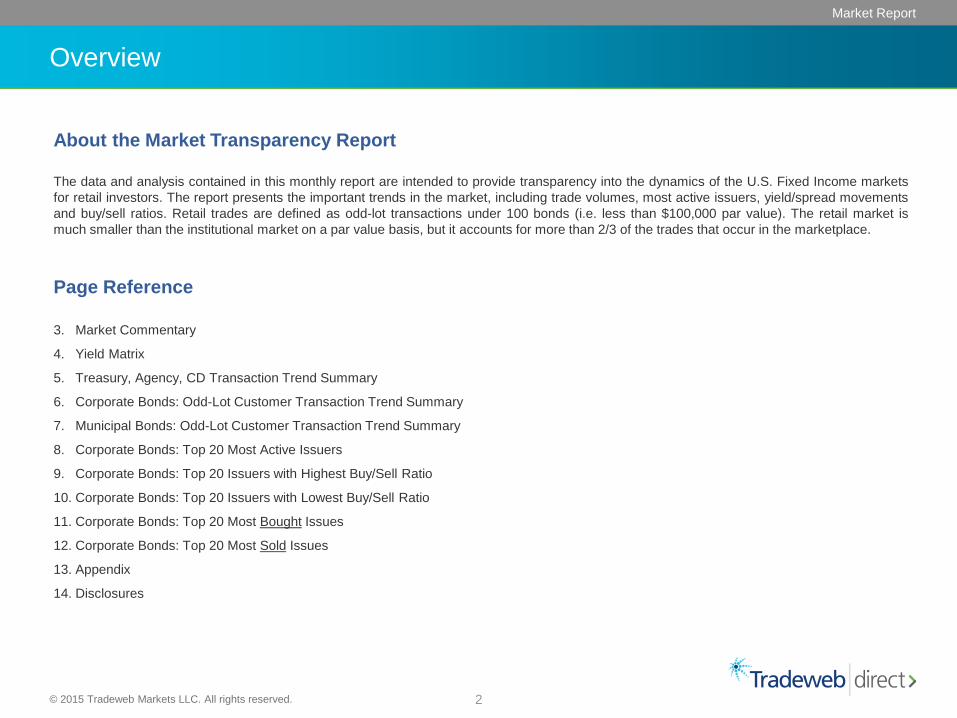
About the Market Transparency Report
The data and analysis contained in this monthly report are intended to provide transparency into the dynamics of the U.S. Fixed Income markets
for retail investors. The report presents the important trends in the market, including trade volumes, most active issuers, yield/spread movements
and buy/sell ratios. Retail trades are defined as odd-lot transactions under 100 bonds (i.e. less than $100,000 par value). The retail market is
much smaller than the institutional market on a par value basis, but it accounts for more than 2/3 of the trades that occur in the marketplace.
Page Reference
3. Market Commentary
4. Yield Matrix
5. Treasury, Agency, CD Transaction Trend Summary
6. Corporate Bonds: Odd-Lot Customer Transaction Trend Summary
7. Municipal Bonds: Odd-Lot Customer Transaction Trend Summary
8. Corporate Bonds: Top 20 Most Active Issuers
9. Corporate Bonds: Top 20 Issuers with Highest Buy/Sell Ratio
10. Corporate Bonds: Top 20 Issuers with Lowest Buy/Sell Ratio
11. Corporate Bonds: Top 20 Most Bought Issues
12. Corporate Bonds: Top 20 Most Sold Issues
13. Appendix
14. Disclosures
© 2015 Tradeweb Markets LLC. All rights reserved. 3
Market Report
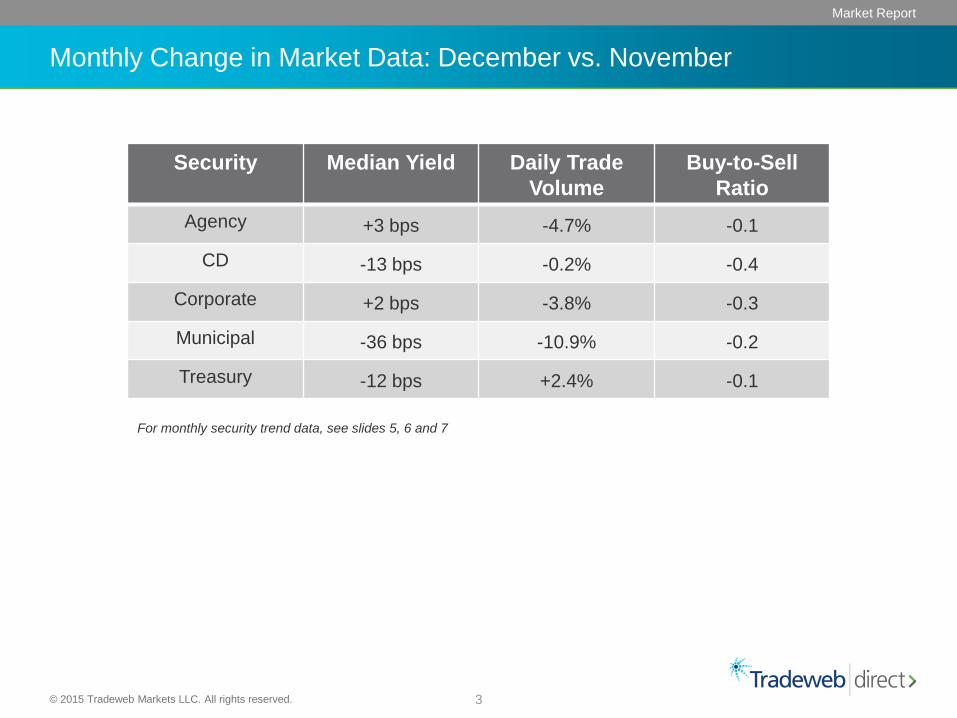
Security Median Yield Daily Trade
Volume
Buy-to-Sell
Ratio
Agency +3 bps -4.7% -0.1
CD -13 bps -0.2% -0.4
Corporate +2 bps -3.8% -0.3
Municipal -36 bps -10.9% -0.2
Treasury -12 bps +2.4% -0.1
Monthly Change in Market Data: December vs. November
For monthly security trend data, see slides 5, 6 and 7
© 2015 Tradeweb Markets LLC. All rights reserved. 4
Market Report
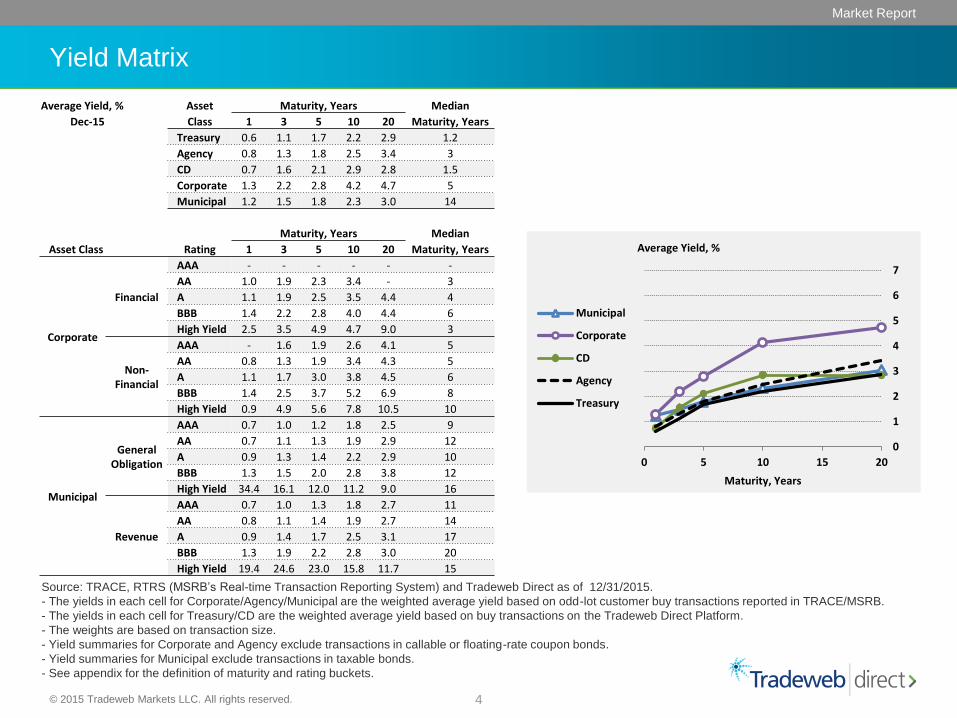
Yield Matrix
Source: TRACE, RTRS (MSRB’s Real-time Transaction Reporting System) and Tradeweb Direct as of 12/31/2015.
- The yields in each cell for Corporate/Agency/Municipal are the weighted average yield based on odd-lot customer buy transactions reported in TRACE/MSRB.
- The yields in each cell for Treasury/CD are the weighted average yield based on buy transactions on the Tradeweb Direct Platform.
- The weights are based on transaction size.
- Yield summaries for Corporate and Agency exclude transactions in callable or floating-rate coupon bonds.
- Yield summaries for Municipal exclude transactions in taxable bonds.
- See appendix for the definition of maturity and rating buckets.
Average Yield, % Asset Maturity, Years Median
Dec-15 Class 1 3 5 10 20 Maturity, Years
Treasury 0.6 1.1 1.7 2.2 2.9 1.2
Agency 0.8 1.3 1.8 2.5 3.4 3
CD 0.7 1.6 2.1 2.9 2.8 1.5
Corporate 1.3 2.2 2.8 4.2 4.7 5
Municipal 1.2 1.5 1.8 2.3 3.0 14
Maturity, Years Median
Asset Class Rating 1 3 5 10 20 Maturity, Years
Corporate
Financial
AAA - - - - - -
AA 1.0 1.9 2.3 3.4 - 3
A 1.1 1.9 2.5 3.5 4.4 4
BBB 1.4 2.2 2.8 4.0 4.4 6
High Yield 2.5 3.5 4.9 4.7 9.0 3
Non-Financial
AAA - 1.6 1.9 2.6 4.1 5
AA 0.8 1.3 1.9 3.4 4.3 5
A 1.1 1.7 3.0 3.8 4.5 6
BBB 1.4 2.5 3.7 5.2 6.9 8
High Yield 0.9 4.9 5.6 7.8 10.5 10
Municipal
General Obligation
AAA 0.7 1.0 1.2 1.8 2.5 9
AA 0.7 1.1 1.3 1.9 2.9 12
A 0.9 1.3 1.4 2.2 2.9 10
BBB 1.3 1.5 2.0 2.8 3.8 12
High Yield 34.4 16.1 12.0 11.2 9.0 16
Revenue
AAA 0.7 1.0 1.3 1.8 2.7 11
AA 0.8 1.1 1.4 1.9 2.7 14
A 0.9 1.4 1.7 2.5 3.1 17
BBB 1.3 1.9 2.2 2.8 3.0 20
High Yield 19.4 24.6 23.0 15.8 11.7 15
0
1
2
3
4
5
6
7
0 5 10 15 20
Maturity, Years
Average Yield, %
Municipal
Corporate
CD
Agency
Treasury
© 2015 Tradeweb Markets LLC. All rights reserved. 5
Market Report
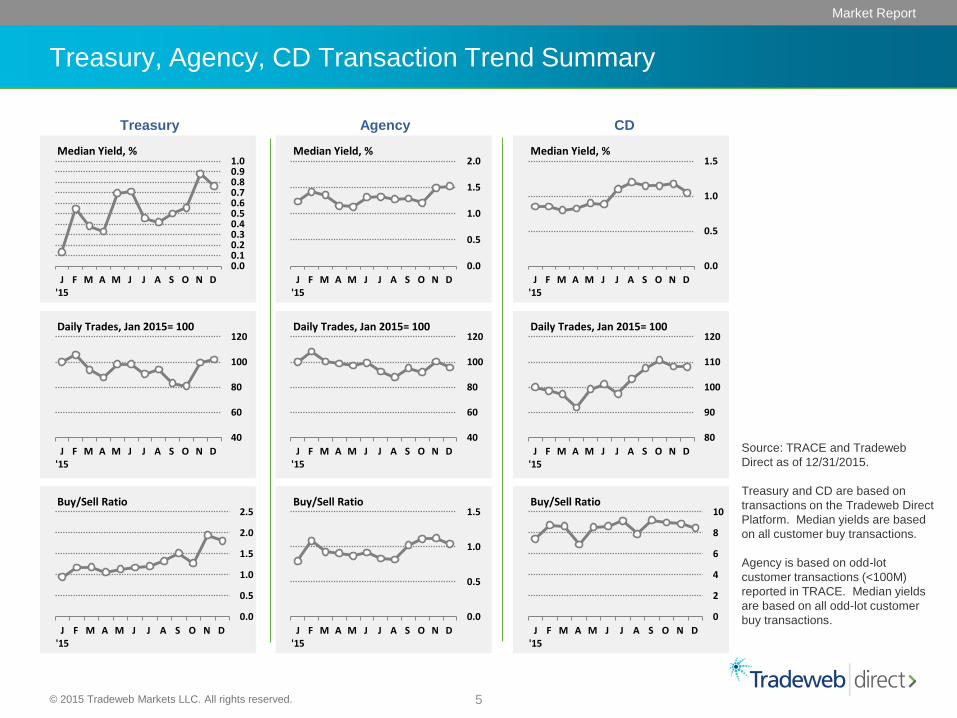
Treasury, Agency, CD Transaction Trend Summary
Source: TRACE and Tradeweb
Direct as of 12/31/2015.
Treasury and CD are based on
transactions on the Tradeweb Direct
Platform. Median yields are based
on all customer buy transactions.
Agency is based on odd-lot
customer transactions (<100M)
reported in TRACE. Median yields
are based on all odd-lot customer
buy transactions.
Treasury Agency CD
40
60
80
100
120
J'15
F M A M J J A S O N D
Daily Trades, Jan 2015= 100
0.0
0.5
1.0
1.5
2.0
2.5
J'15
F M A M J J A S O N D
Buy/Sell Ratio
0.00.10.20.30.40.50.60.70.80.91.0
J'15
F M A M J J A S O N D
Median Yield, %
40
60
80
100
120
J'15
F M A M J J A S O N D
Daily Trades, Jan 2015= 100
0.0
0.5
1.0
1.5
J'15
F M A M J J A S O N D
Buy/Sell Ratio
0.0
0.5
1.0
1.5
2.0
J'15
F M A M J J A S O N D
Median Yield, %
80
90
100
110
120
J'15
F M A M J J A S O N D
Daily Trades, Jan 2015= 100
0
2
4
6
8
10
J'15
F M A M J J A S O N D
Buy/Sell Ratio
0.0
0.5
1.0
1.5
J'15
F M A M J J A S O N D
Median Yield, %
© 2015 Tradeweb Markets LLC. All rights reserved. 6
Market Report
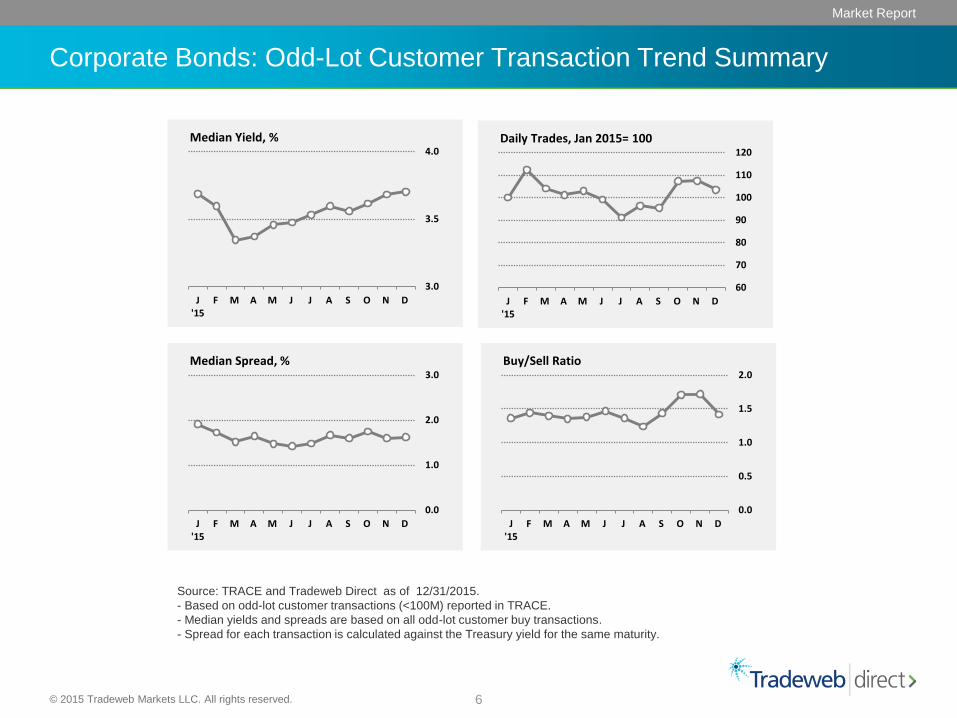
Corporate Bonds: Odd-Lot Customer Transaction Trend Summary
Source: TRACE and Tradeweb Direct as of 12/31/2015.
- Based on odd-lot customer transactions (<100M) reported in TRACE.
- Median yields and spreads are based on all odd-lot customer buy transactions.
- Spread for each transaction is calculated against the Treasury yield for the same maturity.
60
70
80
90
100
110
120
J'15
F M A M J J A S O N D
Daily Trades, Jan 2015= 100
0.0
0.5
1.0
1.5
2.0
J'15
F M A M J J A S O N D
Buy/Sell Ratio
3.0
3.5
4.0
J'15
F M A M J J A S O N D
Median Yield, %
0.0
1.0
2.0
3.0
J'15
F M A M J J A S O N D
Median Spread, %
© 2015 Tradeweb Markets LLC. All rights reserved. 7
Market Report
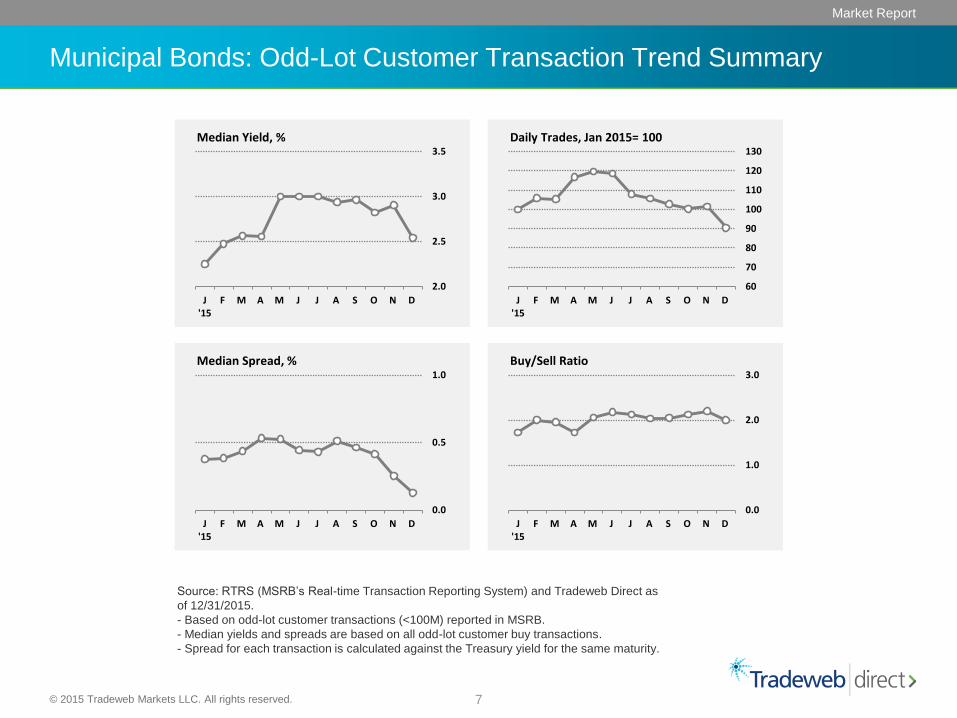
Municipal Bonds: Odd-Lot Customer Transaction Trend Summary
Source: RTRS (MSRB’s Real-time Transaction Reporting System) and Tradeweb Direct as
of 12/31/2015.
- Based on odd-lot customer transactions (<100M) reported in MSRB.
- Median yields and spreads are based on all odd-lot customer buy transactions.
- Spread for each transaction is calculated against the Treasury yield for the same maturity.
60
70
80
90
100
110
120
130
J'15
F M A M J J A S O N D
Daily Trades, Jan 2015= 100
0.0
1.0
2.0
3.0
J'15
F M A M J J A S O N D
Buy/Sell Ratio
2.0
2.5
3.0
3.5
J'15
F M A M J J A S O N D
Median Yield, %
0.0
0.5
1.0
J'15
F M A M J J A S O N D
Median Spread, %
© 2015 Tradeweb Markets LLC. All rights reserved. 8
Market Report
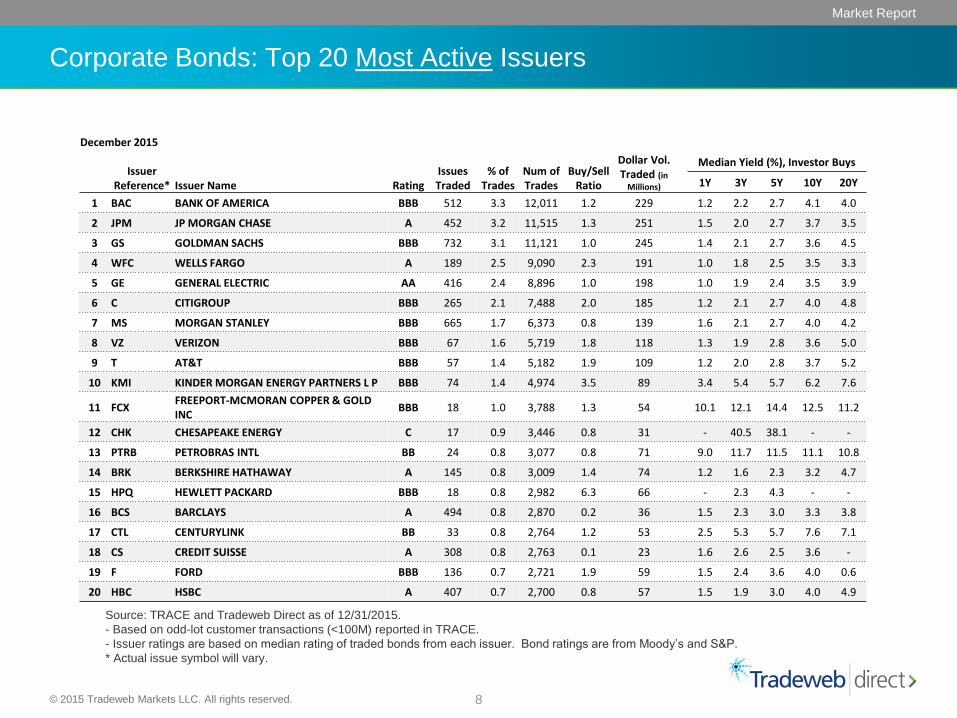
Corporate Bonds: Top 20 Most Active Issuers
Source: TRACE and Tradeweb Direct as of 12/31/2015.
- Based on odd-lot customer transactions (<100M) reported in TRACE.
- Issuer ratings are based on median rating of traded bonds from each issuer. Bond ratings are from Moody’s and S&P.
* Actual issue symbol will vary.
December 2015
Issuer
Reference* Issuer Name Rating Issues Traded
% of Trades
Num of Trades
Buy/Sell Ratio
Dollar Vol. Traded (in
Millions)
Median Yield (%), Investor Buys
1Y 3Y 5Y 10Y 20Y
1 BAC BANK OF AMERICA BBB 512 3.3 12,011 1.2 229 1.2 2.2 2.7 4.1 4.0
2 JPM JP MORGAN CHASE A 452 3.2 11,515 1.3 251 1.5 2.0 2.7 3.7 3.5
3 GS GOLDMAN SACHS BBB 732 3.1 11,121 1.0 245 1.4 2.1 2.7 3.6 4.5
4 WFC WELLS FARGO A 189 2.5 9,090 2.3 191 1.0 1.8 2.5 3.5 3.3
5 GE GENERAL ELECTRIC AA 416 2.4 8,896 1.0 198 1.0 1.9 2.4 3.5 3.9
6 C CITIGROUP BBB 265 2.1 7,488 2.0 185 1.2 2.1 2.7 4.0 4.8
7 MS MORGAN STANLEY BBB 665 1.7 6,373 0.8 139 1.6 2.1 2.7 4.0 4.2
8 VZ VERIZON BBB 67 1.6 5,719 1.8 118 1.3 1.9 2.8 3.6 5.0
9 T AT&T BBB 57 1.4 5,182 1.9 109 1.2 2.0 2.8 3.7 5.2
10 KMI KINDER MORGAN ENERGY PARTNERS L P BBB 74 1.4 4,974 3.5 89 3.4 5.4 5.7 6.2 7.6
11 FCX FREEPORT-MCMORAN COPPER & GOLD INC
BBB 18 1.0 3,788 1.3 54 10.1 12.1 14.4 12.5 11.2
12 CHK CHESAPEAKE ENERGY C 17 0.9 3,446 0.8 31 - 40.5 38.1 - -
13 PTRB PETROBRAS INTL BB 24 0.8 3,077 0.8 71 9.0 11.7 11.5 11.1 10.8
14 BRK BERKSHIRE HATHAWAY A 145 0.8 3,009 1.4 74 1.2 1.6 2.3 3.2 4.7
15 HPQ HEWLETT PACKARD BBB 18 0.8 2,982 6.3 66 - 2.3 4.3 - -
16 BCS BARCLAYS A 494 0.8 2,870 0.2 36 1.5 2.3 3.0 3.3 3.8
17 CTL CENTURYLINK BB 33 0.8 2,764 1.2 53 2.5 5.3 5.7 7.6 7.1
18 CS CREDIT SUISSE A 308 0.8 2,763 0.1 23 1.6 2.6 2.5 3.6 -
19 F FORD BBB 136 0.7 2,721 1.9 59 1.5 2.4 3.6 4.0 0.6
20 HBC HSBC A 407 0.7 2,700 0.8 57 1.5 1.9 3.0 4.0 4.9
© 2015 Tradeweb Markets LLC. All rights reserved. 9
Market Report
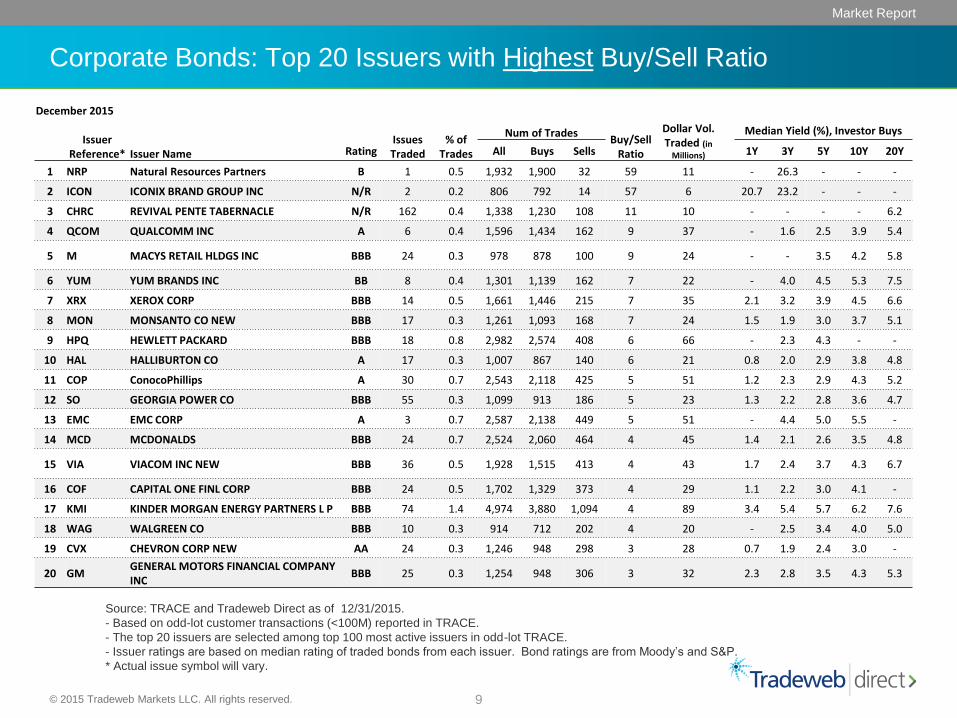
Corporate Bonds: Top 20 Issuers with Highest Buy/Sell Ratio
Source: TRACE and Tradeweb Direct as of 12/31/2015.
- Based on odd-lot customer transactions (<100M) reported in TRACE.
- The top 20 issuers are selected among top 100 most active issuers in odd-lot TRACE.
- Issuer ratings are based on median rating of traded bonds from each issuer. Bond ratings are from Moody’s and S&P.
* Actual issue symbol will vary.
December 2015
Issuer
Reference*
Issues Traded
% of Trades
Num of Trades Buy/Sell
Ratio
Dollar Vol. Traded (in
Millions)
Median Yield (%), Investor Buys
Issuer Name Rating All Buys Sells 1Y 3Y 5Y 10Y 20Y
1 NRP Natural Resources Partners B 1 0.5 1,932 1,900 32 59 11 - 26.3 - - -
2 ICON ICONIX BRAND GROUP INC N/R 2 0.2 806 792 14 57 6 20.7 23.2 - - -
3 CHRC REVIVAL PENTE TABERNACLE N/R 162 0.4 1,338 1,230 108 11 10 - - - - 6.2
4 QCOM QUALCOMM INC A 6 0.4 1,596 1,434 162 9 37 - 1.6 2.5 3.9 5.4
5 M MACYS RETAIL HLDGS INC BBB 24 0.3 978 878 100 9 24 - - 3.5 4.2 5.8
6 YUM YUM BRANDS INC BB 8 0.4 1,301 1,139 162 7 22 - 4.0 4.5 5.3 7.5
7 XRX XEROX CORP BBB 14 0.5 1,661 1,446 215 7 35 2.1 3.2 3.9 4.5 6.6
8 MON MONSANTO CO NEW BBB 17 0.3 1,261 1,093 168 7 24 1.5 1.9 3.0 3.7 5.1
9 HPQ HEWLETT PACKARD BBB 18 0.8 2,982 2,574 408 6 66 - 2.3 4.3 - -
10 HAL HALLIBURTON CO A 17 0.3 1,007 867 140 6 21 0.8 2.0 2.9 3.8 4.8
11 COP ConocoPhillips A 30 0.7 2,543 2,118 425 5 51 1.2 2.3 2.9 4.3 5.2
12 SO GEORGIA POWER CO BBB 55 0.3 1,099 913 186 5 23 1.3 2.2 2.8 3.6 4.7
13 EMC EMC CORP A 3 0.7 2,587 2,138 449 5 51 - 4.4 5.0 5.5 -
14 MCD MCDONALDS BBB 24 0.7 2,524 2,060 464 4 45 1.4 2.1 2.6 3.5 4.8
15 VIA VIACOM INC NEW BBB 36 0.5 1,928 1,515 413 4 43 1.7 2.4 3.7 4.3 6.7
16 COF CAPITAL ONE FINL CORP BBB 24 0.5 1,702 1,329 373 4 29 1.1 2.2 3.0 4.1 -
17 KMI KINDER MORGAN ENERGY PARTNERS L P BBB 74 1.4 4,974 3,880 1,094 4 89 3.4 5.4 5.7 6.2 7.6
18 WAG WALGREEN CO BBB 10 0.3 914 712 202 4 20 - 2.5 3.4 4.0 5.0
19 CVX CHEVRON CORP NEW AA 24 0.3 1,246 948 298 3 28 0.7 1.9 2.4 3.0 -
20 GM GENERAL MOTORS FINANCIAL COMPANY INC
BBB 25 0.3 1,254 948 306 3 32 2.3 2.8 3.5 4.3 5.3
© 2015 Tradeweb Markets LLC. All rights reserved. 10
Market Report
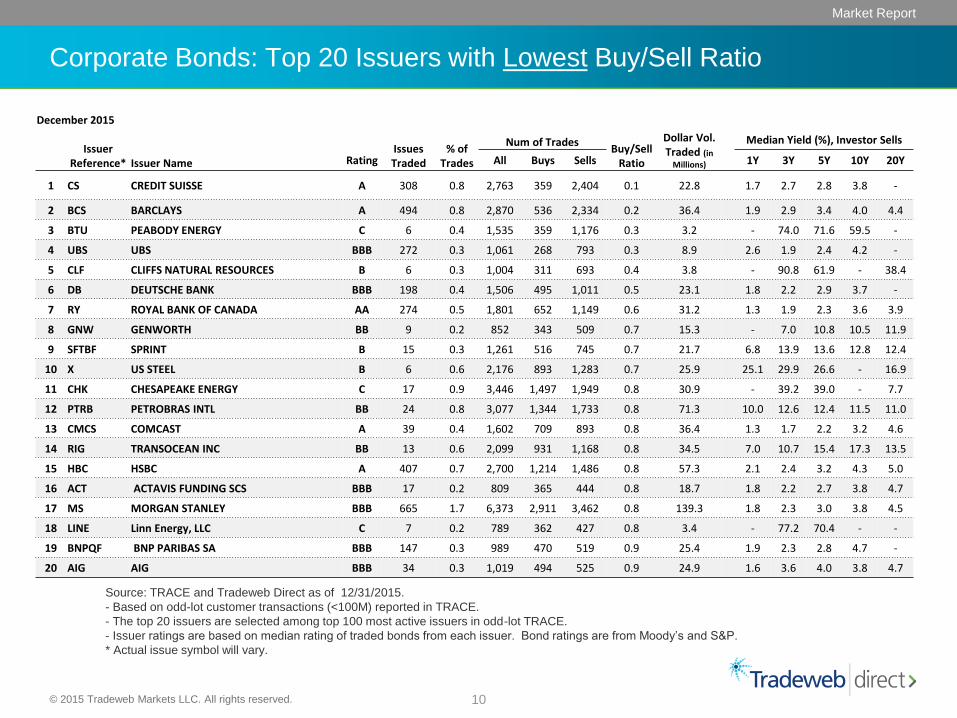
Corporate Bonds: Top 20 Issuers with Lowest Buy/Sell Ratio
Source: TRACE and Tradeweb Direct as of 12/31/2015.
- Based on odd-lot customer transactions (<100M) reported in TRACE.
- The top 20 issuers are selected among top 100 most active issuers in odd-lot TRACE.
- Issuer ratings are based on median rating of traded bonds from each issuer. Bond ratings are from Moody’s and S&P.
* Actual issue symbol will vary.
December 2015
Issuer
Reference*
Issues Traded
% of Trades
Num of Trades Buy/Sell
Ratio
Dollar Vol. Traded (in
Millions)
Median Yield (%), Investor Sells
Issuer Name Rating All Buys Sells 1Y 3Y 5Y 10Y 20Y
1 CS CREDIT SUISSE A 308 0.8 2,763 359 2,404 0.1 22.8 1.7 2.7 2.8 3.8 -
2 BCS BARCLAYS A 494 0.8 2,870 536 2,334 0.2 36.4 1.9 2.9 3.4 4.0 4.4
3 BTU PEABODY ENERGY C 6 0.4 1,535 359 1,176 0.3 3.2 - 74.0 71.6 59.5 -
4 UBS UBS BBB 272 0.3 1,061 268 793 0.3 8.9 2.6 1.9 2.4 4.2 -
5 CLF CLIFFS NATURAL RESOURCES B 6 0.3 1,004 311 693 0.4 3.8 - 90.8 61.9 - 38.4
6 DB DEUTSCHE BANK BBB 198 0.4 1,506 495 1,011 0.5 23.1 1.8 2.2 2.9 3.7 -
7 RY ROYAL BANK OF CANADA AA 274 0.5 1,801 652 1,149 0.6 31.2 1.3 1.9 2.3 3.6 3.9
8 GNW GENWORTH BB 9 0.2 852 343 509 0.7 15.3 - 7.0 10.8 10.5 11.9
9 SFTBF SPRINT B 15 0.3 1,261 516 745 0.7 21.7 6.8 13.9 13.6 12.8 12.4
10 X US STEEL B 6 0.6 2,176 893 1,283 0.7 25.9 25.1 29.9 26.6 - 16.9
11 CHK CHESAPEAKE ENERGY C 17 0.9 3,446 1,497 1,949 0.8 30.9 - 39.2 39.0 - 7.7
12 PTRB PETROBRAS INTL BB 24 0.8 3,077 1,344 1,733 0.8 71.3 10.0 12.6 12.4 11.5 11.0
13 CMCS COMCAST A 39 0.4 1,602 709 893 0.8 36.4 1.3 1.7 2.2 3.2 4.6
14 RIG TRANSOCEAN INC BB 13 0.6 2,099 931 1,168 0.8 34.5 7.0 10.7 15.4 17.3 13.5
15 HBC HSBC A 407 0.7 2,700 1,214 1,486 0.8 57.3 2.1 2.4 3.2 4.3 5.0
16 ACT ACTAVIS FUNDING SCS BBB 17 0.2 809 365 444 0.8 18.7 1.8 2.2 2.7 3.8 4.7
17 MS MORGAN STANLEY BBB 665 1.7 6,373 2,911 3,462 0.8 139.3 1.8 2.3 3.0 3.8 4.5
18 LINE Linn Energy, LLC C 7 0.2 789 362 427 0.8 3.4 - 77.2 70.4 - -
19 BNPQF BNP PARIBAS SA BBB 147 0.3 989 470 519 0.9 25.4 1.9 2.3 2.8 4.7 -
20 AIG AIG BBB 34 0.3 1,019 494 525 0.9 24.9 1.6 3.6 4.0 3.8 4.7
© 2015 Tradeweb Markets LLC. All rights reserved. 11
Market Report
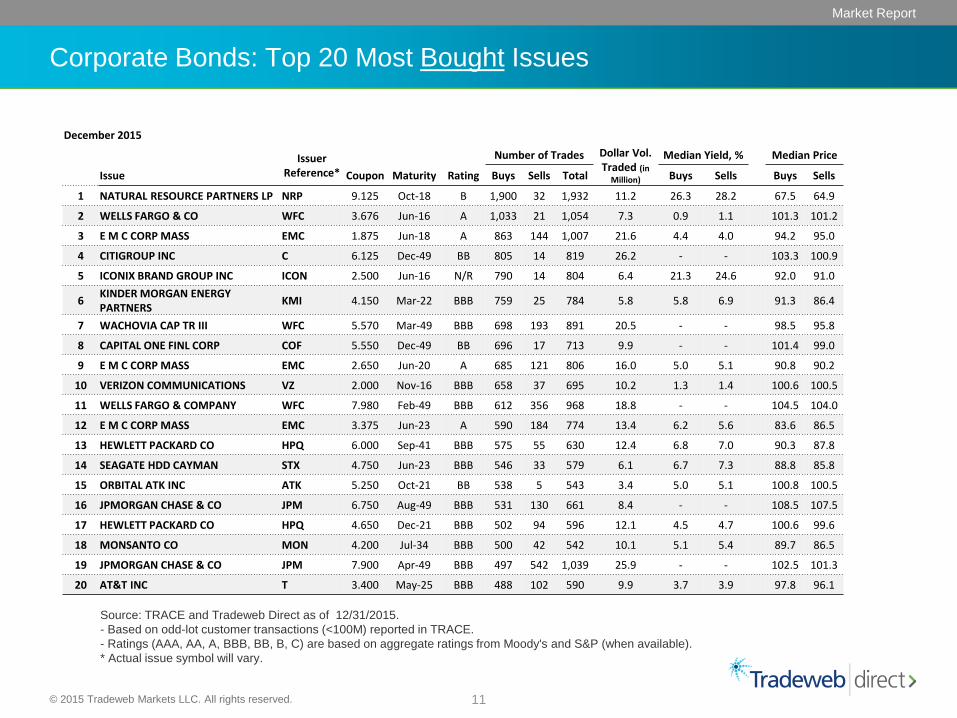
Corporate Bonds: Top 20 Most Bought Issues
Source: TRACE and Tradeweb Direct as of 12/31/2015.
- Based on odd-lot customer transactions (<100M) reported in TRACE.
- Ratings (AAA, AA, A, BBB, BB, B, C) are based on aggregate ratings from Moody's and S&P (when available).
* Actual issue symbol will vary.
December 2015
Issuer Reference*
Number of Trades Dollar Vol. Traded (in
Million)
Median Yield, % Median Price
Issue Coupon Maturity Rating Buys Sells Total Buys Sells Buys Sells
1 NATURAL RESOURCE PARTNERS LP NRP 9.125 Oct-18 B 1,900 32 1,932 11.2 26.3 28.2 67.5 64.9
2 WELLS FARGO & CO WFC 3.676 Jun-16 A 1,033 21 1,054 7.3 0.9 1.1 101.3 101.2
3 E M C CORP MASS EMC 1.875 Jun-18 A 863 144 1,007 21.6 4.4 4.0 94.2 95.0
4 CITIGROUP INC C 6.125 Dec-49 BB 805 14 819 26.2 - - 103.3 100.9
5 ICONIX BRAND GROUP INC ICON 2.500 Jun-16 N/R 790 14 804 6.4 21.3 24.6 92.0 91.0
6 KINDER MORGAN ENERGY PARTNERS
KMI 4.150 Mar-22 BBB 759 25 784 5.8 5.8 6.9 91.3 86.4
7 WACHOVIA CAP TR III WFC 5.570 Mar-49 BBB 698 193 891 20.5 - - 98.5 95.8
8 CAPITAL ONE FINL CORP COF 5.550 Dec-49 BB 696 17 713 9.9 - - 101.4 99.0
9 E M C CORP MASS EMC 2.650 Jun-20 A 685 121 806 16.0 5.0 5.1 90.8 90.2
10 VERIZON COMMUNICATIONS VZ 2.000 Nov-16 BBB 658 37 695 10.2 1.3 1.4 100.6 100.5
11 WELLS FARGO & COMPANY WFC 7.980 Feb-49 BBB 612 356 968 18.8 - - 104.5 104.0
12 E M C CORP MASS EMC 3.375 Jun-23 A 590 184 774 13.4 6.2 5.6 83.6 86.5
13 HEWLETT PACKARD CO HPQ 6.000 Sep-41 BBB 575 55 630 12.4 6.8 7.0 90.3 87.8
14 SEAGATE HDD CAYMAN STX 4.750 Jun-23 BBB 546 33 579 6.1 6.7 7.3 88.8 85.8
15 ORBITAL ATK INC ATK 5.250 Oct-21 BB 538 5 543 3.4 5.0 5.1 100.8 100.5
16 JPMORGAN CHASE & CO JPM 6.750 Aug-49 BBB 531 130 661 8.4 - - 108.5 107.5
17 HEWLETT PACKARD CO HPQ 4.650 Dec-21 BBB 502 94 596 12.1 4.5 4.7 100.6 99.6
18 MONSANTO CO MON 4.200 Jul-34 BBB 500 42 542 10.1 5.1 5.4 89.7 86.5
19 JPMORGAN CHASE & CO JPM 7.900 Apr-49 BBB 497 542 1,039 25.9 - - 102.5 101.3
20 AT&T INC T 3.400 May-25 BBB 488 102 590 9.9 3.7 3.9 97.8 96.1
© 2015 Tradeweb Markets LLC. All rights reserved. 12
Market Report
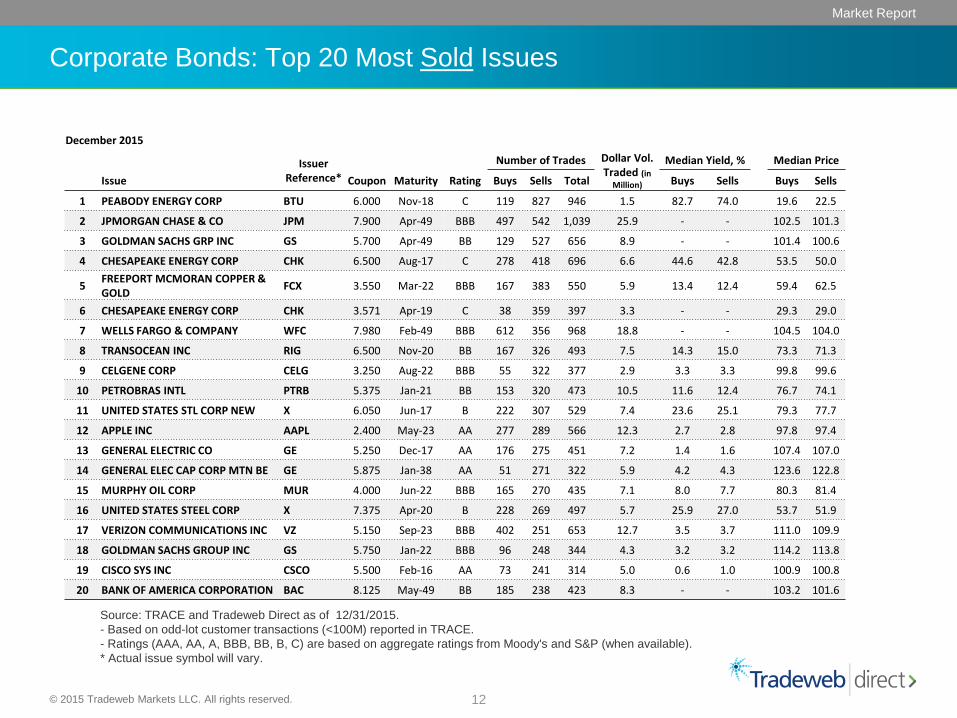
Corporate Bonds: Top 20 Most Sold Issues
Source: TRACE and Tradeweb Direct as of 12/31/2015.
- Based on odd-lot customer transactions (<100M) reported in TRACE.
- Ratings (AAA, AA, A, BBB, BB, B, C) are based on aggregate ratings from Moody's and S&P (when available).
* Actual issue symbol will vary.
December 2015
Issuer Reference*
Number of Trades Dollar Vol. Traded (in
Million)
Median Yield, % Median Price
Issue Coupon Maturity Rating Buys Sells Total Buys Sells Buys Sells
1 PEABODY ENERGY CORP BTU 6.000 Nov-18 C 119 827 946 1.5 82.7 74.0 19.6 22.5
2 JPMORGAN CHASE & CO JPM 7.900 Apr-49 BBB 497 542 1,039 25.9 - - 102.5 101.3
3 GOLDMAN SACHS GRP INC GS 5.700 Apr-49 BB 129 527 656 8.9 - - 101.4 100.6
4 CHESAPEAKE ENERGY CORP CHK 6.500 Aug-17 C 278 418 696 6.6 44.6 42.8 53.5 50.0
5 FREEPORT MCMORAN COPPER & GOLD
FCX 3.550 Mar-22 BBB 167 383 550 5.9 13.4 12.4 59.4 62.5
6 CHESAPEAKE ENERGY CORP CHK 3.571 Apr-19 C 38 359 397 3.3 - - 29.3 29.0
7 WELLS FARGO & COMPANY WFC 7.980 Feb-49 BBB 612 356 968 18.8 - - 104.5 104.0
8 TRANSOCEAN INC RIG 6.500 Nov-20 BB 167 326 493 7.5 14.3 15.0 73.3 71.3
9 CELGENE CORP CELG 3.250 Aug-22 BBB 55 322 377 2.9 3.3 3.3 99.8 99.6
10 PETROBRAS INTL PTRB 5.375 Jan-21 BB 153 320 473 10.5 11.6 12.4 76.7 74.1
11 UNITED STATES STL CORP NEW X 6.050 Jun-17 B 222 307 529 7.4 23.6 25.1 79.3 77.7
12 APPLE INC AAPL 2.400 May-23 AA 277 289 566 12.3 2.7 2.8 97.8 97.4
13 GENERAL ELECTRIC CO GE 5.250 Dec-17 AA 176 275 451 7.2 1.4 1.6 107.4 107.0
14 GENERAL ELEC CAP CORP MTN BE GE 5.875 Jan-38 AA 51 271 322 5.9 4.2 4.3 123.6 122.8
15 MURPHY OIL CORP MUR 4.000 Jun-22 BBB 165 270 435 7.1 8.0 7.7 80.3 81.4
16 UNITED STATES STEEL CORP X 7.375 Apr-20 B 228 269 497 5.7 25.9 27.0 53.7 51.9
17 VERIZON COMMUNICATIONS INC VZ 5.150 Sep-23 BBB 402 251 653 12.7 3.5 3.7 111.0 109.9
18 GOLDMAN SACHS GROUP INC GS 5.750 Jan-22 BBB 96 248 344 4.3 3.2 3.2 114.2 113.8
19 CISCO SYS INC CSCO 5.500 Feb-16 AA 73 241 314 5.0 0.6 1.0 100.9 100.8
20 BANK OF AMERICA CORPORATION BAC 8.125 May-49 BB 185 238 423 8.3 - - 103.2 101.6
© 2015 Tradeweb Markets LLC. All rights reserved. 13
Market Report
Appendix
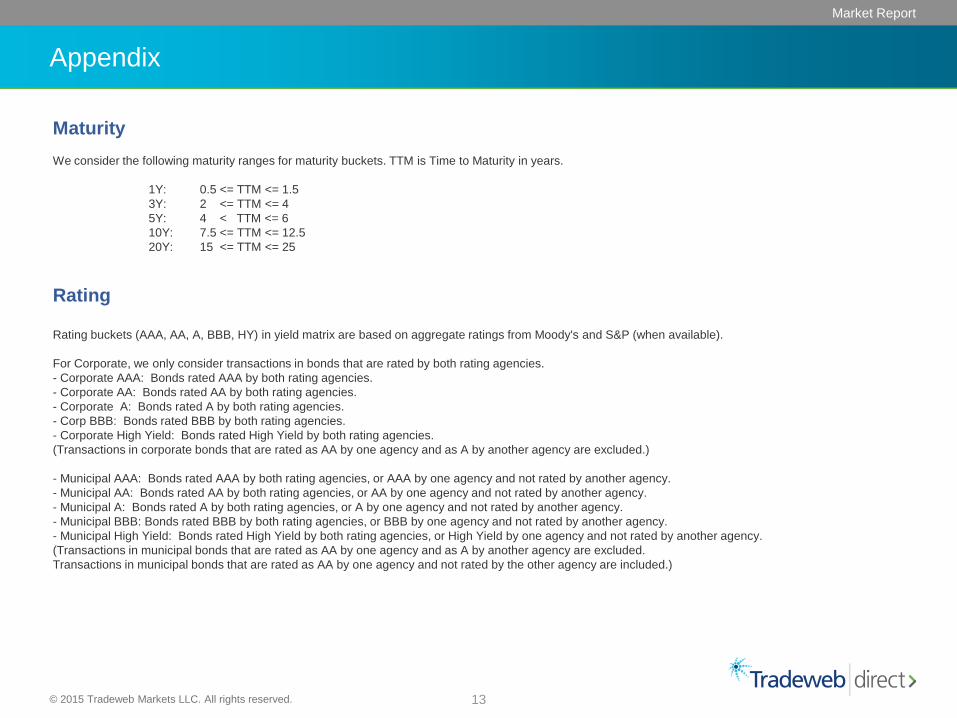
Maturity
We consider the following maturity ranges for maturity buckets. TTM is Time to Maturity in years.
1Y: 0.5 <= TTM <= 1.5
3Y: 2 <= TTM <= 4
5Y: 4 < TTM <= 6
10Y: 7.5 <= TTM <= 12.5
20Y: 15 <= TTM <= 25
Rating
Rating buckets (AAA, AA, A, BBB, HY) in yield matrix are based on aggregate ratings from Moody's and S&P (when available).
For Corporate, we only consider transactions in bonds that are rated by both rating agencies.
- Corporate AAA: Bonds rated AAA by both rating agencies.
- Corporate AA: Bonds rated AA by both rating agencies.
- Corporate A: Bonds rated A by both rating agencies.
- Corp BBB: Bonds rated BBB by both rating agencies.
- Corporate High Yield: Bonds rated High Yield by both rating agencies.
(Transactions in corporate bonds that are rated as AA by one agency and as A by another agency are excluded.)
- Municipal AAA: Bonds rated AAA by both rating agencies, or AAA by one agency and not rated by another agency.
- Municipal AA: Bonds rated AA by both rating agencies, or AA by one agency and not rated by another agency.
- Municipal A: Bonds rated A by both rating agencies, or A by one agency and not rated by another agency.
- Municipal BBB: Bonds rated BBB by both rating agencies, or BBB by one agency and not rated by another agency.
- Municipal High Yield: Bonds rated High Yield by both rating agencies, or High Yield by one agency and not rated by another agency.
(Transactions in municipal bonds that are rated as AA by one agency and as A by another agency are excluded.
Transactions in municipal bonds that are rated as AA by one agency and not rated by the other agency are included.)
© 2015 Tradeweb Markets LLC. All rights reserved. 14
Market Report
Disclosures
This report represents certain customer trades in securities that have been reported by dealers to FINRA's Trade
Reporting and Compliance Engine (“TRACE”), and the Municipal Securities Rulemaking Board (“MSRB”). The report
does not necessarily reflect all transactions that were effected on dates noted. There is the possibility of errors or delays
in the trade submission process. Prices for transactions vary with market conditions and can be affected by trade size
and other factors. The information provided has been obtained from sources deemed to be reliable, however Tradeweb
Direct does not guarantee the accuracy of the information contained in this report.
Fixed income securities are subject to increased loss of principal during periods of rising interest rates. Fixed-income
investments are subject to various risks including changes in credit quality, market valuations, liquidity, prepayments,
early redemption, corporate events, tax ramifications and other factors. Defaults on interest payments and/or principal
may also occur. Projections, results and assumptions contained herein reflect past performance of the referenced
securities and asset classes. Past performance is no guarantee of future results. The investment return and principal
value of an investment will fluctuate such that an investment, if and when redeemed, may be worth more or less than its
original cost.
This information is intended for general informational purposes only, and should not be used as the sole basis for any
investment decisions. None of the information in the report constitutes an offer or solicitation to buy or sell any security or
financial product, a recommendation concerning any security, financial product or asset class, or an offer to provide
investment advice or any other service. Where appropriate, please consult with a qualified financial and tax professional.