market trends for the supply & demand of electricity in ... · supply & demand of...
TRANSCRIPT

Market Trends for the Supply & Demand of Electricity in Nova Scotia
May 30, 2014 Submitted to: Nova Scotia Department of Energy Submitted by: ICF International 300-222 Somerset Street West Ottawa, Ontario K2P 2G3 Tel: +1 613 523-0784 Fax: +1 613 523-0717 [email protected] www.icfi.ca

Market Trends for the Supply and Demand of Electricity in Nova Scotia
© 2014 i icfi.ca
Table of Contents
1 Introduction ......................................................................................................................... 1
1.1 Report Presentation .................................................................................................. 1
2 Nova Scotia Electricity Demand Outlook (2014-2040) .................................................... 3
2.2 Key Elements of the NSPI Demand Forecast .......................................................... 7 2.3 Potential Technologies Impacting Utility Demand .................................................. 11 2.4 Potential Demand Growth Pathways ...................................................................... 17 2.5 In Summary ............................................................................................................. 21
3 Energy Efficiency and Conservation (2014-2040) ......................................................... 22
3.1 Nova Scotia’s Energy Efficiency Resource Potential ............................................. 22 3.2 Nova Scotia EE Program Experience to Date ........................................................ 28 3.3 Future Nova Scotia EE Program Plan Considerations ........................................... 32 3.4 Summary ................................................................................................................. 36
4 Fossil Fuel Market Trends (2014-2040) .......................................................................... 37
4.1 Fuel Use at Nova Scotia Power .............................................................................. 37 4.2 Fuel Forecasts and Market Trends ......................................................................... 40 4.3 In Summary ............................................................................................................. 48
5 Supply Side Considerations (2014-2040) ....................................................................... 49
5.1 Baseline General Assessment of Electricity Generation ........................................ 49 5.2 Energy Policies and Environmental Regulations .................................................... 54 5.3 Assessing Generation Technologies ...................................................................... 56 5.4 Environmental Retrofits and Fuel Switch................................................................ 61 5.5 Other Supply Options ............................................................................................. 64 5.6 Reliability and Resource Adequacy ........................................................................ 68 5.7 What is Resource Adequacy? ................................................................................ 68 5.8 Current State of Resource Adequacy Planning in Nova Scotia ............................. 69 5.9 Resource Adequacy Going Forward ...................................................................... 70 5.10 In Summary ............................................................................................................. 72
6 Environmental Considerations (2014-2040) ................................................................... 73
6.1 Key Environmental Considerations ........................................................................ 74 6.2 Supply-and Demand Side Summary ...................................................................... 77 6.3 Analysis of Environmental Considerations – 2020, 2030, and 2040...................... 81 6.4 In Summary ............................................................................................................. 88
Market Trends for the Supply and Demand of Electricity in Nova Scotia
© 2014 1 icfi.ca
1 Introduction The Minister of Energy of Nova Scotia, in recognition of the changes taking place in energy markets and new technological developments that together will affect the delivery of electricity to Nova Scotians, has launched a comprehensive review of the province’s electrical system. The Electricity Reform Act passed by the government in the fall of 2013 calls for an electricity system review in three areas: Emerging technologies that impact demand and supply Market trends that help stabilize electricity prices Emerging trends in the oversight and delivery of electricity generation and transmission systems This study is aimed at understanding the drivers of market trends in energy supply and demand and how those drivers will affect the trends themselves. Thus, this report presents what the trends are, the principal developments that underlie the trends, and how these developments will affect the future of energy supply and demand. Drivers of energy supply and demand trends include underlying economic and resource factors, regulatory environmental compliance requirements, fossil fuel price forecasts (North American and world energy markets), efficiency and conservation programs/policies, and emerging technologies for supply, efficient uses of energy, and system optimization. The Department of Energy has identified five broad areas for this inquiry: (1) demand outlook, incorporating load growth from industrial expansion, population, incorporating energy efficiency and DSM programs and new technologies. (2) the impact of planned and potential new efficiency and conservation programs; (3) electricity supply alternatives, including cleaner generation and renewables, retrofit options (e.g., carbon capture and sequestration, storage, fuel switching, system optimization options (e.g., advanced metering, smart grid, compressed air storage), and potential export markets for renewable energy and benefits to Nova Scotia); (4) the forecast of fossil fuel costs in Nova Scotia; and (5) environmental constraints, both greenhouse gas (GHG) reduction and further reduction of SOx, NOx, and mercury;
1.1 Report Presentation This report is organized in six distinct and stand-alone chapters. Each chapter provides the reader with introductory background and context for that particular aspect of the markets and trends affecting energy production and use, as well as its own summative statement. In Chapter 2 – Electricity Demand Outlook we provide a background of the current situation
with respect to historical demand, and the risks and uncertainties associated with forward load forecasting. It provides context around the methodology and parameters considered in the utilities current load forecasting methodology and how this methodology considered market trends. Finally, the section presents the demand outlook and market trends looking forward for the various customer classes.
In Chapter 3 – Energy Efficiency and Conservation we present a summary of how the current
electricity load forecast incorporates energy efficiency, how the energy efficiency potential is determined, and then present a picture of the current deployment and success of demand side management (DSM) in the province. We review the currently planned energy efficiency programs going forward, and compare Nova Scotia's energy conservation plans to those of other jurisdictions.

Market Trends for the Supply and Demand of Electricity in Nova Scotia
© 2014 2 icfi.ca
In Chapter 4 – Fossil Fuel Market Trends we provide a review of current trends in fossil fuel prices, focusing on solid fuels and natural gas. We first summarize Nova Scotia Power Inc.'s fuel use and the factors that drive fuel choice by the utility. We next review current prices and price trends for fossil fuels and forecasts of prices from publicly available sources. Then, we discuss in more detail each of the fuels used in Nova Scotia, the structure of prices, price formation, and trends affecting the prices that will be paid in Nova Scotia, including transportation costs.
In Chapter 5 – Supply-Side Considerations we provide an overview of supply side trends,
beginning with a general assessment of current electricity generation in the province. We then review supply trends in the context of energy policies and environmental regulations going forward, along with various generation options and other supply options, and environmental enhancements possible for the current fleet of generation assets. We conclude the chapter with a discussion of resource adequacy.
In Chapter 6 – Environmental Considerations we present the effects of environmental
regulation, constraints and considerations on the choices of supply out to 2040, including in particular the effects of current policy including Nova Scotia’s Renewable Energy Plan; Nova Scotia’s Air Quality Regulations; and Greenhouse Gas Regulations aimed at Nova Scotia’s Electricity Generating Sector.

Market Trends for the Supply and Demand of Electricity in Nova Scotia
© 2014 3 icfi.ca
2 Nova Scotia Electricity Demand Outlook (2014-2040)
Nova Scotia, in 2013 had an annual electric energy requirement of roughly 11 TWh. Seasonally, the winter -- December through February -- is the largest load period in the Province. The strong winter peak is driven by use of electric heating load in the winter months. Summer months experience limited air conditioning load impact as compared to that of the winter heating need and hence do not have as high a demand. The winter peak demand was just over 2 GWs and the summer peak demand was approximately 1.4 GWs.
1 In addition, winter and summer energy and peak electric load
requirements have been steadily moving further apart over the most recent 10-year period. For example, a 10-year average annual electric load growth in December was 0.5%, in January 0%, and in February -0.5% while in June, July, and August those average annual growth rates were -1.0%, -0.5%, and -1.3% respectively. In addition to seasonal patterns, the composition of the Nova Scotia electric load has also been changing. In 2012, 44% of the total electric sales came from the residential sector, 34% from commercial sector, and 23% from industrial sector. Just 5 years earlier, in 2007, residential, commercial, and industrial sectors accounted for 36%, 28%, and 36% of the total electric sales respectively. This trend away from industrial load makes the overall electric load in Nova Scotia more sensitive to weather changes and is contributing to a widening gap is seasonal peak loads. Nova Scotia Power Incorporated (NSPI) serves nearly the entire electric demand in the Province. Given this, the demand outlook section largely focuses on NSPI’s experience with electric energy growth and its forecast expectations. Below, we provide a brief overview of recent historical demand growth, followed by an overview of key drivers of the Nova Scotia demand forecast.
2.1.1 Historical Review Annual electric energy requirements in Nova Scotia grew at an average of 0.9 percent per year in the five year period from 2003-2008. This slow growth period was followed by a strong decline related to economic recession which largely impacted the industrial sector in 2009. Load growth began to recover in 2010, but was followed by a 2.1 percent decline in 2011 largely due to production changes at two paper mills. In 2012, warm weather and the closure of two paper mills contributed to a further reduction of sales by 12.0 percent.
2 Similar patterns of load growth and
decline were experienced in the peak demand as well. In 2013 one mill came back on line, but demand from this key industrial sector remains a lesser share of the total than it did historically.
2.1.2 Key Demand Uncertainties in Nova Scotia The primary factors affecting the Nova Scotia electric demand levels are weather and demographic/economic conditions. From a long-term trend basis, weather uncertainties tend to level out, and primarily impact the short-term conditions, rather than the overall trend line. Demographic and Economic trends play a very important role, and hence affect the commercial and residential demand strongly, but can also particularly influence the industrial sector. Although industrial demand has the smallest share of overall demand for the region, the number of large industrial customers is relatively small, such that a change in any one large industrial customer could significantly swing the demand levels as seen in the historical demand movements presented above. In recent years, the five largest industrial customers used two-thirds of the energy in the industrial sector and nearly one-quarter of total energy sales.
3 Given this high concentration in the industrial
sector the overall demand in that sector in Nova Scotia is highly correlated to economic conditions; in particular, the demand for forestry and pulp & paper products, exchange rates and trade policies.
1 Nova Scotia Power, Historical Monthly Net System Requirements, System Peak, and System Firm Peak data.
2 Ibid.
3 Ibid.

Market Trends for the Supply and Demand of Electricity in Nova Scotia
© 2014 4 icfi.ca
While there will always be industrial uncertainties, other factors will affect the overall growth in electricity requirements that can be expected for Nova Scotia. These include slowing population growth, electricity-using appliance saturation levels, improving efficiency of equipment and appliances, penetration of distributed resources, and an overall shift in the economy toward less energy intensive industry. These factors, all tend towards stable or reduced levels of electric energy demand. Contrasting this could be technological advances or policy issues leading to more wide-spread usage of electrical equipment. For example, the advance of electric vehicles or electro-technologies for industrial applications could result in a rebound in electricity demand growth or a change in the load shape.
2.1.3 Long-term Load Forecasting Accuracy, Sensitivity, and Approach The accuracy of a load forecast has significant effect on the outcomes of integrated resource planning exercises focused on developing future generation, transmission, and distribution networks. An overestimation of demand will result in substantial investment for the construction of excess power facilities, while underestimation will result in potential loss of load and in customer dissatisfaction. Load forecasts are heavily dependent on assumptions of a number of parameters including weather, population, economic growth, policy outlook, and technology development. However, accurately assessing any one of these factors in a long term forecast can be difficult, and forecasting the combined impact and interaction of all of the items can be extremely challenging. While near-term forecasts can better reflect the impact of swing parameters such as weather, determining an expectation about the timing of a particular structural change or about the advancement of enabling technologies can present large challenges in a 5 plus-year outlook. To the extent that the objective of integrated resource planning is to determine an economical optimization of equipment and facilities to meet the customers' future electric demand with an acceptable level of reliability and power quality, any demand forecast must rely on the best available information to establish an expected demand level at the time the forecast is performed. Given the large uncertainty in factors such as weather and economic conditions into the long-term, typical practice uses an accepted normal value for such parameters to establish a baseline and tests alternate conditions as alternate scenarios or sensitivities to the baseline. Generally, long-term load demand forecasting methods can be classified as either based on parametric methods or based on artificial intelligence methods. Although they can be applied to long-term forecasts, artificial intelligence models tend to fit better to short-term forecasts which drive hour-to-hour or day-to-day load forecasts, and also tend to be more commodity-related. The parametric methods are based on relating load demand to the factors most likely to affect it through a mathematical modeling approach. The parameters in a parametric modeling approach are estimated using statistical techniques on historical data of load and the factors that affect load. Though parametric methods are simply estimations of the complex relationships that exist amongst load and the factors that affect load, many have shown reasonable accuracy. Three well established parametric modeling approaches are:
1. Time series 2. End-use 3. Econometric modeling.
Having established some of the fundamental challenges to long-term demand forecasting, as well as some of the approaches used in doing, so we can now look at how this is undertaken specifically in the Nova Scotia context.
Market Trends for the Supply and Demand of Electricity in Nova Scotia
© 2014 5 icfi.ca
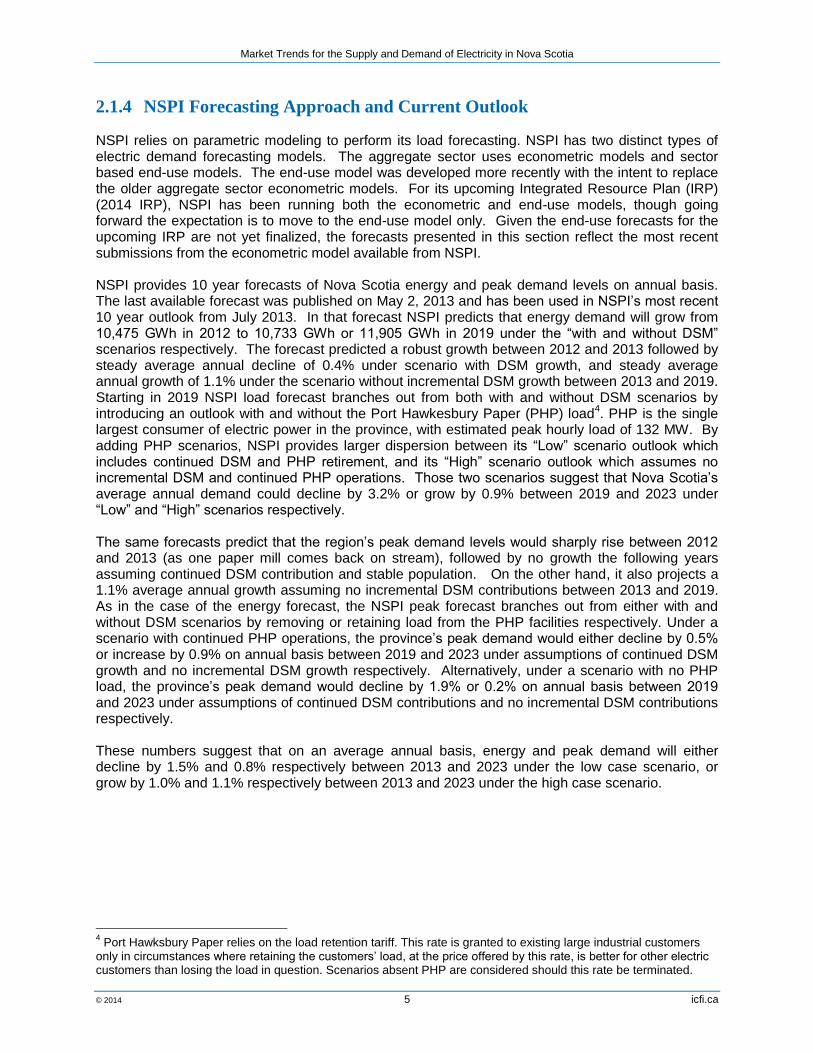
2.1.4 NSPI Forecasting Approach and Current Outlook NSPI relies on parametric modeling to perform its load forecasting. NSPI has two distinct types of electric demand forecasting models. The aggregate sector uses econometric models and sector based end-use models. The end-use model was developed more recently with the intent to replace the older aggregate sector econometric models. For its upcoming Integrated Resource Plan (IRP) (2014 IRP), NSPI has been running both the econometric and end-use models, though going forward the expectation is to move to the end-use model only. Given the end-use forecasts for the upcoming IRP are not yet finalized, the forecasts presented in this section reflect the most recent submissions from the econometric model available from NSPI. NSPI provides 10 year forecasts of Nova Scotia energy and peak demand levels on annual basis. The last available forecast was published on May 2, 2013 and has been used in NSPI’s most recent 10 year outlook from July 2013. In that forecast NSPI predicts that energy demand will grow from 10,475 GWh in 2012 to 10,733 GWh or 11,905 GWh in 2019 under the “with and without DSM” scenarios respectively. The forecast predicted a robust growth between 2012 and 2013 followed by steady average annual decline of 0.4% under scenario with DSM growth, and steady average annual growth of 1.1% under the scenario without incremental DSM growth between 2013 and 2019. Starting in 2019 NSPI load forecast branches out from both with and without DSM scenarios by introducing an outlook with and without the Port Hawkesbury Paper (PHP) load
4. PHP is the single
largest consumer of electric power in the province, with estimated peak hourly load of 132 MW. By adding PHP scenarios, NSPI provides larger dispersion between its “Low” scenario outlook which includes continued DSM and PHP retirement, and its “High” scenario outlook which assumes no incremental DSM and continued PHP operations. Those two scenarios suggest that Nova Scotia’s average annual demand could decline by 3.2% or grow by 0.9% between 2019 and 2023 under “Low” and “High” scenarios respectively. The same forecasts predict that the region’s peak demand levels would sharply rise between 2012 and 2013 (as one paper mill comes back on stream), followed by no growth the following years assuming continued DSM contribution and stable population. On the other hand, it also projects a 1.1% average annual growth assuming no incremental DSM contributions between 2013 and 2019. As in the case of the energy forecast, the NSPI peak forecast branches out from either with and without DSM scenarios by removing or retaining load from the PHP facilities respectively. Under a scenario with continued PHP operations, the province’s peak demand would either decline by 0.5% or increase by 0.9% on annual basis between 2019 and 2023 under assumptions of continued DSM growth and no incremental DSM growth respectively. Alternatively, under a scenario with no PHP load, the province’s peak demand would decline by 1.9% or 0.2% on annual basis between 2019 and 2023 under assumptions of continued DSM contributions and no incremental DSM contributions respectively. These numbers suggest that on an average annual basis, energy and peak demand will either decline by 1.5% and 0.8% respectively between 2013 and 2023 under the low case scenario, or grow by 1.0% and 1.1% respectively between 2013 and 2023 under the high case scenario.
4 Port Hawksbury Paper relies on the load retention tariff. This rate is granted to existing large industrial customers
only in circumstances where retaining the customers’ load, at the price offered by this rate, is better for other electric customers than losing the load in question. Scenarios absent PHP are considered should this rate be terminated.

Market Trends for the Supply and Demand of Electricity in Nova Scotia
© 2014 6 icfi.ca
Exhibit 1 NSPI Forecast Scenarios
Year DSM – PHP DSM + PHP No DSM - PHP No DSM + PHP
Peak (MW)
Energy (GWh)
Peak (MW)
Energy (GWh)
Peak (MW)
Energy (GWh)
Peak (MW)
Energy (GWh)
2012 1,882 10,475 1,882 10,475 1,882 10,475 1,882 10,475
2013 2,085 11,003 2,085 11,003 2,107 11,161 2,107 11,161
2014 2,077 10,917 2,077 10,917 2,124 11,236 2,124 11,236
2015 2,089 10,920 2,089 10,920 2,161 11,414 2,161 11,414
2016 2,086 10,853 2,086 10,853 2,185 11,534 2,185 11,534
2017 2,083 10,777 2,083 10,777 2,206 11,642 2,206 11,642
2018 2,074 10,707 2,074 10,707 2,223 11,735 2,223 11,735
2019 2,082 10,733 2,082 10,733 2,256 11,905 2,256 11,905
2020 1,947 9,569 2,079 10,710 2,150 10,893 2,281 12,034
2021 1,942 9,522 2,073 10,663 2,171 11,000 2,302 12,141
2022 1,932 9,455 2,064 10,596 2,187 11,079 2,318 12,220
2023 1,930 9,423 2,062 10,564 2,210 11,191 2,342 12,332
2012-2013 10.8% 5.0% 10.8% 5.0% 12.0% 6.5% 12.0% 6.5%
2013-2019 0.0% -0.4% 0.0% -0.4% 1.1% 1.1% 1.1% 1.1%
2019-2023 -1.9% -3.2% -0.2% -0.4% -0.5% -1.5% 0.9% 0.9%
2013-2023 -0.8% -1.5% -0.1% -0.4% 0.5% 0.0% 1.1% 1.0%
Note: Impact of PHP is reflected beginning in 2020.
Source: Nova Scotia Power, 2013 Load Forecast, May 2013.
NSPI provides energy and peak forecasts for years beyond 2023. The disparity between low and high case scenarios grows even more pronounced when one examines those far reaching projections. For example, under low case scenario energy demand reaches 9,000 GWh in 2030 and 8,750 GWh in 2040, while high case scenario forecasts estimate energy demand would reach 12,000 GWh in 2030 and 12,750 GWh in 2040. Similarly, the low case peak demand levels projections suggest that winter peak demand will reach 1,652 MWs in 2030 and 1,606 MWs in 2040 while high case scenario suggest that peak demand will grow to 2,203 MWs in 2030 and 2,341 MWs in 2040.
Exhibit 2 NSPI Outer Years Forecast Scenarios
Year Low Energy Demand (GWh)
High Energy Demand (GWh)
Low Peak Demand (MWs)
High Peak Demand (MWs)
2030 9,000 12,000 1,652 2,203
2040 8,750 12,750 1,606 2,341
Source: Estimated based on graphic of NSPI Energy and Peak Scenario Analysis, provided by NSPI.
Market Trends for the Supply and Demand of Electricity in Nova Scotia
© 2014 7 icfi.ca
2.2 Key Elements of the NSPI Demand Forecast NSPI combines sector specific sales forecasts with assumed DSM program savings projections when estimating the total future electric demand levels. The sector specific sales forecasts are based on series of econometric models that relate historical economic, weather, retail price, appliance saturation, and customer counts (population) to historical electric sales and use the derived relationships to forecast future sales based on projected or assumed future levels of the model independent variables.
5 The growth of the economic independent variables used in the
energy forecasts is partly based on the Conference Board of Canada’s (CBoC) Economic Outlook,. The assumed projected DSM program savings are based on DSM conservation targets provided by Efficiency Nova Scotia (ENSC) where NSPI assumes that those DSM conservation targets are fully met. The sum of projected electric sales by sector and DSM program savings are then adjusted by historical losses, which have averaged 6.4% over the past five years. For the purpose of the energy demand forecasts, those losses are assumed constant going forward. The peak demand forecasts are calculated based on monthly energy demand forecasts. The monthly energy demand forecasts are translated to peak demand levels with historical coincident load factors. Finally, the calculated peak demands are adjusted for monthly peak loss percentages. This process is applied to all but large customer classes.
2.2.1 Residential Sector Demand The residential sector accounts for roughly 44% of the overall annual energy consumption in Nova Scotia. Based on historical trends and NSPI projections, the key driver of the residential electric demand growth is the customer growth. The customer growth is largely a function the population growth which is projected by NSPI to continue growing at low but steady rate of 0.2% per year. The other factor that has a positive but declining impact on electric demand is the growth in the real disposable income. The CBoC real disposable income growth is projected to slow down over the next decade. The DSM and appliance use index contributions are other primary factors slowing electric demand growth. Based on the latest projections, DSM program contributions are expected to continue reducing residential electric load at their current pace for the next decade. By 2016, the DSM program contributions along with appliance usage index reductions are expected to reduce residential electric load by more than the residential demand is expected to increase due to customer or disposable income growth. Heating load is expected to continue to be the largest single end-use of electricity in the residential sector. Going forward, forecasts expect higher level of penetration of electric heat pumps in the province from heating system upgrades and recent switching from oil to electric heat pumps. However, the overall heating intensity is expected to remain relatively unchanged as higher penetration levels of more efficient heat pump systems (versus electric baseboard) contribute towards additional efficiency gains.
6
NSPI residential econometric model ties the residential electric sales to personal disposable income, an overall-use appliance index, customer base heating degree days, and retail electric price. Under this model, the growth in residential household appliance load is based on a forecast of annual appliance saturation rates and average use per type and age of appliance stock. Similarly,
5 For large customers in commercial and industrial sectors, the survey data are also used to derive energy demand
forecast. 6 Statistical Adjusted End-Use Model Implementation Itron 2012.
Market Trends for the Supply and Demand of Electricity in Nova Scotia
© 2014 8 icfi.ca
the growth in residential customer count is based on a combination of a population forecast and electric usage trends, while annual electric space and water heating penetration rates are based on electricity and furnace oil prices.
2.2.2 Commercial Sector Demand Commercial demand in Nova Scotia reflects just over one third of the annual consumption and has been declining over the last 5-years. NSPI commercial demand model ties commercial sales to province’s real GDP (RQTOS), heating degree days (HDD), and other cyclical and trend components. GDP: Based on CBoC projections, the Province’s GDP is expected to initially grow at or above
average historical growth rates of 1.2%. Heating Degree Days: The commercial model also uses historical 10-year average heating
degree day levels as an approximation of future heating degree day levels. The NSPI recently switched from a 30-year average to a 10-year average to account for recent trends in declining heating degree days. Given the fact that there is no reliable way to forecast long-term weather conditions, it is common practice among electric utilities to assume future weather levels based on 10-30 year historical average levels.
Other trends: other trends considered include DSM and more energy efficient building standards. Given that the weather conditions are assumed to stay constant for the duration of the forecast, the key drivers of the commercial electric demand include GDP growth, as well as DSM, and building standards. As mentioned above, the GDP growth is projected to grow at relatively steady historical rates. The DSM contribution and building standard are the primary factors slowing commercial demand growth. Based on the latest projections, the DSM program reduces commercial electric demand growth by a greater amount than it would otherwise grow. Hence, NSPI anticipates overall declines in the commercial sector electric demand levels.
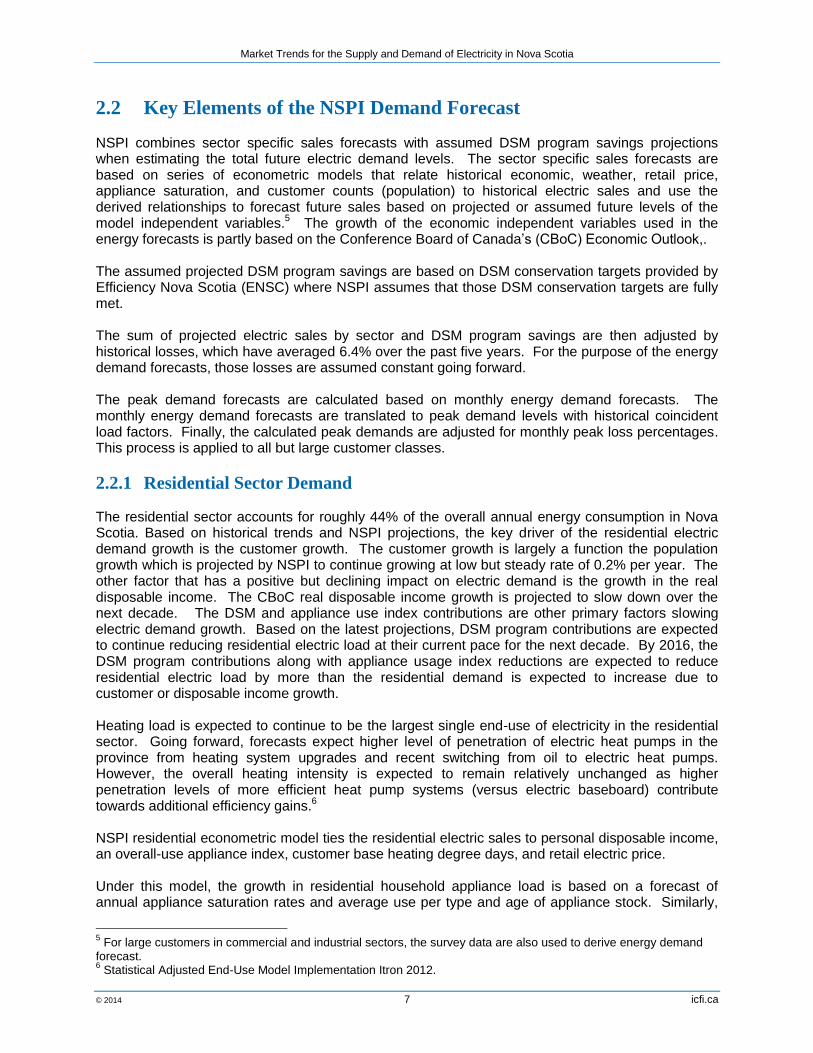
2.2.3 Industrial Sector Demand NSPI small industrial econometric model ties industrial sales to province’s real GDP, non-residential investment, and cyclical and historical trends. The projected GDP and non-residential investment growth are based on CBoC Economic Outlook. The industrial sector consists of over 2,000 customers involved in mining, forestry, and manufacturing activities. In 2012, this sector accounted for 23 percent of Nova Scotia total electricity sales. Industrial electricity sales are dominated by a handful of large users with the five largest customers consuming two-thirds of total industrial electricity sales, and over 22 percent of total electricity sales in Nova Scotia. With this, electricity load in the sector and the province as a whole are sensitive to the production, process and technology changes within the group of large industrial customers. To develop its industrial electricity sales forecast, NSPI divides the industrial sector into three components. The modeling approach is different for each component. Large customers – Assume flat electricity use from 2013 to 2023, except for the Port
Hawkesbury Paper (PHP) mill. In NSPI’s projections, it assumes two scenarios regarding the PHP mill. In 2019, the load retention tariff that the PHP mill pays will end. This special tariff is provided to the PHP mill to support its continued operations. By 2020, two scenarios are considered: the loss of the entire PHP load due to the end of the tariff program, and the continued operation of PHP.

Market Trends for the Supply and Demand of Electricity in Nova Scotia
© 2014 9 icfi.ca
Medium customers – Electricity use is dependent on provincial manufacturing GDP of medium industries.
Small customers – Electricity use is dependent on provincial manufacturing GDP of small industries and non-residential investments.
NSPI considers two scenarios on DSM in their industrial projections: one with DSM, the other without DSM. The DSM scenario assumes the projected impacts of DSM developed by Efficiency Nova Scotia (ENSC). The ENSC DSM impacts are based on three types of DSM program for industries: Efficient product rebates – provide rebates on high efficiency equipment for customers Custom incentives – offer various assistance including technical and financial assistance for
engineering studies, promotion of energy efficient processes and measures Direct Installation – direct installation of energy efficient products, particularly high efficiency
lighting, in small business facilities. Exhibit 2 shows the final NSPI industrial sales projections by scenario. The scenarios and associated results are: Industrial with PHP without DSM – The PHP mill continues to operate, plus no DSM impact.
Industrial electricity sales increase by 712 GWh from 2012 to 2023. Industrial with PHP with DSM – The PHP mill continues to operate, plus DSM impacts. Industrial
electricity sales increase by 524 GWh. Industrial without PHP without DSM – The PHP mill shuts down by 2020, plus no DSM impact.
Industrial electricity sales decrease by 396 GWh. Industrial without PHP with DSM – The PHP mill shuts down by 2020, plus DSM impacts.
Industrial electricity sales decrease by 584 GWh.
Exhibit 2 Industrial Electricity Sales Projections
0
500
1000
1500
2000
2500
3000
3500
2012 2013 2014 2015 2016 2017 2018 2019 2020 2021 2022 2023
Ind
ust
rial
Ele
ctri
city
Sal
es,
GW
h
Industrial w/ PHP w/DSM Industrial w/o PHP w/DSM
Industrial w/ PHP w/o DSM Industrial w/o PHP w/o DSM

Market Trends for the Supply and Demand of Electricity in Nova Scotia
© 2014 10 icfi.ca
The forecasting methodology used by NSPI considers the differentiation amongst segments (large, medium, small-sized industries), the potential for DSM penetration, and applies its internal knowledge of its customer base. Given the relatively small base of the industrial sector, particularly the large industrial segment, the relative importance of the accuracy of the forecast for the large industrial class is high as compared to other segments and sectors. Several factors could affect the demand levels of this sector including the potential for production expansions or contractions in the load levels for the large industrial class. Though several factors may be specific to the industry in which the customers fall (e.g., by NAICS code), many would affect all industrial customers. In addition, the electric consumption levels of the large industrial customers could be impacted by process investments that are likely to change energy demand; investments in future combined heat and power (CHP); impacts of new and future regulations including those related to climate change; and retail price response. These factors could affect not only the process or technology used currently, but also the production levels of manufacturing plants. Some companies could become uncompetitive in the global market if their energy prices increase because of the regulations not impacting competitors' cost of production in other localities. To the extent that energy is not a major cost component of production, most industries are less responsive to energy price changes. Nevertheless, relatively significant changes in prices (e.g., maybe due to climate change policies), or sustained higher price levels could incite industries to invest in energy efficient technologies much more quickly. Some industries could therefore become less competitive (based on electric costs) while others become more competitive, either result could affect the demand from the individual industrial facility Overall, the industrial sector, though the smallest of the three sectors contributing to the NSPI annual demand, has the potential to result in the most unpredictable disruptions to the demand levels in any given period.
2.2.4 End-Use Model NSPI is currently transitioning from using aggregate econometric based models to end-use models for residential and commercial sectors. The transition is aimed at improving the province’s demand forecasting capability. The end-use approach and the econometric approach are similar in the sense that they are reliant on similar data series and parameterize these series through a mathematical formulation. NSPI Statistically Adjusted End-Use Model (SAE) was developed by Itron in 2012. The model provides long-term estimates of end-use energy intensity for the residential and commercial rate classes. The end-use energy forecasts generated with SAE are also used for estimation of monthly peak demand levels. Furthermore, by decomposition of the aggregate demand consumption levels by end-use, the SAE model can be used to assess future DSM impact. The SAE model accounts for changes in end-use saturation levels and standards, efficiency projections, population trends, economic conditions, retail price changes and weather. The SAE model provides detailed estimates for residential and commercial sectors. The SAE’s residential model captures saturation and efficiency for 17 separate residential end-uses. The SAE’s commercial model provides electric demand estimates for different end-uses. Under SAE model framework, the end-use and customer counts are modeled separately. SAE residential models estimate electric demand on per-household basis, while its commercial models estimate electric demand per square foot across a number of different commercial building types. This approach gives it a potential advantage over aggregate models that model those two components together as those components tend to be driven by unrelated factors. That approach very often translates to more accurate forecasts.

Market Trends for the Supply and Demand of Electricity in Nova Scotia
© 2014 11 icfi.ca
2.3 Potential Technologies Impacting Utility Demand Electric vehicles and distributed generation resources represent technologies that recently, on an international scale, have seen greater penetration into the electric markets. These technologies growth in use largely reflect consumer, rather than utility, driven penetration and further, these technologies integrate to the distribution network directly, rather than to the transmission network where utilities have traditionally considered supply options. However, there are a number of programs sponsored by utilities in North America and elsewhere that encourage the utilization of distributed generation sources. These types of programs range from concentrated pilot incentive programs to broader scale feed-in tariff programs. In concept, programs which are sponsored by the utility, or system operator, can be targeted to provide needed support to the grid and potentially offset or supplement through synergistic benefits, other investment which a utility/system operator may make to maintain transmission and distribution system reliability and efficient operations. This section provides background on promising areas of growth on the distributed network including electric vehicles and distributed generation. Though these technologies have promising outlooks in general, there are several limiting elements in Nova Scotia. Given this, based on current conditions and trends, one would not anticipate that these resources would have a sizable impact on utility level demand for the immediate and mid-terms. Nonetheless, these technologies have significant potential to impact the longer term operations of the system and should be considered.
2.3.1 Electric Vehicles Impact Based on Canadian registration data from R.L. Polk, as of January 2014 a total of 5,863 plug-in electric vehicles (PEVs) were registered in Canada.
7 Overall, 44% of the PEVs were battery-electric
vehicles (BEV) and 56% were plug-in hybrid electric vehicles (PHEV). The majority of PEVs were registered in Quebec, Ontario, and British Columbia (largely due to province level electric vehicle incentives), while only 22 PEVs were registered in Nova Scotia.
7 FleetCarma.com. “EV Sales in Canada: January 2014 Update & Provincial Summary,” last modified on March 24,
2014, accessed April 11, 2014, http://news.fleetcarma.com/2014/03/24/canadian-electric-vehicle-sales-jan-2014-provincial-summary/#more-2719

Market Trends for the Supply and Demand of Electricity in Nova Scotia
© 2014 12 icfi.ca
Exhibit 3 Total Plug-in Electric Vehicles by Province, January 2014 (FleetCarma.com)
As shown in the exhibit below, in 2013, PEV sales represented around 0.25% of total passenger car sales in Canada (excluding trucks and SUVs).
8 For comparison purposes, hybrid sales averaged
around 3% of total passenger vehicles sales in the same year. Exhibit 4 2013 Canadian Sales of PEVs Compared to Total Passenger Car Sales (FleetCarma.com)
Of the 22 vehicles registered in Nova Scotia, ten of them are affiliated with NSPI’s ShareReady Electric Vehicle Pilot Program.
9 NSPI funded the ShareReady program in 2011 to generate interest
in PEVs and promote the technology in Nova Scotia. In addition to acquiring two Nissan LEAFs for company use, NSPI successfully engaged with partners
10 to negotiate the purchase of an additional
8 FleetCarma.com. “EV Sales in Canada: January 2014 Update & Provincial Summary,” last modified on March 24,
2014, accessed April 11, 2014, http://news.fleetcarma.com/2014/03/24/canadian-electric-vehicle-sales-jan-2014-provincial-summary/#more-2719 9 Interview with Jason Leadbetter and Anne-Marie Curtis (ShareReady EV contacts), Nova Scotia Power Inc., March
31, 2014. 10
Partners include Avis, DHSE, EastLink, Encanex, CBCL Limited, Port of Halifax, Saint Mary’s University, and Wilson Fuels Co. Limited.

Market Trends for the Supply and Demand of Electricity in Nova Scotia
© 2014 13 icfi.ca
eight LEAFs.11
NSPI also contributed to the cost of Level 2 electric vehicle supply equipment (EVSE) at partner locations. In early 2014, NPSI commissioned a study to assess the charge dynamics of the program vehicles.
12
According to NSPI, the key barriers to PEV adoption in Nova Scotia are the limited range of all-electric vehicles, lack of publicly-accessible PEV charging infrastructure which has led to range anxiety among consumers, and the high initial cost of the PEVs compared to conventional vehicles.
13 To date, NSPI has not developed a protocol to monitor the purchase and installation of
EVSE in Nova Scotia due to the limited number of PEV sales.14
In addition to the lack of vehicles, Nova Scotia also has limited availability of publicly-accessible charging infrastructure. In April 2014, there were approximately 30 Level 2 EVSE in the entire province.
15,16 There are plans to install one DC Fast Charger in Truro, NS in 2014 and another four
in the Greater Halifax area (funded in part by NSDOE).17
Exhibit 5 Publicly-accessible Level 2 EVSE in Nova Scotia (PlugShare.com)
It is difficult to forecast how many PEVs (and also the percentage of BEVs and PHEVs) will be sold in Nova Scotia due to the lack of available trend data. Advocacy groups, such as Electric Mobility Canada, have developed targets for Canadian sales of EVs. As part of the 2010 Electric Vehicle Technology Roadmap for Canada, stakeholders prepared a strategic vision for the deployment of at
11
Nova Scotia Power Inc. “ShareReady Electric Vehicle Pilot Program,” accessed April 11, 2014, https://www.nspower.ca/en/home/community/electric-vehicles/default.aspx 12
A copy of the material was not available for review. 13
Interview with Jason Leadbetter and Anne-Marie Curtis (ShareReady EV contacts), Nova Scotia Power Inc., March 31, 2014. 14
Interview with Jason Leadbetter and Anne-Marie Curtis (ShareReady EV contacts), Nova Scotia Power Inc., March 31, 2014. 15
PlugShare.com. “EV Charging Station Network,” accessed April 11, 2013, http://www.plugshare.com/ 16
Canadian Automobile Association. “EV Charging Station Locator,” accessed April 11, 2013, http://www.caa.ca/evstations/ 17
Interview with Dr. David Swan, DHS Engineering Inc., April 9, 2014.

Market Trends for the Supply and Demand of Electricity in Nova Scotia
© 2014 14 icfi.ca
least 500,000 PEVs on Canadian roads by 2018.18
What portion of those vehicles would be deployed in Nova Scotia will largely depend on incentives, the availability of at-home, workplace, or public charging infrastructure, consumer education, and a reduction in the upfront PEV cost. In fact, even if 500,000 PEVs are deployed in Canada by 2018 (a hundred-fold increase in four years), the Roadmap forecasts that the vehicles would only consume an additional 1.5 TWh of electricity annually,
19 which would represent about 0.2% of the total Canadian electricity generation in that
year.20
In the unlikely event that all of these PEVs charged simultaneously during peak demand using 240 V, 15 A EVSE, it would only represent about 1.5% of the present peak output, or about 1.5 GW.
21
Despite the current barriers to PEV deployment, stakeholders in Nova Scotia are currently working to expand the number of PEVs and EVSE in the province through a number of innovative projects. In April 2013, the Province of Nova Scotia released a Sustainable Transportation Strategy that included action items to encourage the use of PEVs through grant awards and evaluation of public recharging infrastructure.
22 Other individuals are working to deploy PEV buses among major transit system
operators, such as Metro Transit, Kings Transit, and Cape Breton Regional Transit.23
Furthermore, there are activities to promote PEV deployment proximate to clean energy technologies, such as the Wind to Wheels Initiative in conjunction with the Nuttby Wind Field near Truro.
24 Current
expectations of NSPI, which has prepared a long-term forecast of PEV deployment for the utility’s IRP
25, indicate that PEVs will not have a significant impact on utility demand for the foreseeable
future.26
2.3.2 Distributed Generation Impact Distributed energy resources are dispersed, modular and small compared to conventional power plants. Across North America, several high level trends focused toward distributed assets are appearing. Recent drivers that have assisted in this trend include incidents that brought into question the resiliency of the electric grid to respond to large impact events. The continued decline in costs for many renewables resources including solar photovoltaic (PV) resources and wind resources and the application of incentive programs such as tax credits and net metering at full retail rates has brought such resources closer to grid price parity. Opportunities for developers to respond to these trends have been appearing more widely with increasing creativity in applications of products and services such as demand response utilized as storage and ramping products that respond to the focus on distributed resources.
27
18
Electric Mobility Canada. “Electric Vehicle Technology Roadmap for Canada”. February 2010. p.1. https://www.nspower.ca/en/home/community/electric-vehicles/default.aspx 19
Assumes the average PEV consumes 3,000 kWh/yr. 20
Electric Mobility Canada. “Electric Vehicle Technology Roadmap for Canada”. February 2010. p.28. https://www.nspower.ca/en/home/community/electric-vehicles/default.aspx 21
Electric Mobility Canada. “Electric Vehicle Technology Roadmap for Canada”. February 2010. p.28. https://www.nspower.ca/en/home/community/electric-vehicles/default.aspx 22
Province of Nova Scotia. “Choose How You Move: Sustainable Transportation Strategy”. February 2013. p.33. http://novascotia.ca/sustainabletransportation/docs/Sustainable-Transportation-Strategy.pdf 23
Interview with Wayne Groszko, Dalhousie University, April 3, 2014. 24
Interview with Dr. David Swan, DHS Engineering Inc., April 9, 2014. 25
A copy of the report was not available for review. 26
Interview with Jason Leadbetter and Anne-Marie Curtis (ShareReady EV contacts), Nova Scotia Power Inc., March 31, 2014. 27
Storage concepts in the demand response envelope include thermal storage options within commercial buildings for example. Likewise, automated demand-response typically responds to prices, but it could be used as a dispatchable resource to adjust demand in real-time to optimize for maximum renewables. Automated demand response works by connecting with a building’s heating, ventilation, air conditioning, and lighting systems to adjust them in real-time as grid conditions change. Smart appliances are another example such as appliances like dishwashers or washing machines can receive data from grid operators about when to turn on or off, based on the value of load adjustments to balance supply.
Market Trends for the Supply and Demand of Electricity in Nova Scotia
© 2014 15 icfi.ca
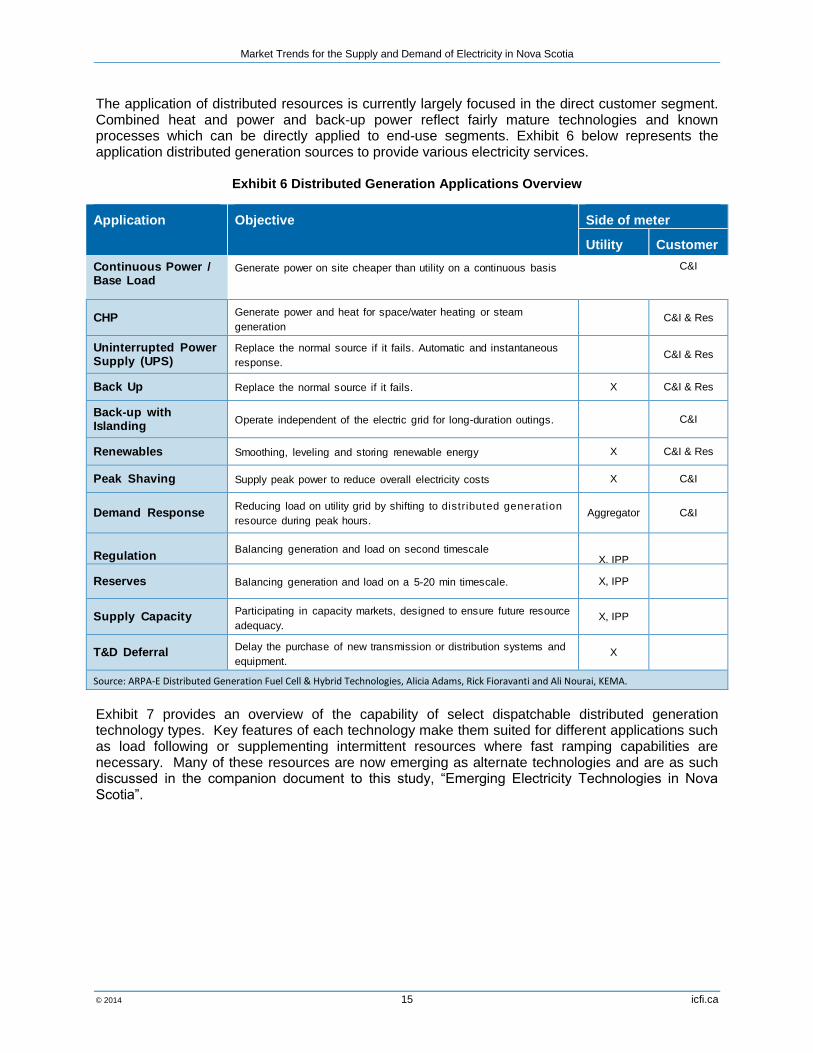
The application of distributed resources is currently largely focused in the direct customer segment. Combined heat and power and back-up power reflect fairly mature technologies and known processes which can be directly applied to end-use segments. Exhibit 6 below represents the application distributed generation sources to provide various electricity services.
Exhibit 6 Distributed Generation Applications Overview
Application Objective Side of meter
Utility Customer
Continuous Power / Base Load
Generate power on site cheaper than utility on a continuous basis C&I
CHP Generate power and heat for space/water heating or steam
generation C&I & Res
Uninterrupted Power Supply (UPS)
Replace the normal source if it fails. Automatic and instantaneous
response. C&I & Res
Back Up Replace the normal source if it fails. X C&I & Res
Back-up with Islanding Operate independent of the electric grid for long-duration outings. C&I
Renewables Smoothing, leveling and storing renewable energy X C&I & Res
Peak Shaving Supply peak power to reduce overall electricity costs X C&I
Demand Response Reducing load on utility grid by shifting to distributed generation
resource during peak hours. Aggregator C&I
Regulation Balancing generation and load on second timescale
X, IPP
Reserves Balancing generation and load on a 5-20 min timescale. X, IPP
Supply Capacity Participating in capacity markets, designed to ensure future resource
adequacy. X, IPP
T&D Deferral Delay the purchase of new transmission or distribution systems and
equipment. X
Source: ARPA-E Distributed Generation Fuel Cell & Hybrid Technologies, Alicia Adams, Rick Fioravanti and Ali Nourai, KEMA.
Exhibit 7 provides an overview of the capability of select dispatchable distributed generation technology types. Key features of each technology make them suited for different applications such as load following or supplementing intermittent resources where fast ramping capabilities are necessary. Many of these resources are now emerging as alternate technologies and are as such discussed in the companion document to this study, “Emerging Electricity Technologies in Nova Scotia”.

Market Trends for the Supply and Demand of Electricity in Nova Scotia
© 2014 16 icfi.ca
Exhibit 7 Dispatchable Distributed Generation Technology Capabilities
Characteristic Startup response
Ramping response
Baseload feasibility
Fixed O&M
Variable O&M
Noise pollution
Emissions Operating temp.
IC T
ec
hn
olo
gie
s
Reciprocating Engine
Fast Fast Low High High High High Medium
Micro turbine Fast Fast Low Medium High High Low High
Combustion Gas Turbine
Medium Fast High High High High Low High
Fu
el
Cell T
ech
no
log
ies
Proton Exchange Membrane (PEMFC)
Medium Fast Medium Low Medium Low Low Low
Phosphoric Acid (PAFC)
Slow Slow High High Medium Low Low Medium
Molten Carbonate (MCFC)
Slow Slow High High Medium Low Low High
Solid Oxide (SOFC)
Slow Slow High Low High Low Low High
Sto
rag
e
High Power like LiIon
Fast Fast Low Low Medium Low Low Low
High Energy like NaS
Fast Fast Low Medium Medium Low Low High
Source: ARPA-E Distributed Generation Fuel Cell & Hybrid Technologies, Alicia Adams, Rick Fioravanti and Ali Nourai, KEMA.
In addition, the intermittent distributed resources, in particular solar rooftop, have begun to show higher penetration levels. In large part, adoption rates for such technologies are driven by demographic and economic characteristics of a market area; however, the potential penetration spans broad geographic market areas. Because of the geographic distribution of distributed PV resources, their place in the power system topology and the variable nature of their output, the traditional market constructs built around fixed-load and dispatchable power do not apply. Though these resources have advantages of being located directly at the load, and as such can reduce losses and address locational constraints directly, the grid design may not be supportive of large scale adoption. In particular, large scale addition of intermittent resources may result in reliability concerns which also must be considered in an assessment of distributed versus central generation or transmission resources for reliability and adequacy purposes. Further discussion of intermittent distributed resources can be found in the “Emerging Electricity Technologies in Nova Scotia” companion document.

Market Trends for the Supply and Demand of Electricity in Nova Scotia
© 2014 17 icfi.ca
2.4 Potential Demand Growth Pathways
2.4.1 Background As discussed above, any long-term demand forecast is subject to a series of assumptions and have a high degree of uncertainty built into them. Their accuracy is largely dependent on the accuracy of the underlying population, economic, weather, retail price, and end-use intensity trends assumptions and the accuracy of the model itself. Given all of these uncertainties, the electric demand forecasters often rely on historical trends to benchmark their forecasts against, and also consider a number of alternate scenarios for key electric demand drivers.
2.4.1.1 Accounting for Historical Trends Historical electric demand in NS grew at an average annual growth rate of 2.4 percent between 1997 and 2007, but started to decline during, and in years after, the latest recession (2008). The primary driver of the decline in the overall electric demand during recession and post-recession years was a drastic decline in industrial sector demand, as sales declined, and some businesses shut or downsized. The Nova Scotia’s industrial sector is primarily comprised of paper, tires, cement, wood, food and seafood industries. The paper industry experienced sharp declines in production as a result of the recession and has only recently shown signs of stabilization. While industrial sector electric load was in sharp decline, residential and commercial sector electric demand remained relatively flat. The lack of growth in the residential sector was largely driven by declines in heating degree days during the period and growing electricity prices. The lack of growth in commercial sector was due to lower level of general economic activity and the impact of DSM.
Exhibit 8 Historical Electric Sales Growth Rates
Period Residential Commercial Industrial Total Sales
Total Energy
1997-2007 1.6% 2.1% 3.9% 2.5% 2.4%
2008-2012 0.0% -0.3% -14.9% -4.6% -4.4%
Nova Scotia’s Gross Domestic Product (GDP) grew at an average annual rate of 2.7 percent between 1997 and 2007. That level of growth declined during and in years that followed the latest recession where the province’s GDP grew at an average annual rate of 0.6 percent.
28
2.4.2 Including Economic Performance Expectations
Based on the available statistics, the Nova Scotia’s 2012 GDP was estimated to be 27.5 billion dollars
29 and was expected to grow by 1.8 and 1.5 percent in 2013 and 2014 respectively. Personal
Disposable income was expected to grow at a slower pace of 0.5% in both 2013 and 2014, while population was expected to stay relatively unchanged with as little as 0.1% and 0.2% expected growth in 2013 and 2014 respectively.
28
NS Power 10 Year Energy and Demand Forecast May 2, 2013. 29
In constant 2012 dollars.

Market Trends for the Supply and Demand of Electricity in Nova Scotia
© 2014 18 icfi.ca
Exhibit 9 Projected Economic Performance
Period Personal Disposable Income
Gross Domestic Product
GDP in Manufacturing
Consumer Price Index
Population Housing Starts
2012-2013 0.5% 1.8% 2.4% 2.0% 0.1% -17.5%
2013-2014 0.5% 1.5% 2.7% 2.2% 0.2% -10.5%
2013-2020 0.9% 1.5% 4.1% 2.0% 0.2% -2.2%
2013-2025 0.7% 1.2% 2.4% 2.0% 0.2% -4.0%
2013-2040 0.5% 1.0% 1.6% 2.0% 0.0% -4.7%
The long-term economic projections by Conference Board of Canada (CBoC) suggest that Nova Scotia GDP will grow an average annual rate of 1.5% between 2013 and 2020, and by approximately 0.9% between 2020 and 2040.
30
2.4.3 Range of Expected Electric Demand Projections Given the inherent uncertainty in demand forecasting, NSPI produced a range of forecasts that consider alternate views on future DSM growth, load growth, as well as scenarios that account for changes in industrial sector composition. The most noticeable near to mid-range time horizon inflection point are scenarios that assume the shuttering of the Port Hawkesbury Paper (PHP) mill. The second most noticeable differentiator among different weather scenarios is the extent of the growth in DSM contributions, as discussed in Chapter 3.
Source: NSPI
30
CBoC provides forecasts until year 2035, ICF extrapolated the economic variables growth based on the CBoC’s projected growth rate in their last forecast year.

Market Trends for the Supply and Demand of Electricity in Nova Scotia
© 2014 19 icfi.ca
As shown, there is a broad range in the potential forecasts considered, from just under 8 TWh to just over 13 TWh in 2040, although the cone of variability excludes the two outliers, resulting in a range of 8.5 TWh to 12.5 TWh. The largest single uncertainty is focused on the retention of a single large customer, at just over 1 TWh annual load. The combined impact of overall uncertainty in load conditions, combined with the customer retention, result in an extremely wide planning bandwidth. This is a particular issue in the face of long-term investment planning cycles for long-lived capital intensive resources such as transmission or central generation stations. The factors that can confirm individual trends will not necessarily be apparent when the decision to move forward with a capital investment project is made. If the trend results in lower demand than projected when the decision is supported, the result may be stranded costs on those assets. In contrast, if investments are not made on a timely basis and higher load growth occurs, the costs of alternative resources will tend to be at a higher overall cost to consumers and may result in a patchwork design that is inefficient to maintain and support on a long-term forward basis. Given that the most unpredictable single uncertainty stems from the industrial sector, the next section of this paper provides an overview of several of the key uncertainties in the industries affecting electric demand in Nova Scotia.
2.4.4 Uncertainty in Industrial Electric Demand Projections The most important characteristic of industrial electricity demand in Nova Scotia is its reliance on a few large plants. These large plants are primarily related to the paper and forestry, cement, and rubber, and plastics industries. Any production or technology/process change in these plants could substantially impact total industrial electricity demand in the province. The NSPI projections of industrial electricity sales illustrate this with the scenarios involving the Port Hawkesbury Paper (PHP) mill. Without the PHP mill, total industrial electricity demand in Nova Scotia declines by 1,108 GWh in 2020 or 38 to 41 percent of total industrial electricity sales (depending on DSM scenario) that same year. In developing projections of electricity demand in the industrial sector, several major factors have to be considered: Industrial production Process and technology changes, including penetration of energy efficient technologies
Driven by capital stock turnover Driven by energy prices Driven by other factors including new regulations
The below discussion highlights several factors which could be accounted for in the industrial sector demand forecasting to allow for a reduction in the overall variability through 2040 as currently projected by NSPI.
Paper and Forestry Industry Based on information provided by NSPI and ICF’s own calculations of energy use, the paper industry, which includes the PHP mill, is the largest user of electricity in Nova Scotia. It is well established that the paper industry (unlike the paperboard industry), particularly in U.S. and Canada has suffered the last several years and as a result many pulp and paper mills have idled or permanently shut down. Nova Scotia has lost several mills in recent years. The two remaining mills in Nova Scotia produce calendared paper, thermo mechanical and kraft pulp. The kraft pulp mill has a better outlook because kraft pulp is also used to make paperboard products, whose market is healthier than that of paper. The PHP mill produces the calendared paper and thermo mechanical pulp, whose markets may continue to be under financial stress through the foreseeable future.

Market Trends for the Supply and Demand of Electricity in Nova Scotia
© 2014 20 icfi.ca
One way the industry could overcome this challenge is to convert the mills to produce products that have better market performance such as converted paper (e.g., packaging, containers), tissue, and paperboard products. The PHP mill has recently announced a test plan to expand its products to include sugars extracted from excess wood chips and fiber, that could be converted to plastics or rubber products.
31
The industrial projections of NSPI include two scenarios where the PHP mill is assumed to continue operating beyond 2019 or not. It is difficult to evaluate the likelihood of this mill’s viability to continue operating. As such, this mill provides a huge uncertainty in any industrial energy forecast for Nova Scotia. Further, because Canadian paper industry is reliant on the demand for paper in the U.S., it is critical to evaluate the market situation of this industry in the U.S. and incorporate that situation in the projections.
Cement Industry Cement is used in building infrastructure such as roads, bridges and buildings. In general, cement plants are located near the demand source and as such cement demand is driven by local/regional construction activity. There is one major cement plant in Nova Scotia, and it is owned by Lafarge. Although imports are seen generally as a supplemental source when there is insufficient cement to fill demand, imports could become an attractive option to satisfy demand as environmental requirements are becoming more stringent. Also, as cement plants are owned by companies with global presence, imports via intra-company movements of cement become an easily accessible source. Lafarge has recently announced the company’s plan to reduce their production of clinker, an energy and CO2-intensive product at the Nova Scotia plant. To reduce the production of clinker, Lafarge is planning to produce blended cement which uses 20 percent less clinker to reduce the plant’s CO2 emissions, starting 2015.
32
Over the long-term, cement production will continue to be driven by local/regional construction activity. As a result, clinker production will follow the cement production trend.
Rubber Industry The rubber industry, particularly tire manufacturing, has an important presence in Nova Scotia. Michelin’s presence in the province is important as the company is the third largest producer of tires in the world.
33 The tire market is heavily reliant on the transportation equipment market. Although the
transportation market has been stressed over the last several years due to the global recession, recovery has begun and expected to continue.
34 However, Michelin has just announced layoffs this
year and next year in one of its manufacturing plant in Nova Scotia.35
The company’s decision reflects the fall in demand for small tires, which are produced in one of the Michelin plants in the province. The NSPI projections use regressions equations for the electricity demand of the small and medium sized businesses. ICF believes that although this method is sufficient, a forecast by industry group (e.g., by NAICS code) may be more appropriate because market situations differ by industry. If
31
http://www.989xfm.ca/port-hawkesbury-paper-hints-at-possible-expansion-of-mills-product-line/ 32
http://www.cement.ca/en/Newsroom/Lafarge-Brookfield-Plant-first-in-North-America-to-produce-low-carbon-cement.html 33
http://www.tirereview.com/Content/Site309/ContentBlocks/919902012TireMa_00000056257.pdf 34
http://www.prweb.com/releases/2014/02/prweb11607675.htm 35
http://www.theglobeandmail.com/report-on-business/michelin-to-cut-500-jobs-at-nova-scotia-plant/article17196186/

Market Trends for the Supply and Demand of Electricity in Nova Scotia
© 2014 21 icfi.ca
projections are made by industry group, the projections will be able to capture a more detailed outlook of the industries that are important in the province, currently and in the future. Another important factor that is essential in projecting industrial electricity demand is the change in electricity intensity as a result of energy efficiency investments and/or process and technology changes. These investments and technology changes could be brought about by capital stock turnover, regulations and/or changing energy prices. The assumption of flat electricity demand for large electricity users basically considers unchanging energy intensity for these users. Over a short term period, this might be acceptable, but over the long-term, this approach underestimates the potential reductions due to production efficiencies. Also, the flat demand assumption, as well as the use of regression equations (for medium and small loads) make changes in energy intensity less transparent and would make evaluating of impacts of different scenarios more difficult. The DSM assumptions incorporated in the NSPI projections provide a reasonable set of expectations of the participation of industries’ in DSM programs. The final item of note in the NSPI projections is the market penetration of CHP. The paper and forestry, cement, and rubber industries are good potential applications of CHP. Currently, only the paper and forestry industry has CHP, including the PHP mill. Nevertheless, the major industries in Nova Scotia, including cement, rubber, and food have good CHP potential. With appropriate electricity and gas prices, particularly with high electricity and low gas prices, CHP becomes an economical option for industries to cogenerate electricity and steam. With cement, the CHP potential is more waste heat to power (WHP), which means capturing the waste gases coming from the cement kilns and use them to generate electricity. In this case, even fuel prices become irrelevant to the business case for CHP. In summary, the largest single customer impact to the electric demand forecast would be driven by the industrial sector. Key variables include the retention of a single large customer and the adoption rate of DSM at industrial facilities. A greater focus on the factors affecting industrial load may result in greater predictability to this overall forecast for this sector, and hence, allow for a reduced bandwidth assessment of the overall demand variation. However, uncertainty in load forecasting will never be able to be entirely eliminated, and examination of alternate scenarios to discover the bandwidth surrounding the baseline expectation is a reasonable practice to discern the impact of such uncertainty.
2.5 In Summary The Nova Scotia system is a winter peaking system. Recent trends show a stronger growth in the winter peak than in the summer peak where winter demand growth has been driven by electric heat pump and other heating loads. In contrast, summer air conditioning requirements are limited. Going forward, there is a potential for continuation of this trend which would result in a greater difference in the summer and winter requirements for load serving resources. This impact could be limited based on the overall levels of demand growth which for the long-term are driven by economic conditions which can particularly influence the industrial sector. Given the significant share of total energy needs driven by the industrial sector, and the fairly limited number of industrial customers, the largest single potential up or down side to load growth is driven by industrial load. Relative to other load classes, industrial load tends to be highly base loaded and at high load factors (meaning daily loads are relatively flat).
Market Trends for the Supply and Demand of Electricity in Nova Scotia
© 2014 22 icfi.ca
3 Energy Efficiency and Conservation (2014-2040) Energy efficiency (EE), together with renewables and other conventional electricity supply options, represent resources that Nova Scotia Power Inc. (NSPI) can draw on to meet the province’s forecast growth in demand for electricity services over the current planning period, which extends to 2040. Ratepayer-funded DSM programs have been delivered to the province’s electricity customers since 2008. The first two years of programming were administered by NSPI but, in 2010, responsibility for program delivery was transferred to Efficiency Nova Scotia Corporation (ENSC). ENSC is a third-party entity created by the Government of Nova Scotia that works closely with both NSPI and provincial electricity users in an attempt to ensure that cost-effective energy saving opportunities are made readily available to customers and that these savings opportunities are integrated within NSPI’s system planning and operations
36.
This chapter is intended to inform public consultation on the contribution of energy efficiency (EE) within Nova Scotia's current integrated resource planning (IRP) process. To do so, this chapter provides: An overview Nova Scotia’s energy efficiency resource potential. This discussion presents a
summary of the findings contained in ENSC’s recently published report entitled, Energy Efficiency Market Potential Study 2015-2040, which was prepared by Navigant Consulting in collaboration with ENSC and NSPI. The study provides a profile of how electricity is currently used within Nova Scotia together with an estimate of future electricity consumption levels, both in the absence of new EE programs, and under a number of defined Achievable Potential EE program scenarios.
A summary of Nova Scotia's EE program experience to date. This discussion reports the actual verified energy savings and program costs to date and compares them with the targets set out in the previous NSPI integrated resource plan (IRP), which was completed in 2009.
A profile of future Nova Scotia EE programs under consideration. This discussion reports
on the status of Nova Scotia’s current commitments to future EE programs, together with those set out in the recently completed EE market potential study and compares each with the scope and costs experienced in other jurisdictions. This discussion concludes with a comparison of the forecast EE program costs to the current cost estimates for a number of electricity generation options.
3.1 Nova Scotia’s Energy Efficiency Resource Potential Energy efficiency (EE) programs have been delivering electrical energy and demand savings in jurisdictions throughout North America for over three decades and energy efficiency is now regularly incorporated within the long term electricity planning process. Today, the majority of utility electricity long term planning is conducted within an integrated resource planning (IRP) process, such as the one currently taking place within Nova Scotia. A scan of North American jurisdictions shows that there are a variety of ways in which energy efficiency is treated within the integrated resource planning process. A recent report by the American Council for an Energy-Efficient Economy (ACEEE)
37 determined that some jurisdictions treat energy
efficiency in a similar manner as other supply side resources within the IRP. In this IRP approach,
36
The Electricity Efficiency and Conservation Plan released by the Government of Nova Scotia in April 2014 calls for
the creation of a new non-profit entity that would operate EE under the Efficiency Nova Scotia brand starting in 2015. 37
ACEEE, “The Treatment of Energy Efficiency in Integrated Resource Plans”, January 2013.

Market Trends for the Supply and Demand of Electricity in Nova Scotia
© 2014 23 icfi.ca
once future electricity needs are estimated, energy efficiency competes with conventional new generation as well as alternate and renewable energy resources to meet those future needs. However, some jurisdictions still do not treat energy efficiency and supply resources on a comparable basis. Typically, in these cases, the jurisdiction simply deems a certain amount of energy efficiency to be available, reduces the load forecast accordingly and then fills the resource gap through supply options even if the deemed amount of energy efficiency leaves potential savings on the table that are less costly than supply resources. Nova Scotia has adopted the former, more rigorous approach to the incorporation of EE within the IRP process. Exhibit 10 presents a simplified profile of a “typical” planning cycle from the perspective of energy efficiency. In Canada, this cycle is typically repeated on a 3 to 5 year basis.
Exhibit 10 The Energy Efficiency – Integrated Resource Planning Cycle
As illustrated in Exhibit 10, the starting point in this planning cycle is an EE market potential study, which provides an assessment of the size and characteristics of the market potential for energy efficiency over the electricity planning period, which in the current case extends to 2040. The primary objective of market potential studies, such as the ENSC
38 report entitled, Energy
Efficiency Market Potential 2015-2040, is to inform the discussion of how much EE should be incorporated into the province’s long term electricity planning. ENSC’s EE market potential assessment provides a profile of where electricity is used today, what trends in future electricity use are expected in the absence of new EE initiatives, and most importantly, estimates the scope of EE market opportunities and the related estimated costs of acquiring those savings, under differing potential investment scenarios.
38
Navigant Consulting, “Energy Efficiency Market Potential 2015-2040”, prepared for Efficiency Nova Scotia Corporation (ENSC), 2014.
Market Trends for the Supply and Demand of Electricity in Nova Scotia
© 2014 24 icfi.ca
Nova Scotia Expected End Use Market Trends The ENSC EE market potential study reported that total electricity use in Nova Scotia was about 9,700 GWh in 2012 and, in the absence of new DSM programs, total provincial electricity use is expected to grow to about 13,900 GWh by 2040, under the Base Case Forecast with no new investment in EE programs.
39 The potential for EE to reduce this load growth is discussed below. In
2012, that electricity use was divided among residential (44%), commercial (34%) and industrial (22%) customers; the share of electricity use among those sectors is expected to remain relatively stable over the period, under this forecast. Further details on electricity use by major end use within Nova Scotia’s residential and commercial sectors are presented in Exhibit 11 through Exhibit 14.
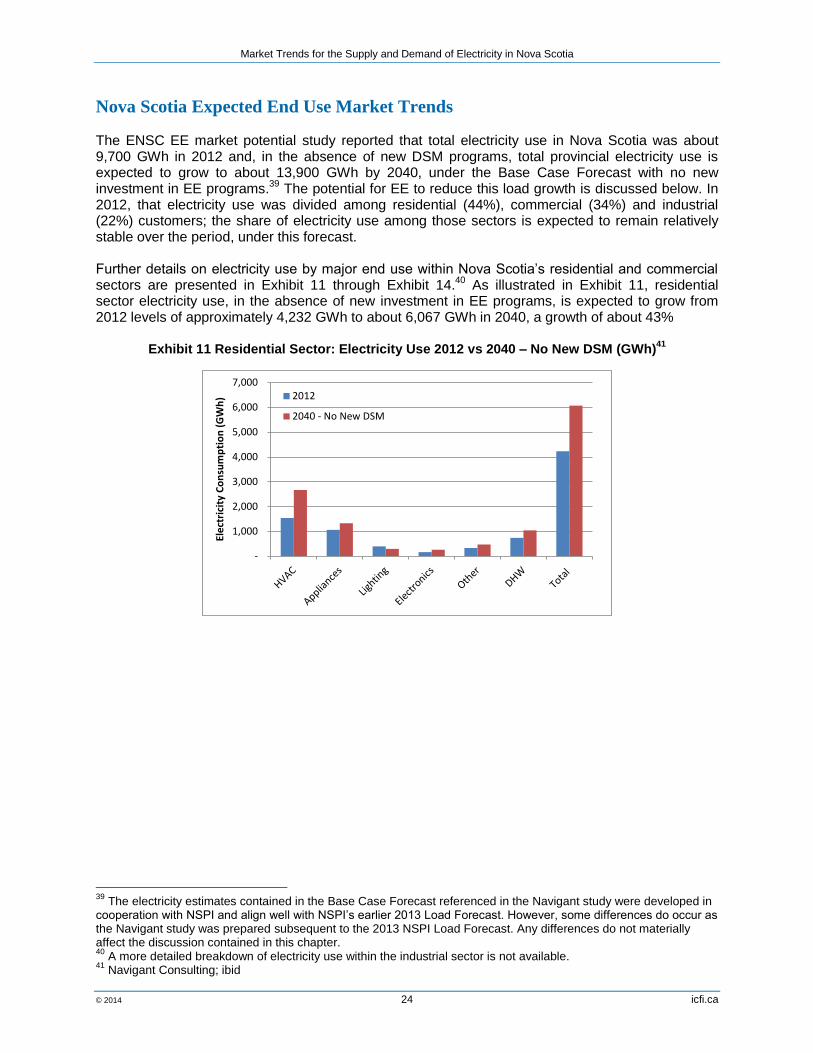
40 As illustrated in Exhibit 11, residential
sector electricity use, in the absence of new investment in EE programs, is expected to grow from 2012 levels of approximately 4,232 GWh to about 6,067 GWh in 2040, a growth of about 43%
Exhibit 11 Residential Sector: Electricity Use 2012 vs 2040 – No New DSM (GWh)41
39
The electricity estimates contained in the Base Case Forecast referenced in the Navigant study were developed in cooperation with NSPI and align well with NSPI’s earlier 2013 Load Forecast. However, some differences do occur as the Navigant study was prepared subsequent to the 2013 NSPI Load Forecast. Any differences do not materially affect the discussion contained in this chapter. 40
A more detailed breakdown of electricity use within the industrial sector is not available. 41
Navigant Consulting; ibid
-
1,000
2,000
3,000
4,000
5,000
6,000
7,000
Ele
ctri
city
Co
nsu
mp
tio
n (
GW
h) 2012
2040 - No New DSM
Market Trends for the Supply and Demand of Electricity in Nova Scotia
© 2014 25 icfi.ca
Exhibit 12 Breakdown of Residential Energy Consumption in 2012 (Left) and 2040 (Right)
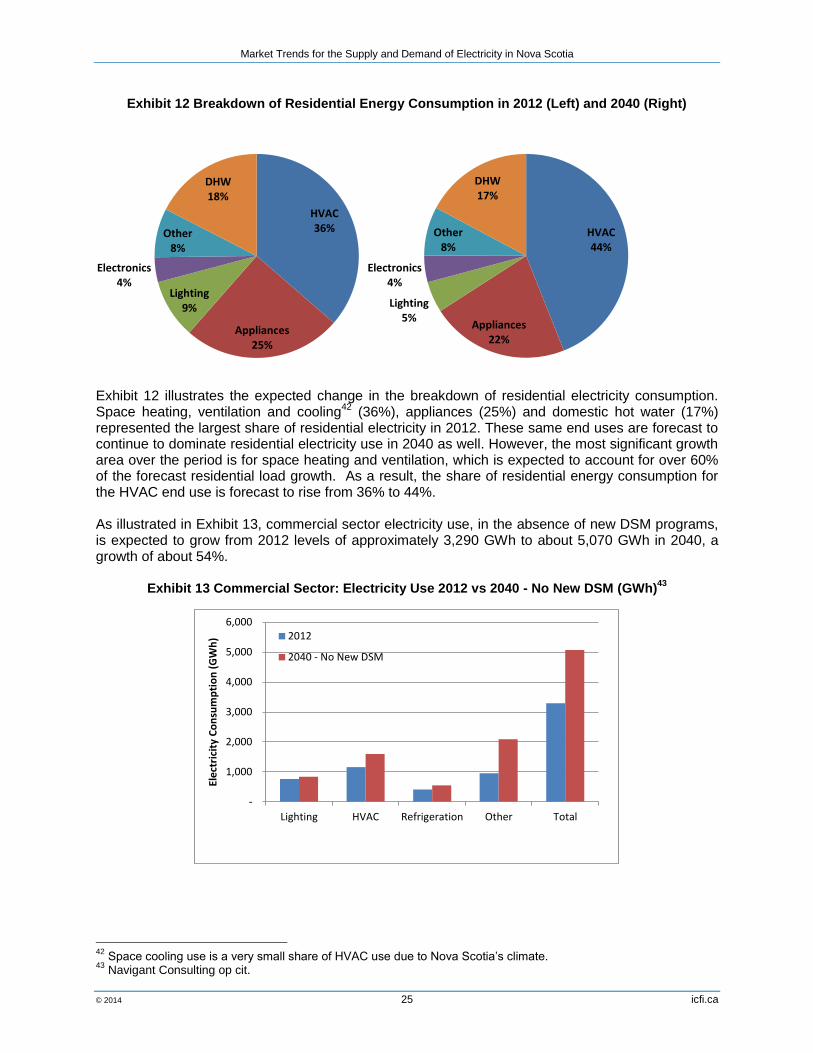
Exhibit 12 illustrates the expected change in the breakdown of residential electricity consumption. Space heating, ventilation and cooling
42 (36%), appliances (25%) and domestic hot water (17%)
represented the largest share of residential electricity in 2012. These same end uses are forecast to continue to dominate residential electricity use in 2040 as well. However, the most significant growth area over the period is for space heating and ventilation, which is expected to account for over 60% of the forecast residential load growth. As a result, the share of residential energy consumption for the HVAC end use is forecast to rise from 36% to 44%. As illustrated in Exhibit 13, commercial sector electricity use, in the absence of new DSM programs, is expected to grow from 2012 levels of approximately 3,290 GWh to about 5,070 GWh in 2040, a growth of about 54%.
Exhibit 13 Commercial Sector: Electricity Use 2012 vs 2040 - No New DSM (GWh)43
42
Space cooling use is a very small share of HVAC use due to Nova Scotia’s climate. 43
Navigant Consulting op cit.
HVAC36%
Appliances25%
Lighting9%
Electronics4%
Other8%
DHW18%
HVAC44%
Appliances22%
Lighting5%
Electronics4%
Other8%
DHW17%
-
1,000
2,000
3,000
4,000
5,000
6,000
Lighting HVAC Refrigeration Other Total
Ele
ctri
city
Co
nsu
mp
tio
n (
GW
h) 2012
2040 - No New DSM

Market Trends for the Supply and Demand of Electricity in Nova Scotia
© 2014 26 icfi.ca
Exhibit 14 Breakdown of Commercial Energy Consumption in 2012 (Left) and 2040 (Right)
Exhibit 14 illustrates the expected change in the breakdown of commercial electricity consumption. Space heating, ventilation and cooling (HVAC) (35%), other (29%)
44, lighting (23%) and refrigeration
(17%) represent the largest share of commercial electricity use in 2012. Lighting’s share of sector electricity use is expected to decline in 2040, while the category “other” is expected to experience significant growth by 2040. Further detail on the specific composition of this end use was not available.
Potential Contribution of EE to Nova Scotia’s Future Electricity Needs ENSC’s market potential study follows a similar approach to that undertaken in other North American jurisdictions by presenting a number of differing scenarios of EE’s potential contribution to the future electricity needs outline above. The study presents the following scenarios:
45
Technical Potential – The theoretical maximum amount of energy use that could be displaced
by the technology being evaluated, disregarding all non-engineering constraints.
Economic Potential – The subset of technical potential that is economically cost-effective. Estimates of economic potential do not address market barriers to implementation.
Achievable Potential – The potential that can realistically be achieved through implementation
of cost-effective demand-side management programs, taking into account real-world barriers and assuming the most aggressive program and policy scenario possible.
For the purpose of this discussion, we focus on the Achievable Potential scenarios contained in the study, as these scenarios most closely approximate the potential contribution of EE under differing, but plausible, future conditions. The study presents four different Achievable Potential scenarios, as follows:
44
“Other” is an aggregated category of electricity use; however further definition of the specific composition of this end use was not available at the time of this writing. Hence, further comment in this chapter was not possible. 45
Definitions are from Energy Efficiency Market Potential Study; 2015-2040; January 2014, prepared for ENSC by Navigant Consulting.
Lighting23%
HVAC35%
Refrigeration13%
Other29%
Lighting17%
HVAC31%
Refrigeration11%
Other41%

Market Trends for the Supply and Demand of Electricity in Nova Scotia
© 2014 27 icfi.ca
Base Achievable Potential – the portion of economically attractive EE potential that can be achieved if measure incentive levels are maintained at approximately the same level currently being employed in Efficiency Nova Scotia programs
Low Achievable Potential – with incentive levels at half the current levels
Mid Achievable Potential – with incentive levels halfway between Base and High
High Achievable Potential – with incentive levels at twice the current levels For discussion purposes, we address the Base Achievable Potential and the High Achievable Potential, which represent the most likely band of outcomes. Exhibit 15 shows these two scenarios
46
in comparison to the 2013 NSPI Load Forecast without new EE programs. Because the NSPI forecast ends in 2023 and the Navigant study projects savings to 2040, we obtained the estimated 2040 forecast consumption without new EE programs from the Navigant model. The resulting projections from 2023 to 2040 are shown as dashed lines in the exhibit.
Exhibit 15 Base and High Achievable Potential for EE Programs, Compared to NSPI Load Forecast, no new EE Programs
Exhibit 16 provides additional details on the information shown in Exhibit 15. In addition to the two scenarios from the Navigant study, the study also includes the estimated cumulative impact of DSM incorporated in the 2013 NSPI Load Forecast in 2023, the ending year of that forecast. The exhibit shows that the Base Achievable Potential in year 2023 is estimated at approximately 15% of the consumption that would occur without new EE initiatives. As a percentage of consumption, the savings would be approximately 14% in the residential sector, 22% in the commercial sector, and 8% in the industrial sector. These values agree closely with the DSM estimates used in the 2013 NSPI Load Forecast.
46
The estimates of achievable potential shown in this exhibit include the estimated savings from codes and standards. The NSPI estimates of DSM potential include savings from codes and standards. In order to compare them, we have adjusted the estimates for the Base and High Achievable Potential from the Navigant DSM Study to include the estimated savings from codes and standards. The Navigant study also starts with the year 2015. The Base and High Achievable estimates have therefore been further adjusted to include estimates of savings from programs in the years 2013 and 2014.
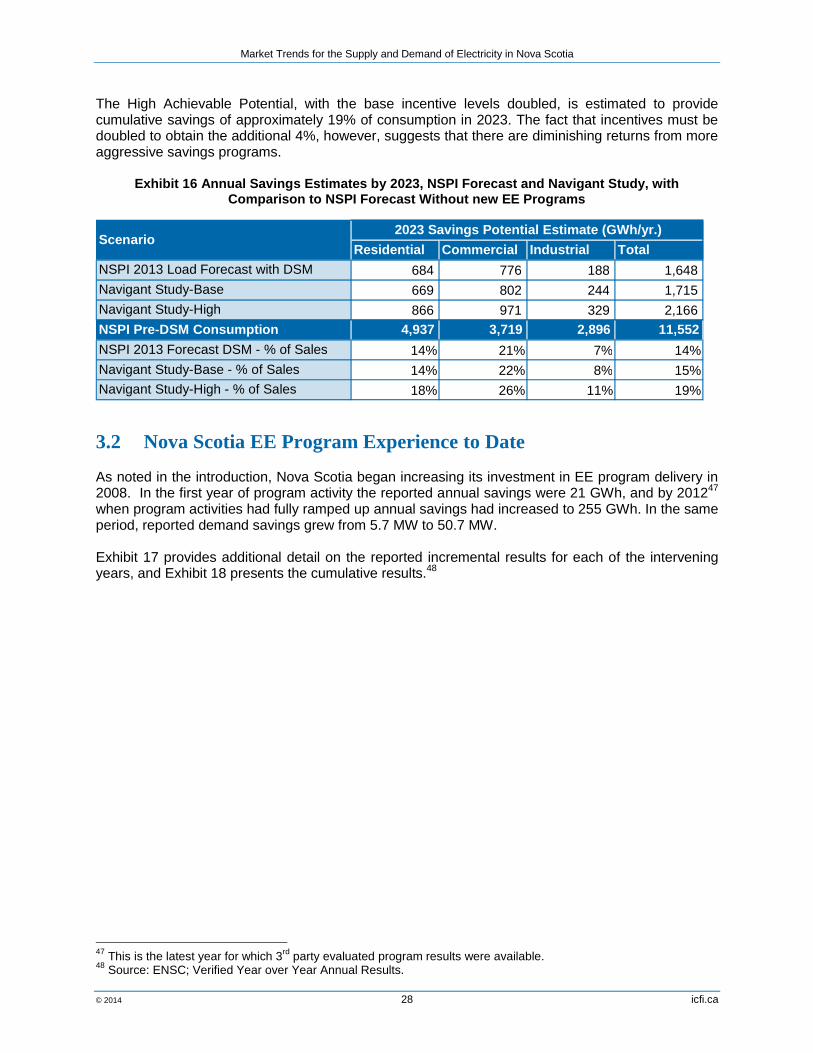
Market Trends for the Supply and Demand of Electricity in Nova Scotia
© 2014 28 icfi.ca
The High Achievable Potential, with the base incentive levels doubled, is estimated to provide cumulative savings of approximately 19% of consumption in 2023. The fact that incentives must be doubled to obtain the additional 4%, however, suggests that there are diminishing returns from more aggressive savings programs.
Exhibit 16 Annual Savings Estimates by 2023, NSPI Forecast and Navigant Study, with Comparison to NSPI Forecast Without new EE Programs
3.2 Nova Scotia EE Program Experience to Date As noted in the introduction, Nova Scotia began increasing its investment in EE program delivery in 2008. In the first year of program activity the reported annual savings were 21 GWh, and by 2012
47
when program activities had fully ramped up annual savings had increased to 255 GWh. In the same period, reported demand savings grew from 5.7 MW to 50.7 MW. Exhibit 17 provides additional detail on the reported incremental results for each of the intervening years, and Exhibit 18 presents the cumulative results.
48
47
This is the latest year for which 3rd
party evaluated program results were available. 48
Source: ENSC; Verified Year over Year Annual Results.
Residential Commercial Industrial Total
NSPI 2013 Load Forecast with DSM 684 776 188 1,648 Navigant Study-Base 669 802 244 1,715 Navigant Study-High 866 971 329 2,166 NSPI Pre-DSM Consumption 4,937 3,719 2,896 11,552
NSPI 2013 Forecast DSM - % of Sales 14% 21% 7% 14%
Navigant Study-Base - % of Sales 14% 22% 8% 15%
Navigant Study-High - % of Sales 18% 26% 11% 19%
Scenario 2023 Savings Potential Estimate (GWh/yr.)

Market Trends for the Supply and Demand of Electricity in Nova Scotia
© 2014 29 icfi.ca
Exhibit 17 Incremental Annual Energy and Demand Savings 2008-2012
Exhibit 18 Cumulative Energy and Demand Savings 2008-2012
0
100
200
300
400
500
600
700
2008 2009 2010 2011 2012
Incr
em
en
tal E
ne
rgy
Savi
ngs
(G
Wh
)
Codes & Standards
Extra-Large Industrial
Programs
0
20
40
60
80
100
120
140
2008 2009 2010 2011 2012
Incr
em
en
tal D
em
and
Sa
vin
gs (
MW
)
0
100
200
300
400
500
600
700
2008 2009 2010 2011 2012
Cu
mu
lati
ve E
ne
rgy
Savi
ngs
(G
Wh
)
Codes & Standards
Extra-Large Industrial
Programs
0
20
40
60
80
100
120
140
2008 2009 2010 2011 2012
Cu
mu
lati
ve D
em
and
Sa
vin
gs (
MW
)
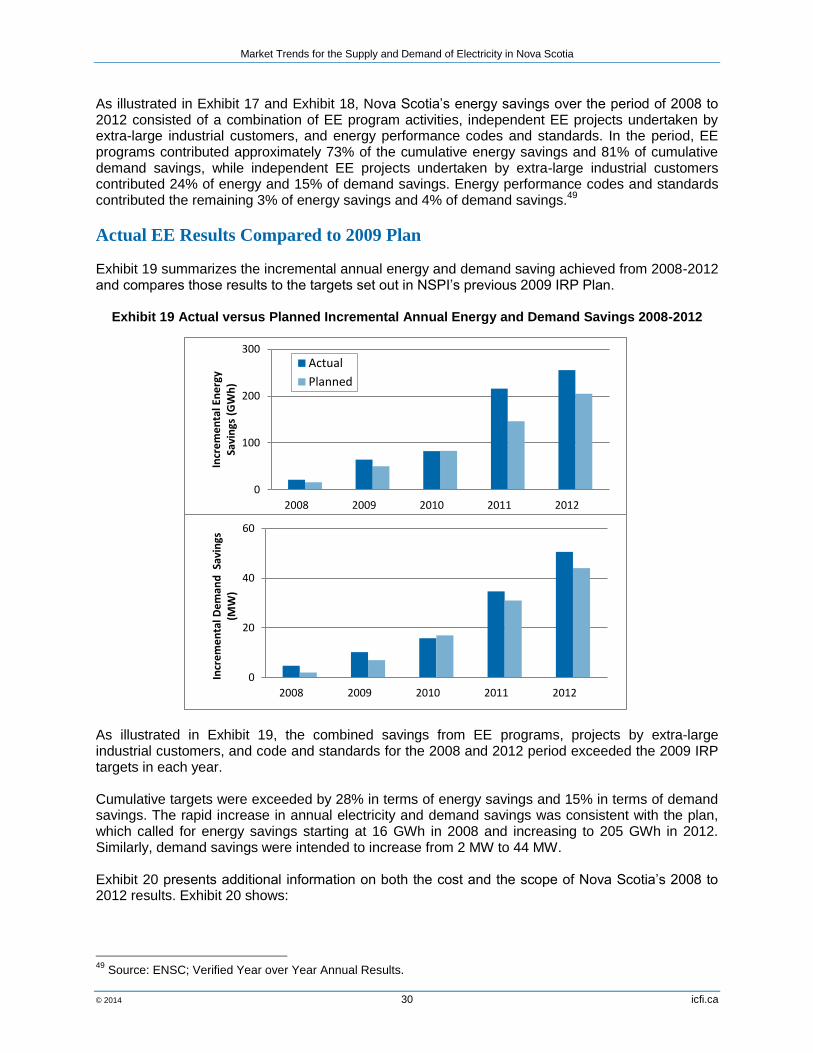
Market Trends for the Supply and Demand of Electricity in Nova Scotia
© 2014 30 icfi.ca
As illustrated in Exhibit 17 and Exhibit 18, Nova Scotia’s energy savings over the period of 2008 to 2012 consisted of a combination of EE program activities, independent EE projects undertaken by extra-large industrial customers, and energy performance codes and standards. In the period, EE programs contributed approximately 73% of the cumulative energy savings and 81% of cumulative demand savings, while independent EE projects undertaken by extra-large industrial customers contributed 24% of energy and 15% of demand savings. Energy performance codes and standards contributed the remaining 3% of energy savings and 4% of demand savings.
49
Actual EE Results Compared to 2009 Plan Exhibit 19 summarizes the incremental annual energy and demand saving achieved from 2008-2012 and compares those results to the targets set out in NSPI’s previous 2009 IRP Plan.
Exhibit 19 Actual versus Planned Incremental Annual Energy and Demand Savings 2008-2012
As illustrated in Exhibit 19, the combined savings from EE programs, projects by extra-large industrial customers, and code and standards for the 2008 and 2012 period exceeded the 2009 IRP targets in each year. Cumulative targets were exceeded by 28% in terms of energy savings and 15% in terms of demand savings. The rapid increase in annual electricity and demand savings was consistent with the plan, which called for energy savings starting at 16 GWh in 2008 and increasing to 205 GWh in 2012. Similarly, demand savings were intended to increase from 2 MW to 44 MW.
Exhibit 20 presents additional information on both the cost and the scope of Nova Scotia’s 2008 to 2012 results. Exhibit 20 shows:
49
Source: ENSC; Verified Year over Year Annual Results.
0
100
200
300
2008 2009 2010 2011 2012
Incr
em
en
tal E
ne
rgy
Savi
ngs
(G
Wh
)
Actual
Planned
0
20
40
60
2008 2009 2010 2011 2012
Incr
em
en
tal D
em
and
Sav
ings
(M
W)

Market Trends for the Supply and Demand of Electricity in Nova Scotia
© 2014 31 icfi.ca
Nova Scotia electricity savings as a percentage of customer sales. This metric, which is shown on the horizontal axis, provides an indication of the scope of program savings relative to the size of the utility’s annual sales; it facilitates comparisons between different years and different jurisdictions.
50
Cost of saved energy (CSE), or unit cost, is expressed as $/kWh. This metric, which is shown on
the vertical axis, indicates the cost of acquiring the identified electricity savings; it includes both measure and program costs and is averaged over the life of the measure. The CSE is widely used throughout the North American utility industry as a means of comparing the cost of saving a kWh of electricity to the cost of generating the same kWh using conventional or alternate supply options.
Exhibit 20 Electricity Savings as a Percentage of Electricity Sales for Nova Scotia’s Past Programs
and Related Cost51
As illustrated in Exhibit 20, Nova Scotia’s reported electrical energy savings were 0.2% of electricity sales in 2008 and grew to 1.6% in 2012. The year-over-year savings increases were achieved with increasing program budgets.
52 During this period, program savings were achieved at a cost of
between $0.015/kWh in 2008 and $0.036/kWh in 2012. It is common that the cost of saving energy increases as programs move from capturing the cheaper “low-hanging fruit” to more costly opportunities, and as they shift from resource acquisition to broader capability development programming that has less immediate return.
Summary In summary, the review of Nova Scotia’s EE program experience shows that over the period from 2008 to 2012: The target energy and demand savings set out in the 2009 IRP were met and exceeded
DSM program savings increased from 0.2% of electricity sales in 2008 to 1.6% in 2012, and
The costs of these savings were achieved at a rate between $0.01/kWh and $0.036/kWh, which
is well below the avoided cost of $0.135/kWh that is set as the economic threshold in ENSC’s recent EE market potential study.
50
All historic and forecast customer sales were sourced from NSPI’s 2013 Load Forecast: NSPI 2013 Load Forecast 51
Costs are expressed in 2011 U.S. Dollars in order to facilitate comparison among program years and other North American jurisdictions. 52
Audited program costs were provided by ENSC.
2008 2009
2010 2011 2012
$-
$0.010
$0.020
$0.030
$0.040
0.0% 0.5% 1.0% 1.5% 2.0% 2.5% 3.0%
Co
st o
f Sa
ved
En
erg
y
($2
01
1 U
SD/k
Wh
)
Electricity Savings (GWh) as % of Electricity Sales (GWh)

Market Trends for the Supply and Demand of Electricity in Nova Scotia
© 2014 32 icfi.ca
3.3 Future Nova Scotia EE Program Plan Considerations At the time of writing of this report, detailed DSM plans were defined only until 2014. As outlined in the Government of Nova Scotia’s Electricity Efficiency Plan – Using Less Energy, the future of DSM will be steered by the IRP process that is taking place in tandem with this study.
53 In the future, the
Nova Scotia Utility and Review Board (UARB) will determine what cost-effective DSM activities must be undertaken using guidance from IRP processes. During the 2015 transition year, the budget will be capped at $35 million. In response to the available information, we have created Exhibit 21 and Exhibit 22. Exhibit 21 plots the electrical energy and demand saving targets as set out in ENSC’s current 2013-2014 plan. To extend the profile of EE program options to 2023, which is the end date in the current NSPI load forecast, Exhibit 21 also shows the level of electrical energy and demand savings set out in the Base and High Achievable Potential Scenarios, as presented earlier in this chapter. Because future levels of EE investment are somewhat uncertain and depend on the outcomes of the current IRP process, we have chosen these two scenarios in order to bookend our discussion. Exhibit 21 also shows the forecast impact of EE performance codes and standards over the period.
54
Exhibit 21 Incremental Annual Energy and Demand Savings 2013-2014 Plan and 2015-2023
Achievable Potential Scenarios
Exhibit 22 plots the same program scenarios and, for each scenario, shows the forecast level of savings as a percentage of total customer sales, together with the forecast expenditures required to achieve the savings in each scenario.
53
http://www.novascotia.ca/energy/publications/Using-Less-Energy.pdf 54
Navigant Consulting, op cit.
0
50
100
150
200
250
300
Incr
em
en
tal E
ne
rgy
Savi
ngs
(G
Wh
)
Achievable Potential - High
Achievable Potential - Base
2013-2014 Plan
Codes & Standards
0
20
40
60
Incr
em
en
tal D
em
and
Sa
vin
gs (
MW
)
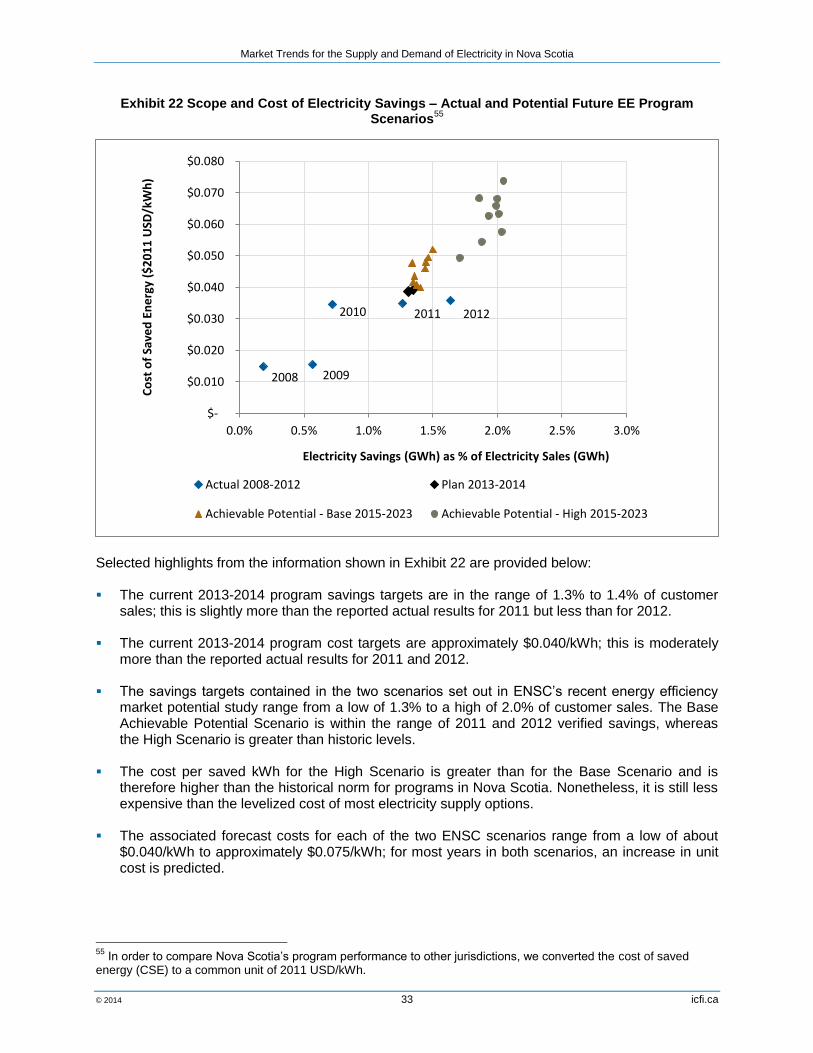
Market Trends for the Supply and Demand of Electricity in Nova Scotia
© 2014 33 icfi.ca
Exhibit 22 Scope and Cost of Electricity Savings – Actual and Potential Future EE Program Scenarios
55
Selected highlights from the information shown in Exhibit 22 are provided below: The current 2013-2014 program savings targets are in the range of 1.3% to 1.4% of customer
sales; this is slightly more than the reported actual results for 2011 but less than for 2012.
The current 2013-2014 program cost targets are approximately $0.040/kWh; this is moderately more than the reported actual results for 2011 and 2012.
The savings targets contained in the two scenarios set out in ENSC’s recent energy efficiency
market potential study range from a low of 1.3% to a high of 2.0% of customer sales. The Base Achievable Potential Scenario is within the range of 2011 and 2012 verified savings, whereas the High Scenario is greater than historic levels.
The cost per saved kWh for the High Scenario is greater than for the Base Scenario and is
therefore higher than the historical norm for programs in Nova Scotia. Nonetheless, it is still less expensive than the levelized cost of most electricity supply options.
The associated forecast costs for each of the two ENSC scenarios range from a low of about
$0.040/kWh to approximately $0.075/kWh; for most years in both scenarios, an increase in unit cost is predicted.
55
In order to compare Nova Scotia’s program performance to other jurisdictions, we converted the cost of saved energy (CSE) to a common unit of 2011 USD/kWh.
2008 2009
2010 2011 2012
$-
$0.010
$0.020
$0.030
$0.040
$0.050
$0.060
$0.070
$0.080
0.0% 0.5% 1.0% 1.5% 2.0% 2.5% 3.0%
Co
st o
f Sa
ved
En
erg
y ($
20
11
USD
/kW
h)
Electricity Savings (GWh) as % of Electricity Sales (GWh)
Actual 2008-2012 Plan 2013-2014
Achievable Potential - Base 2015-2023 Achievable Potential - High 2015-2023

Market Trends for the Supply and Demand of Electricity in Nova Scotia
© 2014 34 icfi.ca
Comparisons with Other Jurisdictions Below, we provide a high level comparison of Nova Scotia’s past and planned DSM program activity with that of other North American jurisdictions. These types of comparisons are always subject to numerous caveats as each jurisdiction brings a variety of unique characteristics. Nonetheless, comparisons do provide a useful benchmark when examining broad market trends, which is the intent of this paper. For the purposes of comparison, we used a recent study conducted by the American Council for an Energy-Efficient Economy (ACEEE) that assessed the cost effectiveness of utility-sector energy efficiency programs in 20 jurisdictions from 2009-2012. Where the data were available, ACEEE created Exhibit 23 which also plots the cost of saved energy versus savings as a percentage of electricity sales. For comparison purposes, this graph is presented at a similar scale to Exhibit 22, which summarizes Nova Scotia’s past, planned and achievable program performance. It should be noted that the y-axis in Exhibit 22 was extended by $0.02/kWh in order to accommodate ENSC’s High Achievable Potential scenario.
Exhibit 23 Comparative Scope and Cost of Saved Energy – 20 Jurisdictions’ Programs in 2009-201256
The comparison of Exhibit 22 (Nova Scotia scenarios) with Exhibit 23 (Experience in Other Jurisdictions) provides useful perspective related to both the scope of Nova Scotia’s actual and planned electricity savings relative to annual customer sales, and Nova Scotia’s actual and forecast EE Program costs to acquire those savings. Selected highlights are provided below: Scope of Nova Scotia’s Current and Planned EE Savings. Nova Scotia’s current 2013-2014
program savings targets are in the range of 1.3% to 1.4% of customer sales, and the savings targets contained in each of the two previously discussed Achievable Potential scenarios range from a low of 1.3% to a high of 2% of customer sales. When compared to the results for other jurisdictions, Nova Scotia’s current and planned level of EE savings compare well with the range shown in Exhibit 23.
56
ACEEE, “The Best Value for America’s Energy Dollar: A National Review of the Cost of Utility Energy Efficiency Programs”, March 2014.
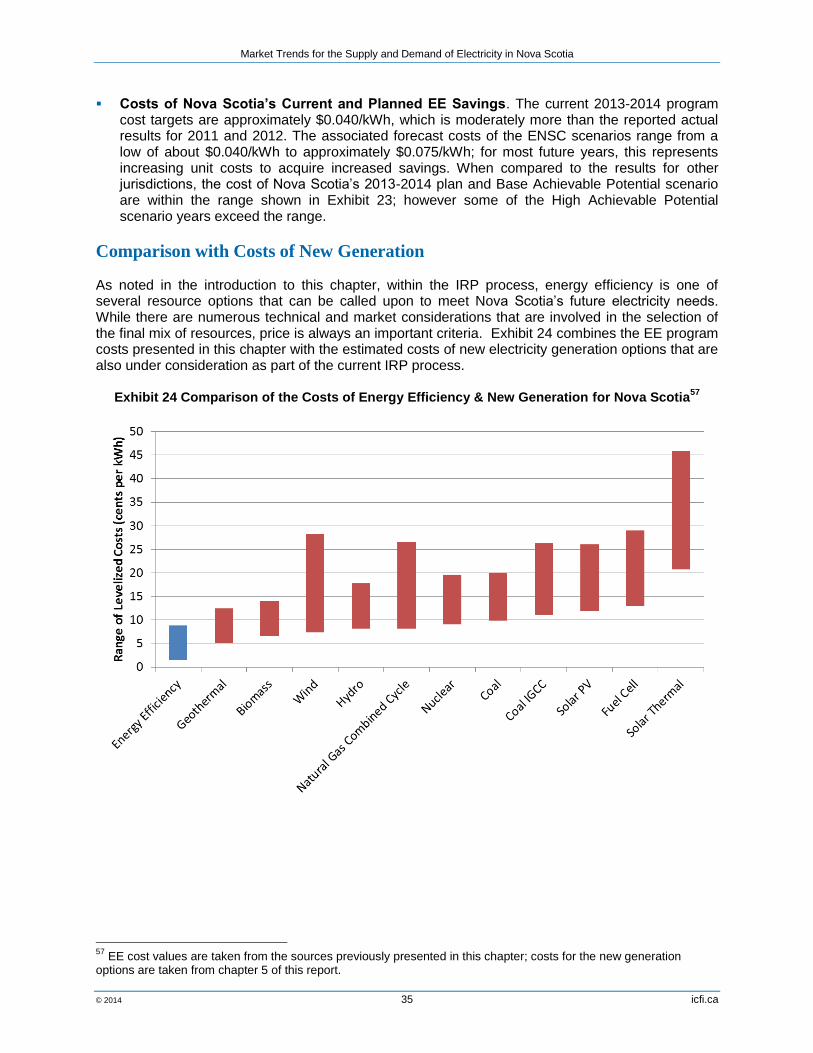
Market Trends for the Supply and Demand of Electricity in Nova Scotia
© 2014 35 icfi.ca
Costs of Nova Scotia’s Current and Planned EE Savings. The current 2013-2014 program cost targets are approximately $0.040/kWh, which is moderately more than the reported actual results for 2011 and 2012. The associated forecast costs of the ENSC scenarios range from a low of about $0.040/kWh to approximately $0.075/kWh; for most future years, this represents increasing unit costs to acquire increased savings. When compared to the results for other jurisdictions, the cost of Nova Scotia’s 2013-2014 plan and Base Achievable Potential scenario are within the range shown in Exhibit 23; however some of the High Achievable Potential scenario years exceed the range.
Comparison with Costs of New Generation As noted in the introduction to this chapter, within the IRP process, energy efficiency is one of several resource options that can be called upon to meet Nova Scotia’s future electricity needs. While there are numerous technical and market considerations that are involved in the selection of the final mix of resources, price is always an important criteria. Exhibit 24 combines the EE program costs presented in this chapter with the estimated costs of new electricity generation options that are also under consideration as part of the current IRP process.
Exhibit 24 Comparison of the Costs of Energy Efficiency & New Generation for Nova Scotia57
57
EE cost values are taken from the sources previously presented in this chapter; costs for the new generation options are taken from chapter 5 of this report.

Market Trends for the Supply and Demand of Electricity in Nova Scotia
© 2014 36 icfi.ca
3.4 Summary Based on the review presented in this chapter, Energy efficiency programs have been contributing verified, cost effective savings for Nova
Scotia to date.
The EE market potential study prepared by Navigant Consulting indicates that significant potential for additional cost effective energy savings remain within the Nova Scotia market and energy efficiency is, therefore, capable of making a significant contribution to meeting the province’s future electricity needs.
The comparison of historical and planned EE program energy savings with those of other
jurisdictions illustrates that the scope of provincial EE savings places Nova Scotia among the leading North American jurisdictions. Similarly, Nova Scotia’s historical and planned expenditures to acquire those EE savings are also consistent with those in other jurisdictions.
In the near term, EE is likely to be a cost-effective means of reducing the growth in demand for
electricity in the province.

Market Trends for the Supply and Demand of Electricity in Nova Scotia
© 2014 37 icfi.ca
4 Fossil Fuel Market Trends (2014-2040) This section reviews current trends in fossil fuel prices, focusing on solid fuels and natural gas. We first summarize NSPI’s fuel use and the factors that drive fuel choice by the utility. We next review current prices and price trends for fossil fuels and forecasts of prices from publicly available sources. Next we discuss in more detail each of the fuels used in Nova Scotia, the structure of prices, price formation, and trends affecting the prices that will be paid in Nova Scotia, including transportation costs.
4.1 Fuel Use at Nova Scotia Power NSPI’s non-renewable generation fleet consists of plants that rely on solid fuel, natural gas, and fuel oil. Exhibit 25 shows the disposition of thermal generation by NSPI.
Exhibit 25 NSPI Thermal Generation and Fuel
Source: NSPI Presentation, IRP Technical Conference Assumptions Discussion
Fuel cost, type, quality, and availability are key factors in the cost of generating electricity to meet any given level of demand. NSPI’s thermal generating fleet consists of plants running on solid fuel (coal and petroleum coke), natural gas, heavy fuel oil, and light fuel oil.
58 Historically, solid fuels have been the dominant source
of power system fuel but as the generating fleet transforms to more renewable generating sources, the Province’s reliance on fossil fuels will be greatly reduced.
58
Heavy fuel oil is also known as residual or No. 6 fuel oil; light fuel oil is akin to diesel or No. 2 fuel oil. Petroleum coke, referred to as petcoke, is a solid byproduct of petroleum refining that is widely used for power generation.

Market Trends for the Supply and Demand of Electricity in Nova Scotia
© 2014 38 icfi.ca
Base load, firm power primarily is provided by the solid fuel generating plants, and therefore solid fuels currently constitute the over 57% of generation on an annual basis (Exhibit 26). Natural gas provides intermediate and load following capability, but also can be run as base load, depending on prices. The amount of natural gas relative to HFO used can vary considerably month to month and over a year (Exhibit 26) depending on market driven pricing. A good example of this is the 2012 and 2013 timeframe; NSPI showed a large swing in gas and fuel oil use. This is because of the run-up in gas prices in 2013, making generation from gas more expensive than from fuel oil. In this context, fuel oil acts as a cap to gas prices.
Exhibit 26 NSPI Generation by Fuel Type (GWh)
Source: Emera 2013 Annual Report
NSPI purchases solid fuel under a variety of contracts, some of which are long term and some that are not. Sourcing of coal is driven by the pricing on the international coal markets. NSPI buys solid fuel under contracts with a mix of durations, some long term, some short term. Pricing structures can vary from fixed prices for a term, to fixed with escalators tied to economic indicators (i.e., change in GDP), or to regional indexes. The current principal sources of solid fuel include the following: U.S. sources of coal including low-sulphur and mid-sulphur, delivered by ocean vessels to the
Point Tupper Marine Terminal (PTMT) located in Point Tupper Nova Scotia and the International Pier (INP) located in Sydney Nova Scotia.
Low-Sulphur Colombia coal delivered by ocean vessels to both PTMT and INP. U.S. sources of petcoke delivered by ocean vessels to both PTMT and INP. Nova Scotia coal delivered by truck to the generating station. Natural gas is generally sourced from the Sable Offshore Energy Project (SOEP) delivered over the Maritimes and Northeast Pipeline (M&NP) mainline and the Halifax Lateral to the Tufts Cove power plant. NSPI purchases gas under a mix of contracts. Pricing of natural gas typically is tied to the price of gas in New England, with adjustments for transportation.

Market Trends for the Supply and Demand of Electricity in Nova Scotia
© 2014 39 icfi.ca
HFO is typically sourced from suppliers also under a mixture of contract tenors, most no longer than 2 years, where the oil is priced at the New York harbor index price. NSPI then pays for the transportation to Halifax. NSPI has 3.1 million barrels of HFO storage capacity at Tufts Cove. The company can also use tankers to store HFO and manage inventory at the Tufts Cove dock. LFO is used throughout the system at all of the power plants for ignition and other purposes, but is primarily used as the fuel at the three peaking facilities. LFO use is small in comparison with solid fuel and natural gas. Purchases are made under “delivery contracts,” where transportation is priced into the cost of fuel. Fossil fuel usage is largely determined by economic dispatch, total electricity demand, and the level of renewable energy on the system. NSPI dispatches power plants through the course of the day the lowest cost electric power plants first, then sequentially higher cost units.
59 The cost of fuel is
the major component of variable generation costs and drives the merit order of dispatchable power plants. During high demand portions of the day, or less renewable power is available to the system, the units with the higher operating costs are dispatched to the system. In recent years, low gas prices have led to heavier use of natural gas at Tufts Cove, and less use of solid fuels at the other plants. Similarly, low gas prices have resulted in very little HFO use at Tufts Cove. The most recent two winters (2012/13 and 2013/14) have seen a reversal of this pattern, with higher gas prices, lower use of Tufts Cove gas generation, and greater use of the solid fuel units and higher use of HFO and LFO. An important factor in fuel use in Nova Scotia is air emission regulation. NSPI blends solid fuel types to achieve emission characteristics that allow NSPI to meet its emissions limits and sometimes switches between solid fuel and natural gas or fuel oil where it can stay under emission caps and reduce fuel costs. The next sections present fuel price forecasts and market trends for each of the main fuels used in Nova Scotia. The price forecasts are from publicly available sources, principally the U.S. Energy Information Administration (EIA)
60, the International Energy Agency (IEA)
61, and the National Energy
Board (NEB)62
. The EIA and NEB forecasts have a North American focus, and therefore provide more detail in end-use and regional prices, whereas the IEA forecasts describe broad international energy market conditions. Differences in the various forecasts could be attributed to different factors such as scenario definitions, modeling structure, as well as various assumptions about market developments and economic growth. NSPI uses commercial price forecasts for the IRP and its fuel planning decisions. These commercial forecasts are proprietary and not available for this study.
59
Some plants are operated differently from this merit order of dispatch because of the need for voltage support for parts of the system or operating characteristics of the plants themselves, such as ramp-up times, or as spinning reserve. 60
The Reference Case pricing from the EIA’s Annual Energy Outlook (AEO) is used in this report. U.S. Energy Information Administration (EIA). “Annual Energy Outlook 2014 Early Release.” EIA, 16 December 2013. Available at: http://www.eia.gov/forecasts/aeo/er/index.cfm. U.S. Energy Information Administration (EIA). “Annual Energy Outlook (AEO) 2013.” EIA, April 2013: Washington, D.C. Available at: http://www.eia.gov/forecasts/aeo/pdf/0383(2013).pdf 61
The IEA’s World Energy Outlook provides three scenarios based on different policy outlooks: the Current Policies Scenario, the New Policies Scenario, and the 450 Scenario. For this report, ICF uses the fuel forecasts from IEA’s Current Policies Scenario, which only takes into account policies in-place and being implemented as of mid-2013. International Energy Agency (IEA). “World Energy Outlook 2013”. IEA, 2013: Paris, France. 62
The reference case from the NEB’s Canada’s Energy Future report is used in this report. National Energy Board (NEB). “Canada’s Energy Future 2013: Energy Supply and Demand Projections to 2035”. NEB, 21 November, 2013. Available at: http://www.neb-one.gc.ca/clf-nsi/rnrgynfmtn/nrgyrprt/nrgyftr/nrgyftr-eng.html

Market Trends for the Supply and Demand of Electricity in Nova Scotia
© 2014 40 icfi.ca
4.2 Fuel Forecasts and Market Trends
4.2.1 Solid Fuel Markets Currently, solid fuel comprises a large portion NSPI’s generation. These solid fuels are coal and pet coke. However, moving forward reliance on solid fuel diminishes as we transform to more renewable generating sources.
Coal Market structure: Coal is a global commodity with a growing international trade. Globally, 85 percent of steam coal (as opposed to metallurgical coal), is produced and consumed locally, with international trade comprising the rest.
63 Much of the international trade is in steam coal driven by
power sector demand.64
China is the largest consumer of steam coal, followed by the United States, India, the European Union, Russia, and Japan. The largest exporters are Australia, Indonesia, Russia, the United States, and Colombia. Organization for Economic Cooperation and Development (OECD) countries are continuing to see coal usage decline. In Canada, coal use has fallen throughout the 2000s, from 63.3 million tonnes in 2000 to just over 41.8 million tonnes in 2012.
65 Since the shutting down of
most of the local mines, Nova Scotia has shifted to imports (with small amounts of domestic coal use), primarily from the United States and South America. The EIA projects U.S. coal exports to grow from 114 million tonnes in 2012 to 145 million tonnes in 2035, as U.S. coal demand in the power sector declines and producers turn to export markets.
66 The
U.S. exported about 2.3 million tonnes of steam coal to Canada in 2013, up 26.1% relative to 2012.67
Most coal is sold under contract, with contracts typically lasting for more than one year. The spot market for coal is robust, but represents a much smaller segment of the overall coal market. Contract coal prices tend to be higher than spot prices when spot prices are decreasing, and contract prices tend to be lower than spot prices when spot prices are increasing. As a global commodity, coal prices are primarily driven by supply and demand and the quality of the coal. For example, supply disruptions in Australia can cause global steam coal prices to increase. In general, coal with a higher heat content and lower sulphur content tends to be sold at a higher price than coal with a lower heat content or higher sulphur content. A portion of the coal blended in Nova Scotia units is sourced in Nova Scotia. This domestic coal source is generally obtained through contracts. Nova Scotia Coal Demand: Nova Scotia coal demand was projected using a National Energy Board estimate of Nova Scotia’s coal generation through 2035.
68 Nova Scotia is expected to follow a
trend of decreasing dependence on coal, as with the rest of Canada. Nova Scotia coal consumption
63
International Energy Agency (IEA). “World Energy Outlook 2013”. IEA, 2013: Paris, France, p. 151. 64
Although there are also several applications for steam coal in the cement and steel industries, as well as in the heating of buildings. 65
http://www.eia.gov/cfapps/ipdbproject/iedindex3.cfm?tid=1&pid=1&aid=2&cid=regions&syid=2000&eyid=2012&unit=TST 66
EIA, Annual Energy Outlook, 2014 Early Release. 67
http://www.eia.gov/coal/production/quarterly/pdf/t9p01p1.pdf 68
National Energy Board, "Canada’s Energy Future 2013: Energy Supply and Demand Projections to 2035 (released in November 2013), Appendix 5: Electricity, A5.6”, 2013. Available at: http://www.neb-one.gc.ca/clf-nsi/rnrgynfmtn/nrgyrprt/nrgyftr/nrgyftr-eng.html#s9

Market Trends for the Supply and Demand of Electricity in Nova Scotia
© 2014 41 icfi.ca
is projected to fall significantly over the next two decades, with two key drops in solid fuel consumption occurring in 2018 and 2029 for renewable energy and emission requirements.
Exhibit 27 Nova Scotia Coal Consumption Projection
Coal Characteristics: NSPI blends various solid fuel types to ensure compliance with overall provincial caps. This flexible approach allows NSPI to select, in a cost effective manner, a wide range of solid fuels with varying levels of cost, energy content, and emissions characteristics. For example, NSPI currently imports medium sulphur and mercury coals from the US but also imports low sulphur coal from Colombia. These coals are blended with the lower cost, higher sulphur domestic coals as well as Petcoke. The blending allows NSPI flexibility in the how and when in the operation of units but also the flexibility of choice of fuels. Price Forecast Overview: Components of a delivered cost of coal include production, processing, and shipping costs. Typical Free on Board (FOB) costs for steam coal across different producing regions in 2012 ranged between US$40 and US$100 per tonne.
69 Coal prices are a function of coal
quality, coal extraction methods, and coal geology. Prices are determined by the demand for specific quality of coal (heat content, ash, sulphur and mercury content) and by the cost of production (which is dependent on geology and extraction methods). For example, the US Central Appalachia (CAPP) coals have lower Hg and sulphur content, and are therefore more expensive than NAPP coals. Powder River Basin (PRB) is cheaper than both because of lower heat content and lower mining costs. Similarly, Colombian coals are priced closer to CAPP coals, because their lower sulfur and lower ash content. These relationships are expected to remain in the future price projection as well. Shipping costs vary by a number of factors. These can include the availability of ships of the appropriate types (capacity and draft), the cost of fuel, the supply and demand for specific coals, which contributes to ship availability, charter rates, and port congestion. Exhibit 28 shows coal price forecasts from the IEA and EIA. The IEA provides a forecast for OECD steam coal import price, which can be considered as global benchmark for spot market purchases of coal.
70 These OECD steam import prices represent the highest price forecast primarily because they
include significant transportation costs. Generally, the coal price forecasts show a) an upward trend in real prices for all forecasts, and b) a relatively wide range in prices between forecasts. The prices
69
IEA, World Energy Outlook 2013, p. 153. 70
Steam coal represents coal used in power plants and for space heating, which may include anthracite, bituminous and sub-bituminous coal not used for coking purposes. International Energy Agency (IEA). “Coal Information: 2012 Edition”. IEA, 2012: Paris, France. Available at: http://wds.iea.org/wds/pdf/Documentation%20for%20coal%20information%202012.pdf
0.0
0.5
1.0
1.5
2.0
2.5
3.0
3.5
2013 2018 2023 2028 2033
Ye
arly
Co
al C
on
sum
pti
on
(m
illio
n t
on
ne
s)
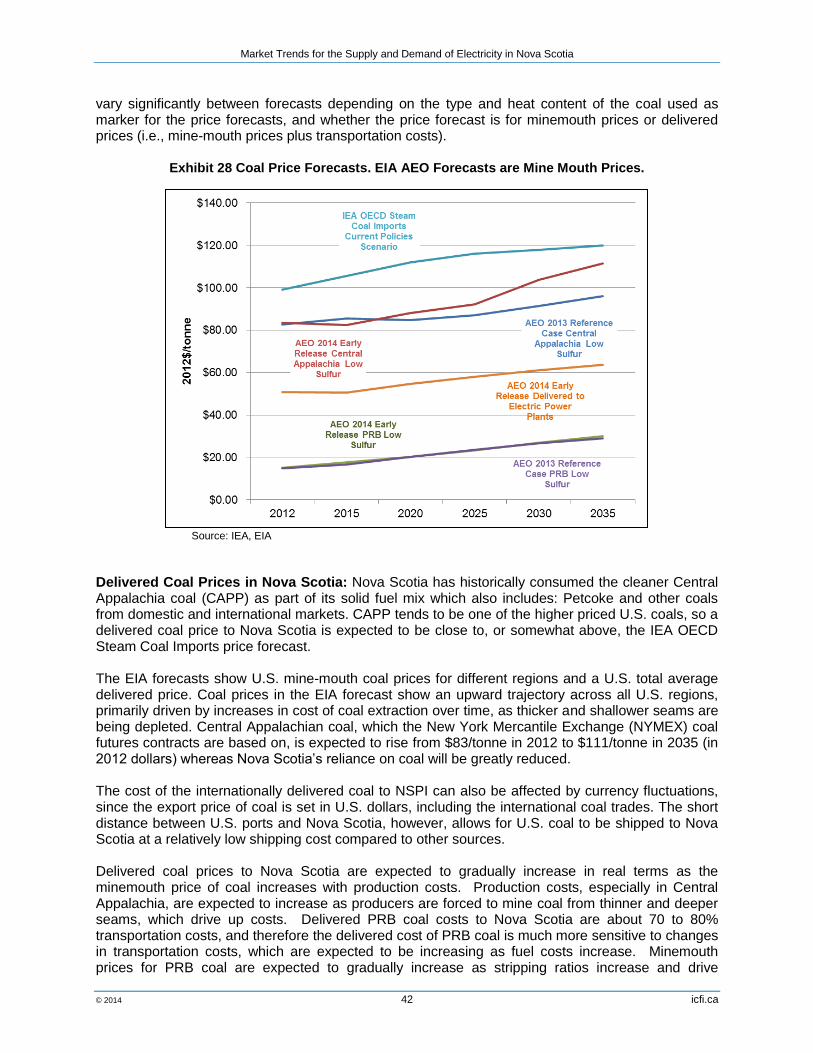
Market Trends for the Supply and Demand of Electricity in Nova Scotia
© 2014 42 icfi.ca
vary significantly between forecasts depending on the type and heat content of the coal used as marker for the price forecasts, and whether the price forecast is for minemouth prices or delivered prices (i.e., mine-mouth prices plus transportation costs).
Exhibit 28 Coal Price Forecasts. EIA AEO Forecasts are Mine Mouth Prices.
Source: IEA, EIA
Delivered Coal Prices in Nova Scotia: Nova Scotia has historically consumed the cleaner Central Appalachia coal (CAPP) as part of its solid fuel mix which also includes: Petcoke and other coals from domestic and international markets. CAPP tends to be one of the higher priced U.S. coals, so a delivered coal price to Nova Scotia is expected to be close to, or somewhat above, the IEA OECD Steam Coal Imports price forecast. The EIA forecasts show U.S. mine-mouth coal prices for different regions and a U.S. total average delivered price. Coal prices in the EIA forecast show an upward trajectory across all U.S. regions, primarily driven by increases in cost of coal extraction over time, as thicker and shallower seams are being depleted. Central Appalachian coal, which the New York Mercantile Exchange (NYMEX) coal futures contracts are based on, is expected to rise from $83/tonne in 2012 to $111/tonne in 2035 (in 2012 dollars) whereas Nova Scotia’s reliance on coal will be greatly reduced. The cost of the internationally delivered coal to NSPI can also be affected by currency fluctuations, since the export price of coal is set in U.S. dollars, including the international coal trades. The short distance between U.S. ports and Nova Scotia, however, allows for U.S. coal to be shipped to Nova Scotia at a relatively low shipping cost compared to other sources. Delivered coal prices to Nova Scotia are expected to gradually increase in real terms as the minemouth price of coal increases with production costs. Production costs, especially in Central Appalachia, are expected to increase as producers are forced to mine coal from thinner and deeper seams, which drive up costs. Delivered PRB coal costs to Nova Scotia are about 70 to 80% transportation costs, and therefore the delivered cost of PRB coal is much more sensitive to changes in transportation costs, which are expected to be increasing as fuel costs increase. Minemouth prices for PRB coal are expected to gradually increase as stripping ratios increase and drive

Market Trends for the Supply and Demand of Electricity in Nova Scotia
© 2014 43 icfi.ca
production costs higher. Stripping ratios will increase as coal producers mine coal seams that have more overburden and/or that are thinner. Over the next 20 years, PRB minemouth prices are expected to increase from about $13.5/tonne to $16.5/tonne (2012$). Colombian coal prices are also expected to increase gradually in real terms as production costs drive prices higher. Increasing labor costs will likely be the primary driver of higher Colombian coal prices. Transportation costs are expected to gradually increase in real terms as the price of fuel increases. However, this will be a small increase compared to the increase in mine-mouth prices.
Petcoke Petcoke is a by-product of the coking process in a refinery to upgrade heavy residues into gasoline and diesel. Many refineries in the Gulf Coast have invested in coking units to process heavy crude, making the U.S. Gulf Coast the primary source of petcoke supply in the U.S. The growing supply of Western Canadian Sedimentary Basin (WCSB) oil sands would potentially increase North American supply of petcoke. Petcoke competes with coal, fuel oil and natural gas in power generation.
71 It has
higher heat content and higher sulphur levels but lower mercury levels, and therefore it is usually blended with coal.There is also a large supply of petcoke in the Great Lakes around Chicago. NSPI sources its supply there. U.S. petcoke export market: Most of the petcoke produced in the U.S. is exported. The U.S. accounts for over half of globally traded petcoke volumes.
72 The top three export destinations for
U.S. petcoke are China, Japan and India.73
Exports to Canada, however, are increasing, having more than doubled since 2000 to reach current levels of 31,000 barrel-per-day (bpd) or about 5,600 tonnes.
Petcoke in Nova Scotia: Most power plants in the Nova Scotia, except for Tufts Cove, run on coal and petcoke blends and the province is currently importing petcoke from the Chicago area and the U.S. Gulf Coast. Petcoke has historically traded at a discount to coal on a per MMBtu basis.
74
Outlook for Petcoke: Demand for petcoke in the province will likely decline with the slowdown in coal use and growth in gas supply from the U.S. However, petcoke may still play an important role in the mix of fuels that NSPI will use to comply with emissions regulations. Petcoke price forecasts are rarely available, and as such it is likely that petcoke prices will be traded at a discount to coal in the future.
4.2.2 Natural Gas Market structure: The North American gas market is highly developed, with an extensive pipeline network, and transparent price setting mechanisms. In recent years, the shale gas production, in places such as the Marcellus, has transformed the North American gas landscape, leading to new patterns of supply, demand and pipeline flows. For New England and Maritime Canada specifically, developments in the Marcellus shale play a key role. Evolving power sector demand and outcome of announced pipeline projects into New England and Maritimes will be the key factors affecting the region’s gas market.
71
Petcoke is also used in the steel and cement industries. 72
http://www.eia.gov/todayinenergy/detail.cfm?id=6430 73
http://www.eia.gov/dnav/pet/pet_move_expc_a_EPPC_EEX_mbblpd_a.htm 74
Andrews, Anthony and Lattanzio, Richard. “Petroleum Coke: Industry and Environmental Issues”. Congressional Research Service: October 29, 2013. Available at: file:///C:/Users/30012/Documents/Projects/2014/A80001.0.070.02%20Nova%20Scotia/Deliverables/Petroleum%20Co
ke%20Industry%20and%20Environmental%20.pdfhttps://www.hsdl.org/?view&did=746955 file:///C:/Users/30012/Documents/Projects/2014/A80001.0.070.02%20Nova%20Scotia/Deliverables/Petroleum%20Coke%20Industry%20and%20Environmental%20.pdf

Market Trends for the Supply and Demand of Electricity in Nova Scotia
© 2014 44 icfi.ca
Exhibit 29 shows ICF’s outlook of North American natural gas production from our March 2013 report for the Nova Scotia Department of Energy. Shale gas contribution to total North American production is expected to increase from about 40% currently to over 60% by 2035.
75 The EIA
expects U.S. dry gas production to increase from 24.06 Tcf in 2012 to 36.1 Tcf in 2035, driven by shale gas and associated gas in oil and NGL extraction.
76
Exhibit 29 North American Natural Gas Production
Source: The Future of Natural Gas Supply for Nova Scotia, March 2013
Gas Demand and Supply in Nova Scotia: The demand profile of Maritimes Canada consists of mostly power generation, with three major power plants being Tufts Cove, Bayside, and Irving’s St. John refinery’s onsite power plant.
77 The NEB projects natural gas will account for 46% of power
generated in Nova Scotia by 2035, up from 23% in 2012.78
In the future, gas use in Nova Scotia will be largely determined by the province’s gas use in power generation,which will determined by the current price relative to coal and HFO. In terms of supply, declining Sable Island production and eventual decrease from Deep Panuke implies that the province will increasingly rely on external sources for gas. These might include liquified natural gas (LNG) imports into Canaport and pipeline imports from the U.S. At the same time, two parties are considering LNG exports from Nova Scotia. While there remain some uncertainties on LNG exports out of Nova Scotia, if LNG exports become a significant demand source in the province, this will create more certainty for pipeline developers evaluating expansions into the Northeast. Nova Scotia Power can leverage any LNG export project in Nova Scotia to meet its demand.
75
ICF International. “The Future of Natural Gas Supply for Nova Scotia”. ICF International, March 28, 2013: Toronto, Canada. Prepared on behalf of the N.S. Department of Energy. Available at: http://novascotia.ca/energy/publications/The-Future-of-Natural-Gas-Supply-for-Nova-Scotia.pdf 76
U.S. Energy Information Administration (EIA). “Annual Energy Outlook 2014 Early Release.” EIA, 16 December 2013. Available at: http://www.eia.gov/forecasts/aeo/er/index.cfm. 77
ICF International. “The Future of Natural Gas Supply for Nova Scotia”. ICF International, March 28, 2013: Toronto, Canada. Available at: http://novascotia.ca/energy/publications/The-Future-of-Natural-Gas-Supply-for-Nova-Scotia.pdf ICF International. “The Future of Natural Gas Supply for Nova Scotia”. ICF International, March 28, 2013: Toronto, Canada. Available at: http://novascotia.ca/energy/publications/The-Future-of-Natural-Gas-Supply-for-Nova-Scotia.pdf 78
National Energy Board (NEB). “Canada’s Energy Future 2013: Energy Supply and Demand Projections to 2035”. NEB, 21 November, 2013. Available at: http://www.neb-one.gc.ca/clf-nsi/rnrgynfmtn/nrgyrprt/nrgyftr/nrgyftr-eng.html

Market Trends for the Supply and Demand of Electricity in Nova Scotia
© 2014 45 icfi.ca
Another issue affecting gas market bases across North America, particularly the Northeast region, is how the TransCanada pipeline tolls will evolve going forward. Declining flows on the TransCanada Mainline due to evolving LNG export and oil sands demand in the WCSB as well as the growth of the Marcellus have led TransCanada to increase tolls and consider converting part of the pipeline to oil transport. These changes make the outlook of WCSB gas for Northeast demand highly uncertain.
Price Forecast Overview: Generally, hub-based gas pricing reflects local supply and demand conditions, as well as congestion in transportation. The gas price forecast at Henry Hub is a typical benchmark for U.S. natural gas market, and it underlies the NYMEX gas futures contract. The exhibit below shows U.S. natural gas price forecasts at the Henry Hub pricing point, ranging between $6.20 and $6.90/MMBtu by 2035 (2012 dollars). Henry Hub prices are expected to surpass $5/MMBtu by 2025 in all forecasts, and about $6 by the mid-2030s. The main drivers of gas price increases could include increasing share in electricity generation, LNG and Mexico exports, and petrochemicals demand. ICF projected similar gas prices in our March 2013 report.
79
Exhibit 30 Natural Gas Price Forecasts
Source: IEA, EIA, NEB
Delivered Natural Gas Prices in Nova Scotia: There are several pricing hubs that are relevant to New England and Atlantic Canada: Dracut, MA, TGP Zone 6 and AGT City Gates. As discussed in our previous report for the Department of Energy
80, gas contracts in Maritimes Canada are typically
linked to New England gas prices. Therefore, New England prices and basis relative to Henry Hub and to Marcellus are critical for assessing gas prices in Nova Scotia. New England demand will be driven by increasing gas-fired generation, added onto a highly volatile residential and commercial demand influenced by the weather. The surge in New England power prices this past winter indicates gas and power markets in New England have become much more interdependent, which leads to potential issues for the region during peak demand periods.
81
79
ICF International. “The Future of Natural Gas Supply for Nova Scotia”. ICF International, 28 March, 2013: Toronto, ON. Available at: http://novascotia.ca/energy/publications/The-Future-of-Natural-Gas-Supply-for-Nova-Scotia.pdf 80
ICF International. “The Future of Natural Gas Supply for Nova Scotia”. ICF International, March 28, 2013: Toronto, Canada. Available at: http://novascotia.ca/energy/publications/The-Future-of-Natural-Gas-Supply-for-Nova-Scotia.pdf 81
U.S. Energy Information Administration. “Northeast and Mid-Atlantic power prices react to winter freeze and natural gas constraints”. U.S. EIA, 21 January, 2014. Available at: http://www.eia.gov/todayinenergy/detail.cfm?id=14671

Market Trends for the Supply and Demand of Electricity in Nova Scotia
© 2014 46 icfi.ca
Robust production growth in the nearby Marcellus and new demand patterns in the Gulf Coast and the WCSB have altered the historical pattern of gas flow, and ICF expects flows from Gulf Coast and Western Canada to the U.S. Northeast to decline, with Marcellus gas increasingly supplying New England. Several pipeline projects have been announced to bring Marcellus gas to the Northeast market, including Algonquin’s AIM Expansion, TGP Bullet and Atlantic Bridge. The outcome of these projects is highly dependent on whether they can secure firm supply contracts from buyers in the Northeast and perhaps even Canadian Maritimes. Power generators in New England have historically relied on interruptible pipeline capacity, and the continuation of this pattern will likely inhibit the necessary pipeline infrastructure development. Spectra Energy has indicated that the market response to the Atlantic Bridge open season was favorable. Therefore, that firm plans to move forward with the project and set a target in-service date of November 2017.
82
New England prices will be characterized by increasing gas-fired generation as well as the pace of infrastructure development to bring nearby gas from the Marcellus and Utica to the region. ICF expects an increasing basis in New England over Henry Hub prices, as we expect future pipeline capacity increase to lag behind demand growth in the U.S. Northeast power sector. This lag is primarily because new pipelines will have to be built in a heavily populated area in the Northeast, with potential for delays. New England prices could rise to $9.22/MMBtu by 2035, indicating tight pipeline capacity available in the region (i.e., transport congestion). See Exhibit 31.
Exhibit 31 ICF’s Natural Gas Price Forecast for the NSDOE (March 2013)
Source: The Future of Natural Gas Supply for Nova Scotia, ICF
It is our expectation that gas prices in Nova Scotia will continue to mirror prices in New England, as is currently the case. This link to New England prices can only be broken if there is sufficient demand in Nova Scotia (such as potential LNG exports from the region), new pipeline capacity is built (e.g., if supported by an aggregation scheme as proposed by NS DOE), or if there is new relative cheap offshore gas finds in Nova Scotia (e.g., if the upcoming exploration program in Nova Scotia is successful in finding new gas resources). Exhibit 32 shows gas price forecast summary, comparing ICF forecasts prepared for the NS DOE in 2013 with those from other public agencies.
82
See http://www.spectraenergy.com/Operations/New-Projects-and-Our-Process/New-Projects-in-US/Atlantic-Bridge/

Market Trends for the Supply and Demand of Electricity in Nova Scotia
© 2014 47 icfi.ca
Exhibit 32 Gas Price Forecast Comparison
Note: The first five price forecasts are Henry Hub or equivalent, which is a commodity price delivered into a pipeline. Only the last forecast is a market price in a consuming region inclusive of pipeline charges.
4.2.3 Fuel Oil Fuel oil constitutes a very small portion of the Nova Scotia Power fuel mix. In 2013, fuel oil consumption accounted for less than 1 percent of the company’s fuel use (Exhibit 26). Market Structure of Fuel Oil: LFO and HFO are internationally traded petroleum products, with North American prices being closely linked to global prices. According to the IEA’s World Energy Outlook, demand for HFO (also known as residual fuel oil, bunker c fuel, or No. 6 fuel oil) is expected to decline in power generation in favor of natural gas, nuclear, and renewables. In the marine transportation sector, Emission Control Areas (ECA) sulphur regulations will shift HFOl demand to cleaner fuels like marine gasoil or LNG.
83 These market developments are likely to result
in lower demand and price outlook for residual fuel oil internationally. LFO includes heating oil, No. 2 fuel oil, and diesel. IEA forecasts a growing demand for LFO, arising primarily from the transportation sector in developing countries. In electricity generation and residential heating, LFO is losing market share to natural gas. Some increase in use will be in the marine sector where ultra-low sulphur diesel will replace some bunker c fuel.
84
Fuel Oil Demand in Nova Scotia: HFO is used as backup fuel at the Nova Scotia Power Tufts Cove generating plant in Dartmouth. Currently, the province imports all its refined petroleum products, including residual fuel oil.
85 The province has a large Nustar terminal at Point Tupper and a
new terminal (which was converted from a refinery) at Dartmouth allowing access to international petroleum product markets. It is therefore reasonable to assume that residual fuel oil prices in Nova Scotia follow international prices closely. More specifically, the prices of residual fuel oil used in Nova Scotia track New York residual fuel oil prices. LFO is primarily used for ignition and for peaking generators, and its demand in Nova Scotia is small. Price Forecast Overview: The pricing of petroleum products tends to follow crude prices over the long term. Prices in Nova Scotia are related to the international price of petroleum products and typically are quoted in reference to a mid-Atlantic price, referring to New York Harbor. The EIA forecasts Middle Atlantic average heavy fuel oil price, and it is expected to reach $2.70/gal in 2035 in the AEO 2014 Early Release forecast, which is a $0.22/gal drop from the AEO 2013 forecast (2012 dollars)—see Error! Reference source not found. Use of residual fuel oil has been declining in the .S., mostly because of reductions in the power sector, where residual fuel oil is used mostly as a
83
See IEA World Energy Outlook 2013, p. 534. See also IEA Oil Market Report, 15 May 2014, retrieved from http://omrpublic.iea.org/currentissues/fullpub.pdf on May 18, 2014. 84
IEA, World Energy Outlook 2013, p. 532. 85
Bundale, Brett. “High demand causes furnace oil shortage”. The Chronicle Herald: January 10, 2014. Available at: http://thechronicleherald.ca/business/1178858-high-demand-causes-furnace-oil-shortage
Unit: 2012$/MMBtu 2012 2015 2020 2025 2030 2035
AEO 2013 Reference Case Henry Hub $2.66 $3.17 $4.21 $4.96 $5.49 $6.43
AEO 2014 Early Release Henry Hub $2.75 $3.74 $4.38 $5.23 $6.03 $6.92
NEB 2013 Henry Hub $2.75 $4.10 $4.87 $5.43 $5.83 $6.18
IEA U.S. Natural Gas Current Policies Scenario $2.70 N/A $5.20 $5.80 $6.20 $6.90
ICF March 2013 Henry Hub $2.75 $3.99 $5.17 $5.17 $6.04 $6.79
ICF March 2013 New England $3.94 $5.71 $7.24 $7.42 $8.16 $9.22

Market Trends for the Supply and Demand of Electricity in Nova Scotia
© 2014 48 icfi.ca
backup fuel and also due to impending sulphur regulations. LFO is expected to increase modestly over the same period from $3.60 per gallon to $4.90 per gallon (2012$).
86.
Exhibit 33 Fuel Oil Price Forecasts
Source: EIA
The exhibit below summarizes AEO forecasts of HFO prices. The Middle Atlantic prices reflect petroleum product market conditions at New York Harbor.
Exhibit 34 HFO Price Forecast Comparison
Source: ICF Analysis
4.3 In Summary Although current fuel use in Nova Scotia has been dominated by solid fuels, the key fuel in Nova Scotia for the future will be renewables and natural gas. In order to be under the emission ceilings, Nova Scotia will have to retire its coal-fired units, and coal consumption is projected to fall significantly over the next two decades, similar to broader trends in the rest of Canada. As solid fuel use declines, natural gas will assume a more pivotal role than it already has. Where today, natural gas provides intermediate and peaking power for the province, in the future, it will provide this and some level of base load and a larger supporting role for renewables and purchased power. With declining gas production from SOEP, and absent other new domestic supply from shale or coal bed methane, Nova Scotia will have to look to the south and west for new gas supplies. This will involve commitment of resources for additional gas pipeline capacity from or through New England and back to production basins in Pennsylvania or to Dawn in Ontario.
86
EIA, Annual Energy Outlook 2013, Table C 3, Energy Prices by Sector and Source, Reference Case, average price to all users; p. 176.
Unit: 2012$/gal 2012 2015 2020 2025 2030 2035
AEO 2013 Reference Case Mid Atlantic RFO $2.82 $1.82 $2.05 $2.31 $2.61 $2.92
AEO 2014 Early Release Mid Atlantic RFO $3.38 $1.96 $1.97 $2.22 $2.49 $2.70

Market Trends for the Supply and Demand of Electricity in Nova Scotia
© 2014 49 icfi.ca
5 Supply Side Considerations (2014-2040) In the next one to two decades, Nova Scotia’s electricity generation portfolio is expected to experience unprecedented changes mostly due to current and pending environmental regulations. Currently, fossil fuel fired generating sources supply the majority of the province’s demand for power. By 2020, provincial regulations require that renewable power will satisfy at least 40% of total demand in Nova Scotia. The equivalency agreement between Nova Scotia and the federal government allows the province to use provincial regulations to achieve the same or better GHG reductions from the electricity sector as would occur under federal regulation. The equivalency agreement outlines the conditions under which the federal government would defer to provincial regulations in Nova Scotia, since the existing provincial GHG regulations achieve an equivalent environmental effect as the federal approach out to 2030. The provincial GHG regulations require the electricity sector to reduce their GHG emissions to 7.5 MT by 2020 and 4.5 MT by 2030. The required reductions are approximately 25% below 2007 levels by 2020 and 55% below 2007 levels by 2030. Current and pending air quality requirements can therefore be designed to achieve reduction goals through flexible usage of a broad set of carbon neutral; and carbon reducing strategies to reduce air pollutants in a cost effective manner. The supply side considerations section examines currently available generating sources and the future market trends that will influence the capacity and generation mix decisions. Although the generation fleet currently, along with imports from other parts of Canada are together able to meet generation and peak demand requirements, expected coal-fired unit seasonal shutdowns and eventual retirements and an influx of renewable sources signal potential reliability concerns. This section focuses on the calculations of levelized cost of energy (LCOE) to illustrate the costs associated with building and operating various types of new generating sources. Moreover, this section presents levelized cost of energy of relevant retrofit options to analyze the economic feasibility and effectiveness of installing retrofits. In addition to levelized cost of energy, this section also touches upon other aspects associated with this assessment of new generating sources and retrofit options. For instance, depending more on intermittent renewable sources requires a greater reliance on gas-fired sources, and this implies additional costs such as pipeline development costs that are not captured in levelized cost of energy calculations. Installing carbon capture and storage (CCS) as a retrofit option is part of the assessment as well, and this section examines the current state of various components of CCS retrofit installation, such as the availability of storage sites, the economic feasibility of transportation methods, and the legal and regulatory environment. Nova Scotia faces great changes in generation portfolio in near future, and continuing to meet the province’s demand requires large scale of new generating sources development, upgrades in infrastructure, and increasing the level of imports from other provinces.
5.1 Baseline General Assessment of Electricity Generation Nova Scotia Power Incorporated (NSPI) generates approximately 95%
87 of the electricity in Nova
Scotia. Hydro power serves as the main source of electricity in Canada, but Nova Scotia relies heavily on fossil fuel generated electricity. With low capacity factors and little storage ability, even though hydro facilities represent approximately 15% of operating capacity in Nova Scotia, they contribute much less to the generation mix. According to the Canadian Electricity Association’s key Canadian electricity statistics released in March 2012, Nova Scotia as a province generated a total of 11.3 TWh in 2011, and 83% of the power comes from conventional steam resources.
88 with
Alberta and Saskatchewan.
87
Abreu, “Electricity and Nova Scotia’s Future: Hurdles and Opportunities,” Ecology Action Centre, August 2013, 11, https://www.ecologyaction.ca/files/images-documents/file/Energy/ElectricityAndNSFuture_LoRes.pdf 88
“Key Canadian Electricity Statistics,” Canadian Electricity Association, March 21, 2012.

Market Trends for the Supply and Demand of Electricity in Nova Scotia
© 2014 50 icfi.ca
Exhibit 35 shows that Nova Scotia is one of three provinces in Canada heavily depending on coal-fired capacity along with Alberta and Saskatchewan.
Exhibit 35 Electricity Generation in Canada by Province and Fuel Type, 201289
NSPI owns 2,483 MW of generating capacity, and contracts 273 MW of renewable energy from independent power producers (IPPs). According to Emera Inc.’s Annual Report from 2013, approximately half of the generating capacity owned by NSPI is coal-fired. In addition to the 2.5 GW of generating sources, NSPI also contracts with IPPs for renewable power, mainly from biomass and wind. Exhibit 36 and Exhibit 37 show the current capacity and generation mix by fuel type, and Exhibit 38 displays the list of currently operating power plants in Nova Scotia owned by NSPI.
89
PowerForTheFuture, Canadian Electricity Association.

Market Trends for the Supply and Demand of Electricity in Nova Scotia
© 2014 51 icfi.ca
Exhibit 36 Capacity Mix in Nova Scotia, 2013
90
Capacity Type Capacity (MW)
Coal 1,244
Natural Gas/Oil 703
Hydro/Wind 477
Biomass 60
IPPs - Biomass/Wind 273
90
“Annual Report 2013,” Emera Inc., 2013, 18, http://www.snl.com/Cache/1001185549.PDF?Y=&O=PDF&D=&fid=1001185549&T=&iid=4072693
NSPI - Coal: 45%
NSPI - Natural Gas/Oil: 25%
NSPI - Hydro/Wind:
17%
NSPI - Biomass: 2%
IPPs - Biomass/Wind:
10%
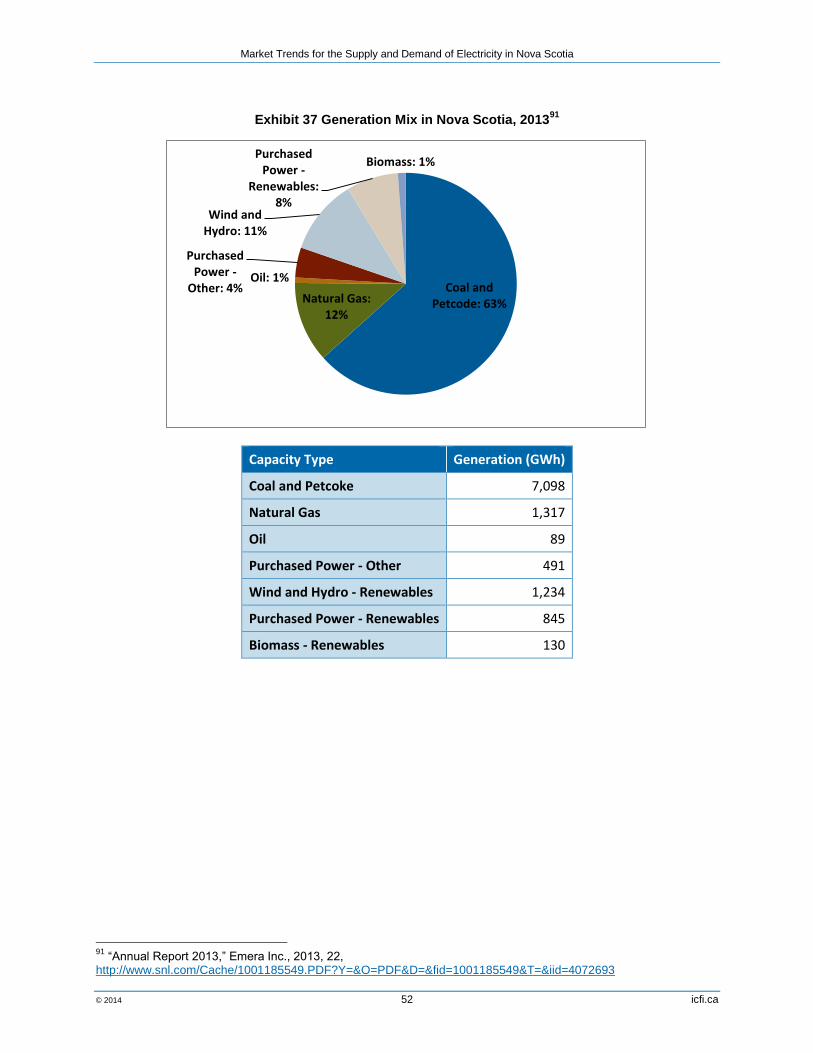
Market Trends for the Supply and Demand of Electricity in Nova Scotia
© 2014 52 icfi.ca
Exhibit 37 Generation Mix in Nova Scotia, 2013
91
Capacity Type Generation (GWh)
Coal and Petcoke 7,098
Natural Gas 1,317
Oil 89
Purchased Power - Other 491
Wind and Hydro - Renewables 1,234
Purchased Power - Renewables 845
Biomass - Renewables 130
91
“Annual Report 2013,” Emera Inc., 2013, 22, http://www.snl.com/Cache/1001185549.PDF?Y=&O=PDF&D=&fid=1001185549&T=&iid=4072693
Coal and Petcode: 63% Natural Gas:
12%
Oil: 1%
Purchased Power -
Other: 4%
Wind and Hydro: 11%
Purchased Power -
Renewables: 8%
Biomass: 1%

Market Trends for the Supply and Demand of Electricity in Nova Scotia
© 2014 53 icfi.ca
Exhibit 38 NSPI Owned Generating Resources in 201392
Plant/System Fuel Type Winter Capacity (MW)
Avon Hydro 6.8
Black River Hydro 22.5
Lequille System Hydro 24.2
Bear River System Hydro 37.4
Roseway Hydro 1.8
Tusket Hydro 2.4
Mersey System Hydro 42.5
St. Margaret's Bay Hydro 10.8
Sheet Harbour Hydro 10.8
Dickie Brook Hydro 3.8
Wreck Cove Hydro 210.0
Annapolis Tidal Hydro 4.0
Fall River Hydro 0.5
Tufts Cove Heavy Fuel Oil/Natural Gas 321.0
Trenton Coal/Pet Coke/Heavy Fuel Oil 307.0
Point Tupper Coal/Pet Coke/Heavy Fuel Oil 152.0
Lingan Coal/Pet Coke/Heavy Fuel Oil 612.0
Point Aconi Coal/Pet Coke & Limestone Sorbent (CFB) 171.0
Tufts Cover Units 4, 5 & 6 Natural Gas 146.7
Burnside Light Fuel Oil 99.0
Tusket Light Fuel Oil 24.0
Victoria Junction Light Fuel Oil 66.0
Pre-2001 Renewables Independent Power Producers 25.8
Post-2001 Renweables (firm) Independent Power Producers 27.8
NS Power wind (firm) Wind 6.3
With future DSM program effects taken into consideration, from 2014 and on, net system peak demand fluctuates between 2,000 MW and 2,100 MW for Nova Scotia. Although total generating capacity now is higher than peak demand forecasted for the next decade, reliability concerns persist. The Maritime Link and increased renewable capacity expected to be operational in the near- to mid-term, the seasonal operation of traditionally baseloaded coal units will likely be an economic means of ensuring that the peak period load is able to continue to be met reliably. Based on the final assumptions for NSPI’s latest IRP, Tufts Cove Unit 1 which will reach the age of 60 in 2025, and one of the Lingan units with 153 MW of capacity is likely to at a minimum have seasonal shutdowns when the Maritime Link project comes online. The Maritime Link project builds a subsea cable connecting Newfoundland to Nova Scotia with an initial capacity of 153 MW, and expected capacity to transmit 500 MW of electricity between two provinces. The aging NSPI generation fleet and the
92
“Nova Scotia Power Inc. 10 Year System Outlook,” Nova Scotia Power, July 2013, http://oasis.nspower.ca/site/media/oasis/20130702%20NSPI%20to%20UARB%2010%20Year%20System%20Outlook%20Report%20FILED.pdf
Market Trends for the Supply and Demand of Electricity in Nova Scotia
© 2014 54 icfi.ca
Maritime Link imply a decline in generation from conventional sources in the near/mid-term and into the long run, however, it does not necessarily reflect that the need for continued central station facilities will decline. In fact, the resource adequacy at peak, when limited imports or renewables may be available, continue to drive the expectation for supplemental capacity to be available, and the existing fleet resources provide optionality value to the system to either maintain operations seasonally or refurbish/repower should the need arise. While coal fired units are expected to contribute less to the generation mix in Nova Scotia, there will be new renewable capacity. Currently, in addition to the 321 MW of installed wind capacity, 123 MW of wind units are expected to be online by 2020. Moreover, through the community feed-in-tariff (COMFIT) program, 150 MW more of wind capacity will be available. Currently the IPPs contribute 273 MW of wind and biomass generating sources to the capacity mix in Nova Scotia, and by 2014, total generating capacity from IPPs will increase to 373 MW
93. With much lower capacity compared
to conventional thermal units and the intermittent nature of renewables, a large amount of renewable capacity is required to replace conventional coal units. Therefore, coal units are likely to take on a different role in the capacity and generation mix in Nova Scotia. As seasonal shutdowns, derating, fuel switch, and eventual retirements of certain coal plants become effective, coal-fired units will contribute when Nova Scotia needs power most in peak seasons, while more and more power generation comes from non-coal sources.
5.2 Energy Policies and Environmental Regulations Current and pending environmental requirements will play a role in changing the landscape of power generation in Nova Scotia. Released in 2010, Nova Scotia’s Renewable Electricity Plan details the province’s move away from fossil fuel generated power with clear targets. By 2015, 25% of Nova Scotia’s electricity will be from renewable sources; by 2020, renewables’ share will increase to 40%
94. Currently, based on 2011 data, only 12% of total generation is supplied by renewable
sources: hydro contributes 10%, and wind supplies 2%95
. In November 2013, Nova Scotia introduced a piece of new legislation, the Electricity Reform Act, which provides electricity ratepayers with greater competition and choice by allowing renewable energy providers to sell directly to customers. Currently, the Act is undergoing broad consultation, and this legislation signals one of the first steps in the government’s plan to review electricity policy in the province
96.
In August 2012, the Government of Canada introduced Reduction of Carbon Dioxide Emissions from Coal-fired Generation of Electricity Regulations, requiring all coal-fired units to retire after 50 years of being in operation, or be refitted with CCS technology. Currently, Nova Scotia relies on power generated from 1.2 GW of coal-fired capacity. If the Province had not been successful in finalizing the equivalency agreement with the Federal Government, the electricity sector in Nova Scotia would have needed to comply with the federal coal regulation, resulting in earlier shutdowns of several coal units. As the federal government recognizes Nova Scotia’s ongoing efforts in reducing greenhouse gas emissions, the equivalency agreement defers federal regulation in favour of the Nova Scotia’s regulations, which require the electricity sector to meet decreasing GHG emission caps. Nova Scotia’s regulated caps limit electricity sector emissions in NS to no more than 7.5 MT of GHGs in 2020 and further decrease to 4.5 MT in 2030. In intervening years, GHG caps are applied over multi-year compliance periods, which allow for greater flexibility to adjust to yearly circumstances while meeting environmental goals. The required reductions from the electricity sector translate
93
“Annual Report 2013,” Emera Inc., 2013, 18, http://www.snl.com/Cache/1001185549.PDF?Y=&O=PDF&D=&fid=1001185549&T=&iid=4072693 94
“2010 Renewable Electricity Plan,” last modified April 13, 2012, http://www.novascotia.ca/energy/renewables/renewable-electricity-plan/ 95
Abreu, “Electricity and Nova Scotia’s Future: Hurdles and Opportunities,” Ecology Action Centre, August 2013, 11-12, https://www.ecologyaction.ca/files/images-documents/file/Energy/ElectricityAndNSFuture_LoRes.pdf 96
“Electricity Reform Act to transform Electricity Marketplace,” last modified April 8, 2014, http://novascotia.ca/news/release/?id=20131129001

Market Trends for the Supply and Demand of Electricity in Nova Scotia
© 2014 55 icfi.ca
approximately to a 25% reduction in GHG emissions from 2007 levels by 2020 and a 55% reduction by 2030. The equivalency agreement recognizes the effect of the provincial regulations as equivalent to the effect of the federal coal regulation in Nova Scotia. Additionally, the Comprehensive Air Management System (CAMS)is a federal framework aiming at improving air quality management, A key pillar of this federal initiative is the development of standards to achieve good base level reductions to protect the environment and human health, and in the case of the electricity sector. Such standards would apply to NOx and SOx emissions. Currently, coal units continue to be the major source of emissions for Nova Scotia: in 2011, 28% of NOx emissions, 70% of SO2 emissions, and 71% of Hg emissions come from coal-fired electricity generating facilities
97.NOx and SO2 contribute significantly to acid rain and smog. Additionally, air
pollution has been shown to significantly impacts human health leading to and exacerbating respiratory illness and cardiac issues and even lead to premature death. Moreover, neurotoxins such as mercury can be particularly impactful to development of children
98.
Nova Scotia regulates nitrogen oxides (NOx), sulphur dioxide (SO2), and mercury (Hg) at a provincial wide level. Nova Scotia’s current fleet approach allows for portfolio optimization of resources to provide a limited economic impact. In contrast, other jurisdictions take a more restrictive approach to regulating these emissions by requiring unit level standards and capital intensive pollution control equipment. . The pending amendments to the Air Quality Regulations, as out for public comment in 2013, would use an approach that allows for more flexibility in compliance, as the proposed amended regulation includes multi-year compliance periods for NOx and SO2 with annual hard caps for 2025 and 2030 (Exhibit 41). T approach increases flexibility for the utility to achieve compliance.
The approach will achieve an 86% reduction in SO2, a 69% reduction in nitrogen oxides NOx and an 89% reduction in mercury Hg by 2030.
Exhibit 39 Pending Reductions of Air Pollutant Emissions99
Pollutant Type of Emission Cap 2021 - 2024 2025 2026 - 2029 2030 +
SO2
Total emission Cap (tonnes) 136,000 N/A 104,000 N/A
Annual emission Cap (tonnes) 36,350 28,000 28,000 20,000
Emission Cap Per Unit (tonnes) 17,760 13,720 13,720 9,800
NOx Total emission Cap (tonnes) 56,000 N/A 44,000 N/A
Annual emission Cap (tonnes) 14,955 11,500 11,500 8,800
The upcoming Maritime Link, and the potential for lower dispatch rates at existing fossil resources reflect ways in which reductions in GHG emissions could be achieved. However, coal units must likely continue to play an integral role in ensuring reliability with seasonal operations. The combination of multi-year compliance periods and two annual hard caps provide a certain level of protection from fuel markets volatilities and other uncertainties as the utility meets environmental requirements.
97
“Amendments to Greenhouse Gas & Air Quality Emissions Regulations,” July 2013, https://www.novascotia.ca/nse/climate-change/docs/Greenhouse-Gas-Amendments-2013.pdf 98
Regulatory Impact analysis for MATS, 2011. Environmental Protection Agency US 99
“Amendments to Greenhouse Gas & Air Quality Emissions Regulations,” July 2013, https://www.novascotia.ca/nse/climate-change/docs/Greenhouse-Gas-Amendments-2013.pdf

Market Trends for the Supply and Demand of Electricity in Nova Scotia
© 2014 56 icfi.ca
5.3 Assessing Generation Technologies In Nova Scotia, the following generating technologies can potentially replace the generating capacity that is expected to retire: pulverized coal, coal IGCC, coal IGCC CCS, combustion turbine, combined cycle, nuclear, fuel cell, wind, solar, geothermal, biomass, and hydro. According to the NSPI IRP assumptions, nuclear units are not considered due to legislation, and geothermal resources are not considered either, although a small amount of resource is available in the province. In order to assess various technologies in Nova Scotia, ICF relies on publicly available information from the United States Energy Information Administration (EIA) to forecast the cost trends up to 2040 in Nova Scotia. EIA is the most comprehensive source for information available for major generation technology costs today, and ICF calculates baseline costs using EIA assumptions, including cost and performance assumptions, financial assumptions, and fuel prices. Exhibit 40 shows capital cost assumptions for various generating technologies for 2020, 2030, and 2040. From 2020 and on, according to assumptions received from EIA, the majority of generating technologies witness declining capital costs. Two capacity types with increasing capital costs are hydro and geothermal, and the ascending cost trend is possibly due to decreasing resource availability in later decades.
Exhibit 40 Trends in Capital Cost for Non-Renewables: 2020/2030/2040100
100
United States Energy Information Administration (EIA), Annual Energy Outlook 2014.
0
1,000
2,000
3,000
4,000
5,000
6,000
7,000
2020 2030 2040
20
12
$/k
W-y
r
Pulverized Coal
Coal IGCC
Coal IGCC CCS
Combustion Turbine
Conventional CC
Nuclear

Market Trends for the Supply and Demand of Electricity in Nova Scotia
© 2014 57 icfi.ca
Exhibit 41 Trends in Capital Cost for Renewables: 2020/2030/2040101
In addition to capital cost assumptions, EIA’s AEO2014 ER also provides the following assumptions: capital charge rate by capacity type, fixed operation and maintenance cost (FOM), variable operation and maintenance cost (VOM), heat rate in 2013, the nth-of-a-kind heat rate, capacity factor, and fuel prices including coal, gas, and uranium. Since EIA assumes FOM and VOM to remain stable throughout all years, fuel cost is a major factor affecting levelized cost of energy in addition to capital cost. ICF uses delivered electric power sector fuel prices received from EIA to calculate fuel cost as one component of total levelized cost of energy.
Exhibit 42 illustrates the fuel price trend for coal and gas. Exhibit 43 displays the calculated baseline levelized cost of energy based on main street assumptions from EIA. Exhibit 44 shows costs in Nova Scotia after applying regional multipliers to capital cost charges.
101
United States Energy Information Administration (EIA), Annual Energy Outlook 2014.
0
1,000
2,000
3,000
4,000
5,000
6,000
7,000
8,000
2020 2030 2040
20
12
$/k
W-y
r
Fuel Cell
Biomass
Geothermal
Hydro
Wind
Offshore Wind
Solar Thermal
Solar PV

Market Trends for the Supply and Demand of Electricity in Nova Scotia
© 2014 58 icfi.ca
Exhibit 42 Fuel Prices for Coal and Gas
As illustrated below, the majority of generating technologies witness a trend of declining levelized costs over the years, with the exception of gas fired and geothermal technologies. The LCOE calculations use delivered fuel prices for the electric sector, and these prices are significantly higher than Henry Hub price projections. As gas prices increase over the years, the LCOE values for gas-fired sources increase as well. However, conventional and advanced combined cycle units are competitive compared to pulverized coal units. Nonetheless, advanced combined cycle units have the lowest levelized cost of energy among conventional generating technologies. In fact, nuclear technologies are slightly cheaper than advanced CC units, but as mentioned previously, due to legislation, new nuclear units will not be considered in the future capacity mix in Nova Scotia. The Renewable Electricity Plan and the emission caps in Nova Scotia require additional renewable capacity to contribute to the capacity and generation mix in the province. However, most of renewable generating technologies present relatively low capacity factors compared to conventional fossil fuel-fired technologies. Therefore, a large amount of generating capacity is required to replace potential seasonal shutdowns and retirements of coal-fired units in Nova Scotia. The changing landscape of capacity and generation mix in Nova Scotia directly affects ratepayers, and the specific impact will be discussed in a later section along with resource adequacy.
0.00
1.00
2.00
3.00
4.00
5.00
6.00
7.00
8.00
9.00
2020 2030 2040
20
12
$/M
MB
tu
Coal
Gas

Market Trends for the Supply and Demand of Electricity in Nova Scotia
© 2014 59 icfi.ca
Exhibit 43 Levelized Cost of Energy – Baseline (2012$/MWh)
Capacity (MW)
2020 2030 2040
Pulverized Coal 1,300 102.61 101.58 98.39
Coal IGCC 1,200 121.57 116.52 110.85
Coal IGCC CCS 520 152.14 144.07 134.50
Combustion Turbine 85 116.11 144.15 150.16
Advanced Combustion Turbine 210 86.39 107.73 113.17
Conventional CC 620 56.35 75.26 80.18
Advanced CC 400 55.14 71.93 76.31
Advanced CC with CCS 340 83.31 101.38 104.65
Fuel Cell 10 160.22 146.13 129.87
Nuclear 2234 105.09 99.50 90.66
Biomass 50 75.09 71.32 65.88
Geothermal 50 51.64 51.27 73.84
Hydro 500 82.17 93.86 95.76
Wind 100 83.41 79.63 73.83
Offshore Wind 400 208.52 192.23 171.51
Solar Thermal 100 251.04 231.78 207.56
Solar PV 150 141.88 130.61 118.87
0.00
50.00
100.00
150.00
200.00
250.00
300.00
Pu
lver
ize
d C
oal
Co
al IG
CC
Co
al IG
CC
CC
S
CT
Ad
van
ced
CT
Co
nve
nti
on
al C
C
Ad
van
ced
CC
Ad
van
ced
CC
wit
h C
CS
Fue
l Cel
l
Nu
clea
r
Bio
mas
s
Geo
ther
mal
Hyd
ro
Win
d
Off
sho
re W
ind
Sola
r Th
erm
al
Sola
r P
V
20
12
$/M
Wh
2020
2030
2040

Market Trends for the Supply and Demand of Electricity in Nova Scotia
© 2014 60 icfi.ca
Exhibit 44 Levelized Cost of Energy – Nova Scotia (2012$/MWh)
2020 2030 2040
Pulverized Coal 109.79 108.34 104.55
Coal IGCC 144.17 137.11 129.38
Coal IGCC CCS 181.03 170.08 157.34
Combustion Turbine 120.74 148.53 154.14
Advanced Combustion Turbine 89.45 110.40 115.58
Conventional CC 58.24 77.04 81.81
Advanced CC 57.18 73.77 77.99
Advanced CC with CCS 87.37 104.97 107.80
Fuel Cell 173.34 157.63 139.50
Nuclear 113.52 107.22 97.39
Biomass 81.28 77.08 71.01
Geothermal 55.85 55.44 80.62
Hydro 90.91 103.95 106.07
Wind 91.38 87.16 80.70
Offshore Wind 229.73 211.56 188.44
Solar Thermal 275.22 253.73 226.72
Solar PV 156.84 144.28 131.17
0.00
50.00
100.00
150.00
200.00
250.00
300.00
Pu
lver
ize
d C
oal
Co
al IG
CC
Co
al IG
CC
CC
S
CT
Ad
van
ced
CT
Co
nve
nti
on
al C
C
Ad
van
ced
CC
Ad
van
ced
CC
wit
h…
Fue
l Cel
l
Nu
clea
r
Bio
mas
s
Geo
ther
mal
Hyd
ro
Win
d
Off
sho
re W
ind
Sola
r Th
erm
al
Sola
r P
V
20
12
$/M
Wh
2020 2030 2040

Market Trends for the Supply and Demand of Electricity in Nova Scotia
© 2014 61 icfi.ca
5.4 Environmental Retrofits and Fuel Switch For coal-fired units, environmental retrofits provide an opportunity to better comply with environmental regulations and lengthening the plant life. Environmental retrofits include SO2, NOx, and mercury control technology options, as well as carbon capture and sequestration (CCS) for GHG emission reduction. This section explores the costs and effectiveness of installing CCS and other types of environmental retrofits including coal-to-gas conversions. All cost and performance assumptions for various retrofit options are from United States Environmental Protection Agency (EPA)’s power sector modeling platform v.5.13, released in November 2013.
SO2 Control Technology Options Also known as scrubbers, flue gas desulphurization (FGD) equipment is installed to remove sulphur oxides from a plant’s combustion gases before emission into the atmosphere. The two commercially viable FGD technology options for coal-fired power plants contained in the EPA analysis are limestone forced oxidation (LSFO) scrubbers and lime spray dryers (LSD).
102
NOX Control Technology Options NOX reduction technologies can be categorized as either combustion or post-combustion controls. During the combustion process, combustion controls regulate temperature and fuel-air mixing, and consequently reduce NOX emissions. Currently, the majority of Nova Scotia coal units are equipped with Low NOx burners to manage NOx emissions.
Mercury Control Technology Options Activated Carbon Injection (ACI) is used in EPA’s analysis for mercury controls. Under EPA’s assumptions, three available ACI options are: ACI with existing hot and cold-sided electrostatic precipitators (ESPs), ACI with existing fabric filters (also known as baghouses), and ACI with an additional baghouse (often referred to as Toxecon).
CCS Retrofit Option and Fuel Switch Rules regulating carbon dioxide emissions would have the greatest impact on coal-fired generating sources. Another option for coal-fired units would be coal-to-gas conversion. According to EPA’s latest analysis, cost and performance assumptions of CCS retrofit and coal-to-gas fuel switch are as follows.
Exhibit 45 Cost and Performance Assumptions of CCS Retrofit and Fuel Switch
102
LSFO is a wet scrubber, and polluted gas stream is typically brought into contact with limestone or other liquid alkaline sorbent through a pool of the liquid slurry or by spraying the gas stream with the liquid; LSD is a semi-dry FGD technology using a spray dryer absorber, which helps bring the polluted gas stream into contact with the alkaline sorbent in a semi-dry state.

Market Trends for the Supply and Demand of Electricity in Nova Scotia
© 2014 62 icfi.ca
CCS Retrofit103
Coal-to-Gas Switch
104
Capacity (MW) 500 50
Heat Rate (Btu/kWh) 10,000 10,000
Capacity Penalty -25.00% 0.00%
Heat Rate Penalty 33.00% 5.00%
VOM (2012$/MWh) 3.52 3.68
Capital Cost (2012$/kW) 1,972 339
FOM (2012$/kW-yr) 29.9 23.0
Capacity Factor 85% 87%
SO2 Removal Rate 90% 50%
Levelized Costs and Removal Rates of Retrofit Options Based on the assumptions from EPA’s power sector modeling platform released in November 2013, ICF assessed the cost and effectiveness of various retrofit options represented by levelized cost of energy and pollutant removal rates in 2020. For 2030 and 2040, the levelized costs of energy for retrofit options fluctuate slightly only due to changes in fuel prices. The following exhibits lay out both levelized cost of energy and removal rates for all retrofit options controlling SO2 and Hg discussed above.
Exhibit 46 LCOE and Pollutant Removal Rates of Retrofit Options in 2020
Main Pollutant Affected LCOE (2012$/MWh) Removal Rate
LSFO (Wet FGD) SO2 15.90 $1,628/Ton
LSD (Dry FGD) SO2 14.36 $1,541/Ton
ACI+Existing ESP Hg 2.97 $50,006/lb
ACI + Existing FF Hg 2.19 $36,793/lb
ACI + FF Hg 5.13 $85,836/lb
103
“CO2 Capture Transport, and Storage,” EPA’s Power Sector Modeling Platform v.5.13, 6-1, http://www.epa.gov/airmarkets/progsregs/epa-ipm/docs/v513/Chapter_6.pdf 104
“Emission Control Technologies,” EPA’s Power Sector Modeling Platform v.5.13, 5-33 – 5-34, November 2013, http://www.epa.gov/airmarkets/progsregs/epa-ipm/docs/v513/Chapter_5.pdf

Market Trends for the Supply and Demand of Electricity in Nova Scotia
© 2014 63 icfi.ca
Cost of CCS Retrofit and Coal-to-Gas Conversion As shown below, CCS retrofit displays the highest LCOE among all retrofit options. Based on cost and performance assumptions from EPA and fuel cost assumptions from EIA, the levelized cost of energy for CCS retrofit is as high as almost $50/MWh. Although coal-fired units with CCS are guaranteed a longer plant life, the trade-off is a large addition on cost that seems unlikely to be recovered from electricity markets, which would subsequently increase the burden of ratepayers in Nova Scotia to recover such costs. On the other hand, coal-to-gas conversion units incur lower costs compared CCS retrofits, but converting a unit from coal-fired to gas-fired also implies the possible requirement for additional infrastructure such as natural gas pipeline development.
Exhibit 47 Cost of CCS Retrofit and Coal-to-Gas Conversion in 2020
LCOE (2012$/MWh) CO2 Removal Rate
CCS Retrofit 48.88 $42.75/tonne
Coal-to-Gas Conversion 16.83 N/A
Current State of CCS Development in Nova Scotia CCS involves capturing carbon dioxide emissions from large point sources such as coal-fired power plants, transporting the carbon dioxide to a storage site, and often injecting it into a deep underground geological formation where the carbon dioxide will not enter the atmosphere. Currently there is one CCS project operating in Canada. Since 2002, the Weyburn-Midale project in Saskatchewan injects CO2 to enhance oil recovery. Various factors should be considered in order to assess the current state of the development of CCS in Nova Scotia, and among which are: the availability of technically proven geological formations as storage sites, maturity of carbon dioxide capture technologies, economically feasible methods of transportation, and a well-developed legislative and regulatory environment. The Cooperative Research Center for Greenhouse Gas Technologies (CO2CRC) produced an integrated assessment report in 2012 studying the progress of CCS development in Nova Scotia
105.
According to the report, even though there might be possible storages sites in Nova Scotia, further feasibility studies are required to determine the actual level of prospects of these sites, and the process is still at a nascent stage. Three types of CO2 storage sites may be available in Nova Scotia: onshore, offshore, and saline aquifers. Among the onshore locations, the Sydney Sub-basin appears to hold the most promise but further studies are required to determine the feasibility of the location as a storage site
106. Carbon dioxide can also be stored in depleted oil and gas fields in offshore
locations. However, in Nova Scotia, there is a lack of deleted oil and gas fields. The Sable Sub-basin may become available as a storage site when it is depleted
107. Saline aquifers can also potentially
store carbon dioxide in the future, but now the lack of data and preliminary studies makes this option infeasible. The integrated assessment report determined two plants most suitable for CCS trial projects in Nova Scotia: Point Tupper and Lingan. According to the report, a post combustion CO2 capture process using a retrofit solvent technology has been selected, and preliminary design work for the potential small-scale pilot plant at Point Tupper has been completed. The small-scale pilot plant as a trial will
105
“CCS Nova Scotia Integration Assessment Report – 2009 – 2012,” CO2CRC, June 2012, http://www.ccsnovascotia.ca/wp-content/uploads/2013/07/IAR-Integrated-Assessment-Report-FINAL-June-30-13.pdf 106
“CCS Nova Scotia Integration Assessment Report – 2009 – 2012,” CO2CRC, June 2012, http://www.ccsnovascotia.ca/wp-content/uploads/2013/07/IAR-Integrated-Assessment-Report-FINAL-June-30-13.pdf 107
“CCS Nova Scotia Integration Assessment Report – 2009 – 2012,” CO2CRC, June 2012, http://www.ccsnovascotia.ca/wp-content/uploads/2013/07/IAR-Integrated-Assessment-Report-FINAL-June-30-13.pdf
Market Trends for the Supply and Demand of Electricity in Nova Scotia
© 2014 64 icfi.ca
hopefully lead to a full-scale carbon dioxide to be implemented at Lingan108
. However, in addition to the aforementioned issues with the lack of CO2 storage sites in the province, transportation methods also prove to be challenging. For Tupper Point, if a CCS retrofit is installed, transporting CO2 by railroad will be more economically feasible, while for Lingan, a pipeline is required to transport large quantities of carbon dioxide.
109 Currently, the pipeline for CO2 infrastructure is non-existent in Nova
Scotia. Finally, the legal and regulatory regime for CCS projects in Nova Scotia is not yet fully developed. If a CCS project is proposed, proponents of such a project cannot identify the applicable laws and the regulatory roadmap required to develop and implement the CCS project. Moreover, developing CCS projects incurs great costs. Estimated by the CO2CRC, the capital cost of the onshore storage option in Sydney Sub-basin is approximately $700 million with an additional operating cost of $100 million annually.
110 In summary, as further studies are required to understand the availability of
storage sites, pipeline infrastructure calls for further development, and regulatory gaps are waiting to be closed, the development of CCS in Nova Scotia is still in a stage of infancy and remains to be determined more definitely.
5.5 Other Supply Options Other than replacing coal-fired capacity with alternative generation technologies, Nova Scotia’s demand can also be met potentially through smart-grid applications, as well as imports from neighboring regions. This section comments on: The potential cost and impact of AMI; Imports from neighboring regions (e.g., The Maritime Link - transmission line from Newfoundland
to Nova Scotia and potentially more imports from neighboring regions.)
Advanced Metering Infrastructure (AMI) AMI consists of digital hardware and software that collect and analyze energy usage data and provide continuous two-way communication pathways between on-site electricity meters and the utility. Such systems include in-home displays, local area networks, energy management systems, and other customer-side-of-the-meter equipment with smart grid functionalities. The granular data received allow the measurement of time-based information under “time-of-use” pricing rate, the optimization of demand-response actions, or the early remote detection of service disconnections. By providing timely and frequent load information, AMI results in operational cost savings, as well as improvements in forecasting and planning. In general, there has been minimal development of AMI across the province and there exists significant room for growth for this technology. For example, while NSPI coordinates several smart meter pilot projects, it currently offers time-of-day electricity pricing (TOD) only to households with electric thermal heating systems. Of the known AMI deployments in Nova Scotia, one was initiated in 2009-2010 by the Berwick Electric Commission and involved the installation of 220 electricity meters to better monitor usage of electricity. More recently, in 2013, the town of Lunenburg, which operates its own electric utility, launched a smart meter pilot project.
108
“CCS Nova Scotia Integration Assessment Report – 2009 – 2012,” CO2CRC, June 2012, http://www.ccsnovascotia.ca/wp-content/uploads/2013/07/IAR-Integrated-Assessment-Report-FINAL-June-30-13.pdf 109
“CCS Nova Scotia Integration Assessment Report – 2009 – 2012,” CO2CRC, June 2012, http://www.ccsnovascotia.ca/wp-content/uploads/2013/07/IAR-Integrated-Assessment-Report-FINAL-June-30-13.pdf 110
“CCS Nova Scotia Integration Assessment Report – 2009 – 2012,” CO2CRC, June 2012, http://www.ccsnovascotia.ca/wp-content/uploads/2013/07/IAR-Integrated-Assessment-Report-FINAL-June-30-13.pdf
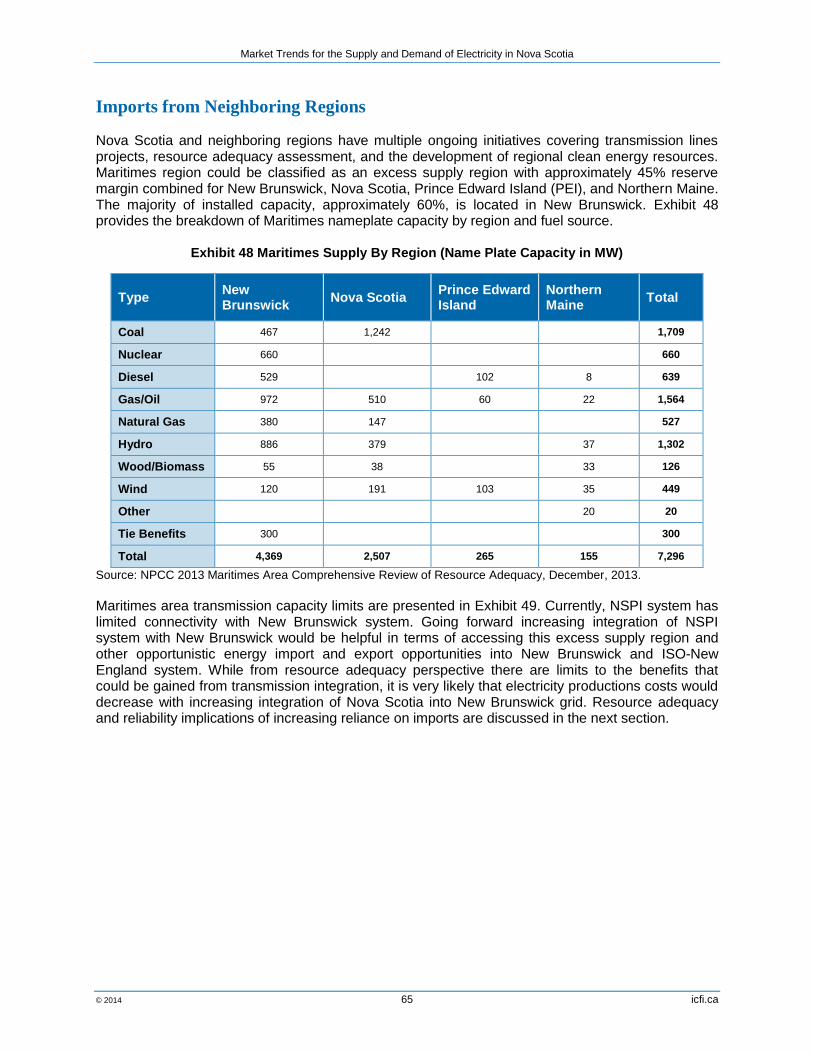
Market Trends for the Supply and Demand of Electricity in Nova Scotia
© 2014 65 icfi.ca
Imports from Neighboring Regions Nova Scotia and neighboring regions have multiple ongoing initiatives covering transmission lines projects, resource adequacy assessment, and the development of regional clean energy resources. Maritimes region could be classified as an excess supply region with approximately 45% reserve margin combined for New Brunswick, Nova Scotia, Prince Edward Island (PEI), and Northern Maine. The majority of installed capacity, approximately 60%, is located in New Brunswick. Exhibit 48 provides the breakdown of Maritimes nameplate capacity by region and fuel source.
Exhibit 48 Maritimes Supply By Region (Name Plate Capacity in MW)
Type New Brunswick
Nova Scotia Prince Edward Island
Northern Maine
Total
Coal 467 1,242 1,709
Nuclear 660 660
Diesel 529 102 8 639
Gas/Oil 972 510 60 22 1,564
Natural Gas 380 147 527
Hydro 886 379 37 1,302
Wood/Biomass 55 38 33 126
Wind 120 191 103 35 449
Other 20 20
Tie Benefits 300 300
Total 4,369 2,507 265 155 7,296
Source: NPCC 2013 Maritimes Area Comprehensive Review of Resource Adequacy, December, 2013.
Maritimes area transmission capacity limits are presented in Exhibit 49. Currently, NSPI system has limited connectivity with New Brunswick system. Going forward increasing integration of NSPI system with New Brunswick would be helpful in terms of accessing this excess supply region and other opportunistic energy import and export opportunities into New Brunswick and ISO-New England system. While from resource adequacy perspective there are limits to the benefits that could be gained from transmission integration, it is very likely that electricity productions costs would decrease with increasing integration of Nova Scotia into New Brunswick grid. Resource adequacy and reliability implications of increasing reliance on imports are discussed in the next section.

Market Trends for the Supply and Demand of Electricity in Nova Scotia
© 2014 66 icfi.ca
Exhibit 49 Maritimes Area Transmission Capacity Limits
Source: NPCC 2013 Maritimes Area Comprehensive Review of Resource Adequacy, December, 2013.
Nova Scotia is currently only directly interconnected with the New Brunswick electric system. Exhibit 50 shows all currently operating and planned transmission lines in Nova Scotia and surrounding regions. Three transmission lines connect Nova Scotia and New Brunswick: one 345 kW and two 138 kW lines. They provide up to 300 MW of transfer capability from New Brunswick to Nova Scotia, and up to 350 MW from Nova Scotia to New Brunswick
111. Beginning in 2011, tie capacity from New
Brunswick to Nova Scotia has reduced from 300 MW to 150 MW due to increasing load in southeastern New Brunswick
112. The Maritime Link project will enable Nova Scotia to be directly
interconnected with Newfoundland. The majority of Nova Scotia’s environmental targets by 2030 will be largely satisfied by the Maritime Link and existing renewable energy projects. However, additional new renewable projects can also potentially help achieve goals. These high fixed cost resources with low variable costs may be able to spread costs for construction and development across a larger set of end-users. In this context, there is also potential for renewable exports into neighboring regions.
111
“10 Year System Outlook 2013 – 2022 Report,” Nova Scotia Power Inc., 32, July 2013, http://oasis.nspower.ca/site/media/oasis/20130702%20NSPI%20to%20UARB%2010%20Year%20System%20Outlook%20Report%20FILED.pdf 112
“NPCC 2013 Maritimes Area Comprehensive Review of Resource Adequacy,” New Brunswick System Operator, Nova Scotia Power Incorporated, Maritime Electric Company Limited, and Northern Maine ISA Inc., 7, September 2013, https://www.npcc.org/Library/Resource%20Adequacy/RCC%20Approved%20%202013%20Maritimes%20Area%20Comprehensive%20Resource%20Adequacy%20report.pdf

Market Trends for the Supply and Demand of Electricity in Nova Scotia
© 2014 67 icfi.ca
Exhibit 50 Map of Nova Scotia and Neighboring Regions
As shown in the map above, New Brunswick is also interconnected with Quebec and Maine. Nova Scotia is part of the Northeast Power Coordinating Council (NPCC) bulk power system without direct transmission lines with Quebec and Maine. New Brunswick, Nova Scotia, Prince Edward Island (PEI), and Northern Maine together form the Maritimes Area, a winter peaking region with separate jurisdictions and regulators.
113 In September 2013, New Brunswick System Operator, Nova Scotia
Power Incorporated, Maritime Electric Company Limited, and Northern Maine ISA, Inc. prepared a comprehensive review of resource adequacy to satisfy compliance requirements established by NPCC in the Maritime Area. Each of the four regions determines required reserves individually. However, resource adequacy is assessed as a group, as the provinces and the state are closely interconnected. Although each system remains under control of its exclusive System Operator, reserve sharing agreements exist and these four systems operate as one area in compliance with NPCC guidelines
114. As a result, the Maritimes Area adopts a required reserve of 20% of firm load.
113
“NPCC 2013 Maritimes Area Comprehensive Review of Resource Adequacy,” New Brunswick System Operator, Nova Scotia Power Incorporated, Maritime Electric Company Limited, and Northern Maine ISA Inc., 1, September 2013, https://www.npcc.org/Library/Resource%20Adequacy/RCC%20Approved%20%202013%20Maritimes%20Area%20Comprehensive%20Resource%20Adequacy%20report.pdf 114
“NPCC 2013 Maritimes Area Comprehensive Review of Resource Adequacy,” New Brunswick System Operator, Nova Scotia Power Incorporated, Maritime Electric Company Limited, and Northern Maine ISA Inc., 3, September 2013, https://www.npcc.org/Library/Resource%20Adequacy/RCC%20Approved%20%202013%20Maritimes%20Area%20Comprehensive%20Resource%20Adequacy%20report.pdf
Market Trends for the Supply and Demand of Electricity in Nova Scotia
© 2014 68 icfi.ca
5.6 Reliability and Resource Adequacy This section provides a snapshot of current state of resource adequacy planning in Nova Scotia, including criteria for operating reserve and planning reserves and the reserve margin contribution of renewables. The discussion is organized in three sub-sections. The first section provides the overview of the concept of resource adequacy in the power sector. The second section provides the overview of currently implemented resource adequacy practices and current state of resource adequacy in Nova Scotia. Long-term resource adequacy outlook for Nova Scotia is presented in the last section.
5.7 What is Resource Adequacy? Resource adequacy is typically defined as the capability of meeting peak demand for electrical power in a defined planning area. An electrical system is assumed to have adequate resources if local planning reserve margin requirement is met. Resource adequacy studies typically include a high level representation of the transmission system, but very granular and probabilistic nature of load and supply resources. Resource adequacy analysis is therefore supplemented by Transmission Security Analysis (TSA), which is also frequently required to assure reliability in planning studies. TSA is especially important for electric zones with heavy reliance on imports and could be major driver in setting local area reserve margin requirements. In situations in which both reliability measures are required for planning purposes, the more stringent scenario produced by either of the two analysis frameworks is used. Loss of Load Expectation (LOLE) is the most commonly utilized baseline metric in resource adequacy studies. LOLE refers to the expected number of days (or hours) for which available capacity is insufficient to serve the peak demand. Historically, the power industry has applied a 1 day in 10 year (1-in-10) LOLE standard when analyzing resource adequacy requirements or the adequate level of reserve margin requirements.
115 1-in-10 typically refers to the resource adequacy
level where electricity demand is curtailed due to lack of resources for 1 day in a 10 year period. Typical resource adequacy studies indicate 1-in-10 LOLE can be achieved by maintaining reserve margins between 10 percent and 20 percent. Ideally, the level of reliability should be set at a point beyond which willingness to pay for electricity services significantly diminishes or no longer exists due to high costs of maintaining reserves.
116
1-in-10 has been assumed for several decades to be the optimal level of reliability (i.e., inflection point for willingness to pay for reliability) and has been used extensively in power sector resource adequacy planning. However, there are recent indications that current resource adequacy practices, namely 1-in-10 LOLE-based planning, are under greater scrutiny by policy makers. As the power industry undergoes rapid structural changes due to developments such as demand side management, new environmental regulations, and changes in generation supply portfolios, resource adequacy planning practices require a concurrent re-evaluation. A more recent alternative to the 1-in-10 reliability criteria would be a planning exercise driven by economic optimization between costs and benefits of reliability. Economic resource adequacy studies would be performed to evaluate the commonly used 1-in-10 metric, calculate economically optimal reliability point and reserve margin requirement.
115
Sener, A. C., Texas’s Energy-Only Resource Adequacy Paradox, The Electricity Journal, May 2013, Vol. 26, Issue 4. 116
NERC 2013 Special Reliability Assessment: Accommodating an Increased Dependence on Natural Gas for Electric Power: Phase II: Vulnerability and Scenario Assessment for the North American Bulk Power System.

Market Trends for the Supply and Demand of Electricity in Nova Scotia
© 2014 69 icfi.ca
5.8 Current State of Resource Adequacy Planning in Nova Scotia Nova Scotia, as part of Maritimes Area, is subject to Northeast Power Coordinating Council (NPCC) rules and regulations. NPCC is one of the eight reliability coordinating councils of the North American Electric Reliability Corporation (NERC). Geographical boundaries of NPCC and other coordinating councils are presented in Exhibit 51. NPCC footprint covers Ontario, Quebec, Maritimes, New York and New England states. NPCC is responsible from development, compliance monitoring and enforcement of regional reliability standards. New Brunswick System Operator (NBSO) is an independent system operator for New Brunswick and also serves as reliability coordinator for the Maritime Provinces. As the New Brunswick government outlined in 2011 in the 10-year plan, NBSO functions including the role of reliability coordinator will be rolled back into New Brunswick Power.
Exhibit 51 Northeast Power Coordinating Council and Other NERC Regions
Source: NERC
Reliability and resource adequacy guidelines for Nova Scotia are specified in the NPCC Regional Reliability Directory #1
117. According to NPCC guidelines the resource adequacy criterion is 0.1 day
of LOLE per year. This LOLE target corresponds to 20% planning reserve margin target for Maritimes and Nova Scotia. Put another way, to comply with the NPCC rules, the total amount of supply resources need to be 20% above Nova Scotia peak load. In addition to planning reserve margin requirement, NPCC reliability rules require that balancing authorities maintain ten-minute and thirty-minute reserves. Amount of required ten-minute reserves is equal to the first contingency loss; and the amount of thirty-minute reserves is equal to 1.5 times the second contingency loss. Operating reserve requirements are shared between Nova Scotia Power and NBSO. Ten-minute contingency requirement is shared based on NSPI’s share of coincident peak demand in the combined NBSO-NSPI system. Note, however, when the largest unit,
117
“NPCC Regional Reliability Reference Directory # 1 Design and Operation of the Bulk Power System”, Northeast Power Coordinating Council, Inc., December 1, 2009, NPCC Regional Reliability Reference Directory # 1 Design and Operation of the Bulk Power System

Market Trends for the Supply and Demand of Electricity in Nova Scotia
© 2014 70 icfi.ca
Point Aconi, is online NSPI maintains ten-minute reserve equal to Point Aconi capacity (171 MW). As a result of reserve sharing agreement NSPI maintains 50 MW thirty-minute reserve
118.
NSPI’s most recent supply/demand balance is presented in Exhibit 52. For the purposes of reserve margin calculations the wind capacity is typically discounted heavily by system planners based on the potential generation at peak. For example of 81 MW of NSPI owned wind only 6 MW is assumed to contribute towards reserve margin. For planning purposes wind resources are categorized under two categories. The first category is “Energy Resource Interconnection Service (ERIS) which is subject to transmission congestion and constraints. Wind plants with ERIS designation do not contribute towards reserve margin. The second category is Network Resource Interconnection Service (NRIS). NRIS designated wind resources contribute 20% of their installed capacity towards reserve margin. Nova Scotia reserve margin for 2013/2014 period is calculated to be approximately 21%. This level is in compliance with the NPCC. Note, however, an actual reserve margin close to planning reserve translates to equilibrium conditions for resource planning. In equilibrium the system needs to add new supply resources to keep up with a demand growth.
Exhibit 52 Nova Scotia Supply/Demand Balance for 2013/2014 (MW)
2013/2014 NSPI Peak Demand 1,984
Demand Side Management 45
Net Peak Demand 1,939
Existing Units Total 2,336
Existing Thermal Units 1,899
Existing Hydro Units 378
Existing Wind Units 6
IPP Capacity (Renewables) 54
New Units Total 5.3
Contracted Wind Units 2
Community Feed-in Tarrif 3.3
Total Available Resources 2,341
Reserve Margin 20.8%
Source: Nova Scotia Power Inc. 10 Year System Outlook, July, 2013
5.9 Resource Adequacy Going Forward This section provides a summary of anticipated resource adequacy challenges in light of expected changes to Nova Scotia’s power supply portfolio. Exhibit 53 provides long-term supply/demand balance outlook for Nova Scotia. For 2014/2015 – 2020/2021 period the supply/demand outlook is based on NSPI’s 10 Year System Outlook. Long-term (2021-2041) outlook is based on extrapolation of 10 year System Outlook. Key observations from outlook can be summarized as below: Near-term (2014-2020) peak demand growth is offset by demand side management. By 2020 demand side resources form 45% of the required reserves. Wind resources do not play key role in achieving resource adequacy targets. Thermal generation remains as key element of resource adequacy throughout the outlook. Maritime link is key in meeting resource adequacy goals in mid-term (2020-2030 period).
118
Nova Scotia Power Inc. 10 Year System Outlook, July 2013.

Market Trends for the Supply and Demand of Electricity in Nova Scotia
© 2014 71 icfi.ca
Exhibit 53 Nova Scotia Long Term Supply/Demand Balance Outlook* (MW)
2014/2015 2019/2020 2030/2031 2040/2041
Peak Demand 2,020 2,133 2,374 2,622
Demand Side Management 70 194 237 262
Net Peak Demand 1,950 1,939 2,137 2,360
Existing Units Total 2,336 2,336 2,336 2,336
Existing Thermal Units 1,899 1,899 1,899 1,899
Existing Hydro Units 378 378 378 378
Existing Wind Units 6 6 6 6
IPP Capacity (Renewables) 54 54 54 54
Mothball Return-to-Service 0 33 33 33
Retirements 0 153 153 153
New Units Total 32 55 55 55
Contracted Wind Units 2 2 2 2
Biomass 0 10 10 10
Community Feed-in Tariff 7 20 20 20
REA Wind Projects 23 23 23 23
Maritime Link Import 0 153 153 153
Required Additional Firm Builds 0 0 140 408
Total Available Resources 2,368 2,424 2,564 2,832
Reserve Margin 21.4% 25.0% 20.0% 20.0%
Source: 2014/2015 -2020/2021 period is based on Nova Scotia Power Inc. 10 Year System Outlook, July, 2013. Post 2020/2021 is based on ICF extrapolation assuming approximately 1%/year growth.
* Consistent with NSPI assumptions, ERIS resources do contribute towards reserve margin contribution.
Integrating Variable Energy Resources: By 2020 renewable energy resources are expected to
supply 40% of Nova Scotia’s electricity supply. Wind resources are expected play a key role in achieving REP targets. To maintain the target reserve margin of 20%, wind penetration needs to be synchronized with penetration of firm supply capacity in the form demand resources or thermal generation. In addition, increasing penetration of wind is likely to increase demand for ancillary services. For example, requirements for regulation reserves and fast ramp-up generation in the form of gas-fired peakers could increase. Put another way, integration of wind resources into NSPI system is likely to require additional gas-fired generation with fast ramp-up capability. In this context, the firm renewable supply via the Maritimes Link will play a significant role in not only meeting renewable energy goals, but also maintaining system stability and partially mitigating demand growth for operating reserves.
Role of Interruptible Resources: Interruptible resource and overall Demand Side Management
is planned to be important part of Nova Scotia’s capacity supply. This trend is consistent with the developments in other North American markets. For example, in ISO New England demand resources reached 10% of the peak demand. Especially in the next decade, Nova Scotia’s peak demand growth is planned to be offset by demand resources. With the increasing penetration of demand resources, classification of resource types and performance monitoring would be key to running a reliable demand side management program. In the long run, it is likely that growth of demand side management in its current form will saturate at approximately 10% of the peak

Market Trends for the Supply and Demand of Electricity in Nova Scotia
© 2014 72 icfi.ca
demand or 50% of reserve requirements due to reliability and resource adequacy constraints. This level too, is consistent with observations from other North American markets.
Increasing Role of Transmission: Transmission imports are expected to be critical element of
Nova Scotia’s supply mix in the future. By the time of its commencement, the Maritime Link is expected to meet approximately 7% of peak demand. There is potential for further expansion of the Maritime Link to even meet greater portion of Nova Scotia demand. Note, however, in case of further expansion, Maritime Link capacity would exceed Point Aconi capacity (171 MW) and would change the first contingency definition for Nova Scotia. This would translate to larger 10-minute and spinning reserve requirement for the system.
Potential Retirements: Both environmental regulations and REP create pressure for thermal
unit (coal especially) retirements. Note, however, thermal unit retirements are constrained on the other end by resource adequacy and operating reserve requirements. Current outlook signals increasing reliance on demand resources and imports. For example, demand resources and firm imports will meet 17% of peak demand by 2020/2021. This compares with 3% in 2014/2015. The current supply outlook indicates approximately 150 MW of thermal retirement by the 2017/2018 period. While this retirement outlook does not create any resource adequacy issues because of the increasing share of demand resources and the Maritime Link, additional retirements without thermal replacement could create stress on the system in the form of resource inadequacy or tight operating reserve conditions. Going forward, it could be possible to meet resource adequacy targets and comply with the environmental policy goals through seasonal mothballs.
Increasing Peakiness of the System: Current projections (See Exhibit 1) indicate increasing
spread between peak demand and energy demand growth. It is likely that increasing peakiness of the system is likely to require additional intermediate/peak load resources in the form of demand resources or oil/gas-fired units. Combined with the increasing need for operating reserves, the future need for flexible resources is likely increase.
Generation Profiles of Variable Energy Resources: Increasing penetration of non-
dispatchable resources is likely to bring attention to generation profiles (seasonal/daily cycles of these resources) and how they match with Nova Scotia load shapes. Two potential concerns going forward due to increasing share of non-dispatchable resources in energy mix are:
As the spread between winter and summer peak demand increases, the system’s ability to
match seasonal load profile with non-dispatchable resources would be constrained. This may lead to seasonal mothballing of thermal resources.
Historically, spring months could be characterized as low demand and high hydro generation season. In this period, therefore, non-dispatchable generation could be constrained by low demand for additional resources. This situation could potentially lead to curtailments in absence of an export opportunity.
5.10 In Summary
Recent changes in regulations affecting the Nova Scotia power sector have and will continue to have the effect of increasing the role of variable energy resources and demand side resources. These regulations and the impacts of these regulations will require changes in the operation of the existing fleet in Nova Scotia going forward as well. Further changes in historically conventional resource adequacy mechanisms will be required. Under conventional utility resource adequacy planning, the majority of planned resources contributed to reserve margin without any significant discounts and demand side management played a limited role. Going forward, the power sector operations and planning within Nova Scotia will need to account for different types of demand resources, retirement pressures on existing thermal fleet, Renewable Electricity Plan (REP) driven renewables penetration and increasing integration with other balancing areas.

Market Trends for the Supply and Demand of Electricity in Nova Scotia
© 2014 73 icfi.ca
6 Environmental Considerations (2014-2040) Nova Scotia’s current electricity supply mix will change dramatically over the next 25 years due to the refurbishment and replacement of the existing fleet, and in response to recent provincial and federal environmental regulations aimed specifically at the electricity generating sector. At the federal level, the electricity sector in Canada has been a center of attention for environmental regulation development over the past three years, from the recently Reduction of Carbon Dioxide Emissions from Coal-fired Generation of Electricity Regulations
119 (Coal Regulation) recently
published in Canada Gazette II, to the evolving Base Level Emission Requirements (BLIERs) aimed at criteria air contaminants, and the potential carbon dioxide regulations aimed at the performance of new natural-gas-fired electricity-generating stations. The finalization and publication of the Coal Regulation has put in place a plan to phase out coal-fired power generation (unless carbon capture and storage is installed). Prior to the release of the Federal Coal Regulation, Nova Scotia pioneered a commitment and a regulation to reduce GHG emissions (reducing 25% of GHG emissions in the electricity sector by 2020) in the Province as part of a larger strategy to transform the electricity sector from one largely based on coal, to one using cleaner energy sources. In response to the Coal Regulation, Nova Scotia was successful in gaining recognition for the provincial strategy and Environment Canada and the Province have published a an equivalency agreement that would allow the province’s GHG regulations to apply in Nova Scotia instead of the federal coal regulation. The equivalency agreement commits to Nova Scotia’s current Greenhouse Gas (GHG) regulations until 2020 and further reductions by 2030; specifically these include clearly defined mandatory caps or limits on greenhouse gas emissions for electricity producers. In September 2013, Nova Scotia amended its GHG regulations for the electricity sector to include caps out to 2030. The equivalency agreement commits the federal government to issuing an Order in Council to stand down the application of the Coal Regulation in Nova Scotia, because the Nova Scotia regulations are recognized to result in an equivalent environmental outcome. The Nova Scotia regulatory approach provides the electricity sector with the flexibility to meet defined environmental outcomes in the most economically and operationally optimized manner. This flexibility is important in Nova Scotia to meet regulation aimed at GHG emissions as well as existing and evolving regulations aimed at air quality emissions (SO2, NOx, and Hg) and targets for renewable energy generation. Nova Scotia now needs to implement firm plans to ensure the explicit targets are met while fulfilling the Department of Energy’s mandate “to manage and promote energy resources to achieve optimum economic, social and environmental value from the energy sector”. The review of the province’s electricity future (as defined within the Electricity Reform Act) and must consider these firm compliance-caliber environmental commitments. It is important to note for both GHG emissions and the pending air quality requirements, that hard annual caps are defined in 2020, 2025 and 2030 and multiyear compliance periods between (GHG only: 2014-2016, 2017-2019 and GHG and Air quality: 2021-2024, and 2026-2029). Additionally, the pending air quality requirements include maximum provincial (NOx and SO2) and unit level caps (SO2). The structure of the system-wide compliance targets along with the multiyear compliance targets affords Nova Scotia year-on-year operational flexibility to meet environmental outcomes in a nimble and cost effective manner. The upcoming Maritime Link and the lower dispatch rates of conventional fossil fired units are key events as the Province transforms away from coal. Introducing a multiyear compliance period approach for air pollutants in the 2015 to 2020 period could be a valuable instrument in achieving the near term environmental outcomes in a cost effective manner.
119
Reduction of Carbon Dioxide Emissions from Coal-fired Generation of Electricity Regulations. http://gazette.gc.ca/rp-pr/p2/2012/2012-09-12/html/sor-dors-eng.html

Market Trends for the Supply and Demand of Electricity in Nova Scotia
© 2014 74 icfi.ca
The objective of this chapter is to present the effects of environmental regulation, constraints and considerations on the choices of supply out to 2040.
6.1 Key Environmental Considerations Nova Scotia’s current coal-centric supply mix will change dramatically over the next 25 years due to natural attrition (vintage) and in order to meet a number of environmental constraints including: Greenhouse Gas Regulations aimed at Nova Scotia’s Electricity Generating Sector; Nova Scotia’s Air Quality Regulations; and, Nova Scotia’s Renewable Energy Plan. Each is presented and discussed in the sub-sections that follow.
6.1.1 Greenhouse Gas Regulations aimed at Nova Scotia’s Electricity
Generating Sector Greenhouse Gas (GHG) Emissions Regulations made under subsection 28(6) and Section 112 of the Environment Act S.N.S. 1994-95, c. 1 O.I.C. 2009-341 (August 14, 2009), N.S. Reg. 260/2009 as amended to O.I.C. 2013-332 (September 10, 2013), N.S. Reg. 305/2013 – define a GHG target of 7.5 MTCO2e for the electricity generating sector in 2020 and 4.5 MT in 2030
120. The Nova Scotia
GHG regulations are a condition of the equivalency agreement between Nova Scotia and the federal government regarding the federal coal regulation. The Exhibit below provides one possible trajectory to meet of GHG emissions targets; it is not intended to depict the multiyear compliance flexibility options. The Exhibit also assumes that future regulations are not passed with targets past 2030. Exhibit 54 Greenhouse Gas Emission Limits (in Million tonnes of CO2) of Nova Scotia’s Electricity
Generating Sector
120
Nova Scotia’s Greenhouse Gas Emissions Regulations. http://www.gov.ns.ca/just/regulations/regs/envgreenhouse.htm
0
2
4
6
8
10
12
2010 2012 2014 2016 2018 2020 2022 2024 2026 2028 2030 2032 2034 2036 2038 2040
Mill
ion
To
nn
es
of
CO
2

Market Trends for the Supply and Demand of Electricity in Nova Scotia
© 2014 75 icfi.ca
6.1.2 Nova Scotia’s Air Quality Regulations Air Quality Regulations made under Section 112 of the Environment Act S.N.S. 1994-95, c. 1 O.I.C. 2005-87 (February 25, 2005, effective March 1, 2005), N.S. Reg. 28/2005 as amended up to O.I.C. 2010-444 (December 7, 2010), N.S. Reg. 187/2010 – specify caps for nitrogen dioxide (NOx), sulphur dioxide (SO2), and mercury (Hg) through 2020
121.
Post 2020 the pending approach for NOx and SO2
122 defines annual facility and sectorial emissions
limits for 2025, multiyear targets for periods 2021-2024 and 2026-2029, and annual facility and sectorial emissions limits for 2030 and beyond. For mercury 2030 and onward emissions cannot exceed 30 kg/annum. The Exhibits below provide the overall trajectory of emissions targets; it is not intended to depict the multiyear compliance flexibility options. Exhibit 55 Sulphur Dioxide (SO2) and Nitrogen Dioxide (NOx) Limits (in tonnes) as Defined under
Nova Scotia’s Air Quality Regulations
121
Nova Scotia’s Air Quality Regulations. http://www.gov.ns.ca/just/regulations/regs/envairqt.htm 122
Nova Scotia’s Amendments to Greenhouse Gas & Air Quality Emissions Regualtions, Nova Scotia Environment. May 2013.
-
10,000
20,000
30,000
40,000
50,000
60,000
70,000
2015201720192021202320252027202920312033203520372039
Ton
ne
s o
f SO
2 a
nd
NO
x
SO2 (kt)
NOx (kt)

Market Trends for the Supply and Demand of Electricity in Nova Scotia
© 2014 76 icfi.ca
Exhibit 56 Mercury (in kg of Hg) Limits as Defined under Nova Scotia’s Air Quality Regulations
*2015-2019 limits are based on 65kg limit less supplemental emissions from 2010 through 2014 (per Nova Scotia Power, IRP Technical Conference – Assumptions Discussion, March 7, 2014)
6.1.3 Nova Scotia’s Renewable Energy Plan Nova Scotia’s Renewable Electricity Plan (2010)
123 defines a commitment to increase renewable
electricity to 25 per cent by 2015 and 40 per cent by 2020. The Renewable Energy Standard (RES) eligible generation is in addition to the Community Feed–In Tariff projects that support the use of locally-based renewable electricity projects and a net-metering program.
123
Nova Scotia’s Renewable Electricity Regulations http://www.novascotia.ca/just/regulations/regs/elecrenew.htm
0
10
20
30
40
50
60
702
01
5
20
16
20
17
20
18
20
19
20
20
20
21
20
22
20
23
20
24
20
25
20
26
20
27
20
28
20
29
20
30
20
31
20
32
20
33
20
34
20
35
20
36
20
37
20
38
20
39
20
40
Kg
of
Hg

Market Trends for the Supply and Demand of Electricity in Nova Scotia
© 2014 77 icfi.ca
Exhibit 57 Renewable Energy Plan Requirement (% of net sales)
In addition there are potential environmental constraints that could impact Nova Scotia’s electricity sector including: Federally driven Carbon Dioxide Emissions targets (likely performance based – TCO2/MWh)
aimed at the oil and natural-gas-fired electricity generating stations (potentially including cogeneration stations) have been discussed but not yet defined.
No guidance on post 2030 SO2, NOx and Hg emission targets – the 2030 timeframe targets are defined within Provincial amendments to Greenhouse Gas & Air Quality (SO2, NOx, and Hg) Emissions Regulations – draft for discussion released and comments submitted in July 2013.
Post 2030 (2031-2040) targets/limits for GHG emissions have not been defined.
6.2 Supply-and Demand Side Summary
6.2.1 Forecast State of Supply – 2020, 2030, and 2040 To meet environmental regulations and targets, Nova Scotia’s electricity supply mix will change from the current coal-centric system over the next 25 years. The following summarizes basic analysis aimed at defining the forward supply mix in relation to the aforementioned environmental constraints. Upon finalization of the equivalency agreement and the federal government issuing of an Order in Council that stands down the application of the federal coal regulation in Nova Scotia, Nova Scotia’s coal fired generating stations will not be required to conform to the Federal Government’s Coal Regulation. The federal coal regulation requires each facility to meet an annual emissions performance target of 0.42 tonnes of CO2/MWh at 50 years of age. Instead, Nova Scotia’s regulatory approach provides electricity-sector emitters with the flexibility to meet emissions caps (single year or multiyear) through 2030 in whatever ways are most cost effective. However Nova Scotia’s coal fired fleet is aging (8 coal fired units vary in vintage from 1969 to 1994), and it is our assumption that these units will require significant investment (retrofit, refurbishment) or retirement at 60 years of age (50 years of full capacity plus 10 final years of reduced capacity). As such, we anticipate important decisions (invest or retire) that will impact Nova Scotia’s current generating capacity of 1,250 MW in the 2020 timeframe (one unit) and by 2040 approximately 700 MW of capacity.
0
5
10
15
20
25
30
35
40
45
2014 2015 2016 2017 2018 2019 2020
% o
f N
et
Sale
s

Market Trends for the Supply and Demand of Electricity in Nova Scotia
© 2014 78 icfi.ca
Exhibit 58 Nova Scotia’s Coal Fired Capacity and Generation Outlook
Year Coal Capacity (MW) – Investment or Retirement
Coal Capacity (MW) – Remaining Existing
Coal Generation Range (GWh)
2020 150 – 200 1050 – 1100 6,300 – 7,300
2030 250 – 400 850 – 900 5,400 – 6,200
2040 700 550 3,600 – 4,200
Similarly Nova Scotia’s Tufts Cove facility is made up of 6 units totaling 470MW of capacity that vary in vintage from 1965 to 2012. With the assumption that these units will retire at 60 years of age (50 years of full capacity plus 10 final years of reduced capacity) we begin to see capacity investment of retirement decisions required in the 2025 timeframe (one unit) and by 2040 all but 150 MW of existing capacity.
Exhibit 59 Tufts Cove Generating Station Capacity and Generation Outlook
Year Tuft’s Cove Capacity (MW) –Investment or Retirement
Tufts Capacity (MW) –Remaining Existing
Tufts Generation Range (GWh)
2020 0 470 1,800 – 2,500
2030 70 – 90 380 – 400 1,500 – 2,000
2040 320 150 580 – 780
Domestic (Nova Scotia) renewable generation will increase dramatically over the next 25 years in response to incentives and as technology costs decline. The increase will be predominantly in response to wind generation incentives; however both tidal power and biomass fired facilities could contribute significantly as discussed in the companion document “Emerging Electricity Technologies in Nova Scotia”. It is important to note that the wind potential in Nova Scotia is likely higher that the capacity range defined herein as load variability may become a constraint. It is expected that hydroelectric generation will not change materially from current generation.
Exhibit 60 Nova Scotia’s Wind Capacity and Generation Outlook
Year Wind Capacity (MW) Wind Generation Range (GWh)
2020 560 – 600 1,700 – 2,000
2030 560 – 650 1,700 – 2,150
2040 560 – 700 1,700 – 2,350
Exhibit 61 Nova Scotia’s Tidal Capacity and Generation Outlook
Year Tidal Capacity (MW) Tidal Generation Range (GWh)
2020 20 - 30 25 – 90
2030 30 – 100 40 – 300
2040 50 – 300 65 – 900

Market Trends for the Supply and Demand of Electricity in Nova Scotia
© 2014 79 icfi.ca
Exhibit 62 Nova Scotia’s Biomass Fired Capacity and Generation Outlook
Year Biomass Capacity (MW) Biomass Generation Range (GWh)
2020 / 2030 / 2040 60 – 90 300 – 630
Exhibit 63 Nova Scotia’s Hydroelectric Capacity and Generation Outlook
Year Hydroelectric Capacity (MW) Hydroelectric Generation Range (GWh)
2020 / 2030 / 2040 377 900 – 1,100
Import of electricity has historically been modest in Nova Scotia. However, with the construction of the Maritime Link, imported electricity will increase and become critical to meeting forward demand and environmental constraints. While it is clear that the Maritime Link will provide the access/option to significantly increase supply, the cost of the incremental import (beyond base contracted) is unclear and how much import will be required is dependent on a varying demand forecast. The SUPPLEMENTAL Import represents a negotiated import block during off peak (nights 2300 to 0700 hours) November through March for the first 5 years (2017-18 to 2021-22) estimated at 240 GWh of output per year.
Exhibit 64 Nova Scotia’s Maritime Link (ML) Import Capacity and Generation Outlook
Year BASE Imports (MWh)
SUPPLEMENTAL Imports (MWh)
FREE MARKET Imports (MWh)
TOTAL Imports (MWh)
2020 850 – 1,100 240 0 1,100 – 1,340
2030 850 – 1,100 0 370 – 2,000 1,220 – 3,100
2040 850 – 1,100 0 370 – 2,000 1,220 – 3,100
The exhibit below represents the minimum of the electricity generation range considered in this analysis of environmental considerations. A minimum potential of slightly over 12,000 GWh in 2020 falling to 8,400 GWh in 2040 predominantly attributed to a significant decline in generation at the coal fired facilities and Tufts Cove. 2010 vintage data represents actual electricity generation.

Market Trends for the Supply and Demand of Electricity in Nova Scotia
© 2014 80 icfi.ca
Exhibit 65 Nova Scotia’s Generation Outlook – Minimum Potential
A maximum generation potential scenario is provided below. At 14,800 GWh in 2020, peaking in 2030 at 15,500 GWh and falling to slightly below 13,000 GWh in 2040. The impact of the high import scenario can be seen with a significant import of 3 TWh of imported power (Base and Incremental) from current (2010 vintage data represents actual electricity generation).
Exhibit 66 Nova Scotia’s Generation Outlook – Maximum Potential
-
2,000,000
4,000,000
6,000,000
8,000,000
10,000,000
12,000,000
14,000,000
2010 2020 2030 2040
An
nu
al G
en
era
tio
n (
MW
h)
Wind (CommFIT)
Wind
Tidal
Biomass
Hydroelectric
Import (Incremental)
Import (Base)
Tufts
Coal
-
2,000,000
4,000,000
6,000,000
8,000,000
10,000,000
12,000,000
14,000,000
16,000,000
18,000,000
2010 2020 2030 2040
An
nu
al G
en
era
tio
n (
MW
h)
Wind (CommFIT)
Wind
Tidal
Biomass
Hydroelectric
Import (Incremental)
Import (Base)
Tufts
Coal
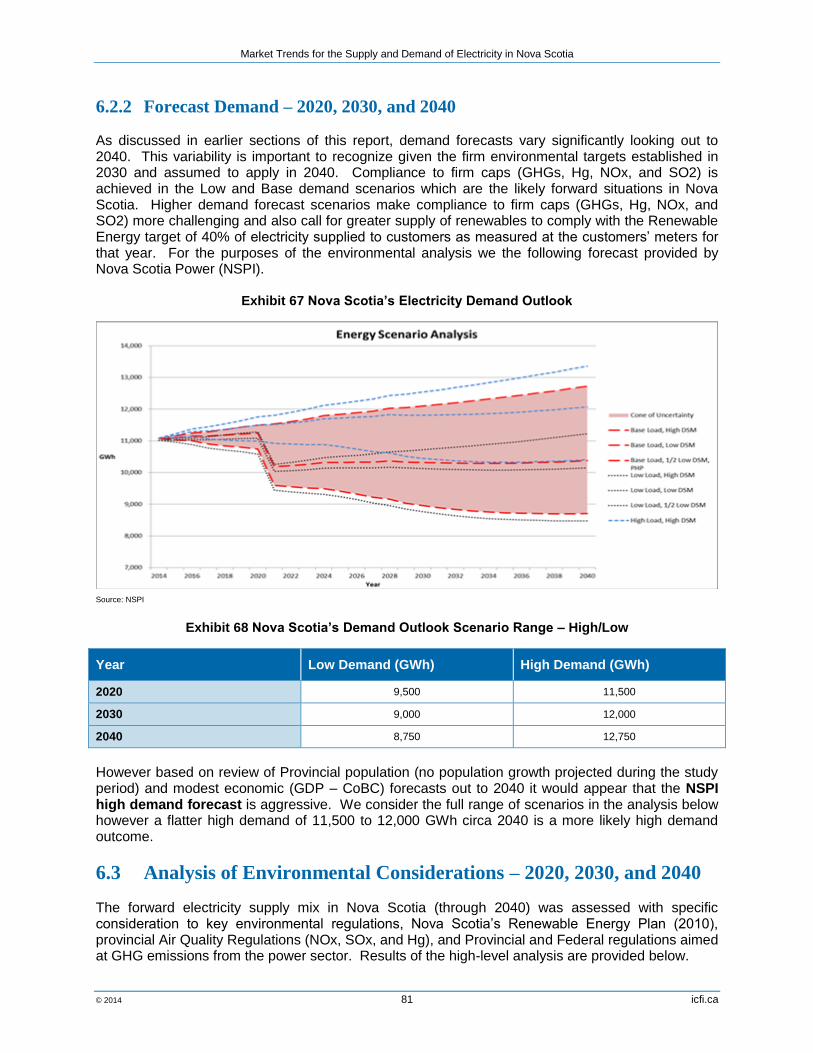
Market Trends for the Supply and Demand of Electricity in Nova Scotia
© 2014 81 icfi.ca
6.2.2 Forecast Demand – 2020, 2030, and 2040 As discussed in earlier sections of this report, demand forecasts vary significantly looking out to 2040. This variability is important to recognize given the firm environmental targets established in 2030 and assumed to apply in 2040. Compliance to firm caps (GHGs, Hg, NOx, and SO2) is achieved in the Low and Base demand scenarios which are the likely forward situations in Nova Scotia. Higher demand forecast scenarios make compliance to firm caps (GHGs, Hg, NOx, and SO2) more challenging and also call for greater supply of renewables to comply with the Renewable Energy target of 40% of electricity supplied to customers as measured at the customers’ meters for that year. For the purposes of the environmental analysis we the following forecast provided by Nova Scotia Power (NSPI).
Exhibit 67 Nova Scotia’s Electricity Demand Outlook
Source: NSPI
Exhibit 68 Nova Scotia’s Demand Outlook Scenario Range – High/Low
Year Low Demand (GWh) High Demand (GWh)
2020 9,500 11,500
2030 9,000 12,000
2040 8,750 12,750
However based on review of Provincial population (no population growth projected during the study period) and modest economic (GDP – CoBC) forecasts out to 2040 it would appear that the NSPI high demand forecast is aggressive. We consider the full range of scenarios in the analysis below however a flatter high demand of 11,500 to 12,000 GWh circa 2040 is a more likely high demand outcome.
6.3 Analysis of Environmental Considerations – 2020, 2030, and 2040 The forward electricity supply mix in Nova Scotia (through 2040) was assessed with specific consideration to key environmental regulations, Nova Scotia’s Renewable Energy Plan (2010), provincial Air Quality Regulations (NOx, SOx, and Hg), and Provincial and Federal regulations aimed at GHG emissions from the power sector. Results of the high-level analysis are provided below.
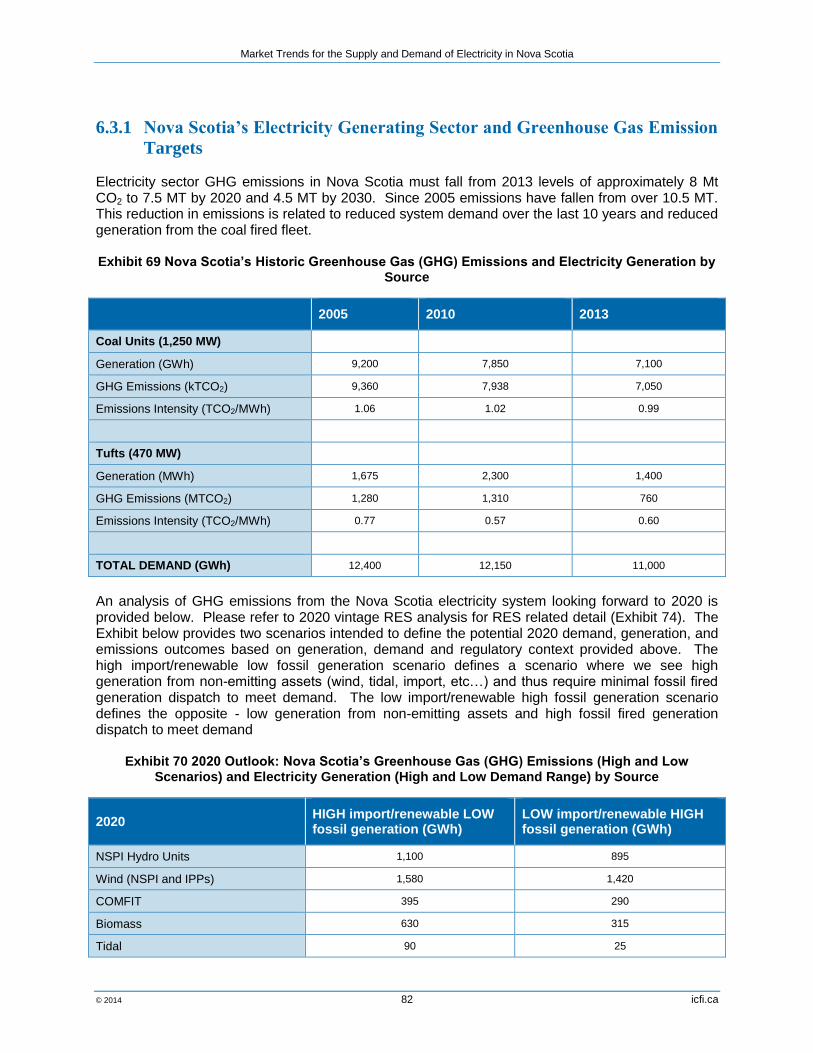
Market Trends for the Supply and Demand of Electricity in Nova Scotia
© 2014 82 icfi.ca
6.3.1 Nova Scotia’s Electricity Generating Sector and Greenhouse Gas Emission
Targets Electricity sector GHG emissions in Nova Scotia must fall from 2013 levels of approximately 8 Mt CO2 to 7.5 MT by 2020 and 4.5 MT by 2030. Since 2005 emissions have fallen from over 10.5 MT. This reduction in emissions is related to reduced system demand over the last 10 years and reduced generation from the coal fired fleet. Exhibit 69 Nova Scotia’s Historic Greenhouse Gas (GHG) Emissions and Electricity Generation by
Source
2005 2010 2013
Coal Units (1,250 MW)
Generation (GWh) 9,200 7,850 7,100
GHG Emissions (kTCO2) 9,360 7,938 7,050
Emissions Intensity (TCO2/MWh) 1.06 1.02 0.99
Tufts (470 MW)
Generation (MWh) 1,675 2,300 1,400
GHG Emissions (MTCO2) 1,280 1,310 760
Emissions Intensity (TCO2/MWh) 0.77 0.57 0.60
TOTAL DEMAND (GWh) 12,400 12,150 11,000
An analysis of GHG emissions from the Nova Scotia electricity system looking forward to 2020 is provided below. Please refer to 2020 vintage RES analysis for RES related detail (Exhibit 74). The Exhibit below provides two scenarios intended to define the potential 2020 demand, generation, and emissions outcomes based on generation, demand and regulatory context provided above. The high import/renewable low fossil generation scenario defines a scenario where we see high generation from non-emitting assets (wind, tidal, import, etc…) and thus require minimal fossil fired generation dispatch to meet demand. The low import/renewable high fossil generation scenario defines the opposite - low generation from non-emitting assets and high fossil fired generation dispatch to meet demand
Exhibit 70 2020 Outlook: Nova Scotia’s Greenhouse Gas (GHG) Emissions (High and Low Scenarios) and Electricity Generation (High and Low Demand Range) by Source
2020 HIGH import/renewable LOW fossil generation (GWh)
LOW import/renewable HIGH fossil generation (GWh)
NSPI Hydro Units 1,100 895
Wind (NSPI and IPPs) 1,580 1,420
COMFIT 395 290
Biomass 630 315
Tidal 90 25

Market Trends for the Supply and Demand of Electricity in Nova Scotia
© 2014 83 icfi.ca
Import (Base) 1,100 845
Import (Supplemental – 2017-2022) 240 240
TOTAL (non-emitting generation) 5,115 4,030
LOW DEMAND FORECAST 9,500 9,500
Fossil Generation Requirement 4,385 5,470
GHG Emissions Target 7,500 kTCO2 7,500 kTCO2
TARGET GHG Intensity Requirement of Fossil Fleet
1.71 TCO2/MWh 1.37 TCO2/MWh
HIGH DEMAND FORECAST 11,250 11,250
Fossil Generation Requirement 6,135 7,220
GHG Emissions Target 7,500 kTCO2 7,500 kTCO2
TARGET GHG Intensity Requirement of Fossil Fleet
1.22 TCO2/MWh 1.04 TCO2/MWh
Under either demand / generation scenario, Nova Scotia will comply with the 2020 target of 7.5 MT CO2e based on the expected import capacity (Maritime Link), existing and firm expected renewables, and existing fleet of coal, gas and oil fired units. On a GHG intensity basis, the fossil fired fleet could meet the 2020 emissions target with the coal fleet alone even under an NSPI high demand and low import / renewables scenario. Emissions will be significantly below this target however as lower GHG intensity Tufts Cove generating station is expected to be dispatched per historic trend in the 2020 timeframe. Ample fossil capacity will remain to meet demand even with the idling of 150 MW of coal capacity pre-2020. In 2030, the GHG emissions target drops significantly to 4.5 MT CO2. Under an NSPI low electricity demand scenario, Nova Scotia would be able to meet the target of 4.5MT CO2e in 2030 with the expected import capacity (Maritime Link), existing and firm expected renewables, and existing fleet of coal, gas and oil fired units, and continue to keep emissions at or below 4.5 MT out to 2040. As discussed, we see the NSPI high range demand scenario as aggressive, and actual demand will be more likely to reflect the low demand scenario. However, were demand to approach 12,750 GWh in 2040 the GHG intensity of Nova Scotia’s fossil fired generation (required to meet demand after non-emitting sources and imports have been exhausted) would need to drop to a low of 0.57 TCO2/MWh in 2030 and 0.53 TCO2/MWh in 2040. This is well above the emissions intensity of new natural-gas-fired generating capacity but well below that of the existing coal units.
Exhibit 71 2030 and 2040 Outlook: Nova Scotia’s Greenhouse Gas (GHG) Emissions (High and Low Scenarios) and Electricity Generation (High and Low Demand Range) by Source
2030: GHG Emissions and generation (GWh)
2040: GHG Emissions and generation (GWh)
NSPI Hydro Units 895 – 1,100 895 – 1,100
Wind (NSPI and IPPs) 1,420 - 1,750 1,420 – 1,925
COMFIT 290 – 395 290 – 395
Biomass 315 – 630 315 – 630
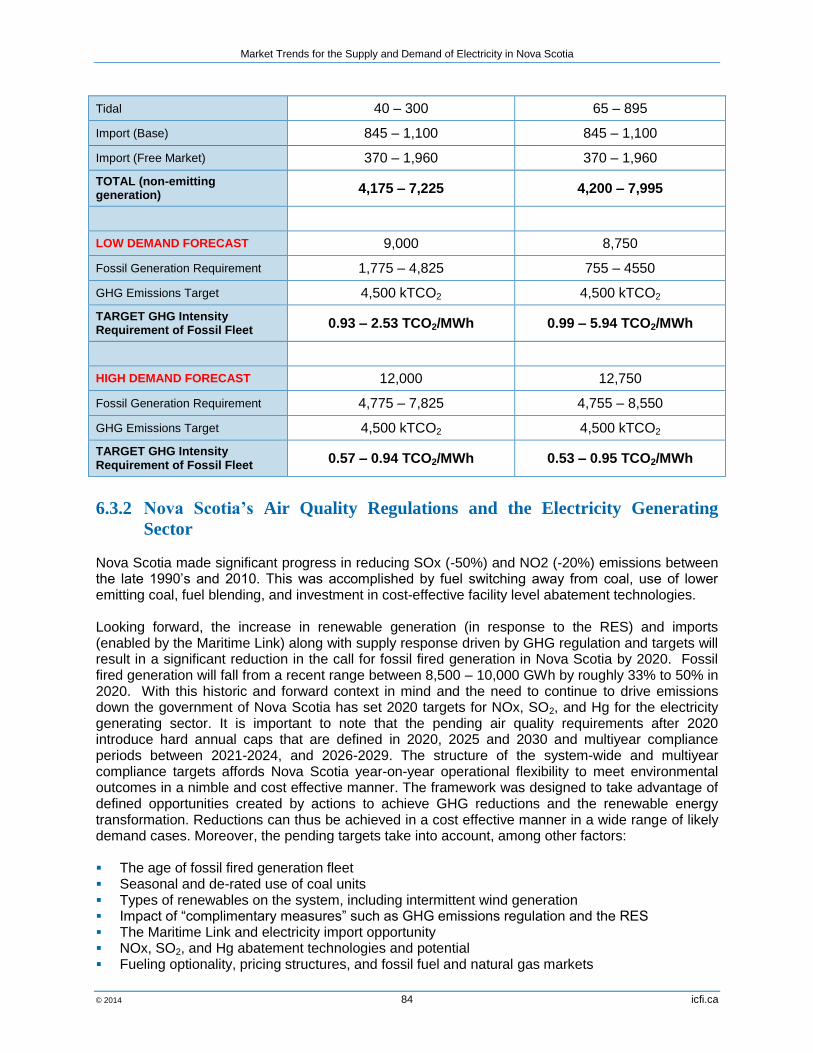
Market Trends for the Supply and Demand of Electricity in Nova Scotia
© 2014 84 icfi.ca
Tidal 40 – 300 65 – 895
Import (Base) 845 – 1,100 845 – 1,100
Import (Free Market) 370 – 1,960 370 – 1,960
TOTAL (non-emitting generation)
4,175 – 7,225 4,200 – 7,995
LOW DEMAND FORECAST 9,000 8,750
Fossil Generation Requirement 1,775 – 4,825 755 – 4550
GHG Emissions Target 4,500 kTCO2 4,500 kTCO2
TARGET GHG Intensity Requirement of Fossil Fleet
0.93 – 2.53 TCO2/MWh 0.99 – 5.94 TCO2/MWh
HIGH DEMAND FORECAST 12,000 12,750
Fossil Generation Requirement 4,775 – 7,825 4,755 – 8,550
GHG Emissions Target 4,500 kTCO2 4,500 kTCO2
TARGET GHG Intensity Requirement of Fossil Fleet
0.57 – 0.94 TCO2/MWh 0.53 – 0.95 TCO2/MWh
6.3.2 Nova Scotia’s Air Quality Regulations and the Electricity Generating
Sector Nova Scotia made significant progress in reducing SOx (-50%) and NO2 (-20%) emissions between the late 1990’s and 2010. This was accomplished by fuel switching away from coal, use of lower emitting coal, fuel blending, and investment in cost-effective facility level abatement technologies. Looking forward, the increase in renewable generation (in response to the RES) and imports (enabled by the Maritime Link) along with supply response driven by GHG regulation and targets will result in a significant reduction in the call for fossil fired generation in Nova Scotia by 2020. Fossil fired generation will fall from a recent range between 8,500 – 10,000 GWh by roughly 33% to 50% in 2020. With this historic and forward context in mind and the need to continue to drive emissions down the government of Nova Scotia has set 2020 targets for NOx, SO2, and Hg for the electricity generating sector. It is important to note that the pending air quality requirements after 2020 introduce hard annual caps that are defined in 2020, 2025 and 2030 and multiyear compliance periods between 2021-2024, and 2026-2029. The structure of the system-wide and multiyear compliance targets affords Nova Scotia year-on-year operational flexibility to meet environmental outcomes in a nimble and cost effective manner. The framework was designed to take advantage of defined opportunities created by actions to achieve GHG reductions and the renewable energy transformation. Reductions can thus be achieved in a cost effective manner in a wide range of likely demand cases. Moreover, the pending targets take into account, among other factors: The age of fossil fired generation fleet Seasonal and de-rated use of coal units Types of renewables on the system, including intermittent wind generation Impact of “complimentary measures” such as GHG emissions regulation and the RES The Maritime Link and electricity import opportunity NOx, SO2, and Hg abatement technologies and potential Fueling optionality, pricing structures, and fossil fuel and natural gas markets

Market Trends for the Supply and Demand of Electricity in Nova Scotia
© 2014 85 icfi.ca
Opportunities for natural gas and opportunities of solid fuel blending Impact on the economy and cost related outcomes on the rate payer Environmental outcomes for the protection of the environment and human health Cross jurisdictional approaches and reduction measures Environment Canada commitments to achieving base level reductions on criteria air pollutants
through standards (BLIERs) in the electricity sector Much like the GHG regulation and Equivalency Agreement the government designed a system with hard caps and flexibility mechanisms aimed at achieving the environmental outcomes in cost effective manner. The following temporal flexibility mechanisms were incorporated: Annual facility level emission thresholds Annual sector level emission thresholds Multi-year facility level emission thresholds Multi-year sector level emission thresholds. The compliance period flexibility will allow the operator to manage compliance and operations while considering: All provincial generating assets (emitting and non-emitting) – demand, timing and length of use,
operating capacity, location, age, reliability, etc. Move emission around the province, rather than a single unit restriction, to ensure cost effective
decisions Coal and petcoke prices and blending opportunities Other fossil fuel prices (oil and gas) Abatement technology options. Prior to 2020, air quality targets are fleet level yearly caps that remain constant over a five year period. Introduction of the multi-year compliance period approach over the 2015 to 2020 time period would be valuable to provide additional flexibility while still meeting equal environmental outcomes by taking advantage of the opportunity created by “complimentary measures” and the Maritime Link.. Compliance with 2020 vintage SO2 and NOx reduction requirements are influenced by the transition away from coal to meet renewable and GHG targets, changing fuel blends (for SO2), flexibility in fuel choices to manage emissions and cost of fuel/power. Based on a high-level review of historic NOx, SO2, and Hg emissions data taken from Environment Canada’s National Pollutant Release Inventory (http://www.ec.gc.ca/inrp-npri/), in our estimation and not through detailed modeling or analysis nor accounting for any of the flexibility measures: The 2020 NOx target of 14,955 t should be achieved based on current emissions intensity and
expected thermal generation. The 2020 SO2 target of 36,250 t should be achieved in the NSPI low demand scenario. In the
NSPI high demand scenario the SO2 target will be challenging to conform assuming increased coal fired generation (vs the low demand scenario). However, as discussed we see the NSPI high range demand scenario as very aggressive and actual demand reflecting the low demand scenario above. In addition it appears the government is amenable to the inclusion of the flexibility of multi-year emissions targets in the pre-2020 vintage – this would allow for more operational optionality in meeting compliance targets.
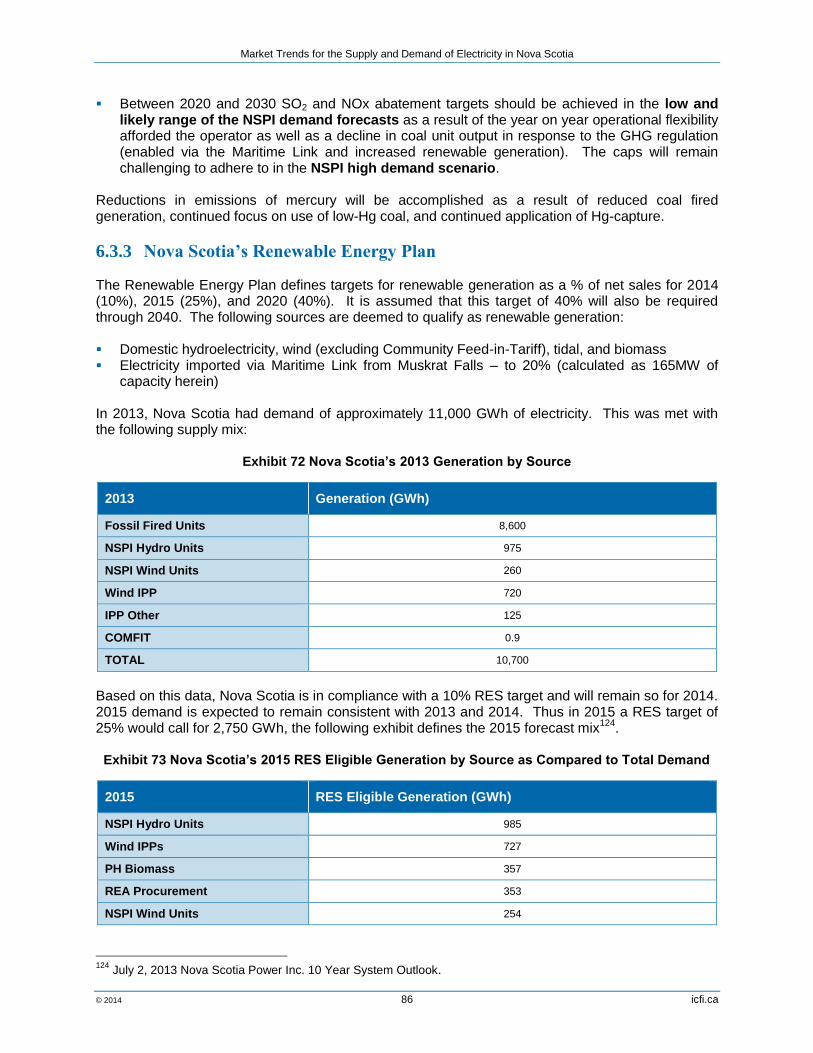
Market Trends for the Supply and Demand of Electricity in Nova Scotia
© 2014 86 icfi.ca
Between 2020 and 2030 SO2 and NOx abatement targets should be achieved in the low and likely range of the NSPI demand forecasts as a result of the year on year operational flexibility afforded the operator as well as a decline in coal unit output in response to the GHG regulation (enabled via the Maritime Link and increased renewable generation). The caps will remain challenging to adhere to in the NSPI high demand scenario.
Reductions in emissions of mercury will be accomplished as a result of reduced coal fired generation, continued focus on use of low-Hg coal, and continued application of Hg-capture.
6.3.3 Nova Scotia’s Renewable Energy Plan The Renewable Energy Plan defines targets for renewable generation as a % of net sales for 2014 (10%), 2015 (25%), and 2020 (40%). It is assumed that this target of 40% will also be required through 2040. The following sources are deemed to qualify as renewable generation: Domestic hydroelectricity, wind (excluding Community Feed-in-Tariff), tidal, and biomass Electricity imported via Maritime Link from Muskrat Falls – to 20% (calculated as 165MW of
capacity herein) In 2013, Nova Scotia had demand of approximately 11,000 GWh of electricity. This was met with the following supply mix:
Exhibit 72 Nova Scotia’s 2013 Generation by Source
2013 Generation (GWh)
Fossil Fired Units 8,600
NSPI Hydro Units 975
NSPI Wind Units 260
Wind IPP 720
IPP Other 125
COMFIT 0.9
TOTAL 10,700
Based on this data, Nova Scotia is in compliance with a 10% RES target and will remain so for 2014. 2015 demand is expected to remain consistent with 2013 and 2014. Thus in 2015 a RES target of 25% would call for 2,750 GWh, the following exhibit defines the 2015 forecast mix
124.
Exhibit 73 Nova Scotia’s 2015 RES Eligible Generation by Source as Compared to Total Demand
2015 RES Eligible Generation (GWh)
NSPI Hydro Units 985
Wind IPPs 727
PH Biomass 357
REA Procurement 353
NSPI Wind Units 254
124
July 2, 2013 Nova Scotia Power Inc. 10 Year System Outlook.
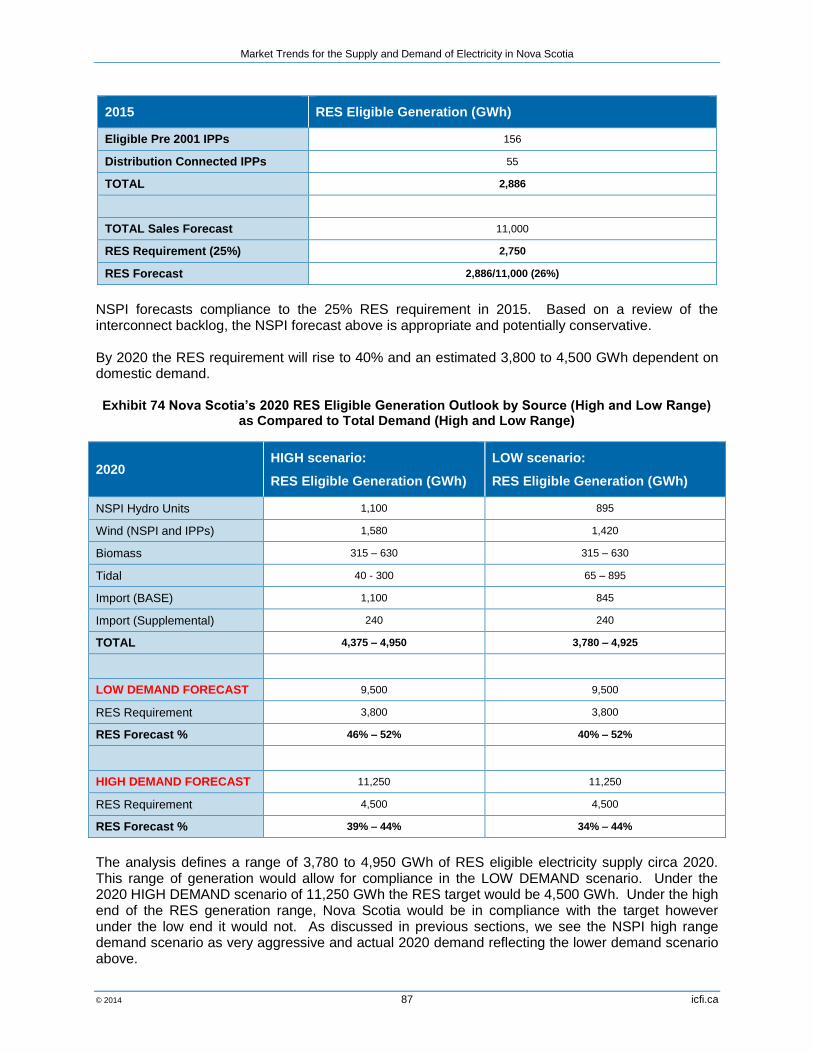
Market Trends for the Supply and Demand of Electricity in Nova Scotia
© 2014 87 icfi.ca
2015 RES Eligible Generation (GWh)
Eligible Pre 2001 IPPs 156
Distribution Connected IPPs 55
TOTAL 2,886
TOTAL Sales Forecast 11,000
RES Requirement (25%) 2,750
RES Forecast 2,886/11,000 (26%)
NSPI forecasts compliance to the 25% RES requirement in 2015. Based on a review of the interconnect backlog, the NSPI forecast above is appropriate and potentially conservative. By 2020 the RES requirement will rise to 40% and an estimated 3,800 to 4,500 GWh dependent on domestic demand. Exhibit 74 Nova Scotia’s 2020 RES Eligible Generation Outlook by Source (High and Low Range)
as Compared to Total Demand (High and Low Range)
2020 HIGH scenario:
RES Eligible Generation (GWh)
LOW scenario:
RES Eligible Generation (GWh)
NSPI Hydro Units 1,100 895
Wind (NSPI and IPPs) 1,580 1,420
Biomass 315 – 630 315 – 630
Tidal 40 - 300 65 – 895
Import (BASE) 1,100 845
Import (Supplemental) 240 240
TOTAL 4,375 – 4,950 3,780 – 4,925
LOW DEMAND FORECAST 9,500 9,500
RES Requirement 3,800 3,800
RES Forecast % 46% – 52% 40% – 52%
HIGH DEMAND FORECAST 11,250 11,250
RES Requirement 4,500 4,500
RES Forecast % 39% – 44% 34% – 44%
The analysis defines a range of 3,780 to 4,950 GWh of RES eligible electricity supply circa 2020. This range of generation would allow for compliance in the LOW DEMAND scenario. Under the 2020 HIGH DEMAND scenario of 11,250 GWh the RES target would be 4,500 GWh. Under the high end of the RES generation range, Nova Scotia would be in compliance with the target however under the low end it would not. As discussed in previous sections, we see the NSPI high range demand scenario as very aggressive and actual 2020 demand reflecting the lower demand scenario above.

Market Trends for the Supply and Demand of Electricity in Nova Scotia
© 2014 88 icfi.ca
It is challenging to design incentives and forward supply mix that will guarantee compliance under all circumstances and the likelihood of all RES eligible generating sources delivering LOW or HIGH scenario outcomes is unlikely. Nova Scotia would be in in compliance in all but the High Demand / Low RES generation scenario. Looking out to 2030 and 2040 we see greater potential variability in RES outcomes. This is expected due to the nature of the long range outlook and associated variability of forward demand. Exhibit 75 Nova Scotia’s 2030 and 2040 RES Eligible Generation Outlook by Source (High and Low
Range) as Compared to Total Demand (High and Low Range)
2030: RES Eligible Generation (GWh)
2040: RES Eligible Generation (GWh)
NSPI Hydro Units 895 – 1,100 895 – 1,100
Wind (NSPI and IPPs) 1,420 - 1,750 1,420 – 1,925
Biomass 315 – 630 315 – 630
Tidal 40 - 300 65 – 895
Import (Base) 845 – 1,100 845 – 1,100
TOTAL 3,500 – 4,800 3,540 – 5,640
Low DEMAND FORECAST 9,000 8,750
RES Requirement 3,600 3,500
RES Forecast % 39 - 54% 40 - 64%
High DEMAND FORECAST 12,000 12,750
RES Requirement 4,800 5,100
RES Forecast % 29 - 41% 28 - 44%
In 2030 and 2040 under a low demand forecast, compliance to the 2020 RES target of 40% would be achievable. As discussed earlier, the high demand scenario is based on NSPI forecast range and is very aggressive given forecast economic metrics. Under high demand forecasts, demand is estimated to be up to 33% higher than a low demand scenario by 2030 and 46% higher in 2040. Under the high demand outcomes, the 40% target is only achieved under high RES eligible generation scenarios. In addition the imports of electricity from Muskrat Falls via Maritime Link beyond the 165MW base become material. In 2030/2040, incremental (beyond base contract) imports from Maritime Link and future transmission connects could total up to 2 TWh. Were this power sourced from RES eligible renewable sources, the challenges associated with compliance with a 40% target under a high demand scenario would be eased.
6.4 In Summary Nova Scotia was proactive in defining targets for GHG emissions, sulphur dioxide (SO2), nitrogen dioxide (NOx), and mercury (Hg). The proactive regulation and target setting has been validated via

Market Trends for the Supply and Demand of Electricity in Nova Scotia
© 2014 89 icfi.ca
an equivalency agreement with the Federal Government providing Nova Scotia electricity system wide flexibility to meet defined GHG emissions outcomes. In setting targets, the government considered the opportunities and challenges of the existing fossil fired generation fleet, identified key projects / initiates to ensure compliance (such as the RES and Maritime Link), provided long term clarity around the many environmental constraints (SO2, NOx, Hg, GHG, etc.), and designed compliance mechanism flexibility to ensure cost effective outcomes. Through this forward planning and thoughtful design of flexible and efficient compliance tools, Nova Scotia is in a good position to meet all environmental targets in the 2020 to 2040 timeframe in the NSPI low and likely demand scenarios. As with all targets set as hard caps (such as Nova Scotia’s targets for SO2, NOx, Hg, GHG emissions) compliance will be more challenging under future high electricity demand / high fossil generation / low renewable / low import scenarios. Even under the upper limits of 2020 demand / fossil generation forecasts Nova Scotia should be in compliance with GHG and NOx targets as well as the 40% RES requirement. Out to 2030 and 2040, compliance with hard/fixed emission caps becomes challenged in the high economic growth / high electricity demand range, given the existing fleet of coal, gas and oil fired units, even with consideration of significant expected import capacity (Maritime Link) and significant additional renewable generation (predominantly wind but also tidal and biomass). However the 2030 and 2040 outlooks are sufficiently variable that compliance as a foregone conclusion for all scenarios is not to be expected and far forward enough that action can be taken in the 2020-2025 timeframe to adjust policy accordingly to ensure the appropriate environmental outcomes. Based on review of Provincial population and economic (GDP) forecasts out to 2040, it would appear that the NSPI high demand forecast is aggressive (and is likely intended to be). We consider the full range of scenarios in the analysis however a flatter high demand of 11,500 to 12,000 GWh circa 2040 is a more likely high demand outcome. Several critical supply outcomes must be achieved in order to meet the environmental regulations discussed: Muskrat Falls (824 MW) hydroelectric generating station and underwater power connection (via
the Maritime Transmission Link) from Newfoundland to Nova Scotia would provide 153MW of firm capacity to NSPML. Project construction is scheduled to begin in 2014 and first power planned for delivery in 2017.
Similarly the Maritime Link Transmission Project involves the construction and operation of a new electrical power transmission system, including a proposed 500-megawatt (MW), +/- 200 to 250-kilovolt high voltage direct current (HVDC) and high voltage alternating current (HVAC) transmission line between the Island of Newfoundland and Cape Breton, Nova Scotia.
Incentives aimed at accelerating the deployments of renewable generation (IPPs and Community Feed-in-Tariffs aimed at wind and tidal) have resulted in significant deployment of renewable generation capacity. The variability of the forward “wind-centric” load will increase vs. historic coal-centric. The electricity system of 2020 will need to accommodate this variable load in order to achieve curtailment of fossil fired generation.
By 2030 and onward, Nova Scotia’s existing fossil fired system will be significantly idled. Under high demand scenarios, the system may require replacement or refurbishment of idled fossil capacity to maintain supply and reliability.