marketing document_indian outlook series_lowres
TRANSCRIPT

ABOUTUS.
Now spanning the energy and resources markets of India, Indonesia and Australia, Salva Report tracks and analyses the latest market trends and developments through our weekly and monthly products coupled with our consulting services.
Salva Report satisfies the needs of companies that require the latest market intelligence from the resources, energy and associated industries. Salva Report is a primary research and analytics firm that provides independent analysis, forecasts and advice using on-the-ground experts to deliver unique, unbiased insights. Salva Report doesn’t believe in conducting broad research from afar, but operates locally within the markets we cover.
Salva Report is led by Chief Analyst, Mark Gresswell. Mark’s significant coal industry experience includes thermal coal trading, global market analysis of coking and thermal coal markets, detailed country studies, pricing forecasts, demand and supply modelling and strategic analysis. Mark is a well-respected authority on the Indian and Indonesian coal, power and steel industries.
Mark leads a large team of analysts based in India, Indonesia and Australia. Our strength in reporting on the Indian market comes from our skills, experience and our local team of sector-focused analysts who dedicate their time to understanding the local industry, delivering considerable knowledge and insight.
HAving HAd A lOcAl preSence in indiA Since 2007, we UnderSTAnd THe difficUlTy in OBTAining cUrrenT, TrAnSpArenT infOrmATiOn, THAT’S wHy we creATed SAlvA repOrT.
In addition to our suite of products, Salva Report delivers custom consulting services and reports to a broad range of global clients. Some of our recent work includes thermal and coking coal supply and demand forecasting, a review and forecast of Indian bulk ports, mergers and acquisition advice, and coal market entry services. For more information on our products or how we can assist you in understanding the Indian market, please visit:
www.salvareport.com

OUrprOdUcTS.
India Unlocked
Keep up to date on key Indian coal market supply and demand drivers. The most accurate and current data on India’s coal trade, production and demand drivers available, India Unlocked provides:
• Keythermalandcokingcoalindicatorsincludingproduction, stock levels, consumption and imports;
• 11differentmonthlyseries;
• HistoricdatabacktoJan2008;
• AlldatabasesareprovidedinMSExcelformatfor ease of use.
The Salva Report - India
The Salva Report India is the leading monthly publication and weekly news covering the steel, power, coal, iron ore and infrastructure sectors. Each report includes:
• StrategicinsightarticlesbyDrNeilBristow,formerchiefanalystBHPBilliton;
• Thelatestindustrydevelopmentsandannouncements;
• Marketupdatesandkeystatisticsforthermalcoalandcoking coal, iron ore and power;
• Topicalarticlesanalysingkeydevelopmentsacrossthesesectors.
In addition to Salva Reports Outlook Series, we also offer the following products.
Indian Database Series
The Salva Report has a wide range of Indian databases covering the power, steel, sponge iron and cement sectors. Each database includes:
• Operatingdetailsofexistingandplannedplantsincluding, size, ownership and location;
• Boiler/furnacetype(whereapplicable);
• Coalfeedstock(domesticorimported);
• Coalimportdetailsincludingportandimportdestination; and
• Historicalproduction,capacityandforecastcapacity.
Eachdatabaseisupdatedonaquarterlybasis.
The Salva Report - Indonesia
The Salva Report Indonesia is the latest publication released by the Salva Report team, and focuses predominantly on the Indonesian coal and associated industries. Each monthly report and weekly news includes:
• Marketupdatesandkeydataforcoalsupply&demand,production and exports;
• Up-to-the-minuteindustrydevelopmentsandannouncements covering policy and regulation, mergers and acquisitions;
• Productionandexportinfrastructureannouncementsand developments;
• Informedarticlesanalysingkeydevelopmentsacrossrelevant sectors.

fOrecASTingfy2012 - 2013.
INDIAN POWER &THERMAL COALOUTLOOK.SAmple
Covering the Indian 2012 - 13 Financial Year (commencing 1 April 2012), the Indian Power and Thermal Coal Outlook is an insightful 42 page report covering the following key areas:
· Domestic thermal coal production, consumption and imports by industry (power, cement and sponge iron);
· Installed and planned capacity growth by industry;
· FY11-12 Review – covers key trends, growth rates and drivers, M&A activity, regulatory changes and project developments;
· FY12-13 Outlook – provides detailed annual forecasts of key demand and supply drivers, new projects coming online and other trends likely to emerge.
The annual subscription includes three quarterly updates incorporating updated forecasts, commentary and analysis of the latest developments and state of play.
The following section is a sample of the FY2012-13 Indian Power and Thermal Coal Outlook.

5

EXECUTIVE SUMMARY 04
THERMAL COAL DEMAND OVERVIEW 06
Generation Fuel Mix 08
REVIEW OF FY11-12 09
FY11-12 Macro-economic Review 10
Power Sector 11
Capacity Additions 11
Coal-fired Generation 14
Regulatory Update 15
Thermal Coal Consumption 16
Major Players 17
Cement Sector 18
Sponge Iron Sector 19
Domestic Coal Supply 20
Coal Imports 22
contentsTABle Of cOnTenTS
OUTLOOK FOR FY12-13 23
Thermal Coal Demand 25
Power Sector 26
Cement Sector 30
Sponge Iron Sector 31
Thermal Coal Supply 32
Domestic Thermal Coal Supply 32
Imported Thermal Coal Supply 33
GLOSSARY 34
APPENDICES 36
*
* Sample Provided
Figure 1: Indian Thermal Coal Consumption (Mt) 06
Figure 2: Thermal Coal Consumption by Industry FY10-11 06
Figure 3: Coal-fired Installed Capacity (GW) 07
Figure 4: Thermal Coal Consumption by Power Sector (Mt) 07
Figure 5: India’s Electricity Demand Supply Gap 07
Figure 6: Installed Capacity Share FY11-12 08
Figure 7: Power Generation Share FY11-12 08
Figure 8: GDP Growth Rate (%) 10
Figure 9: Coal-fired Capacity Addition by Ownership (GW) 12
Figure 10: Coal-fired Capacity Share FY10-11 12
Figure 11: Coal-fired Capacity Share FY11-12 12
Figure 12: Thermal Coal Consumption by Power Industry (Mt) 16
Figure 13: Top 5 Power Utilities Coal-fired Capacity (GW) 17
Figure 14: Top 5 Power Utilities - Coal Imports (Mt) 17
Figure 15: Cement Plant Capacity Utilisation Rate (%) 18
Figure 16: Sponge Iron Production by Fuel Type (Mt) 19
Figure 17: Domestic Coal Supply by Source (Mt) 20
Figure 18: Thermal Coal Production by Grade FY10-11 (Mt) 21
Figure 19: Thermal Coal Production by Grade FY11-12 (Mt) 21
Figure 20: Thermal Coal Imported by Source (Mt) 22
Figure 21: Thermal Coal Consumption by Industry (Mt) 25
Figure 22: India: Power Generation by Source (TWh) 26
Figure 23: Power Utilities Coal Demand Forecast (Mt) 27
Figure 24: Top 5 Power Utilities Coal-fired Capacity (GW) 29
Figure 25: Top 5 Coal Importers - Power Utilities (Mt) 29
Figure 26: Cement Production Forecast (Mt) 30
Figure 27: Cement Sector Coal Demand Forecast (Mt) 30
Figure 28: Sponge Iron Production Forecast (Mt) 31
Figure 29: Sponge Iron Sector Coal Demand Forecast (Mt) 31
Figure 30: Domestic Thermal Coal Supply Forecast (Mt) 32
Figure 31: Thermal Coal Import Forecast (Mt) 33
DISCLAIMER: All of the information contained in this report is to be considered confidential, and the recipient of this report agrees to retain the information in confidence and will not disclose any of the information to others except as expressly permitted by Salva Report Pty Ltd. Only the recipient may rely upon this presentation.
This report is intended to provide general information only.
Given that forecasts change on a daily basis, it is not intended to be completely accurate and should not be relied upon as such.
Salva Report Pty Ltd disclaims liability for loss incurred by any person acting in reliance upon the information contained in this report.
Table 1: FY11-12 Review 09
Table 2: Capacity Addition Overview 11
Table 3: FY11-12 Regulatory Update 15
Table 4: Coal Quality Grades 20
Table 5: FY12-13 Performance Outlook 24
Table 6: Capacity Addition Overview 27
liST Of cHArTS liST Of TABleS
*
*
*
*
*

6
Overview
Thermal coal demand
India’s thermal coal consumption has grownfrom452MtinFY07-08to576MtinFY11-12,acompoundedannualgrowthrate(CAGR)of6.3%(see Figure 1).Thisdemandhaslargelymet by domestic coal supply, which increasedto484MtinFY11-12,upfrom423MtinFY07-08,aCAGRof3.4%.However,domesticsupplygrowth has struggled to match demand, so imported coal supply has grownataCAGRof34%overthesameperiod,increasingfrom29MtinFY07-08to92MtinFY11-12.
India’s power industry is the largest consumer of thermal coal, accounting for75%oftotalthermalcoalconsumptioninFY10-11,followedbyotherindustrieswitha13%share(see Figure 2). Other industries include the captive power industry and process industries such as aluminium, fertiliser, chemical, paper and bricks. Coal consumption for the cement and spongeironindustrieswas7%and5%respectively.
indiA’S grOwTH in THermAl cOAl demAnd Over THe pAST few yeArS HAS Been STrOng, SUppOrTed By eXTenSive cApAciTy AddiTiOnS in THe pOwer, cemenT And SpOnge irOn indUSTrieS.
0
100
200
300
400
500
600
700
FY07-08 FY08-09 FY09-10 FY10-11 FY11-12
Domestic Import
Figure 1: Indian Thermal Coal Consumption (Mt)
Figure 2: Coal Consumption by Industry FY10-11
7
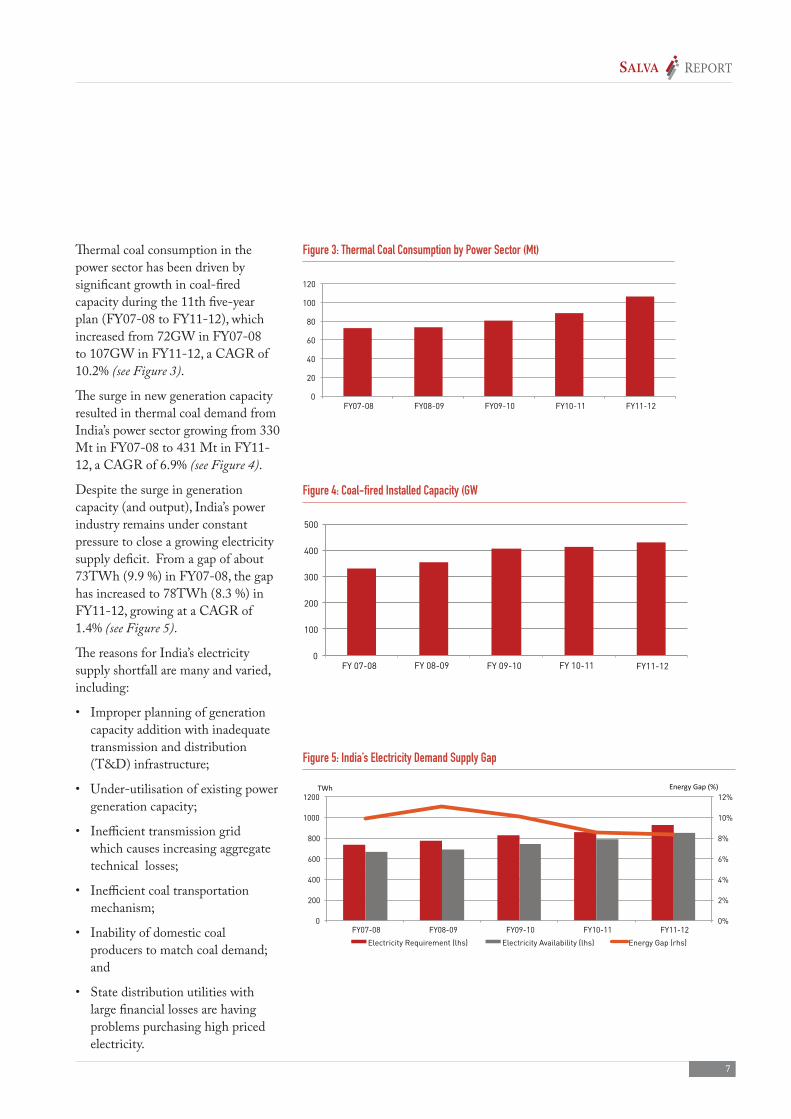
Thermalcoalconsumptioninthepower sector has been driven by significant growth in coal-fired capacityduringthe11thfive-yearplan(FY07-08toFY11-12),whichincreasedfrom72GWinFY07-08to107GWinFY11-12,aCAGRof10.2%(see Figure 3).
Thesurgeinnewgenerationcapacityresulted in thermal coal demand from India’spowersectorgrowingfrom330MtinFY07-08to431MtinFY11-12,aCAGRof6.9%(see Figure 4).
Despitethesurgeingenerationcapacity(andoutput),India’spowerindustry remains under constant pressure to close a growing electricity supply deficit. From a gap of about 73TWh(9.9%)inFY07-08,thegaphasincreasedto78TWh(8.3%)inFY11-12,growingataCAGRof 1.4% (see Figure 5).
ThereasonsforIndia’selectricitysupply shortfall are many and varied, including:
• Improperplanningofgenerationcapacity addition with inadequate transmission and distribution (T&D)infrastructure;
• Under-utilisationofexistingpowergeneration capacity;
• Inefficienttransmissiongridwhich causes increasing aggregate technical losses;
• Inefficientcoaltransportationmechanism;
• Inabilityofdomesticcoalproducers to match coal demand; and
• Statedistributionutilitieswithlarge financial losses are having problems purchasing high priced electricity.
0
100
200
300
400
500
FY 07-08 FY 08-09 FY 09-10 FY 10-11 FY11-12
0
20
40
60
80
100
120
FY07-08 FY08-09 FY09-10 FY10-11 FY11-12
0%
2%
4%
6%
8%
10%
12%
0
200
400
600
800
1000
1200
FY07-08 FY08-09 FY09-10 FY10-11 FY11-12
Electricity Requirement (lhs) Electricity Availability (lhs) Energy Gap (rhs)
TWh Energy Gap (%)
Figure 4: Coal-fired Installed Capacity (GW
Figure 3: Thermal Coal Consumption by Power Sector (Mt)
Figure 5: India’s Electricity Demand Supply Gap

fOrecASTingfy2012 - 2013.
INDIAN BULKPORTSOUTLOOK.SAmple
Covering the Indian 2012 - 13 Financial Year (commencing 1 April 2012), the Indian Bulk Ports Outlook is an insightful 40 page report covering the following key areas:
· Iron ore, thermal and coking coal trade by port;
· Installed and planned capacity by port;
· FY11-12 Review – covers key trends, growth rates and drivers, M&A activity, regulatory changes and project developments;
· FY12-13 Outlook – provides detailed annual forecasts of key demand and supply drivers, new projects coming online and other trends likely to emerge.
The annual subscription includes three quarterly updates incorporating updated forecasts, commentary and analysis of the latest developments and state of play.
The following section is a sample of the FY2012-13 Indian Bulk Ports Outlook.

contentsTABle Of cOnTenTS
EXECUTIVE SUMMARY 04
INDIAN PORT SECTOR – OVERVIEW 06Major and Non-Major Ports – Comparison 08
REVIEW OF FY11-12 09FY11-12 Macro-economic Review 10
Bulk Trade Developments 11
East Coast Coal Trade 13Key Thermal Coal Ports 16
Key Thermal Coal Importers 16
Key Coking Coal Ports 17
Key Coking Coal Importers 17
West Coast Coal Trade 18Key Thermal Coal Ports 20
Key Thermal Coal Importers 21
Key Coking Coal Ports 21
Key Coking Coal Importers 22
Iron Ore Exports 22East Coast 24
West Coast 25
OUTLOOK FOR FY12-13 26Bulk Trade Developments 27
Bulk Traffic Projections 28
Thermal Coal Imports 32Key East Coast Ports 32
Key West Coast Ports 33
Coking Coal Imports 34Key East Coast Ports 34
Key West Coast Ports 35
Iron Ore Exports 36Key East Coast Ports 36
Key West Coast Ports 37
GLOSSARY 38
*
*
* Sample Provided

Figure 1: Indian Port Traffic Share FY11-12 06Figure 2: Indian Bulk Trade (Mt) 06Figure 3: Major Commodities Handled At Indian Ports 07Figure 4: Major and Non-Major Ports Share of Total Trade 08Figure 5: Macro-economic Factors and Indian Bulk Trade 10Figure 6: East Coast Coal Imports (Mt) 13Figure 7: India’s East Coast Ports 14Figure 8: Key East Coast Thermal Coal Ports (Mt) 16Figure 9: Key East Coast Thermal Coal Importers (Mt) 16Figure 10: Key East Coast Coking Coal Ports (Mt) 17Figure 11: Key East Coast Coking Coal Importers (Mt) 17Figure 12: West Coast Coal Imports (Mt) 18Figure 13: India’s West Coast Ports 19Figure 14: Key West Coast Thermal Coal Ports (Mt) 20Figure 15: Key West Coast Thermal Coal Importers (Mt) 21Figure 16: Key West Coast Coking Coal Ports (Mt) 21Figure 17: Key West Coast Coking Coal Importers (Mt) 22Figure 18: Iron Ore Exports (Mt) 23Figure 19: Key East Coast Iron Ore Ports (Mt) 24Figure 20: Key East Coast Iron Ore Exporters FY11-12 (Mt) 24Figure 21: Key West Coast Iron Ore Ports (Mt) 25Figure 22: Key West Coast Iron Ore Exporters FY11-12 (Mt) 25Figure 23: East Coast Bulk Trade (Mt) 28Figure 24: West Coast Bulk Trade (Mt) 28Figure 25: Forecast Thermal Coal Imports (Mt) 32Figure 26: East Coast Thermal Coal Imports (Mt) 32Figure 27: West Coast Thermal Coal Imports (Mt) 33Figure 28: Forecast Coking Coal Imports (Mt) 34Figure 29: East Coast Coking Coal Imports (Mt) 34Figure 30: West Coast Coking Coal Imports (Mt) 35Figure 31: Forecast Iron Ore Exports (Mt) 36Figure 32: East Coast Iron Ore Exports (Mt) 36Figure 33: West Coast Iron Ore Exports (Mt) 37
DISCLAIMER: All of the information contained in this report is to be considered confidential, and the recipient of this report agrees to retain the information in confidence and will not disclose any of the information to others except as expressly permitted by Salva Report Pty Ltd. Only the recipient may rely upon this presentation.
This report is intended to provide general information only.
Given that forecasts change on a daily basis, it is not intended to be completely accurate and should not be relied upon as such.
Salva Report Pty Ltd disclaims liability for loss incurred by any person acting in reliance upon the information contained in this report.
Table 1: Indian Bulk Trade Review of FY11-12 09Table 2: Port Capacity addition projects (FY11-12) 11Table 3: Port Capacity (all commodities) by State (FY11-12) 12Table 4: Trade and Capacity Forecast FY12-13 26Table 5: Delayed Capacity Addition Projects 27Table 6: Bulk Projects to be Completed in FY12-13 27Table 7: East Coast Bulk Trade Projections by Port (Mt) 29Table 8: West Coast Bulk Trade Projection by Port (Mt) 30
liST Of cHArTS liST Of TABleS
*
*

8
Amidst the slow initial pace of development, the state of Gujarat broke new ground with distinctive forms of privatisation, including the formation of the first ever state level maritime board, Gujarat Maritime Board(GMB)in1982.Gujaratacted as a model for other coastal statesandcatalysedPPP’s(PublicPrivatePartnerships)intheIndianport sector. It also heralded a sense of competitiveness among India’s coastal states. After opening the Indian port sector for private participation in 1996,portcapacityhascontinuedtogrowtomorethan1BtinFY10-11.
ThePPPmodelhasworkedwellforthe Indian port sector, thanks to an investor friendly policy framework. Themodel,whichincludes100%FDIandconcessionagreements,hasattracted private investment for a large number of port and port-related infrastructure projects.
Overthelastdecade,trafficmajorportshasgrownfrom281Mtto570Mt,aCAGRof7%,whereasacrossthesameperiodtrafficatnon-majorports have grown at a much faster CAGRof14%,from87MtinFY00-01to313MtinFY10-11.Itisestimated that non-major ports will overtake major ports in terms of bulk
MAjOR AND NON-MAjOR PORTS – COMPARISON
The development of bulk traffic volume at Indian ports was unremarkable prior to liberalisation in 1991.
29%
71% 66% 65% 61%
34% 35% 39%
0%
20%
40%
60%
80%
100%
FY08-09 FY09-10 FY10-11 FY11-12
Major Non-Major
Figure 4: Major and Non-Major Ports Share of Total Trade
tradevolumeby2015.Bulktrafficat non-major ports has grown at a CAGRof26%y-o-yacrossthelastfouryears,growingfrom43MtinFY08-09to85MtinFY11-12,whileoverthesameperiodbulktrafficatmajorportshasdeclinedfrom129MtinFY08-09to105MtinFY11-12,aCAGRof-6%.
Figure 4 illustrates the shift of Indian trade volume contribution between major and non-major Indian ports. Iron ore is one of the main commodities handled at major ports. DuetothedeclineinIndia’sironoretrade the dry bulk handling share of non-major ports is expected to continue to rise as most iron ore is handled through major ports.
9
FY10-11 FY11-12 Growth (%)
Thermalcoalimports(Mt) 67 92 37%
Cokingcoalimports(Mt) 35 35 0%
Ironoreexports(Mt) 98 63 -35%
Totaldrybulktrade(Mt) 200 190 -5%
Coalcapacity(Mtpa) 169 220 30%
Ironorecapacity(Mtpa) 160 193 20%
Totaldrybulkcapacity(Mtpa) 329 413 25%
Table 1: Indian Bulk Trade Review of FY11-12
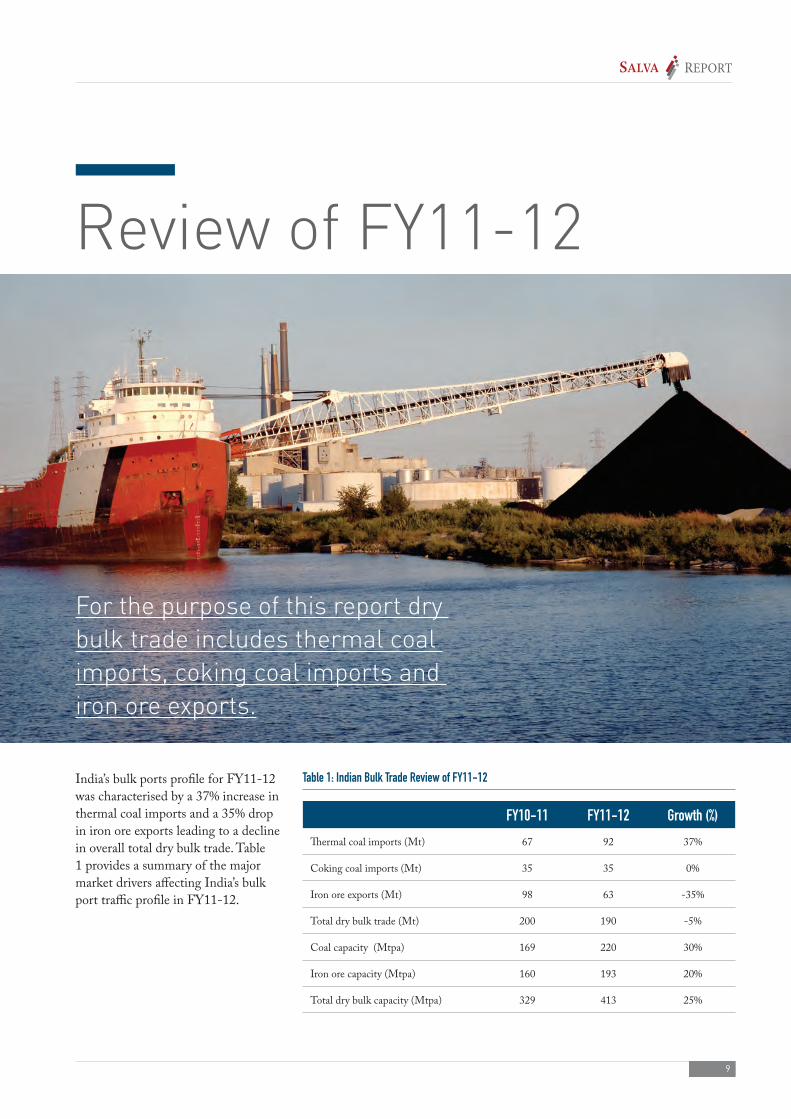
review of fy11-12
for the purpose of this report dry bulk trade includes thermal coal imports, coking coal imports and iron ore exports.
India’sbulkportsprofileforFY11-12wascharacterisedbya37%increaseinthermalcoalimportsanda35%dropin iron ore exports leading to a decline inoveralltotaldrybulktrade.Table1providesasummaryofthemajormarketdriversaffectingIndia’sbulkporttrafficprofileinFY11-12.
16
fOrecASTingfy2012 - 2013.
INDIAN STEEL& COKING COALOUTLOOK.SAmple
Covering the Indian 2012 - 13 Financial Year (commencing 1 April 2012), the Indian Steel and Coking Coal Outlook is an insightful 33 page report covering the following key areas:
· Domestic coking coal and iron ore production, consumption and imports by industry;
· Installed and planned capacity growth;
· FY11-12 Review – covers key trends, growth rates and drivers, M&A activity, regulatory changes and project developments;
· FY12-13 Outlook – provides detailed annual forecasts of key demand and supply drivers, new projects coming online and other trends likely to emerge.
The annual subscription includes three quarterly updates incorporating updated forecasts, commentary and analysis of the latest developments and state of play.
The following section is a sample of the FY2012-13 Indian Steel and Coking Coal Outlook.
17

EXECUTIVE SUMMARY 04
OVERVIEW – INDIAN STEEL INDUSTRY 06
Industry Structure 07
Steel Production 08
Steel Demand 08
Steel Trade 09
Iron Ore Supply 10
Coking Coal Supply 11
REVIEW OF FY11-12 13
FY11-12 Macro-economic Review 14
Steel Industry Developments 16
Steel Production 18
Iron Ore Demand 19
Steel Consumption 20
Coking Coal Consumption 20
Domestic Production 21
Coking Coal Imports 21
Major Coking Coal Importers 22
contentsTABle Of cOnTenTS
OUTLOOK FOR FY12-13 23
Steel Industry Developments 24
Steel Capacity 26
Steel Production 27
Steel Consumption 28
Coking Coal Demand 29
Coking Coal Supply 30
Domestic Production 30
Coking Coal Imports 30
Major Coking Coal Importers 31
GLOSSARY 32*
* Sample Provided

Figure 1: Integrated Steel Producers 07
Figure 2: Secondary Steel Producers 07
Figure 3: Crude Steel Production in India (Mt) 08
Figure 4: Apparent Consumption of Finished Steel (Mt) 08
Figure 5: Apparent Steel Use per Capita 2010 (kg) 09
Figure 6: Steel Trade in India (Mt) 09
Figure 7: Indian Iron Ore Production (Mt) 10
Figure 8: Coking Coal Consumption in India (Mt) 11
Figure 9: Washed Coking Coal Production (Mt) 11
Figure 10: Coking Coal Imports to India (Mt) 12
Figure 11: Quarterly GDP Growth (y-o-y) 14
Figure 12: Crude Steel Production in India (Mt) 18
Figure 13: Iron Ore Production in India (Mt) 19
Figure 14: Top 5 Iron Ore Producers (Mt) 19
Figure 15: Apparent Consumption of Finished Steel (Mt) 20
Figure 16: Indian Coking Coal Consumption (Mt) 20
Figure 17: Indian Washed Coking Coal Production (Mt) 21
Figure 18: Indian Coking Coal Imports (Mt) 21
Figure 19: Coking Coal Imports to India (Mt) 21
Figure 20: Top 5 Coking Coal Importers (Mt) 22
Figure 21: Crude Steel Production in India (Mt) 27
Figure 22: Apparent Consumption of Finished Steel (Mt) 28
Figure 23: Indian Coking Coal Consumption (Mt) 29
Figure 24: Washed Coking Coal Production in India (Mt) 30
Figure 25: Indian Coking Coal Imports (Mt) 30
Figure 26: Top 5 Coking Coal Importers (Mt) 31
Table 1: Review of FY11-12 14
Table 2: Key Events - Iron Ore Mining Ban 17
Table 3: FY11-12 Delayed Major Steel Capacity Projects 18
Table 4: Outlook for FY12-13 24
Table 5: FY12-13 Steel Capacity Projects 26
DISCLAIMER: All of the information contained in this report is to be considered confidential, and the recipient of this report agrees to retain the information in confidence and will not disclose any of the information to others except as expressly permitted by Salva Report Pty Ltd. Only the recipient may rely upon this presentation.
This report is intended to provide general information only.
Given that forecasts change on a daily basis, it is not intended to be completely accurate and should not be relied upon as such.
Salva Report Pty Ltd disclaims liability for loss incurred by any person acting in reliance upon the information contained in this report.
liST Of cHArTS liST Of TABleS
*

14
fy11-12 macro-economic review
GDP:Fordevelopingeconomiessuch as India, steel consumption growth correlates highly with growth ingrossdomesticproduct(GDP)and industrial production growth. Typically,a1%changeinGDPgrowth in India correlates to steel consumption growth of approximately 1.1%.
TheIndianeconomyismoreinsulatedfrom the global economy than other Asian economies, as it relies less heavily on exports to developed markets.However,noeconomyhasbeencompletelyunaffectedby the prevailing global economic uncertainty.AstheeffectsoftheEuropeandebtcrisiscontinuetobefelt, India’s economy experienced moderatedgrowthinFY11-12.
The primary growth drivers of steel demand in india across fy11-12 are detailed below.
0%
1%
2%
3%
4%
5%
6%
7%
8%
9%
Q1FY1
0-11
Q2FY1
0-11
Q3FY1
0-11
Q4FY1
0-11
Q1FY1
1-12
Q2FY1
1-12
Q3FY1
1-12
Q4FY1
1-12
Figure 11: Quarterly GDP Growth (y-o-y)
Additionally,GDPgrowthinFY10-11andFY11-12washamperedbynumerous interest rate hikes aimed at curbing inflation. Quarterly growth rateshavefalleninFY11-12,withthird quarter growth recorded at
6.1%.EarlierGDPexpectationsintherangeof8%to8.5%havebeenreduced and the economy is now expectedtogrow6.9%inFY11-12(see Figure 11).

21
In addition to the depressed global economic environment, high interest rates, prolonged inflationary pressures and a higher than expected fiscal deficit have led to declines in demand in many interest rate sensitive sectors, such as the construction and automobile sectors, which has in turnaffectedsteelconsumption.Thegrowth of the largest component of aggregate demand in India, private finalexpenditure,was5.1%fromApriltoDecember’11,comparedto8.5%duringthepreviousyear.Thecontraction in fixed capital formation inFY11-12isoneofthemainfactors behind the slowing of growth. Thedeclineingrowthwasalsoseen in capital goods expenditure, contractingto2.8%fromApril’11toJanuary’12,comparedto17%duringthe same period last financial year.
Infrastructure Investment Drive:
TheIndianeconomyhasgrownat8%overthelastfiveyears,andis poised to maintain a similar rate of growth. Salva believes that sustainability of this trend will necessitate massive infrastructure investment.DuringtheGoI’s12thfive-yearplan(FY12-13toFY16-17),thegovernmentisexpectedtospendUS$1trilloninfrastructuredevelopment, nearly double the investment in the government’s 11thfive-yearplan,onmajorinfrastructure projects such as electricity, telecommunications networks, roads, bridges, railways andports.Thismassivegovernmentefforttocreatetransportandindustrial infrastructure will boost steeldemandinIndia.TheUnionBudgetofIndiaFY12-13alsobrought positive news for the infrastructure sector, with a budget allocationincreaseof23%toINR2,140bill(US$47bill),48.5%ofthetotal budget allocation.
Growing steel consumer-industries:
Steel consumer industries in India, such as the automobile, machinery and consumer durables industries are growing at a healthy rate. In FY09-10,Indiabecametheworld’ssecond fastest growing automobile marketafterChinawith26%growthy-o-y. India is also the second largest motorcycle and tractor manufacturer intheworld.Withpassengercardensityat8carsper1,000people(comparedto24inChinaand119inBrazil)andrisingdisposableincome,India has strong potential for sustained growth in the automobile sector. Growing industrialisation and an emerging middle class has seen high growth in capital goods and consumer durables production overthelastfiveyears.Whilegrowthfigures have been subdued recently due to a moderation in economic growth, underlying trends are still strong for sustained growth in steel consumption.

24
Australia | India | Indonesia
International Head Office Level 11. 82 Eagle Street
Brisbane. QLD 4000. Australia
+61 (7) 3258 6100www.salvareport.com