marketing metrics and analytics - marketo engage
TRANSCRIPT
MARKETING METRICSAND ANALYTICS
CHEAT SHEET
HOW TO PROVE YOUR WORTH WITH MARKETING ANALYTICS
2
W H AT ’ S I N S I D E
3 -- How to Prove Your Worth with Marketing Analytics
4 -- Establishing Marketing Accountability
5 -- Planning for Marketing ROI
6 -- Marketing ROI Management Process
7 -- A Framework for Measurement
8 -- Revenue Analytics
9 -- Marketing Performance Management
10 -- Marketing Forecasting
11 -- Dashboards
12 -- Implementation
13 -- Helpful Resources
H O W TO P R O V E YO U R W O R T H
W I T H M A R K E T I N G A N A LY T I C S
The growing imperative for marketers to prove
their worth has arrived—but many firms have
ground to make up in this area. Gartner found
that only 1/3 of CMOs say ROI of total market-
ing spend is a strategic key performance indi-
cator, and 77% of global B2B marketing decision
makers cite their use of data and analytics to
guide marketing decisions as one of their
department's top five weaknesses, according to
Forrester.
Done right, marketing metrics and analytics can
be a strategic enabler of trust, greater budget,
and increased business impact. Today’s CMO is
allocating more time and budget than ever
before to understand marketing’s performance
and influence on growth.
3

E S TA B L I S H I N G M A R K E T I N G AC C O U N TA B I L I T Y
As a first step, marketing must establish a culture of accountability. If marketing leaders
insist that marketing is an art and not a science, then the department will remain isolat-
ed from other groups.
This shift can be daunting, especially if current performance is unclear. Accountability is
a double-edged sword that can reveal either weak performance or good results, so it
can be tempting to eschew accountability to avoid the truth.
To get there, marketing must be able to justify their expenditures as investments in
revenue and growth. This process requires top-level buy-in, investment in the right
systems and tools, and a potential restructuring of marketing incentives and compensa-
tion.
The journey may not be easy, but the results—regarding peer respect and impact on
profits—are worth it.
4
Marketing metrics are only as valuable as the outcomes they produce; the most important
reports are the ones enabling us to make data-driven decisions and increase profits. It’s import-
ant to plan your programs with ROI in mind. You want to measure ROI to find out not only what
works, but what works better. First, define your objectives and pick measurable metrics to
support those goals.
Next, design your program to be measurable beforehand, with a clear idea of what, when, and
how you will measure KPIs. Most companies do not do this early enough, and they pay for it later.
Lastly, focus on the decisions that improve marketing—this means moving past backward-looking
measurement to forward-looking execution. By identifying the channels and campaigns with the
highest revenue impact and ROI, you unlock the ability to optimize your resources towards future
impact.
P L A N N I N G F O R M A R K E T I N G R O I
5
BEST ASSUMPTIONS
ROISCENARIOS
MEASUREMENTPLANTest Variations
MEASUREMENTS
ROIMEASUREMENTS
HISTORY TO GUIDENEXT CAMPAIGN
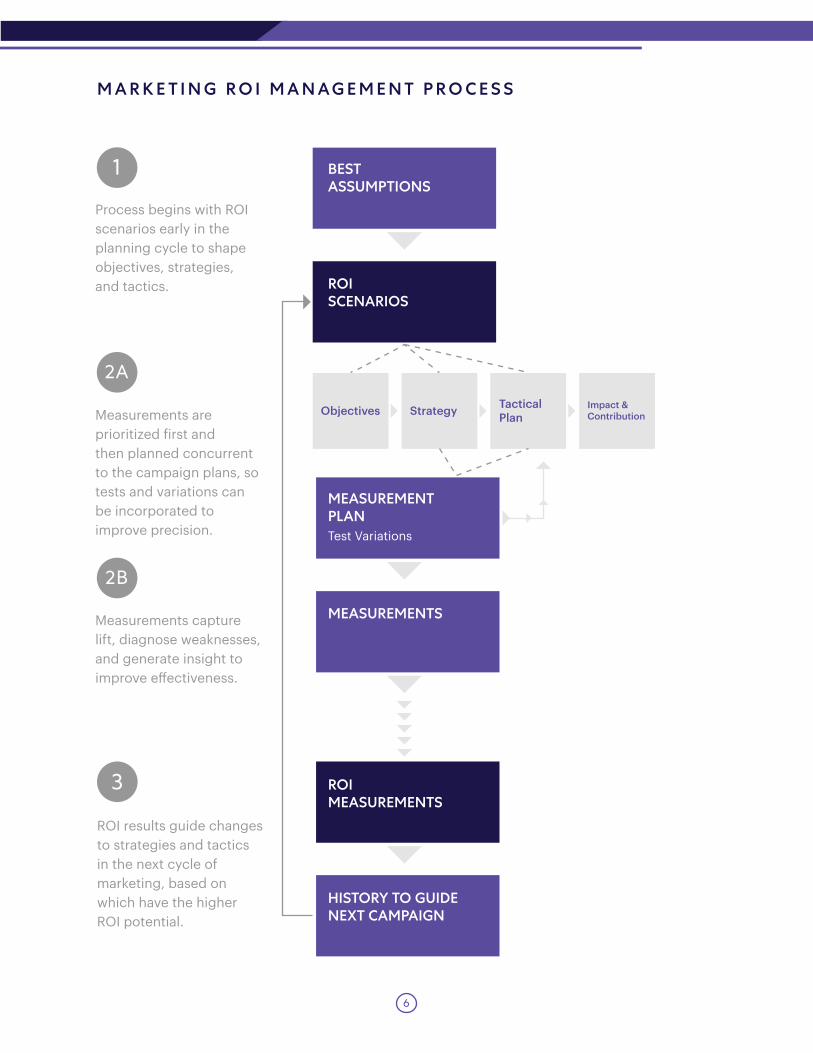
M A R K E T I N G R O I M A N AG E M E N T P R O C E S S
Objectives Strategy TacticalPlan
Impact &Contribution
1
2A
2B
3
Process begins with ROIscenarios early in the planning cycle to shapeobjectives, strategies,and tactics.
Measurements are prioritized first and then planned concurrentto the campaign plans, so tests and variations can be incorporated to improve precision.
Measurements capture lift, diagnose weaknesses, and generate insight to improve e�ectiveness.
ROI results guide changes to strategies and tactics in the next cycle of marketing, based on which have the higher ROI potential.
6
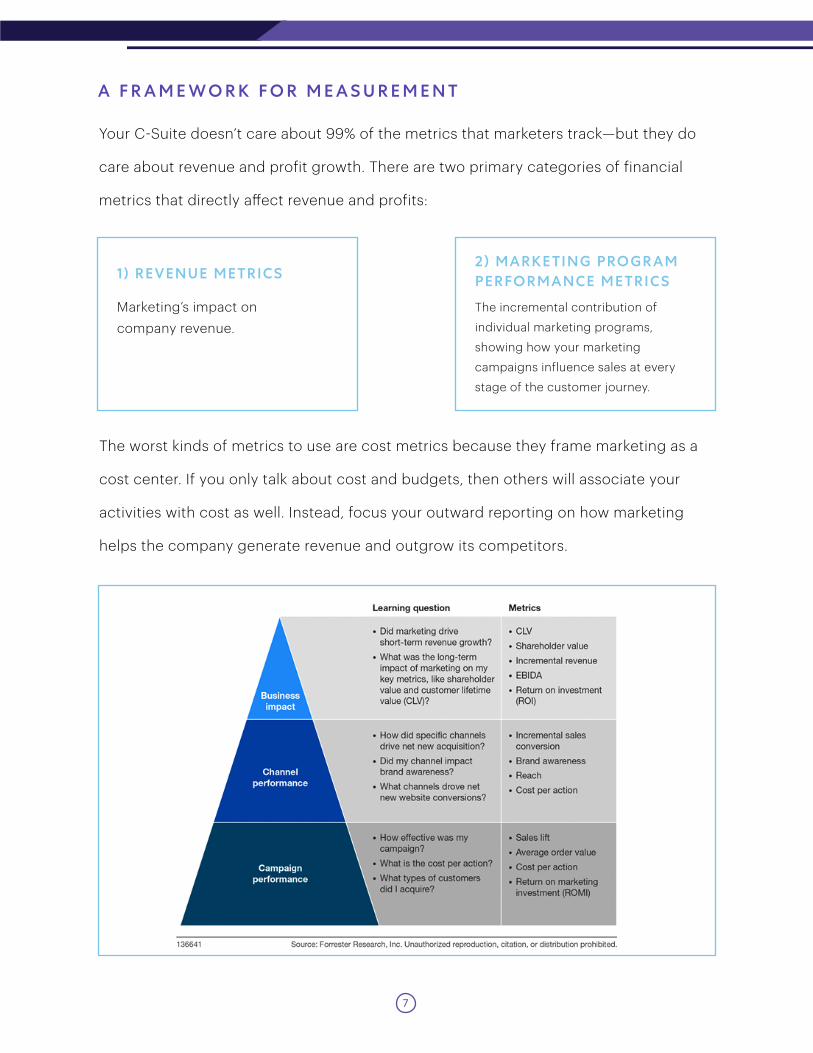
A F R A M E W O R K F O R M E A S U R E M E N T
Your C-Suite doesn’t care about 99% of the metrics that marketers track—but they do
care about revenue and profit growth. There are two primary categories of financial
metrics that directly a�ect revenue and profits:
The worst kinds of metrics to use are cost metrics because they frame marketing as a
cost center. If you only talk about cost and budgets, then others will associate your
activities with cost as well. Instead, focus your outward reporting on how marketing
helps the company generate revenue and outgrow its competitors.
1) REVENUE METRICS
Marketing’s impact on company revenue.
2) MARKETING PROGRAM PERFORMANCE METRICS
The incremental contribution of
individual marketing programs,
showing how your marketing
campaigns influence sales at every
stage of the customer journey.
7
Perhaps the most critical metrics for building marketing’s credibility are
the metrics that show marketing’s impact on revenue. Start by defining
the stages of the revenue cycle, from awareness to closed business and
beyond. Then collaborate with sales to formally define each stage and
the rules that determine movement between them to create the founda-
tion for a set of revenue metrics.
Once the model is in place, you can begin to explore the four key
metrics that matter:
1 . FLOW
Number of leads that entered each stage in a given period
2. BALANCE
How many active prospects are in each pipeline stage
3. CONVERSION
Conversion rate from stage to stage
4. VELOCIT Y
Average revenue cycle time
When you focus on how marketing impacts sales productivity, you will
gain a much more comprehensive view of your activities’ ROI.
R E V E N U E
A N A LY T I C S
8
M A R K E T I N G P E R F O R M A N C E M A N AG E M E N T
Measuring the contribution that a given marketing
activity has on revenue and profits is the holy grail of
marketing measurement. Some of the key challenges
are timing, extraneous variables, and factoring in multi-
ple touches and influencers. But just because it’s hard
doesn’t mean it’s impossible.
The most common starting point for tracking the results
of marketing is to assign the entire value (pipeline or
revenue) to the first or last activity that touched a deal.
The next step is moving to an unweighted multi-touch
model, where attribution is spread evenly.
Finally, reaching a weighted multi-touch state allows you
to accurately credit activities surrounding first touch,
lead conversion, opportunity creation, and customer
close.
If you’re looking for another way to measure the e�ec-
tiveness of a new program, consider testing it against a
well-formed control group and comparing the results.
9
When marketing takes responsibility for the early stages of
the revenue cycle, they have better visibility into future reve-
nue. Marketing executives can forecast how many new leads,
opportunities, and customers marketing will yield in future
periods because they know how many prospects are in each
revenue cycle stage—and how likely they are to move
through each stage over time.
Though the details can get quite sophisticated, the method-
ology for making accurate marketing forecasts is simple in
concept.
Model the stages of the revenue cycle, and then measure
how each lead type moves through the various stages (con-
version percentage and velocity).
Get marketing to enter accurate number of new leads for
each type into the system.
Model the flow of current and new leads through the various
stages over time.
Review the results and apply management judgment to
finalize the forecast.
M A R K E T I N G
F O R E C A S T I N G
1
2
3
4
10
Your marketing campaigns and programs generate a vast
amount of data, most of which is not relevant. As you design
your dashboards, you want to determine what is most useful to
you. This action will translate into the right number of met-
rics—enough for you to understand what is going on inside your
data, but not so many that you are overwhelmed with marginally
relevant information. Focus on the metrics that matter most:
engagement, pipeline, and revenue.
The best dashboards don’t just serve a reporting function. They
should also guide how people within your organization think,
acting as catalysts for e�ective decision making. Start by fram-
ing your destination, reminding others about what you want to
accomplish so you can align towards that objective. While you
do need to present your numbers, it is more important is to
share what they mean and spell out CTAs to key stakeholders.
Remember, the actions you take based on your data matter
more than the actual numbers themselves.
DA S H B OA R D S
11
As with any business transformation, the suc-
cess of your marketing measurement program
depends on how well you implement it. This
requires you to establish the right team, process,
and technology.
Hiring or designating the right people is only the
first step. You also need to establish well-defined
workflows for data analysis. Identify who will
own each part of the process and formalize
training to cultivate the specific skills your mar-
keting team needs, and set a feedback loop in
place for performance reviews.
Lastly, while Excel spreadsheets and other ad
hoc tools can do a lot, automated measurement
processes provide much more definitive,
reliable, and timely insight. Automation saves
time on information collection and presentation,
allowing analysts to focus on gaining insights
and refining future actions towards better
results.
I M P L E M E N TAT I O N
12

Interested in learning more about how to use
data and analytics to guide marketing decisions?
Check out the resources below.
The Definitive Guide to Marketing Metrics &
Analytics
Webinar: Find Your Pot of Gold with Marketing
Metrics that Matter
Marketo Marketing Metrics Blog Posts
H E L P F U L R E S O U R C E S
13