marketing research filemarketing research finding the purpose setting the direction shaping the...
TRANSCRIPT

Marketing Research
Finding the Purpose Setting the DirectionShaping the Destination of Your Business
A Special Presentation for
Widya KartikaUniversitySurabaya
Prepared by,Go Siang Chen
A Skill Building Approach

MARKETING RESEARCH CLASIFICATION
P rob
l em
Ide n
t i fi c
a ti o
nR
esea
rch
Prob
lem
Solv
ing
Res
earc
hMarket Potential Research
Market Share Research
Sales Forecasting Research
Trend Business Research
Market Behavior Research
Market Characteristic Research
Sales Effort Research
Sales Promotion Research
Market Segmentation Research
Product Market Research
Pricing Research
Distribution Channels Research

Observation Identification ofProblem Area
Theoretical frameworkor
Network of associations
Hypotheses
ConstructsConcepts
Operational Definitions
ResearchDesign
DataCollection
Interpretationof Data
Analysisof Data
Refinement of Theory(Pure Research)
orImplementation
(Applied Research)
THE BUILDING BLOCK OF SCIENCE

OBSERVATIONBroad area of
research interestidentified
PRELIMINARYDATA
GATHERINGInterviewingLiterature
Survey
PROBLEMDEFINITION
Researchproblem
delineated
THEORETICALFRAMEWORK
Variablesclearly
identified andlabeled
GENERATIONOF
HYPOTHESES
SCIENTIFICRESEARCH
DESIGN
DATA COLLECTION
ANALYSISAND
INTER-PRETATION
DEDUCTIONHypotheses
substantiated?Researchquestion
answered?
11
3
6
THE RESEARCH PROCESS FOR BASIC & APPLIED RESEARCH
2
4
5
7
8
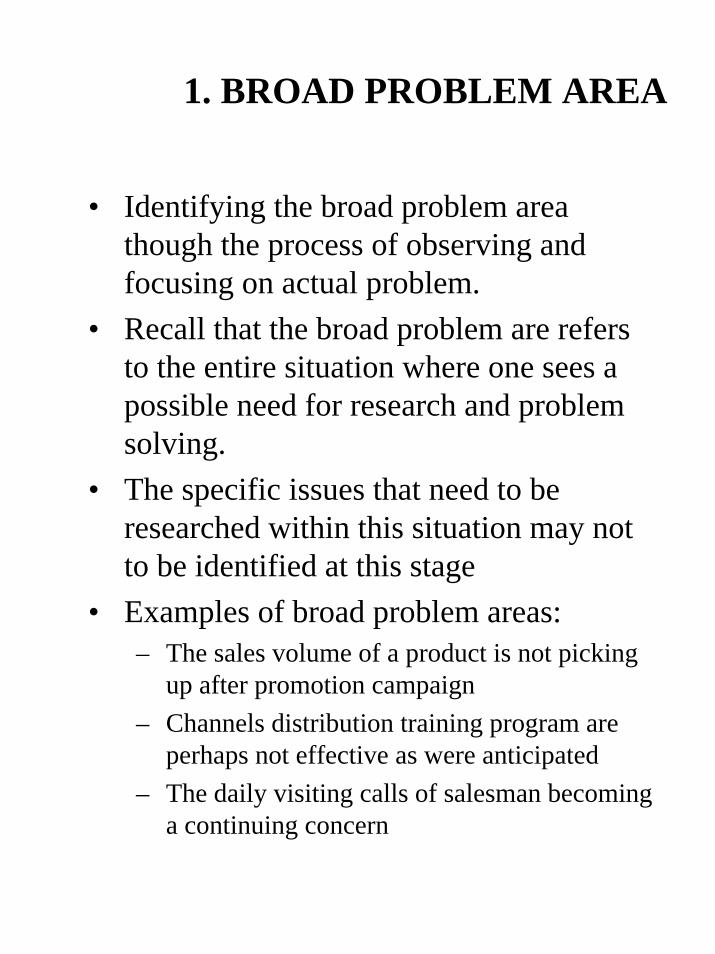
1. BROAD PROBLEM AREA
• Identifying the broad problem area though the process of observing and focusing on actual problem.
• Recall that the broad problem are refers to the entire situation where one sees a possible need for research and problem solving.
• The specific issues that need to be researched within this situation may not to be identified at this stage
• Examples of broad problem areas:– The sales volume of a product is not picking
up after promotion campaign– Channels distribution training program are
perhaps not effective as were anticipated– The daily visiting calls of salesman becoming
a continuing concern

2. PRELIMITARY DATA COLLECTION
• The nature of information that would be needed by the researcher for the purpose could be broadly classified under three headings:– Background information of the organization-
that is, the contextual factors.• The origin and history of the company-when it
was started, business it is in, sales rate growth, ownership and control so on.
– Managerial philosophy, company policies, and other structural aspects.
• Roles and position in the organization and number of employees at each job level
– Perceptions, attitudes, and behavioral responses of organizational members and client systems (if applicable)
• A general idea of people’s perceptions of their work, the organizational climate, and other aspects of interest to the researcher can be obtained through both unstructured and structured interview with the respondents.

3. PROBLEM DEFINITION
• No amount of good research can find solutions to the situation, if the critical issue or the problem to be studied is not clearly pinpointed.
• A problem does not necessarily mean that something is seriously wrong with a current situation, which needs to be rectified immediately.
• A problem could simply indicate an interest is an issue where finding the right answers might help to improve an existing good situation
To define a problem as any situation where a gap exists between the actual and the desired ideal state

4. THE NEED FOR A THEORETICAL FRAMEWORK
• A theoretical framework is a conceptual model of how one theorized the relationships among the several factorsthat have identified as important to the problem (discusses the interrelationship among the variables that are deemed to be integral to the dynamic of the situation being investigated).
• If a theoretical framework is nothing other than identifying the network of relationship among the variables considered important to the study are given problem situation. Four main types of variables:– The dependent variables (also know as the
criterion variables)– The independent variables (also known as the
predictor variable)– The moderating variable– The intervening variables

5. HYPOTHESES DEVELOPMENT
• An hypothesis is an educated guess about a problem’s solution. It can be defined as a logically conjectured relationshipbetween two or more variables expressed in the form of testable statements.
• These relationships are conjectured on the basic of the network of associations established in the theoretical framework formulated for the research study.
Example: If-Then StatementIf employees are more healthy. Then they will take sick leave less frequently.
If, in starting the relationship between two variables (two group), term such as “positive”, “negative”, “more than”, “less than”, and the like are used, then these hypotheses are directional (indicate the direction of the relationship between the variables (positive/negative)

Types ofInvestigation
Purposes ofThe Study
Study Setting
Measurementand
Measures
SamplingDesign
Unit of Analysis
(Populationto be Studied)
Data-CollectionMethod
Feel forData
Goodnessof Data
HypothesesTesting
TimeHorizon
Extent of ResearcherInterference
DETAIL OF STUDY MEASUREMENT
DATAANALYSIS
6.3.
6.4.
6.7.
6.8.
6.1.
6.2.
6.5.
6.6.
Prob
lem
Sta
tem
ent
6. THE SCIENTIFIC RESEARCH DESIGN
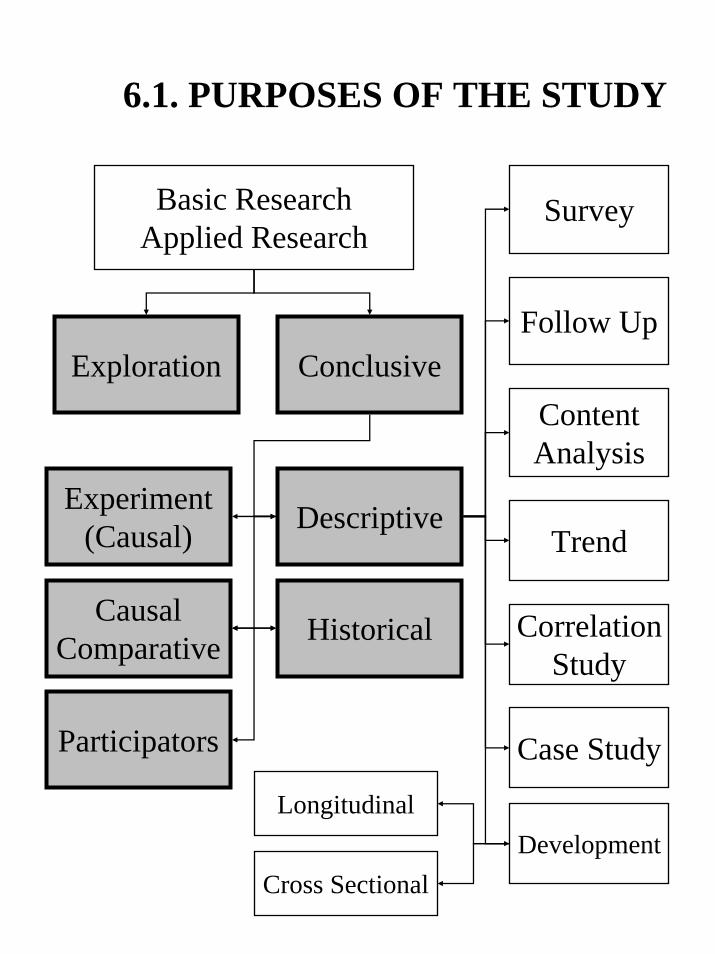
6.1. PURPOSES OF THE STUDY
CausalComparative Historical
Participators
Experiment(Causal) Descriptive
Trend
CorrelationStudy
Case Study
Survey
Development
ContentAnalysis
Follow Up
Cross Sectional
Longitudinal
Basic ResearchApplied Research
Exploration Conclusive

6.2. TYPES OF INVESTIGATION
Quantitative
Experimentation
Qualitative
CausalStudy
CorrelationStudy
Direct Indirect
Observation
Surveys
Association Structuring
Completion Expressive
DepthInterview
GroupDifference
• A Causal Study question: Does smoking cause cancer?• A Correlation study question: Are smoking, drinking,
and chewing tobacco associated with cancer?
GroupDifferences

6.3. EXTENT OF RESEACHER INTERFERENCE
Attitudes RespondentCharacteristic
PastBehavior
CommunicationTechniques
ObservationTechniques
PerformanceObjectives
Tasks
Responses to Unstructured
Stimuli
SelfReport
OvertBehavior
PhysiologicalReactions
Manipulation and/or Control and/or Simulation

6.4. STUDY SETTINGCONTRIVED & NONCONTRIVED
Observation
Field StudyFiled Experiment Lab Experiment
(Contrived & Non Contrived)
Survey
Respondents AnalogousSituation
Primary Data
Secondary Data
Experimental
Complete Enumeration
(Census)
EstimateValue
(Sampling)
CaseStudy
(Causes)
Pre-test & Post-test
• Field Study: Correlation studies done in organization• Field Experiment: Studies conducted to establish cause
effect relationship using the same natural environment
• Lab Experiment: Subjects are carefully chosen by the researcher to respond to certain manipulated stimuli

6.5. UNIT OF ANALYSIS: POPULATION TO BE STUDIED
PopulationTo Be
Studied Organization
Machine
Cultures
Individuals
Etc.
Groups
Dyads
The unit of analysisrefers to the levelof aggregation of
the data duringsubsequent analysis
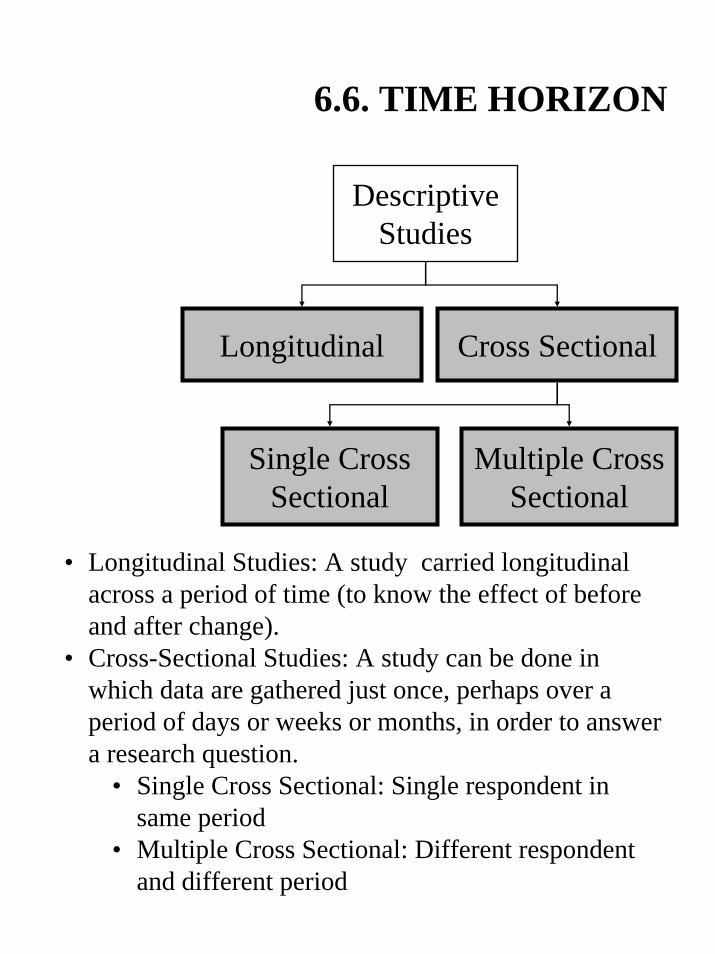
6.6. TIME HORIZON
DescriptiveStudies
Cross SectionalLongitudinal
Multiple CrossSectional
Single CrossSectional
• Longitudinal Studies: A study carried longitudinal across a period of time (to know the effect of before and after change).
• Cross-Sectional Studies: A study can be done in which data are gathered just once, perhaps over a period of days or weeks or months, in order to answer a research question.
• Single Cross Sectional: Single respondent in same period
• Multiple Cross Sectional: Different respondent and different period
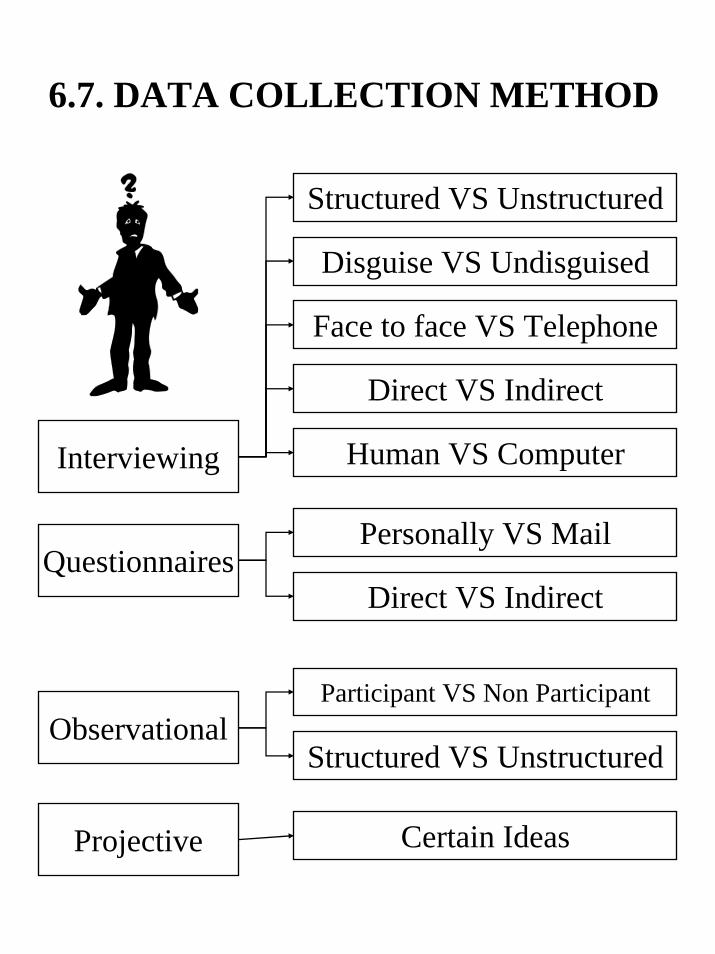
6.7. DATA COLLECTION METHOD
Interviewing
Questionnaires
Structured VS Unstructured
Face to face VS Telephone
Direct VS Indirect
Disguise VS Undisguised
Human VS Computer
Personally VS Mail
Direct VS Indirect
Participant VS Non ParticipantObservational
Structured VS Unstructured
Projective Certain Ideas

Data Collection
Method
Observation
Questionnaire
Interview
Content andPurposeQuestion
Wordingand
Language
Type andForm ofQuestion
Sequencing
Classification & PersonalInformation
1. Principlesof
Wording
QuestionnaireAdministration
TestingGoodness of Data
Scales & Scaling
2. Principlesof
Measurement
Categorization
Coding
Reliability & Validity
Appearance of Questionnaire
Length of Questionnaire
Introduction to Respondents
Instructions to Completion
3. GeneralGet Up
6.7. PRINCIPLES OF QUESTIONARE DESIGN

6.7. TOPOLOGY OF DATA
Analysis:• Qualitative• Quantitative
Source:• Internal• External
Collection:• Primary• Secondary
Time Horizon:• Cross Section• Time Series’
Variable:• Dependent• Independent
Scale:• Nominal• Ordinal• Interval• Ratio
Data
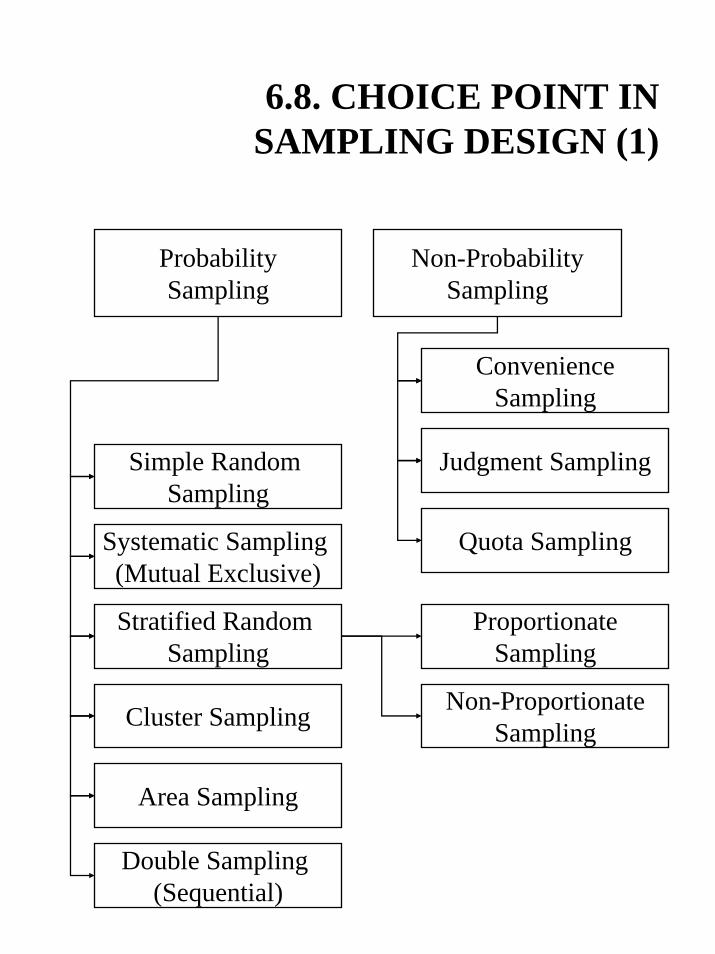
ProbabilitySampling
Simple Random Sampling
Non-ProbabilitySampling
Systematic Sampling (Mutual Exclusive)
Stratified Random Sampling
Cluster Sampling
Area Sampling
Double Sampling (Sequential)
ConvenienceSampling
Judgment Sampling
Quota Sampling
ProportionateSampling
Non-ProportionateSampling
6.8. CHOICE POINT IN SAMPLING DESIGN (1)

Is REPRESENTATIVENESSof sample critical for the study?
Choose one ofthe PROBABILITY
Sampling Design
Choose one ofthe NONPROBABILITY
Sampling Design
To Obtaininformationrelevant to
and availableonly withcertain groups
To Obtain quickeven if unreliable
information
Generalizability
Assessingdifferential
parameters insubgroup ofpopulation
Collectioninformationin a located
area
Gathering moreinformation from
a subset ofthe sample
Yes No
6.8. CHOICE POINT IN SAMPLING DESIGN (2)

Generalizability
Assessingdifferential
parameters insubgroup ofpopulation
Collectioninformationin a located
area
Choose SimpleRandomSampling
ChooseSystematicSampling
Choose ClusterSampling if not
enough $
ChooseArea
Sampling
ChooseDouble
Sampling
Gathering more
information from a subset of the sample
ChooseProportionate
StratifiedRandom
ChooseDisproportionate
StratifiedRandom
All subgroupshave equalnumber ofelements
Yes No
6.8. CHOICE POINT IN PROBABILITY SAMPLING
DESIGN (3)
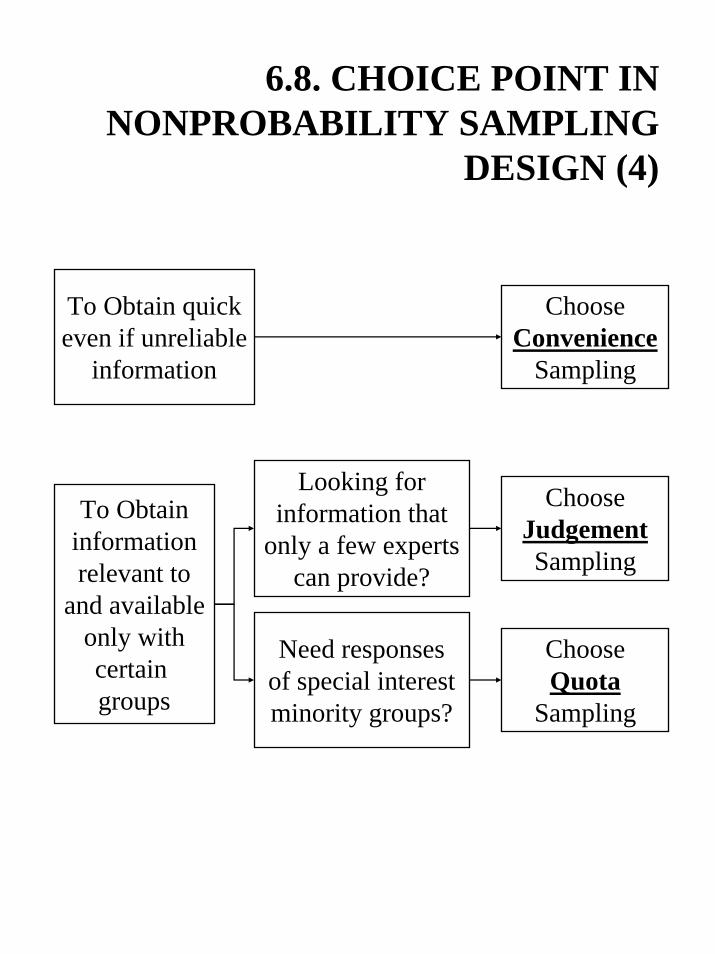
To Obtaininformationrelevant to
and availableonly withcertain groups
To Obtain quickeven if unreliable
information
Looking forinformation that
only a few expertscan provide?
Need responsesof special interestminority groups?
ChooseJudgementSampling
ChooseQuota
Sampling
ChooseConvenience
Sampling
6.8. CHOICE POINT IN NONPROBABILITY SAMPLING
DESIGN (4)

Types ofInvestigation
Purposes ofThe Study
Study Setting
Measurementand
Measures
SamplingDesign
Unit of Analysis
(Populationto be Studied)
Data-CollectionMethod
Prob
lem
Sta
tem
e nt Feel for
Data
Goodnessof Data
HypothesesTesting
TimeHorizon
Extent of ResearcherInterference
DETAIL OF STUDY MEASUREMENT
DATAANALYSIS
7. THE MEASUREMENT OF VARIABLES
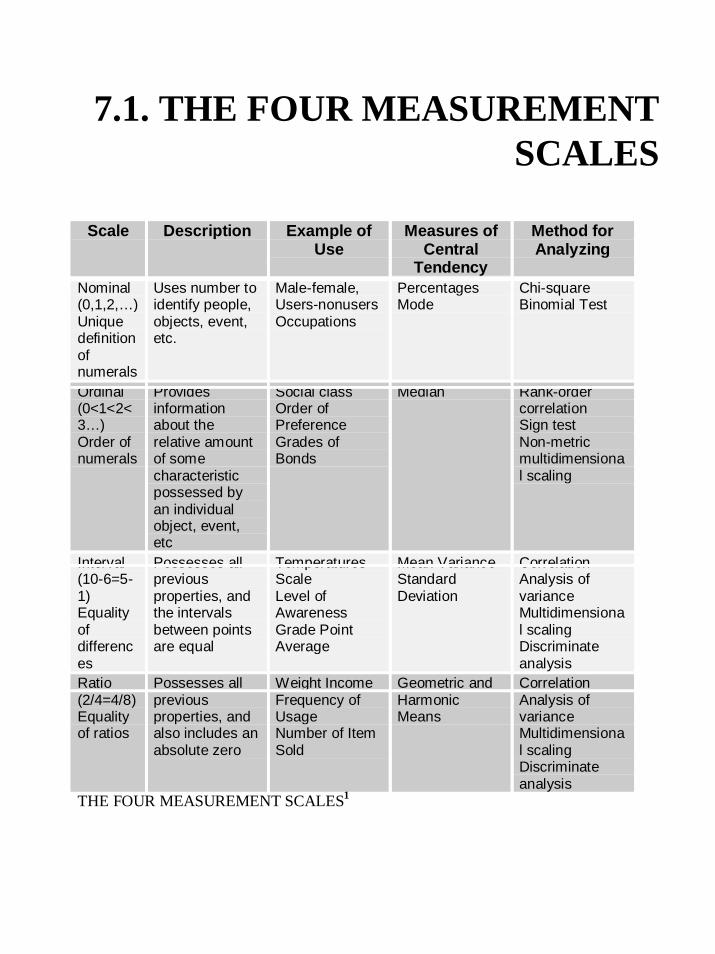
Scale Description Example ofUse
Measures ofCentral
Tendency
Method forAnalyzing
Nominal(0,1,2,…)Uniquedefinitionofnumerals
Uses number toidentify people,objects, event,etc.
Male-female,Users-nonusersOccupations
PercentagesMode
Chi-squareBinomial Test
Ordinal(0<1<2<3…)Order ofnumerals
Providesinformationabout therelative amountof somecharacteristicpossessed byan individualobject, event,etc
Social classOrder ofPreferenceGrades ofBonds
Median Rank-ordercorrelationSign testNon-metricmultidimensional scaling
Interval(10-6=5-1)Equalityofdifferences
Possesses allpreviousproperties, andthe intervalsbetween pointsare equal
TemperaturesScaleLevel ofAwarenessGrade PointAverage
Mean VarianceStandardDeviation
CorrelationAnalysis ofvarianceMultidimensional scalingDiscriminateanalysis
Ratio(2/4=4/8)Equalityof ratios
Possesses allpreviousproperties, andalso includes anabsolute zero
Weight IncomeFrequency ofUsageNumber of ItemSold
Geometric andHarmonicMeans
CorrelationAnalysis ofvarianceMultidimensional scalingDiscriminateanalysis
THE FOUR MEASUREMENT SCALES1
7.1. THE FOUR MEASUREMENT SCALES

7.2. SCALING TECHNIQUES COMMONLY USED
GraphicRatingScale
ItemizedRatingScale
LikertRatingScale
SemanticDifferential
Scale
10 - Excellent-
5 - Alright-
1 - Very Bad
• Extremely Poorly : 1• Rather Poorly : 2• Quite Well : 3• Very Well : 4• Excellently : 5
• Strongly Disagree - Disagree• Neither Disagree - Non Agree• Agree - Strongly Agree
• Good -Bad• Strong - Weak• Hot - Cold

Goodnessof
Data
FaceValidity
Reliability(accuracy in
measurement)
Validity(are we measuringthe right thing?) Stability
Consistency
IntertermConsistencyReliability
Split-halfReliability
Test-retestReliability
Parallel FormReliability
CriterionRelatedValidity
CongruentValidity
LogicalValidity
Predictive
Concurrent
Convergent
Discriminate
7.3. TESTING GOODNESS OF MEASURES (RELIABILITY &
VALIDITY)

7.4. QUANTITATIVE DATA ANALYSIS TOOLS
• Descriptive Statistics– Frequencies– Measures of Central Tendency & Dispersion– Mean, Median, Mode– Range, Variance, Standard Deviation,
Interquartile Range
• Inferential Statistics– Pearson Correlation– Relationship Between Two Nominal Variables:
X2 Test– Significant Mean Differences Between Two
Groups: t Test– Significant Mean Differences Among More
Two Groups: ANOVA– Multiple Regression Analysis

7.5. DATA ANALYSIS & INTERPRETATION
Da t
a C
o lle
c tio
n
Getting Data Ready for Analysis:• Editing Data• Handling Blank Responses• Coding Data• Categorizing Data• Creating Data File• Programming
Feel for Data• Mean• Standard Deviation• Correlation• Frequency Distribution
Goodness ofData• Reliability• Validity
Hypotheses Testing:Appropriate Statistical Manipulators
Data Analysis
Interpretationof
Result
Discussion
ResearchQuestion
Answered?

7.6. RECOMMENDATIONS & IMPLEMENTATION
1990 - 1999
Industry Average
PT ‘A’ PT ‘B’
IntracompanyComparisons
Industry AverageComparisons
IntercompanyComparisons
Need for Comparative Analysis:• Horizontal Analysis
• Time Series (Trend) analysis• Vertical Analysis
• Commonsize Analysis• Ratio Analysis
Product lineProduct item

Meninjau Tujuan Pemasaran
MenetapkanMasalah “Terpilih”
Penelitian InformasiInternal & Eksternal
Difinisi Masalah Yang Disempurnakan
Menulis Laporan Singkat Rencana
Proposal PenelitianPemasaran
PenelitianSekunder
Menetapkan Persyaratan
Kemungkinan Intern
Meninjau Validitas
Menaksir Relevansi
Menemukan Sumber Intern
Mengidentifikasi Persyaratan
Penelitian Primer
Merancang Penelitian
Pembimbingan
Pengumpulan Data
Pemrosesan Data
Kerja Lapangan
Analisis Data
Kesimpulan
KeputusanPemasaran
Umpan Balik
Rekomendasi
WORKING PLAN GUIDES