marketing to children china - november 2012
TRANSCRIPT
Marketing to Children –
China,
November 2012
Published by Mintel Group Ltd 11 Pilgrim Street London EC4V 6RN tel: 020 7606 4533 fax: 020 7606 5932 Sales hotline: +44 (0)20 7606 6000 email: [email protected] © Mintel Group Limited. All rights reserved. Statistics in this report are the latest available at the time of research
NOTE: This publication is issued as a series of reports. Each report is a complete work in itself, which is available separately or as part of a subscription
www.mintel.com
IMPORTANT WARNING
1. Mintel Group Limited ("Mintel") is the legal owner of the copyright
subsisting in this report. Any use and/or copying of such documents
and materials which is not in accordance with Mintel's standard Terms and Conditions (available at www.mintel.com/terms) or these
Conditions of Use is unauthorised. Any unauthorised use may give rise
to Mintel bringing proceedings for copyright infringement against you
claiming an injunction, damages and costs. No purchase order issued
by the original subscriber (“Licensee”) will modify or amend these
standard Terms and Conditions, even where the purchase order is
signed by Mintel.
2. The purchase, use or reading of any Mintel report that contains
SymphonyIRI Group (IRI) InfoScan data by (or disclosure to) a Non-Participating Retailer or its employees (or agents/professional advisors
working on its account) is prohibited. A Non-Participating Retailer is a
retailer and its subsidiaries each as defined by IRI, where it, or one of
its associated companies, has declined to participate in IRI’s InfoScan
information service by not providing its data to IRI. A current written
list of Non-Participating Retailers and subsidiaries (as notified to Mintel
by IRI) is available from Mintel at any time, or as linked through the
latest set of terms and conditions as displayed continuously on
Mintel’s website at http://www.mintel.com/terms. The Non-Participating Retailers as at May 24, 2010 are Walmart, Sam’s Club,
Costco, Lidl, and Aldi.
3. Unless otherwise agreed in writing in advance by Mintel, this
document may not be sold, passed on, communicated or disseminated
in any form (including within its original covers), nor access granted,
to any third party or to any subsidiary, associated or holding company
(whether direct or indirect) of the Licensee.
4. The Licensee acknowledges that all information and materials contained in this report are the copyright property and confidential
information of Mintel, and are protected, inter alia, by the Copyright,
Designs and Patents Act 1988 and other intellectual property rights
and by these Terms and Conditions, and that no rights in any of the
materials are transferred to the Licensee. The Licensee undertakes
that it will not copy, reproduce, print or store in any manner
(electronic or otherwise), extract or transmit in any form or otherwise
deal with in any way the whole or part of the data, materials or
information contained in this report.
5. The Licensee (or any subsequent user, whether licensed or
unlicensed who reads this report) agrees it will not place financial
reliance upon any figure, statement or inference contained within this
or any other Mintel report, or invite investment from others, without
first obtaining the written consent of Mintel's Company Secretary so to
do. In the event that the Licensee (or any subsequent user, whether
licensed or unlicensed) does not follow this procedure, it (or any
subsequent user) agrees fully and effectually to indemnify Mintel
against any claims, howsoever arising, and to draw specific attention to the fact that this consent has not been obtained.
Table of contents Marketing to Children China, November 2012
© Mintel Group Ltd. All rights reserved. iii
INTRODUCTION ..................................................................................................................................... 8
Methodology.................................................................................................................................... 8 Definitions ....................................................................................................................................... 8
EXECUTIVE SUMMARY ....................................................................................................................... 10
Decreasing proportion of Chinese youngsters .............................................................................. 10 Figure 1: Age structure of Chinese population, 2002-11 ................................................................................... 10
Multi-generational households ...................................................................................................... 11 Figure 2: Household composition, by parents’ age, July 2012 .......................................................................... 11
Uptake of paid extra-curricular activities is high ........................................................................... 12 Figure 3: Additional paid classes, July 2012 ..................................................................................................... 12
Nearly half of Little Emperors get pocket money from grandparents ........................................... 13 Figure 4: Sources of child’s pocket money, July 2012 ...................................................................................... 13
Necessities are prioritised ............................................................................................................. 14 Figure 5: What monthly income is spent on average, July 2012 ....................................................................... 14
Children in Tier 1 cities lead technology ownership ..................................................................... 15 Figure 6: Children’s product ownership, July 2012 ........................................................................................... 15
A day in the life of a Little Emperor ............................................................................................... 16 Figure 7: A child’s day – average time spent on each activity, July 2012 .......................................................... 16
MARKET BACKGROUND .................................................................................................................... 17
Key points ..................................................................................................................................... 17 How the phenomenon of The Little Emperors emerged ............................................................... 17 Evidence of gender imbalance...................................................................................................... 18
Figure 8: Age structure of Chinese population, by gender, 2002 and 2011....................................................... 18 History of the One-Child Policy ..................................................................................................... 18
Figure 9: China population statistics, 2011 ....................................................................................................... 18 Exceptions to the One-Child Policy .............................................................................................. 19
Figure 10: Urban exemptions to the One-Child Policy, 2011* ........................................................................... 19 One child, six incomes .................................................................................................................. 20 The emergence of the middle class .............................................................................................. 20 Early retirement leads to active involvement of grandparents ...................................................... 21
CURRENT LIVING SITUATION ............................................................................................................ 22
Key points ..................................................................................................................................... 22 Property ownership ....................................................................................................................... 22
Figure 11: Property ownership and number of bedrooms in the property, July 2012 ........................................ 22 Type of property owned ................................................................................................................ 23
Figure 12: Type of primary residence, July 2012 .............................................................................................. 23 Who Little Emperors live with........................................................................................................ 24
Figure 13: Household composition, by parents’ age, July 2012 ........................................................................ 24 Over nine in ten Little Emperors have their own space ................................................................ 25
Figure 14: Children’s living arrangements, July 2012 ....................................................................................... 25 Presence of domestic help ............................................................................................................ 26
Figure 15: Presence of domestic help in the household, July 2012 .................................................................. 26
THE NEXT GENERATION OF LITTLE EMPERORS ........................................................................... 28
Key points ..................................................................................................................................... 28 Childcare arrangements ................................................................................................................ 28
Figure 16: Daycare arrangements, July 2012 ................................................................................................... 28 Baby personal care purchases ..................................................................................................... 30
Figure 17: Baby products bought in the past 12 months, July 2012 .................................................................. 30 Preference for foreign brands of nappies ..................................................................................... 31
Figure 18: Brands of disposable nappies bought in the past 12 months, July 2012 .......................................... 31 Advertising illustrates benefits of wearing nappies ....................................................................... 32 Parents look for 'natural' credentials ............................................................................................. 33
Figure 19: Attitudes towards nappies, July 2012 .............................................................................................. 33 Baby food and drink purchases .................................................................................................... 34
Figure 20: How the child is fed, July 2012 ........................................................................................................ 34

Table of contents Marketing to Children China, November 2012
© Mintel Group Ltd. All rights reserved. iv
Parents' anxieties fuel preference for foreign brands of baby formula ......................................... 35 Figure 21: Brand of infant formula used, July 2012 ........................................................................................... 35
Taking a baby around ................................................................................................................... 36 Figure 22: Items used to transport the child, July 2012 ..................................................................................... 36
Older parents focus on fitness of toddlers .................................................................................... 37 Figure 23: Attitudes towards transport of the child, July 2012 ........................................................................... 37
EDUCATION OF LITTLE EMPERORS ................................................................................................ 38
Key points ..................................................................................................................................... 38 Parents' educational aspirations for Little Emperors .................................................................... 38
Figure 24: Type of degree intended for child, July 2012 ................................................................................... 38 Parents aged 20-39 more likely to opt for private school ............................................................. 39
Figure 25: Type of school the child attends, July 2012 ..................................................................................... 39 Extra-curricular activities enhance academic credentials ............................................................. 40
Figure 26: Additional paid classes, July 2012 ................................................................................................... 40 Parents wish for a brighter future for their offspring...................................................................... 41
Figure 27: Willingness to fund the child’s studies abroad, July 2012 ................................................................ 41 American institutions are favoured ............................................................................................... 42
Figure 28: Preferred country for child’s studies abroad, July 2012 .................................................................... 42 Attitudes towards supporting children financially .......................................................................... 43
Figure 29: Financial impact of covering child’s education, July 2012 ................................................................ 43
SPENDING POWER OF LITTLE EMPERORS .................................................................................... 44
Key points ..................................................................................................................................... 44 Sources of children’s income ........................................................................................................ 44
Figure 30: Sources of child’s income, July 2012 ............................................................................................... 44 Fathers aged 40-49 most generous with offspring ....................................................................... 45
Figure 31: Amount of monthly allowance, July 2012 ......................................................................................... 45 Mothers require more discipline from Little Emperors .................................................................. 46
Figure 32: Condition monthly allowance is based on, July 2012 ....................................................................... 46 Higher-income families attach fewer conditions to pocket money ................................................ 47
Figure 33: Condition monthly allowance is based on, by household income, July 2012 ................................... 47 Children’s financial product ownership ......................................................................................... 47
Figure 34: Savings account and insurance policies set up for child, July 2012 ................................................. 47 Focus on education ....................................................................................................................... 48
Figure 35: Attitudes towards the child’s development and family finances, July 2012 ....................................... 48 Boys more vocal about what they want ........................................................................................ 50
Figure 36: Attitudes towards the child’s development and family finances, by gender of child, July 2012 ......... 50
FAMILY SPENDING HABITS ............................................................................................................... 51
Key points ..................................................................................................................................... 51 What families spend extra income on ........................................................................................... 51
Figure 37: Monthly discretionary expenditure, July 2012 .................................................................................. 51 Spending on necessities is prioritised ........................................................................................... 52
Figure 38: What monthly income is spent on average, July 2012 ..................................................................... 52 Clothing purchases for children .................................................................................................... 53
Figure 39: Branded children’s clothing bought, July 2012 ................................................................................. 53 Girls prefer international brands of casualwear ............................................................................ 54
Figure 40: Sportswear brands bought for child, July 2012 ................................................................................ 54 Attitudes towards buying clothes for children ............................................................................... 55
Figure 41: Attitudes towards child’s clothing, July 2012 .................................................................................... 55 Dads are more lenient with Little Emperors .................................................................................. 56
Figure 42: Attitudes towards child’s clothing, by gender of parent, July 2012 ................................................... 56 Children’s device ownership ......................................................................................................... 57
Figure 43: Children’s product ownership, July 2012 ......................................................................................... 57 Children’s mobile phone ownership .............................................................................................. 58
Figure 44: Brand of smartphone owned by child, July 2012 .............................................................................. 58
FAMILY LEISURE AND HOLIDAY HABITS ........................................................................................ 60
Key points ..................................................................................................................................... 60

Table of contents Marketing to Children China, November 2012
© Mintel Group Ltd. All rights reserved. v
Family holiday habits .................................................................................................................... 60 Figure 45: Holidays taken in the past 12 months, July 2012 ............................................................................. 60
Overseas travel is growing ............................................................................................................ 61 Figure 46: Holidays taken in the past 12 months, July 2012 ............................................................................. 61
Family leisure activities ................................................................................................................. 62 Figure 47: Family leisure activities done regularly, July 2012 ........................................................................... 62
A DAY IN THE LIFE OF A LITTLE EMPEROR .................................................................................... 64
Key points ..................................................................................................................................... 64 A child’s typical day ....................................................................................................................... 65
Figure 48: A child’s day – average time spent on each activity, July 2012 ........................................................ 65 Who takes care of children? ......................................................................................................... 66
Figure 49: The child’s support network, July 2012 ............................................................................................ 66 How connected are children with other family members? ............................................................ 67
Figure 50: People the child spends time with – average time spent with each, July 2012 ................................ 67
APPENDIX – CURRENT LIVING SITUATION ..................................................................................... 68
Figure 51: Type of primary residence, by demographics, July 2012 ................................................................. 68 Figure 52: Number of bedrooms in property, July 2012 .................................................................................... 69 Figure 53: Number of bedrooms in property, by demographics, July 2012 ....................................................... 69 Figure 54: Type of property ownership, by demographics, July 2012 ............................................................... 70 Figure 55: Household composition, by demographics, July 2012 ..................................................................... 71 Figure 56: The child’s living arrangements, July 2012 ...................................................................................... 72 Figure 57: The child’s living arrangements, by demographics, July 2012 ......................................................... 72 Figure 58: Presence of domestic help, July 2012 ............................................................................................. 73 Figure 59: Presence of domestic help, by demographics, July 2012 ................................................................ 74 Figure 60: Presence of domestic help, by demographics, July 2012 ................................................................ 75
APPENDIX – THE NEXT GENERATION OF LITTLE EMPERORS .................................................... 76
Figure 61: Daycare arrangements, July 2012 ................................................................................................... 76 Figure 62: Daycare arrangements, by demographics, July 2012 ...................................................................... 76 Figure 63: Baby products bought, July 2012 ..................................................................................................... 77 Figure 64: Most popular baby products bought, by demographics, July 2012 ................................................... 77 Figure 65: Next most popular baby products bought, by demographics, July 2012 .......................................... 78 Figure 66: Other baby products bought, by demographics, July 2012 .............................................................. 79 Figure 67: Brands of disposable nappies bought, July 2012 ............................................................................. 80 Figure 68: Most popular brands of disposable nappies bought, by demographics, July 2012 ........................... 80 Figure 69: Next most popular brands of disposable nappies bought, by demographics, July 2012................... 81 Figure 70: Other brands of disposable nappies bought, by demographics, July 2012 ...................................... 82 Figure 71: Attitudes towards nappies, July 2012 .............................................................................................. 83 Figure 72: Most popular attitudes towards nappies, by demographics, July 2012............................................. 83 Figure 73: Next most popular attitudes towards nappies, by demographics, July 2012 .................................... 84 Figure 74: How the child is fed, July 2012 ........................................................................................................ 85 Figure 75: Most popular how the child is fed, by demographics, July 2012....................................................... 85 Figure 76: Next most popular how the child is fed, by demographics, July 2012 .............................................. 86 Figure 77: Brand of infant formula used, July 2012 ........................................................................................... 87 Figure 78: Most popular brand of infant formula used, by demographics, July 2012 ......................................... 87 Figure 79: Next most popular brand of infant formula used, by demographics, July 2012 ................................ 88 Figure 80: Items used to transport the child, July 2012 ..................................................................................... 89 Figure 81: Car seat/booster car seats used to transport the child, by demographics, July 2012 ....................... 89 Figure 82: Pushchair/buggy used to transport the child, by demographics, July 2012 ...................................... 90 Figure 83: Sling used to transport the child, by demographics, July 2012......................................................... 91 Figure 84: Back carriers used to transport the child, by demographics, July 2012 ............................................ 92 Figure 85: Travel cot used to transport the child, by demographics, July 2012 ................................................. 93 Figure 86: Attitudes towards transport of the child, July 2012 ........................................................................... 93 Figure 87: Most popular attitudes towards transport of the child, by demographics, July 2012 ......................... 94
APPENDIX – EDUCATION OF LITTLE EMPERORS .......................................................................... 95
Figure 88: Type of degree intended for child, by demographics, July 2012 ...................................................... 95 Figure 89: Type of school the child attends, by demographics, July 2012 ........................................................ 96 Figure 90: Most popular additional classes paid for, by demographics, July 2012 ............................................ 97 Figure 91: Next most popular additional classes paid for, by demographics, July 2012 .................................... 98 Figure 92: Most popular willingness to fund the child’s studies abroad, by demographics, July 2012 ............... 99 Figure 93: Most popular financial impact of child’s education, by demographics, July 2012 ........................... 100
Table of contents Marketing to Children China, November 2012
© Mintel Group Ltd. All rights reserved. vi
Figure 94: Next most popular financial impact of child’s education, by demographics, July 2012 ................... 101 Figure 95: Agreement with the statements ‘Independence is an important treat a child has to learn’ and ‘I am teaching trying to teach my child to be independent’, by demographics, July 2012 .................................. 102 Figure 96: Agreement with the statements ‘I would like to offer my child a carefree childhood free from pressure’ and ‘I don’t want my child to feel pressured all the time’, by demographics, July 2012 ................... 103 Figure 97: Agreement with the statements ‘I want my child to focus on its education instead of wasting time on activities such as watching TV’ and ‘Study is the most important activity for my child’, by demographics, July 2012 ........................................................................................................................................................ 104 Figure 98: Agreement with the statements ‘If I want to buy something for myself, I first check if I cannot better spend that money on my child’ and ‘I am concerned about my child’s ability to live independently after it leaves home’, by demographics, July 2012 ......................................................................................... 105 Figure 99: Agreement with the statements ‘My child has a significant influence on household decisions ie what food is bought, where to go on holiday etc’ and ‘I need to purchase a property for my child before he/she gets married’, by demographics, July 2012 ......................................................................................... 106 Figure 100: Agreement with the statements ‘I am worried about our financial situation if I try to fulfil all my child’s needs’ and ‘I cut back on household expenditures to pay for items my child would like to have’, by demographics, July 2012 ................................................................................................................................ 107 Figure 101: Agreement with the statements ‘I want my child to pursue the career that we as parents have chosen for him/her’ and ‘My child will always be able to rely on us financially independent of his/her age’, by demographics, July 2012 ........................................................................................................................... 108 Figure 102: Agreement with the statement ‘I am likely to struggle financially once my child grows older’, by demographics, July 2012 ................................................................................................................................ 109 Figure 103: Most popular attitudes towards the child’s development and financial burden (any agree), by demographics, July 2012 ................................................................................................................................ 110 Figure 104: Next most popular attitudes towards the child’s development and financial burden (any agree), by demographics, July 2012 ........................................................................................................................... 111 Figure 105: Other attitudes towards the child’s development and financial burden (any agree), by demographics, July 2012 ................................................................................................................................ 112
APPENDIX – SPENDING POWER OF LITTLE EMPERORS ............................................................ 113
Figure 106: The child’s income, by demographics, July 2012 ......................................................................... 113 Figure 107: Condition monthly allowance is based on, by demographics, July 2012 ...................................... 114 Figure 108: Savings account set up for child, by demographics, July 2012 .................................................... 115 Figure 109: Insurance policies set up for child, by demographics, July 2012 .................................................. 116 Figure 110: Type of degree intended for child, by demographics, July 2012 .................................................. 117 Figure 111: Type of school the child attends, by demographics, July 2012 .................................................... 118 Figure 112: Most popular additional classes paid for, by demographics, July 2012 ........................................ 119 Figure 113: Next most popular additional classes paid for, by demographics, July 2012 ................................ 120 Figure 114: Most popular willingness to fund the child’s studies abroad, by demographics, July 2012 ........... 121 Figure 115: Most popular financial impact of child’s education, by demographics, July 2012 ......................... 122 Figure 116: Next most popular financial impact of child’s education, by demographics, July 2012 ................. 123 Figure 117: Agreement with the statements ‘Independence is an important treat a child has to learn’ and ‘I am teaching trying to teach my child to be independent’, by demographics, July 2012 .................................. 124 Figure 118: Agreement with the statements ‘I would like to offer my child a carefree childhood free from pressure’ and ‘I don’t want my child to feel pressured all the time’, by demographics, July 2012 ................... 125 Figure 119: Agreement with the statements ‘I want my child to focus on its education instead of wasting time on activities such as watching TV’ and ‘Study is the most important activity for my child’, by demographics, July 2012 ................................................................................................................................ 126 Figure 120: Agreement with the statements ‘If I want to buy something for myself, I first check if I cannot better spend that money on my child’ and ‘I am concerned about my child’s ability to live independently after it leaves home’, by demographics, July 2012 ......................................................................................... 127 Figure 121: Agreement with the statements ‘My child has a significant influence on household decisions ie what food is bought, where to go on holiday etc’ and ‘I need to purchase a property for my child before he/she gets married’, by demographics, July 2012 ......................................................................................... 128 Figure 122: Agreement with the statements ‘I am worried about our financial situation if I try to fulfil all my child’s needs’ and ‘I cut back on household expenditures to pay for items my child would like to have’, by demographics, July 2012 ................................................................................................................................ 129 Figure 123: Agreement with the statements ‘I want my child to pursue the career that we as parents have chosen for him/her’ and ‘My child will always be able to rely on us financially independent of his/her age’, by demographics, July 2012 ........................................................................................................................... 130 Figure 124: Agreement with the statement ‘I am likely to struggle financially once my child grows older’, by demographics, July 2012 ................................................................................................................................ 131 Figure 125: Most popular attitudes towards the child’s development and financial burden (any agree), by demographics, July 2012 ................................................................................................................................ 132 Figure 126: Next most popular attitudes towards the child’s development and financial burden (any agree), by demographics, July 2012 ........................................................................................................................... 133
Table of contents Marketing to Children China, November 2012
© Mintel Group Ltd. All rights reserved. vii
Figure 127: Other attitudes towards the child’s development and financial burden (any agree), by demographics, July 2012 ................................................................................................................................ 134
APPENDIX – FAMILY SPENDING HABITS ...................................................................................... 135
Figure 128: Most popular branded children’s clothing bought, by demographics, July 2012 ........................... 135 Figure 129: Next most popular branded children’s clothing bought, by demographics, July 2012 .................. 136 Figure 130: Sportswear brands bought for child, July 2012 ............................................................................ 137 Figure 131: Most popular sportswear brands bought for child, by demographics, July 2012 .......................... 137 Figure 132: Next most popular sportswear brands bought for child, by demographics, July 2012 .................. 138 Figure 133: Most popular attitudes towards child’s clothing, by demographics, July 2012 .............................. 139 Figure 134: Next most popular attitudes towards child’s clothing, by demographics, July 2012 ...................... 140 Figure 135: Most popular products in child’s possession, by demographics, July 2012 .................................. 141 Figure 136: Next most popular products in child’s possession, by demographics, July 2012 .......................... 142 Figure 137: Other products in child’s possession, by demographics, July 2012 ............................................. 143 Figure 138: Brand of smartphone owned by child, July 2012 .......................................................................... 144 Figure 139: Most popular monthly discretionary expenditure, by demographics, July 2012 ............................ 144 Figure 140: Next most popular monthly discretionary expenditure, by demographics, July 2012 ................... 145 Figure 141: Other monthly discretionary expenditure, by demographics, July 2012 ....................................... 146 Figure 142: What monthly income is spent on, July 2012 ............................................................................... 147 Figure 143: Most popular what monthly income is spent on, by demographics, July 2012 ............................. 148 Figure 144: Next most popular what monthly income is spent on, by demographics, July 2012 ..................... 149
APPENDIX – FAMILY LEISURE AND HOLIDAY HABITS................................................................ 150
Figure 145: Holidays taken in the past 12 months, July 2012 ......................................................................... 150 Figure 146: Most popular any holidays taken in the past 12 months, by demographics, July 2012................. 151 Figure 147: Next most popular any holidays taken in the past 12 months, by demographics, July 2012 ........ 152 Figure 148: Other any holidays taken in the past 12 months, by demographics, July 2012 ............................ 153 Figure 149: Leisure activities, July 2012 ......................................................................................................... 154
APPENDIX – A DAY IN THE LIFE OF A LITTLE EMPEROR ........................................................... 155
Figure 150: A child’s day – overview, July 2012 ............................................................................................. 155 Figure 151: A child’s day – overview, July 2012 ............................................................................................. 155 Figure 152: People the child spends time with, July 2012............................................................................... 155 Figure 153: Attitudes towards children’s discipline and upbringing, July 2012 ................................................ 156
APPENDIX: CHINA RESEARCH METHODOLOGY .......................................................................... 159

Introduction Marketing to Children China, November 2012
© Mintel Group Ltd. All rights reserved. 8
Introduction More than eight in ten Chinese families in tier 1 and tier 2 cities now have only one child, the so-called
“Little Emperor”. As parents don’t get a second chance to conceive, the pressure not to fail in raising
their only child is intense. It created the now infamous images of the rather stereotypical, but not
wholly inaccurate, representation of ‘Tiger Mums’. These mothers tend to be hyper-involved in all
aspects of their children’s upbringing and push their Little Emperors towards academic success, even
at the expense of their leisure time.
This pressure to succeed leads to a heavy investment in babies and young children, in order to improve
their education, career and future earnings prospects, whilst also catering to their every need.
However, as a result of mollycoddling, children develop expectations of their own as to what they
should be provided with as they grow up.
This report delves into how the modern urban Chinese middle class family operates and structures
itself around the single child, which is crucial to understanding how to design, market and sell a range
of products and services to this important consumer segment. Quite simply, brands and manufacturers
ignore the Little Emperor at their peril.
Methodology
Mintel conducted online consumer research in July 2012 on a sample of 1,500 internet users aged 20-
49 who are classified as middle class with one child aged under 16.
Definitions
Research carried out for this report identifies members of the middle class by the following
characteristics:
Minimum Personal income: RMB7,000 (US$1,110) per month in tier 1 cities; Minimum
RMB5,000 (US$793) per month in tier 2 cities
Minimum Family income: RMB15,000 (US$2,379) per month in tier 1 cities; Minimum
RMB10,000 (US$1,586) per month in tier 2 cities
Profession: white-collar office workers in either state or private business, self-employed or SME
business owners
Education: college level degree holders or above
Assets: property owners (must own property or be paying mortgage on a property)
Own a car.
Introduction Marketing to Children China, November 2012
© Mintel Group Ltd. All rights reserved. 9
To ensure that we dealt with those middle class Chinese who were part of sizeable middle-income
communities and so could display shared patterns of consumption rather than being the exception
within their immediate community, we only surveyed consumers in Shanghai, Beijing, Guangzhou,
Chengdu and Nanjing. So, for instance, cities such as Xian or Hefei were excluded as, although there
are middle-income consumers in these cities, they do not have the number or spread of retailers,
brands and services to compare with those cities chosen as yet. We have also excluded cities where
many middle-income people live, such as Shenzhen and Dongguan, on the grounds that they are
majority transient/migratory manufacturing cities and so skew survey results and do not really
represent a settled middle class community.
Executive Summary Marketing to Children China, November 2012
© Mintel Group Ltd. All rights reserved. 10
Executive Summary “China’s ‘Little Emperors’ are the youth of the country’s nascent emerging middle class.
Growing up in families with higher-than-average discretionary incomes, no siblings and active
grandparents, they are the beneficiaries of rising expenditure on children. However, a rigid
education system and a heavy burden of expectation means that they are under pressure to
succeed while the absence of ‘second chance parenting’ leads many parents to seek to protect
their child through spending on items that they believe will safeguard their future.”
– Matthew Crabbe, Research Director, Mintel Asia-Pacific
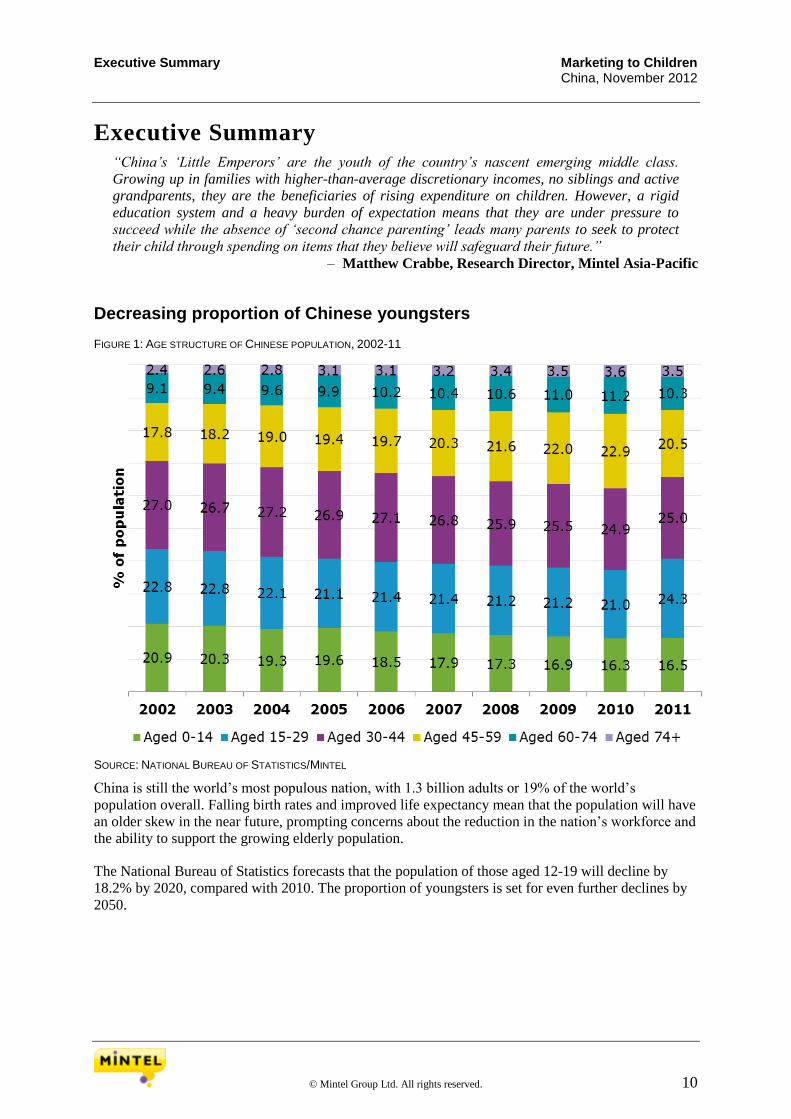
Decreasing proportion of Chinese youngsters FIGURE 1: AGE STRUCTURE OF CHINESE POPULATION, 2002-11
SOURCE: NATIONAL BUREAU OF STATISTICS/MINTEL
China is still the world’s most populous nation, with 1.3 billion adults or 19% of the world’s
population overall. Falling birth rates and improved life expectancy mean that the population will have
an older skew in the near future, prompting concerns about the reduction in the nation’s workforce and
the ability to support the growing elderly population.
The National Bureau of Statistics forecasts that the population of those aged 12-19 will decline by
18.2% by 2020, compared with 2010. The proportion of youngsters is set for even further declines by
2050.
Executive Summary Marketing to Children China, November 2012
© Mintel Group Ltd. All rights reserved. 11
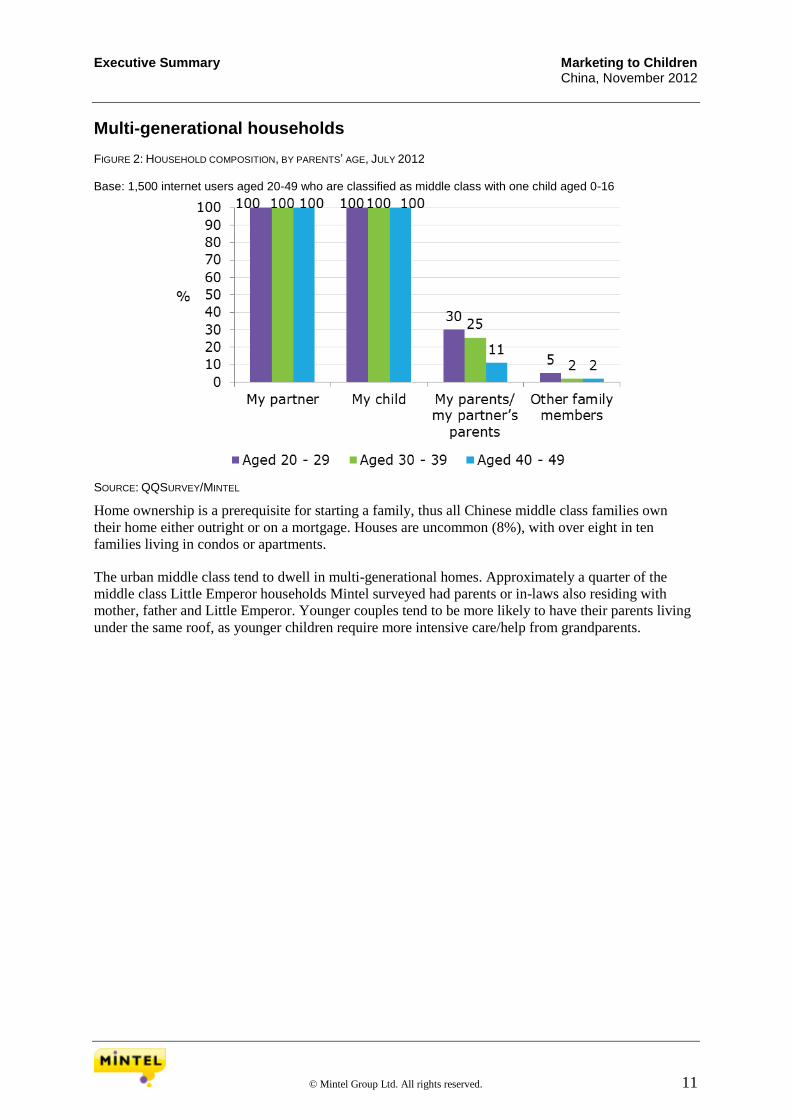
Multi-generational households FIGURE 2: HOUSEHOLD COMPOSITION, BY PARENTS’ AGE, JULY 2012 Base: 1,500 internet users aged 20-49 who are classified as middle class with one child aged 0-16
SOURCE: QQSURVEY/MINTEL
Home ownership is a prerequisite for starting a family, thus all Chinese middle class families own
their home either outright or on a mortgage. Houses are uncommon (8%), with over eight in ten
families living in condos or apartments.
The urban middle class tend to dwell in multi-generational homes. Approximately a quarter of the
middle class Little Emperor households Mintel surveyed had parents or in-laws also residing with
mother, father and Little Emperor. Younger couples tend to be more likely to have their parents living
under the same roof, as younger children require more intensive care/help from grandparents.
Executive Summary Marketing to Children China, November 2012
© Mintel Group Ltd. All rights reserved. 12
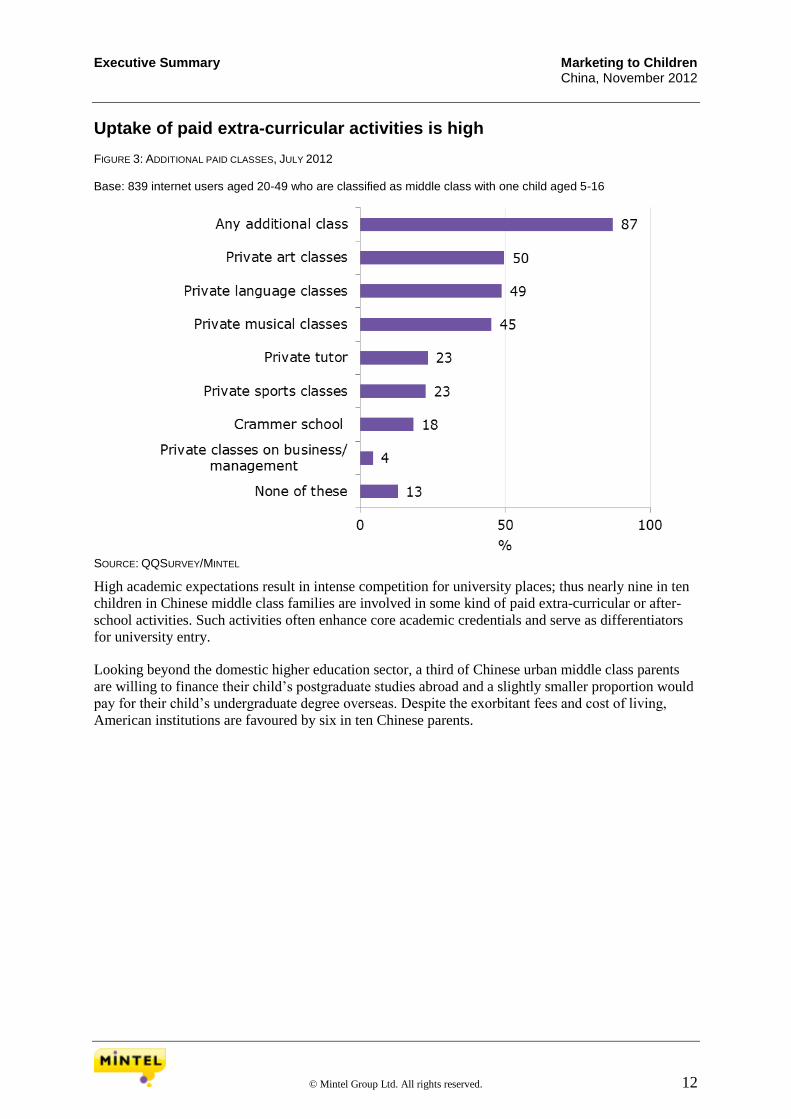
Uptake of paid extra-curricular activities is high FIGURE 3: ADDITIONAL PAID CLASSES, JULY 2012 Base: 839 internet users aged 20-49 who are classified as middle class with one child aged 5-16
SOURCE: QQSURVEY/MINTEL
High academic expectations result in intense competition for university places; thus nearly nine in ten
children in Chinese middle class families are involved in some kind of paid extra-curricular or after-
school activities. Such activities often enhance core academic credentials and serve as differentiators
for university entry.
Looking beyond the domestic higher education sector, a third of Chinese urban middle class parents
are willing to finance their child’s postgraduate studies abroad and a slightly smaller proportion would
pay for their child’s undergraduate degree overseas. Despite the exorbitant fees and cost of living,
American institutions are favoured by six in ten Chinese parents.

Executive Summary Marketing to Children China, November 2012
© Mintel Group Ltd. All rights reserved. 13
Nearly half of Little Emperors get pocket money from grandparents FIGURE 4: SOURCES OF CHILD’S POCKET MONEY, JULY 2012 Base: 839 internet users aged 20-49 who are classified as middle class with one child aged 5-16
SOURCE: QQSURVEY/MINTEL
Nearly all Little Emperors receive a monthly allowance, with older parents and in particular mums
aged 40-49 being the most generous with their offspring (98%). This is likely owing to the fact that
parents in this age group are considerably wealthier compared with the younger ones.
The six-pocket phenomenon comes to the fore in this instance, with grandparents highly likely to chip
in (50%), whilst other family members also play their part (20%).
Amount of monthly pocket money is positively correlated with household income. In addition,
families living in Beijing (China’s most affluent city) appear to be the most generous with their Little
Emperors, as over three in ten (31%) give their children pocket money in excess of RMB500 a month.

Executive Summary Marketing to Children China, November 2012
© Mintel Group Ltd. All rights reserved. 14
Necessities are prioritised FIGURE 5: WHAT MONTHLY INCOME IS SPENT ON AVERAGE, JULY 2012 Base: 1,500 internet users aged 20-49 who are classified as middle class with one child aged 0-16
NB: housing includes mortgage, bills, home maintenance, Food and drink includes all food and drink expenditures in and out of home, Transport includes car fuel, train fares, Finance includes monthly saving, insurances, account fees, Leisure, Entertainment and Technology for your household includes electronic gadgets, dining out, theatre tickets, Holidays and travel includes airplane tickets, hotel fees, Spending on the child includes costs for education, afternoon classes, treats, clothes SOURCE: QQSURVEY/MINTEL
Chinese middle class families invest the largest share of their monthly disposable income on savings,
investments and financial products (17%) to provide for pensions, healthcare and educations etc.
Over a tenth (11%) of monthly incomes is spent on the needs of children, with younger parents (aged
20-29), who tend to have lower disposable incomes, spending proportionately more (15%). In
particular, as the main income providers, males aged 20-29 are especially likely to contribute nearly a
fifth of their incomes, at 19%.
Executive Summary Marketing to Children China, November 2012
© Mintel Group Ltd. All rights reserved. 15
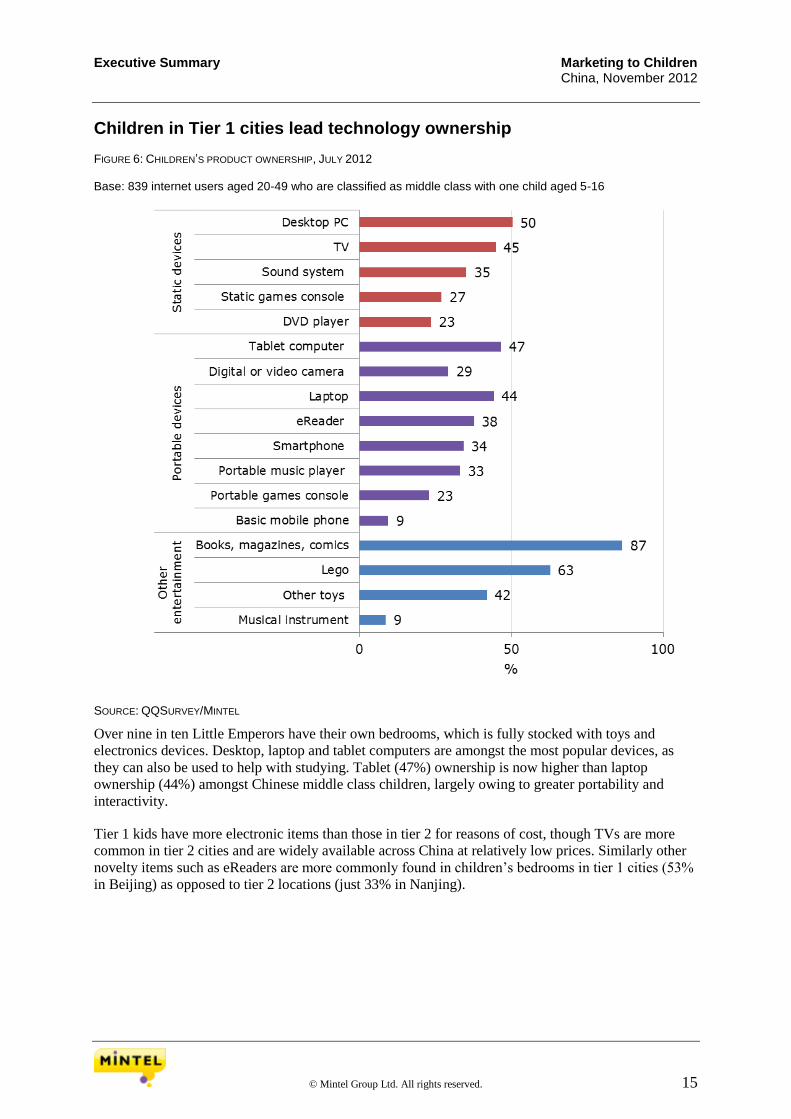
Children in Tier 1 cities lead technology ownership FIGURE 6: CHILDREN’S PRODUCT OWNERSHIP, JULY 2012 Base: 839 internet users aged 20-49 who are classified as middle class with one child aged 5-16
SOURCE: QQSURVEY/MINTEL
Over nine in ten Little Emperors have their own bedrooms, which is fully stocked with toys and
electronics devices. Desktop, laptop and tablet computers are amongst the most popular devices, as
they can also be used to help with studying. Tablet (47%) ownership is now higher than laptop
ownership (44%) amongst Chinese middle class children, largely owing to greater portability and
interactivity.
Tier 1 kids have more electronic items than those in tier 2 for reasons of cost, though TVs are more
common in tier 2 cities and are widely available across China at relatively low prices. Similarly other
novelty items such as eReaders are more commonly found in children’s bedrooms in tier 1 cities (53%
in Beijing) as opposed to tier 2 locations (just 33% in Nanjing).

Executive Summary Marketing to Children China, November 2012
© Mintel Group Ltd. All rights reserved. 16
A day in the life of a Little Emperor FIGURE 7: A CHILD’S DAY – AVERAGE TIME SPENT ON EACH ACTIVITY, JULY 2012 Base: 839 internet users aged 20-49 who are classified as middle class with one child aged 5-16
SOURCE: QQSURVEY/MINTEL
Commuting to school, classes, extra-curricular activities and homework take up on average eight hours
each day, meaning that a large chunk of a Little Emperor’s day is spent on activities related to their
education. This is hardly surprising, considering that six in ten parents indicate that they want their
child to focus on studying rather than wasting their time on things like watching TV.
As mothers and fathers are typically the ones most heavily involved in taking care of their offspring, it
makes sense that parents and family tend to spend 10% of their time with their Little Emperor.

Market Background Marketing to Children China, November 2012
© Mintel Group Ltd. All rights reserved. 17
Market Background
Key points
The emergence of the Little Emperors is directly linked to the high proportion of one-child
families in China.
Growth in the Chinese middle class gave rise to increased consumption and rising
aspirations towards product ownership, further fuelling the trend of families catering to the
wishes of their only children.
Lower age of retirement (between 50 and 55) amongst Chinese women paves a way for
grandparents to get involved in child caring as well as spending on their Little Emperor
grandchildren.
How the phenomenon of The Little Emperors emerged
China’s so-called Little Emperors are the generation of single children born largely in the 1990s and
2000s. The term ‘Little Emperor Syndrome’ came to be widely used in China in the 1990s to describe
those single children who appeared to be the recipients of excessive amounts of attention from their
parents and grandparents.
Although China had enacted the One-Child Policy in 1979, it was not really until the 1990s that a
Chinese urban middle class with significant amounts of disposable income came into existence in the
country’s tier 1 and tier 2 cities able to lavish spending and attention on their single children. In
essence, the Little Emperors were the result of a combination of the One-Child Policy twinned with the
rise of a substantial middle class in urban China (see Mintel’s Consumer Lifestyles: China’s Middle
Class – China, June 2012).
Market Background Marketing to Children China, November 2012
© Mintel Group Ltd. All rights reserved. 18
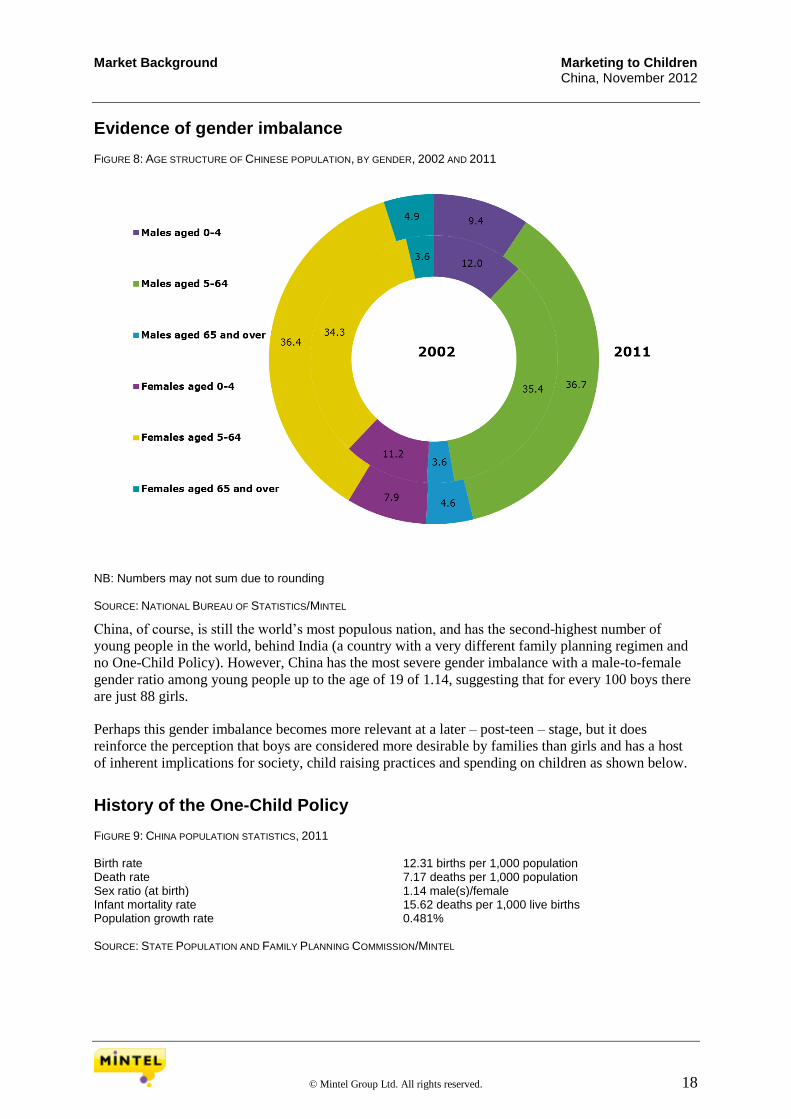
Evidence of gender imbalance FIGURE 8: AGE STRUCTURE OF CHINESE POPULATION, BY GENDER, 2002 AND 2011
NB: Numbers may not sum due to rounding SOURCE: NATIONAL BUREAU OF STATISTICS/MINTEL
China, of course, is still the world’s most populous nation, and has the second-highest number of
young people in the world, behind India (a country with a very different family planning regimen and
no One-Child Policy). However, China has the most severe gender imbalance with a male-to-female
gender ratio among young people up to the age of 19 of 1.14, suggesting that for every 100 boys there
are just 88 girls.
Perhaps this gender imbalance becomes more relevant at a later – post-teen – stage, but it does
reinforce the perception that boys are considered more desirable by families than girls and has a host
of inherent implications for society, child raising practices and spending on children as shown below.
History of the One-Child Policy FIGURE 9: CHINA POPULATION STATISTICS, 2011 Birth rate 12.31 births per 1,000 population Death rate 7.17 deaths per 1,000 population Sex ratio (at birth) 1.14 male(s)/female Infant mortality rate 15.62 deaths per 1,000 live births Population growth rate 0.481% SOURCE: STATE POPULATION AND FAMILY PLANNING COMMISSION/MINTEL

Market Background Marketing to Children China, November 2012
© Mintel Group Ltd. All rights reserved. 19
China’s One-Child Policy was launched in 1979 after the population topped 1 billion. China's fertility
rate dropped from 5.8 children per woman in 1970 to 2.7 in 1978 and the government believes the
One-Child Policy curtailed population growth by preventing 400 million extra births (approximately
the total population of China in 1937).
In some circumstances, families are exempt from the One-Child Policy and today, only 20% of
children under 14 are from single-child families according to the State Population and Family Planning
Commission (SPFPC). However, the policy has been most effective in cities rather than the
countryside and consequently the number of one-child families is far higher, at above 80% in most tier
1 and 2 cities.
In urban China, residents have faced heavy fines and can lose their jobs if they have a second child.
Many increasingly financially stretched couples now prefer fewer children and cannot afford, nor have
room for, any more. But in the countryside, where parents depend on children to help them and
support them in their old age, there is still a preference for multiple children. Rural families in China
have been targeted with inventive campaigns to encourage family planning, including being paid not to
have more children, or campaigns in the countryside attempting to appeal to fledgling entrepreneurs.
Exceptions to the One-Child Policy FIGURE 10: URBAN EXEMPTIONS TO THE ONE-CHILD POLICY, 2011* If both parents are from one-child families – ie both are single children Both parents are university graduates The first child is severely handicapped or disabled An RMB50,000 (US$8,000) fee is paid (applies to migrants to urban areas) A Chinese citizen is married to a foreigner Twins Adoption Registered as an official category of ethnic minority (小数民族xiaoshu minzu – and therefore exempt entirely from the One-Child Policy) * these exemptions change and are added to regularly as the government will not lift the policy in one go to prevent future expensive “spikes” in demand for education and healthcare services. Additionally, though not overly significant in overall terms, many Chinese women have been giving birth to their second child overseas, especially in Hong Kong, which is exempt from the One-Child Policy SOURCE: STATE POPULATION AND FAMILY PLANNING COMMISSION/MINTEL
China’s rapidly changing demographic profile with a falling birth rate and enhanced longevity
suggests that the country’s population pyramid will increasingly trend towards an older society in the
coming decades. The National Bureau of Statistics has indicated that it expects that China’s population
of 12-19-year-olds will drop by a significant 18.2% over 2010 by 2020. China’s teenage population is
set to decline further still to approximately 9.1% of the total population in 2050, from 13.8% today.
The government has introduced various exemptions to the One-Child Policy in China’s major cities
(though to a far lesser extent in the countryside). Despite this it seems that the Little Emperor-led
model three-person household will remain the dominant form of family unit for some time to come
among the rising urban middle class – a Shanghai Academy of Social Sciences survey in 2011 found
that over 90% of Shanghai couples are now eligible to have more than one child, but that 45% of
families had ruled it out as an option due to cost, apartment size and that they were simply used to
three-person families.

Market Background Marketing to Children China, November 2012
© Mintel Group Ltd. All rights reserved. 20
One child, six incomes
In essence the Little Emperors (小皇帝xiao huangdi) were the result of the One-Child Policy twinned
with the rise of a substantial middle class in urban China with greater rates of disposable income to
spend. The traditional preponderance in urban areas for women to work (an over 70% female labour
force participation rate in China’s major cities) means many middle class families with one child now
have two sources of income while a combination of increased longevity and low retirement ages, by
international standards, means many Little Emperors have four active and supportive grandparents.
This led to the so-called ‘six-pocket syndrome’, or the ‘four-two-one’ family structure, with six
disposable incomes available to be lavished on the one child. This is, of course, a change in the
traditional family structure in China – based on the Confucian system and extended in nature – of
power in a household being devolved in a patrilineal form from the father, to the mother and a
multitude of offspring with supporting aunts, uncles and grandparents. Invariably now in urban middle
class China the modern household structures entirely around the regulation one child – the Little
Emperor.
This greater devotion of spending on one child, and the general funnelling of financial resources
downwards within the family, is significant to the development of China’s urban consumer market
overall. In many obvious categories, from toys to snacks and gadgets to children’s clothes, parents
shower their single child with material goods and give in to every demand from their offspring; it is
not uncommon for children to be the ‘best-dressed members of their families’. Data collected
exclusively for this report show that nearly two thirds of Chinese parents agree that if their child wants
an item of clothing they would generally purchase it, and over a quarter want to buy the best brands for
their only child (see Family Spending Habits section).
National Bureau of Statistics’ forecasts expect China’s teenage per capita disposable income to rise to
about RMB10,500 (US$1,665) by 2014. That equals to an estimated RMB875 (US$139) per month,
not including what their families spend on them. This is approximately 10% of a tier 1 household
average income and it seems likely that any amounts given to children by parents are being added to
and supplemented by contributions from grandparents and other family members.
Little Emperors have been influential in many other areas of family spend – where the family eats out,
goes on holiday, the car they purchase, etc. This can be due to excessive pandering to the child’s wants
and desires or simply giving in to pester power. It is also the case that, while high expectations to
succeed are placed upon the single child, there are also high expectations on the parents to provide. For
example, Mintel data show that nearly six in ten (58%) Chinese parents started saving early for their
children’s education, in order to be able to afford to send them to the best university (see Spending
Power of Little Emperors section).
The emergence of the middle class
The Little Emperor phenomenon would not have been possible without the rise of a Chinese urban
middle class, undoubtedly the biggest driver of much of the growth of consumption in China.
Mintel defines the Chinese middle class as those people who are urban, invariably white-collar
workers and have a household income of approximately US$9,000-30,000. As of 2011 there were
about 30 million households in China falling into the middle class description – that’s approximately
13.5% of all urban households in China.
Market Background Marketing to Children China, November 2012
© Mintel Group Ltd. All rights reserved. 21
Given that a household is typically mum, dad and a Little Emperor, that makes the middle class
roughly 100 million people. Above that there are higher earners – Golden Collars – adding a few
million more (including their own Little Emperors) and below that those now considered 小康xiaokang
(or “comfortable”) who hope to move up into the middle class and raise their own Little Emperors
with them.
With current wage growth, urbanisation and rising living costs, we expect the number of middle class
households to comfortably break the 35 million mark by 2015 – making approximately 15% of urban
Chinese middle class households totalling 105 million people.
Assuming the average and dominant household structure to be three people, this means there are
approximately 35 million Little Emperors in the middle class, plus an undefined number in the Golden
Collar social class and a fledgling group of Little Emperors in the xiaokang social class. This would
roughly add up to an estimated 50 million or more Little Emperors.
Early retirement leads to active involvement of grandparents
According to China’s National Bureau of Statistics, women (who constitute fully 48.5% of China’s
total population) tend to be employed if of working age. Over seven in ten urban women aged 18-64
are employed and the employment rate of mothers aged 25-34 with a child under the age of 6 is 72%.
This is higher than many other developing and developed countries and means that ‘stay-at-home’
mothers are rare.
The retirement age for women in China is low by international standards. The mandatory statutory
retirement age for women in the private sector is 50 years of age for non-managerial positions and 55
years of age for managerial roles.
Life expectancy is improving and in 2011 it was 72.82 years for males and 77.11 years for females,
whilst the mean age of marriage for women in China is now 24 years old with children coming, on
average, within the next three years.
All of the above means that urban women marry relatively young, overwhelmingly have one child
while in their later twenties and have parents who have retired at 50/55 (or 60 universally for males).
This means that grandparents are taking on a large part of childrearing and are intimately involved in
the development of their grandchild, with many assuming the routine primary care responsibility and
much of the spending associated with those early years.
Current Living Situation Marketing to Children China, November 2012
© Mintel Group Ltd. All rights reserved. 22
Current Living Situation
Key points
Home ownership is viewed as a prerequisite for starting a family, thus all Chinese middle
class families own their primary residence, with nearly six in ten owning it outright.
Grandparents play an increasingly important role in children’s upbringing, especially as the
costs of hiring domestic help are becoming less affordable. This is especially true of younger
parents aged 20-29, three in ten of whom have their grandparents living with them.
Over nine in ten Little Emperors have their own room, which could improve their
concentration, but could also require more supervision from parents or grandparents, or
domestic help in their absence.
Only under a quarter of Chinese middle class households have no plans for hiring help
around the house, with the tendency to have domestic helpers rising substantially with
household incomes.
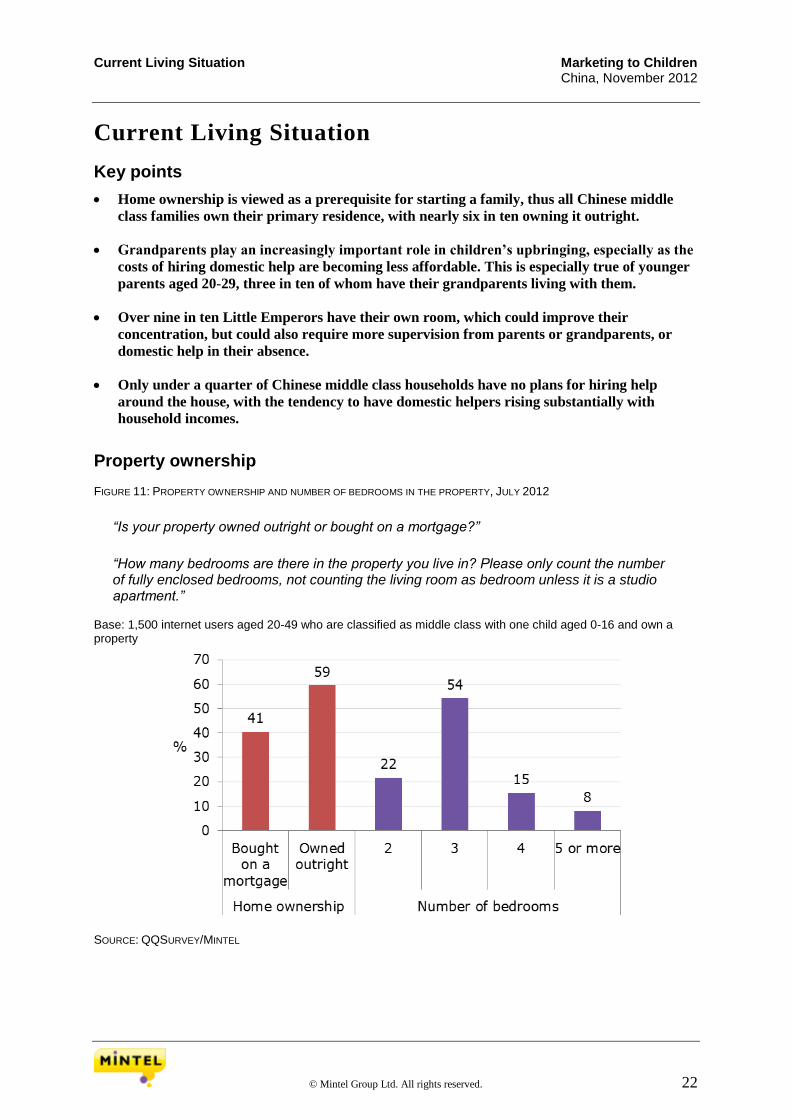
Property ownership FIGURE 11: PROPERTY OWNERSHIP AND NUMBER OF BEDROOMS IN THE PROPERTY, JULY 2012
“Is your property owned outright or bought on a mortgage?”
“How many bedrooms are there in the property you live in? Please only count the number of fully enclosed bedrooms, not counting the living room as bedroom unless it is a studio apartment.”
Base: 1,500 internet users aged 20-49 who are classified as middle class with one child aged 0-16 and own a property
SOURCE: QQSURVEY/MINTEL
Current Living Situation Marketing to Children China, November 2012
© Mintel Group Ltd. All rights reserved. 23
Given the expectations that home ownership is a prerequisite for marriage and having children, all
middle class families own their homes, with the majority (59%) buying their property outright. This is
especially evident amongst families with the highest level of household income (RMB25,000+), at
73%.
Over half (54%) residences occupied by the Chinese middle class families have three bedrooms and a
further 23% have four or more bedrooms, allowing children, grandparents and any live-in domestic
helpers to get their own space. The higher the income, the more spacious is the home a family can
afford, with over a third (36%) of households with incomes in excess of RMB25,000 who have four
bedrooms or more in their home.
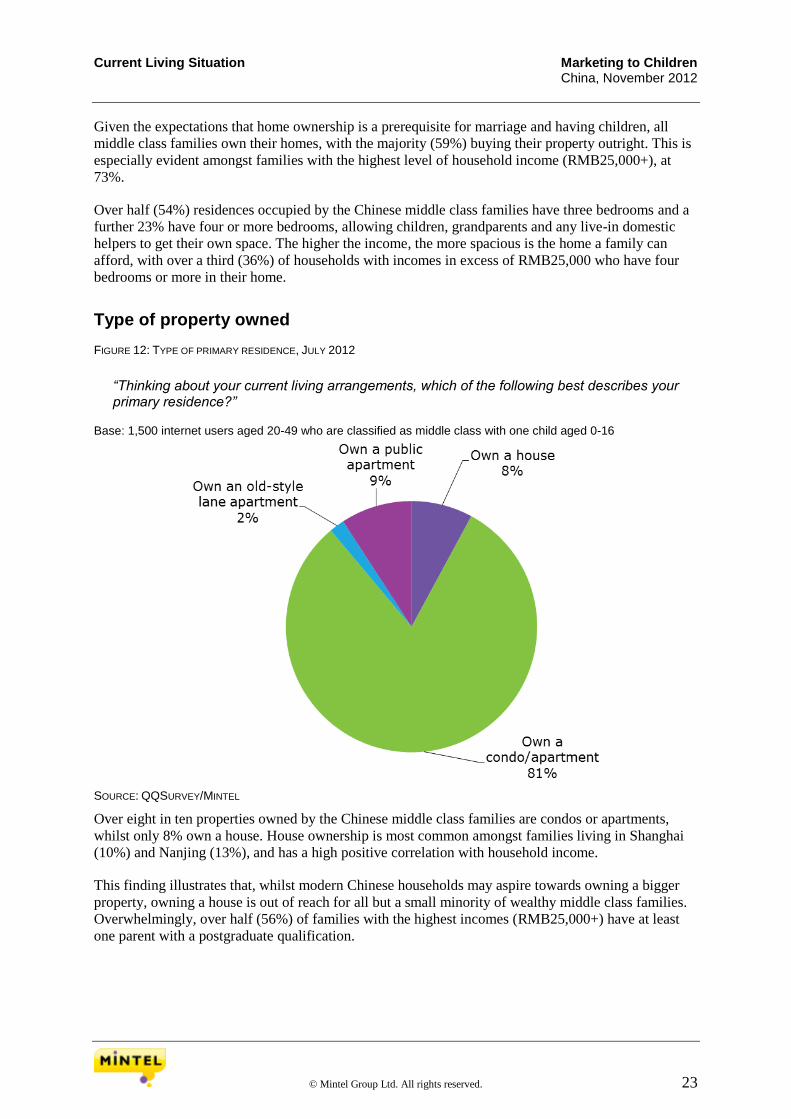
Type of property owned FIGURE 12: TYPE OF PRIMARY RESIDENCE, JULY 2012
“Thinking about your current living arrangements, which of the following best describes your primary residence?”
Base: 1,500 internet users aged 20-49 who are classified as middle class with one child aged 0-16
SOURCE: QQSURVEY/MINTEL
Over eight in ten properties owned by the Chinese middle class families are condos or apartments,
whilst only 8% own a house. House ownership is most common amongst families living in Shanghai
(10%) and Nanjing (13%), and has a high positive correlation with household income.
This finding illustrates that, whilst modern Chinese households may aspire towards owning a bigger
property, owning a house is out of reach for all but a small minority of wealthy middle class families.
Overwhelmingly, over half (56%) of families with the highest incomes (RMB25,000+) have at least
one parent with a postgraduate qualification.
Current Living Situation Marketing to Children China, November 2012
© Mintel Group Ltd. All rights reserved. 24
This sheds a light on just how important higher educational attainment is in modern Chinese society. It
also puts into perspective parents’ adamant desire for their children to go to a good university and
succeed academically. Mintel data show that nearly six in ten (58%) parents started saving money for
their children’s education early on, and over half (56%) are prepared to spend a significant amount of
money to ensure their children compete with the best academically (see Education of Little Emperors).
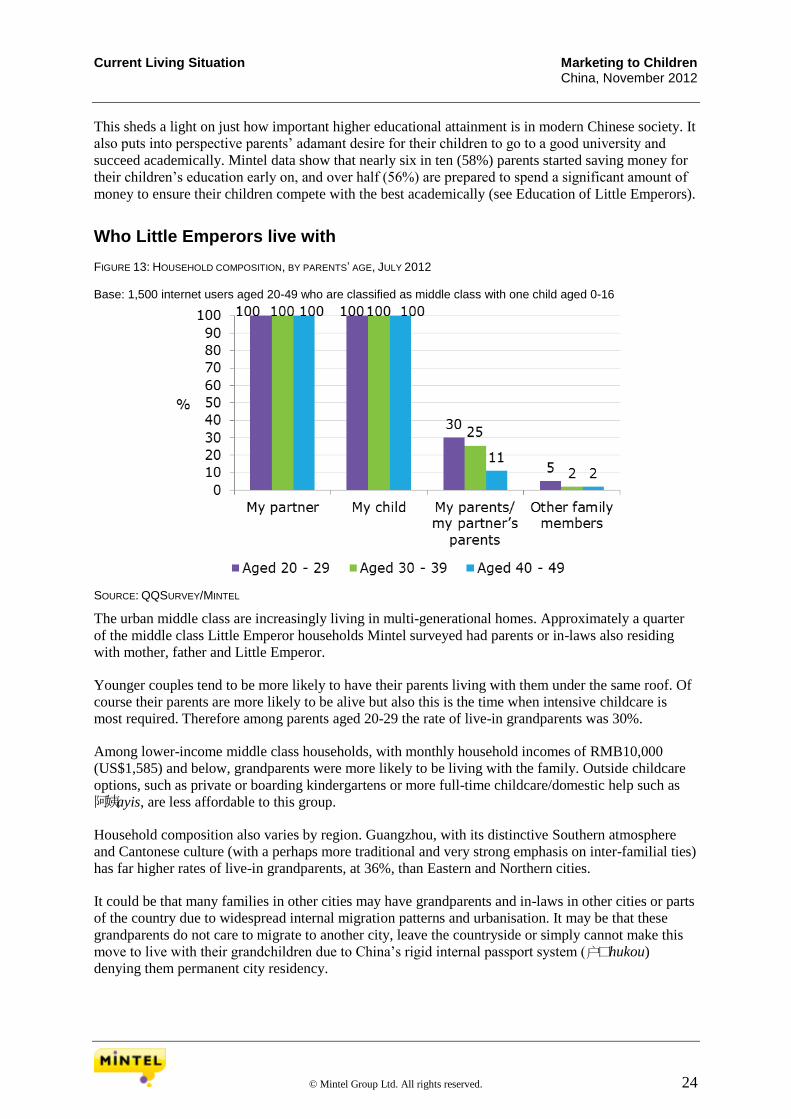
Who Little Emperors live with FIGURE 13: HOUSEHOLD COMPOSITION, BY PARENTS’ AGE, JULY 2012 Base: 1,500 internet users aged 20-49 who are classified as middle class with one child aged 0-16
SOURCE: QQSURVEY/MINTEL
The urban middle class are increasingly living in multi-generational homes. Approximately a quarter
of the middle class Little Emperor households Mintel surveyed had parents or in-laws also residing
with mother, father and Little Emperor.
Younger couples tend to be more likely to have their parents living with them under the same roof. Of
course their parents are more likely to be alive but also this is the time when intensive childcare is
most required. Therefore among parents aged 20-29 the rate of live-in grandparents was 30%.
Among lower-income middle class households, with monthly household incomes of RMB10,000
(US$1,585) and below, grandparents were more likely to be living with the family. Outside childcare
options, such as private or boarding kindergartens or more full-time childcare/domestic help such as
阿姨ayis, are less affordable to this group.
Household composition also varies by region. Guangzhou, with its distinctive Southern atmosphere
and Cantonese culture (with a perhaps more traditional and very strong emphasis on inter-familial ties)
has far higher rates of live-in grandparents, at 36%, than Eastern and Northern cities.
It could be that many families in other cities may have grandparents and in-laws in other cities or parts
of the country due to widespread internal migration patterns and urbanisation. It may be that these
grandparents do not care to migrate to another city, leave the countryside or simply cannot make this
move to live with their grandchildren due to China’s rigid internal passport system (户口hukou)
denying them permanent city residency.
Current Living Situation Marketing to Children China, November 2012
© Mintel Group Ltd. All rights reserved. 25
Caring for grandchildren is a common experience for many Chinese grandparents who are thought to
display a general desire for their grandchild to experience the benefits they themselves were denied
during the less economically developed times. It may also be the case that grandparents know less
about issues such as diet, good paediatric health and childrearing trends and so tend to spoil children
more.
Mintel data show that even though parents are primarily responsible for taking care of their offspring,
over a quarter (26%) of grandparents buy treats for their children, over a fifth (23%) prepare their
meals and nearly a fifth (19%) do their clothes shopping (see A Day in the Life of a Little Emperor
section).
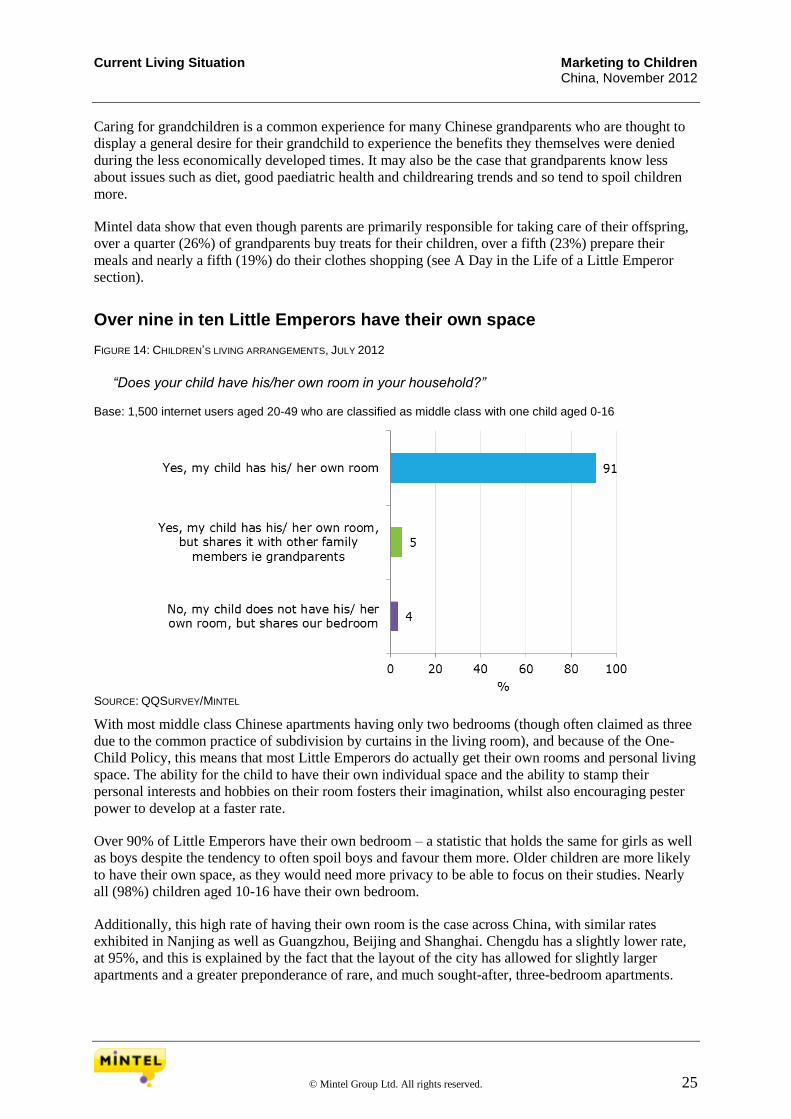
Over nine in ten Little Emperors have their own space FIGURE 14: CHILDREN’S LIVING ARRANGEMENTS, JULY 2012
“Does your child have his/her own room in your household?” Base: 1,500 internet users aged 20-49 who are classified as middle class with one child aged 0-16
SOURCE: QQSURVEY/MINTEL
With most middle class Chinese apartments having only two bedrooms (though often claimed as three
due to the common practice of subdivision by curtains in the living room), and because of the One-
Child Policy, this means that most Little Emperors do actually get their own rooms and personal living
space. The ability for the child to have their own individual space and the ability to stamp their
personal interests and hobbies on their room fosters their imagination, whilst also encouraging pester
power to develop at a faster rate.
Over 90% of Little Emperors have their own bedroom – a statistic that holds the same for girls as well
as boys despite the tendency to often spoil boys and favour them more. Older children are more likely
to have their own space, as they would need more privacy to be able to focus on their studies. Nearly
all (98%) children aged 10-16 have their own bedroom.
Additionally, this high rate of having their own room is the case across China, with similar rates
exhibited in Nanjing as well as Guangzhou, Beijing and Shanghai. Chengdu has a slightly lower rate,
at 95%, and this is explained by the fact that the layout of the city has allowed for slightly larger
apartments and a greater preponderance of rare, and much sought-after, three-bedroom apartments.
Current Living Situation Marketing to Children China, November 2012
© Mintel Group Ltd. All rights reserved. 26
Having their own bedroom gives Little Emperors a chance to concentrate on their studies, however,
this will also lead to many opportunities for distraction. Mintel data show high device ownership
amongst children and, with parents easily swayed by pester power, ownership of games, toys and other
modes entertainment is also high. This means there will be a particularly strong market for online and
mobile applications/software that lets parents monitor their children’s activities as well as parental
blocks or software that allows younger kids to browse safely.
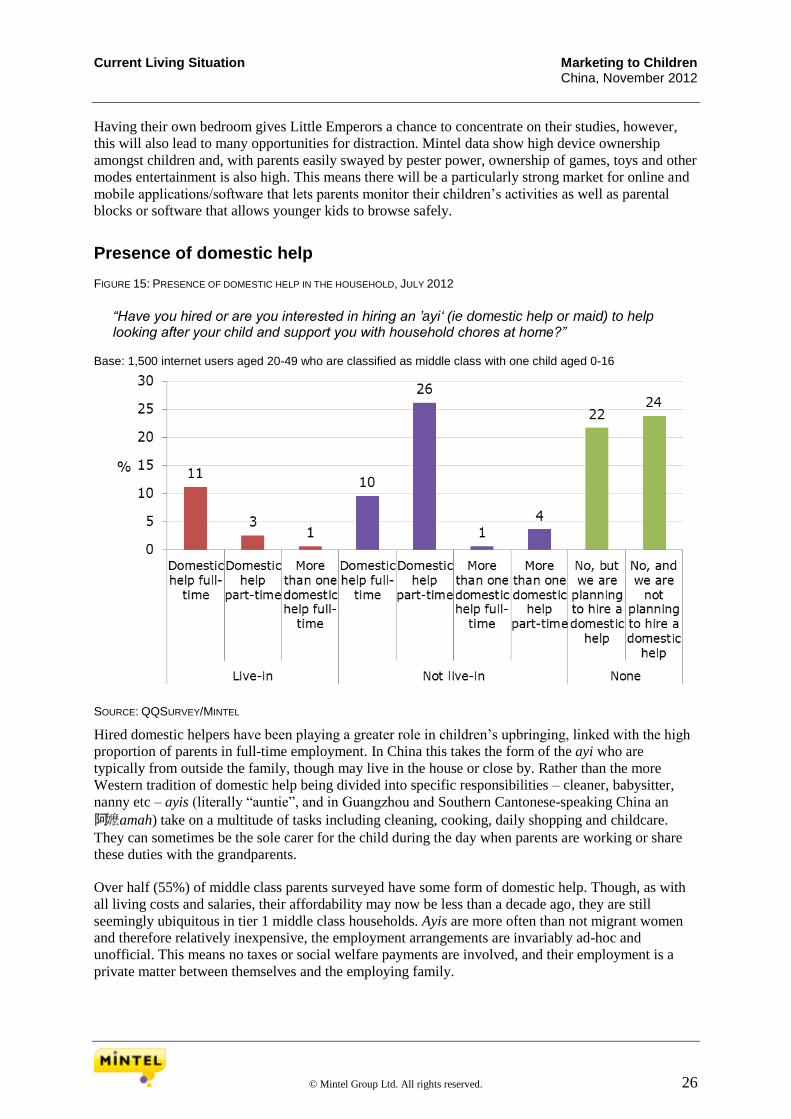
Presence of domestic help FIGURE 15: PRESENCE OF DOMESTIC HELP IN THE HOUSEHOLD, JULY 2012
“Have you hired or are you interested in hiring an ’ayi‘ (ie domestic help or maid) to help looking after your child and support you with household chores at home?”
Base: 1,500 internet users aged 20-49 who are classified as middle class with one child aged 0-16
SOURCE: QQSURVEY/MINTEL
Hired domestic helpers have been playing a greater role in children’s upbringing, linked with the high
proportion of parents in full-time employment. In China this takes the form of the ayi who are
typically from outside the family, though may live in the house or close by. Rather than the more
Western tradition of domestic help being divided into specific responsibilities – cleaner, babysitter,
nanny etc – ayis (literally “auntie”, and in Guangzhou and Southern Cantonese-speaking China an
阿嬷amah) take on a multitude of tasks including cleaning, cooking, daily shopping and childcare.
They can sometimes be the sole carer for the child during the day when parents are working or share
these duties with the grandparents.
Over half (55%) of middle class parents surveyed have some form of domestic help. Though, as with
all living costs and salaries, their affordability may now be less than a decade ago, they are still
seemingly ubiquitous in tier 1 middle class households. Ayis are more often than not migrant women
and therefore relatively inexpensive, the employment arrangements are invariably ad-hoc and
unofficial. This means no taxes or social welfare payments are involved, and their employment is a
private matter between themselves and the employing family.

Current Living Situation Marketing to Children China, November 2012
© Mintel Group Ltd. All rights reserved. 27
Live-in ayis are in the minority, with only 14% of families having such arrangements, with the small
number likely explained by the small apartment sizes. Domestic help that don’t live with the family are
much more common, with over a third (36%) of families employing such help either full-time or part-
time.
The tendency to have domestic help increases with household income, as over seven in ten (73%)
families with the highest household incomes (RMB25,000+) have hired help either part-time or full-
time. On the other hand, lower-income households are relatively more likely to have grandparents
living with them and fulfilling most of the functions of a domestic helper.

The Next Generation of Little Emperors Marketing to Children China, November 2012
© Mintel Group Ltd. All rights reserved. 28
The Next Generation of Little Emperors
Key points
Over seven in ten (72%) Chinese urban middle class parents bought disposable nappies in
the past year, testament to changing cultural attitudes, with parents increasingly shunning
the more traditional reusable baby trousers.
With food scares dominating media headlines, a preference of foreign brands of baby
formula is evident, as Nestlé and Wyeth lead the market with 54% of parents who indicate
they buy their products.
Two thirds of Chinese parents express a preference for 'natural' baby products, linked
directly to the food scares. Parents' protective instinct is at play, as they try to shield their
only child from any harm.
Pushchair ownership has reached the mainstream, with 86% amongst Chinese middle class
families who own one. Owning a buggy appeals to parents' desire to ensure their little ones
are transported safely. Fast adoption helped the prices to come down, and as a result only
3% of Chinese parents now say that owning a pushchair is unaffordable.
Childcare arrangements FIGURE 16: DAYCARE ARRANGEMENTS, JULY 2012
“During a typical week, does your child go to any of the following?” Base: 661 internet users aged 20-49 who are classified as middle class with one child aged 0-4
SOURCE: QQSURVEY/MINTEL
The Next Generation of Little Emperors Marketing to Children China, November 2012
© Mintel Group Ltd. All rights reserved. 29
Over seven in ten (72%) toddlers of surveyed urban middle class families are in some form of
kindergarten. This ranges from the local public kindergartens provided by the state (for which a small
fee will have to be paid) to private kindergartens and private nursery teachers, which are often caring
for a group of children living in the housing compound or immediate area.
Nearly one in ten families send their little ones to international kindergartens, which are not usually
truly international, but use some form of overseas educational concept, such as Montessori. Boarding
kindergartens are a relatively new concept but catching on fast, with children boarding from Monday-
Friday for a fee and returning home for the weekends.
Public kindergartens are common throughout China’s cities and so, in most, there are high rates of
attendance – as high as 44% in Chengdu and Nanjing. Private kindergartens are more common, longer
established and within the reach of more parents’ finances in wealthier cities such as Beijing (30%).
Private infant daycare is more common among higher-income families, whilst lower-income families
are more likely to rely on themselves or their parents for primary childcare.
These early learning options have become spaces where brands can interact at an early age with Little
Emperors and their parents. For instance, China’s dairy companies have worked with both public and
private kindergartens to promote dairy consumption. Shanghai’s Guangming (Bright) Dairy has long
been running kindergarten milk programmes offering free milk in an attempt to overcome at an early
age the break between dairy consumption as a baby and as a toddler that can cause higher rates of
lactose intolerance.
Daily consumption of free milk at kindergarten may lower the incidence of lactose intolerance and so a
future child-centred market for milk is grown. Convincing new parents of the importance of dairy
products begins at this point.

The Next Generation of Little Emperors Marketing to Children China, November 2012
© Mintel Group Ltd. All rights reserved. 30
Baby personal care purchases FIGURE 17: BABY PRODUCTS BOUGHT IN THE PAST 12 MONTHS, JULY 2012
“Which, if any, of these products designed specifically for babies and children aged up to 4 years old have you bought for your child in the past 12 months?”
Base: 661 internet users aged 20-49 who are classified as middle class with one child aged 0-4
SOURCE: QQSURVEY/MINTEL
While considering the range of products parents are purchasing for their Little Emperors, it is nappies
that are perhaps most instructive into how childrearing patterns are changing in an environment of
greater choice, product awareness, international influence and greater levels of disposable income.
Though nappies have now been on the market in China for a couple of decades, they have only
recently come to be widely used. The generation of Little Emperors born in the 21st century are really
the first generation in China to have widespread use of nappies as a standard item for infants. Before
this, and still in poorer parts of urban China, the traditional open-crotch trousers with a hole at the back
are still standard. They are inexpensive and allow for early potty training, though are not overly
hygienic.
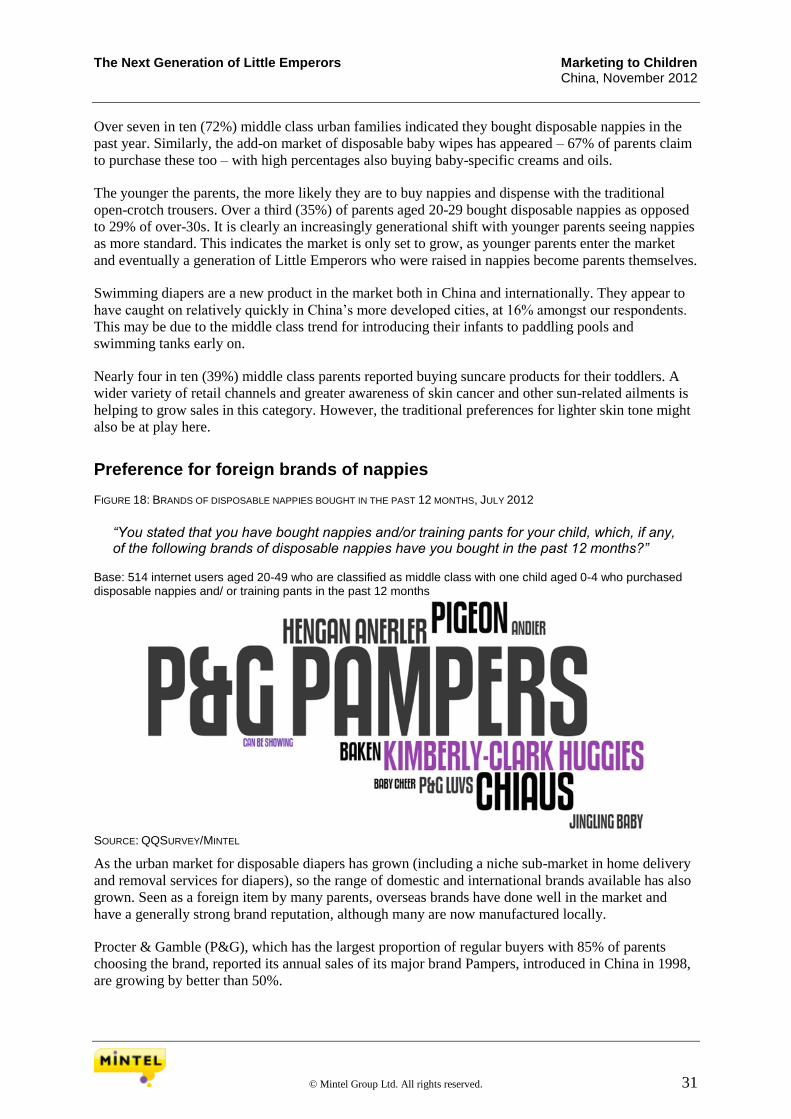
The Next Generation of Little Emperors Marketing to Children China, November 2012
© Mintel Group Ltd. All rights reserved. 31
Over seven in ten (72%) middle class urban families indicated they bought disposable nappies in the
past year. Similarly, the add-on market of disposable baby wipes has appeared – 67% of parents claim
to purchase these too – with high percentages also buying baby-specific creams and oils.
The younger the parents, the more likely they are to buy nappies and dispense with the traditional
open-crotch trousers. Over a third (35%) of parents aged 20-29 bought disposable nappies as opposed
to 29% of over-30s. It is clearly an increasingly generational shift with younger parents seeing nappies
as more standard. This indicates the market is only set to grow, as younger parents enter the market
and eventually a generation of Little Emperors who were raised in nappies become parents themselves.
Swimming diapers are a new product in the market both in China and internationally. They appear to
have caught on relatively quickly in China’s more developed cities, at 16% amongst our respondents.
This may be due to the middle class trend for introducing their infants to paddling pools and
swimming tanks early on.
Nearly four in ten (39%) middle class parents reported buying suncare products for their toddlers. A
wider variety of retail channels and greater awareness of skin cancer and other sun-related ailments is
helping to grow sales in this category. However, the traditional preferences for lighter skin tone might
also be at play here.
Preference for foreign brands of nappies FIGURE 18: BRANDS OF DISPOSABLE NAPPIES BOUGHT IN THE PAST 12 MONTHS, JULY 2012
“You stated that you have bought nappies and/or training pants for your child, which, if any, of the following brands of disposable nappies have you bought in the past 12 months?”
Base: 514 internet users aged 20-49 who are classified as middle class with one child aged 0-4 who purchased disposable nappies and/ or training pants in the past 12 months
SOURCE: QQSURVEY/MINTEL
As the urban market for disposable diapers has grown (including a niche sub-market in home delivery
and removal services for diapers), so the range of domestic and international brands available has also
grown. Seen as a foreign item by many parents, overseas brands have done well in the market and
have a generally strong brand reputation, although many are now manufactured locally.
Procter & Gamble (P&G), which has the largest proportion of regular buyers with 85% of parents
choosing the brand, reported its annual sales of its major brand Pampers, introduced in China in 1998,
are growing by better than 50%.

The Next Generation of Little Emperors Marketing to Children China, November 2012
© Mintel Group Ltd. All rights reserved. 32
Local brands have been increasing their market share as well, as they continue building a reputation
and strong distribution networks. There are now approximately a dozen domestic companies
distributing disposable diapers nationally to most of China’s major cities. Primary among these local
brands is Chiaus, with a strong 36% of parents purchasing them regularly, according to Mintel’s
exclusive research. Chiaus is a brand owned by Chiaus (Fujian) Industrial Development Co., Ltd, a
specialist nappies manufacturer established in 2006, indicating how new this type of product is to the
Chinese market. The company now produces 11 varieties of baby nappies as well as associated baby
tissues and wet wipes.
There are also higher-priced niche brands, often from Japan, such as Pigeon and Unicharm. At the
moment high-end brands, such as Pigeon, are finding brand traction to a greater extent in the most
developed, and richer, cities such as Beijing (37% of parents have bought the brand, according to
Mintel data) than in the less developed and more remote middle class enclaves such as Chengdu
(where only 25% have purchased). However, it could be argued that when even parents in Chengdu,
with less access to niche brands and less disposable income, are purchasing higher-end diapers, then
the importance of the sector to parents is clear.
Advertising illustrates benefits of wearing nappies
Advertising of diapers plays into parents’ concerns about safe development of their child from a young
age. Yvonne Pei, the associate director of external relations for Procter & Gamble in China, explains
its advertising style – “Pampers promotes overnight dryness, and it helps the baby to have a good
night's sleep. If baby doesn't have a good sleep, then the baby doesn't have a good mental
development.”
Local companies take a slightly different tack in their advertising. They are more likely to try to
educate parents as to why diapers are both more hygienic and better for a baby’s development. Hengan
is a major paper products brand in China with strong market share in tissues, wet wipes and female
sanitary products as well as diapers. The company is trying to change consumer thinking about diapers
in tier 2 cities where the foreign brands are less readily available and considered more expensive,
while diapers are still a relatively new concept compared to their wider adoption in tier 1 cities such as
Beijing and Shanghai. Hengan reports that many tier 2 consumers see diapers as wasteful and
unnecessary, though attitudes are changing and sales are growing.
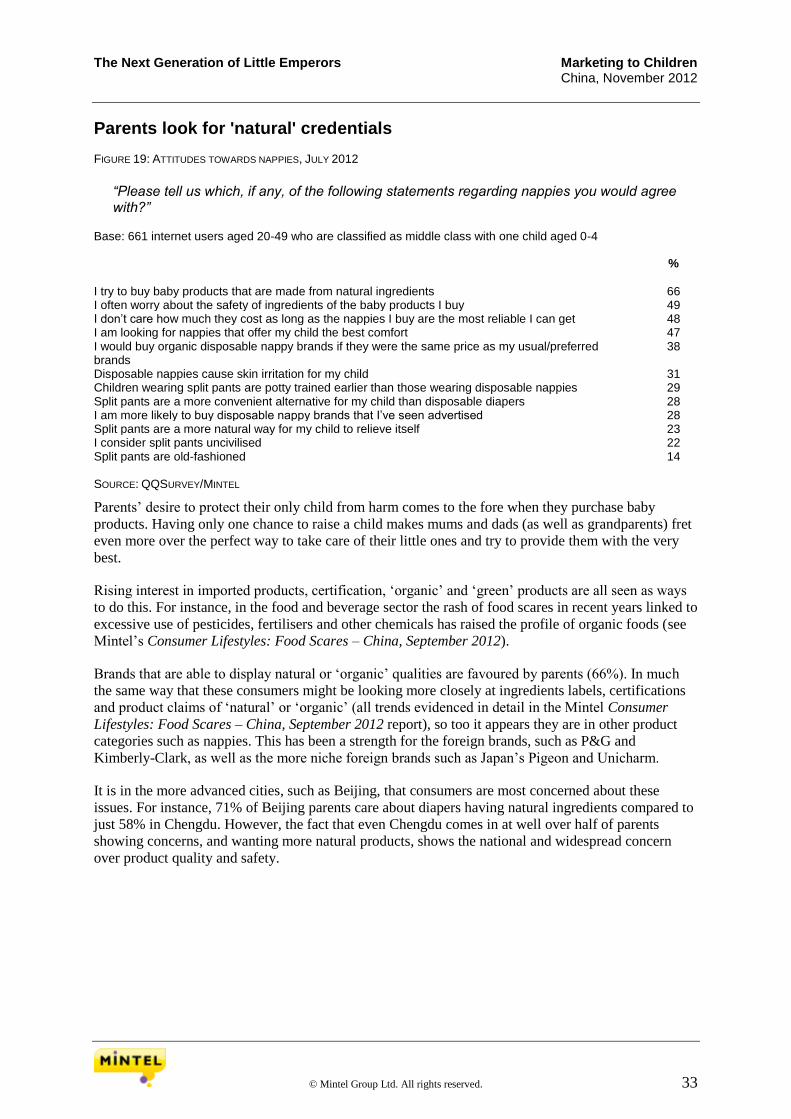
The Next Generation of Little Emperors Marketing to Children China, November 2012
© Mintel Group Ltd. All rights reserved. 33
Parents look for 'natural' credentials FIGURE 19: ATTITUDES TOWARDS NAPPIES, JULY 2012
“Please tell us which, if any, of the following statements regarding nappies you would agree with?”
Base: 661 internet users aged 20-49 who are classified as middle class with one child aged 0-4 %
I try to buy baby products that are made from natural ingredients 66 I often worry about the safety of ingredients of the baby products I buy 49 I don’t care how much they cost as long as the nappies I buy are the most reliable I can get 48 I am looking for nappies that offer my child the best comfort 47 I would buy organic disposable nappy brands if they were the same price as my usual/preferred brands
38
Disposable nappies cause skin irritation for my child 31 Children wearing split pants are potty trained earlier than those wearing disposable nappies 29 Split pants are a more convenient alternative for my child than disposable diapers 28 I am more likely to buy disposable nappy brands that I’ve seen advertised 28 Split pants are a more natural way for my child to relieve itself 23 I consider split pants uncivilised 22 Split pants are old-fashioned 14 SOURCE: QQSURVEY/MINTEL
Parents’ desire to protect their only child from harm comes to the fore when they purchase baby
products. Having only one chance to raise a child makes mums and dads (as well as grandparents) fret
even more over the perfect way to take care of their little ones and try to provide them with the very
best.
Rising interest in imported products, certification, ‘organic’ and ‘green’ products are all seen as ways
to do this. For instance, in the food and beverage sector the rash of food scares in recent years linked to
excessive use of pesticides, fertilisers and other chemicals has raised the profile of organic foods (see
Mintel’s Consumer Lifestyles: Food Scares – China, September 2012).
Brands that are able to display natural or ‘organic’ qualities are favoured by parents (66%). In much
the same way that these consumers might be looking more closely at ingredients labels, certifications
and product claims of ‘natural’ or ‘organic’ (all trends evidenced in detail in the Mintel Consumer
Lifestyles: Food Scares – China, September 2012 report), so too it appears they are in other product
categories such as nappies. This has been a strength for the foreign brands, such as P&G and
Kimberly-Clark, as well as the more niche foreign brands such as Japan’s Pigeon and Unicharm.
It is in the more advanced cities, such as Beijing, that consumers are most concerned about these
issues. For instance, 71% of Beijing parents care about diapers having natural ingredients compared to
just 58% in Chengdu. However, the fact that even Chengdu comes in at well over half of parents
showing concerns, and wanting more natural products, shows the national and widespread concern
over product quality and safety.
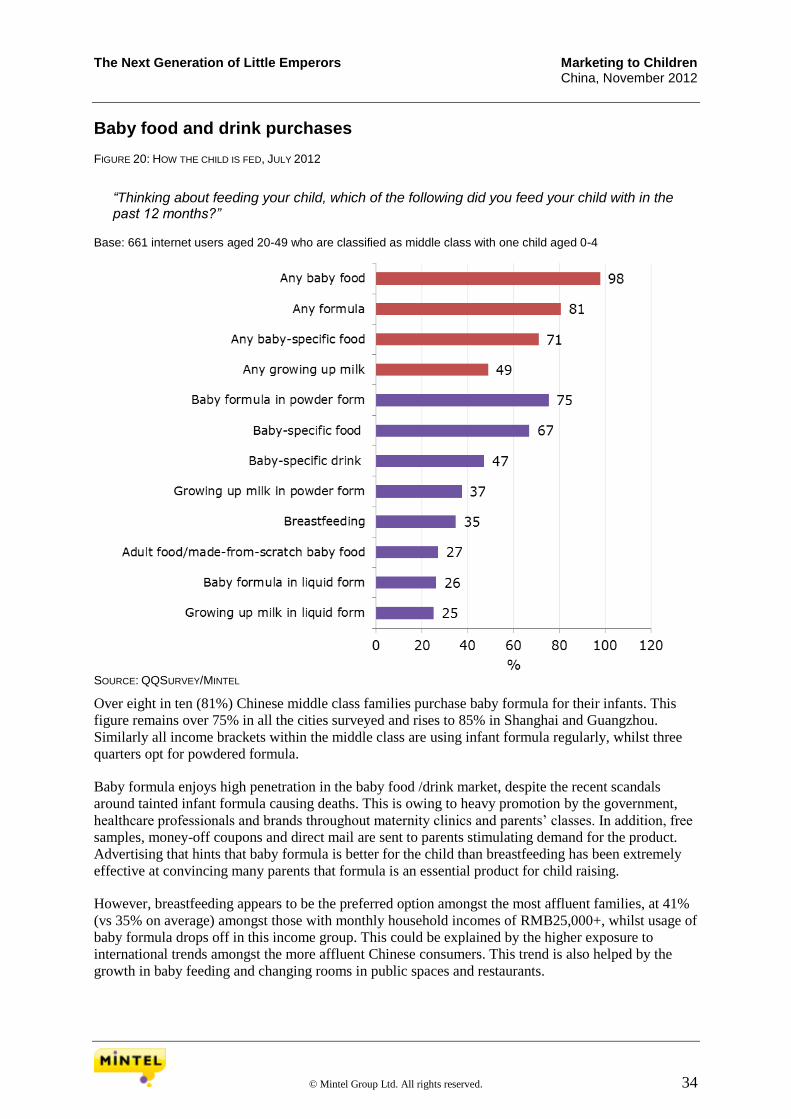
The Next Generation of Little Emperors Marketing to Children China, November 2012
© Mintel Group Ltd. All rights reserved. 34
Baby food and drink purchases FIGURE 20: HOW THE CHILD IS FED, JULY 2012
“Thinking about feeding your child, which of the following did you feed your child with in the past 12 months?”
Base: 661 internet users aged 20-49 who are classified as middle class with one child aged 0-4
SOURCE: QQSURVEY/MINTEL
Over eight in ten (81%) Chinese middle class families purchase baby formula for their infants. This
figure remains over 75% in all the cities surveyed and rises to 85% in Shanghai and Guangzhou.
Similarly all income brackets within the middle class are using infant formula regularly, whilst three
quarters opt for powdered formula.
Baby formula enjoys high penetration in the baby food /drink market, despite the recent scandals
around tainted infant formula causing deaths. This is owing to heavy promotion by the government,
healthcare professionals and brands throughout maternity clinics and parents’ classes. In addition, free
samples, money-off coupons and direct mail are sent to parents stimulating demand for the product.
Advertising that hints that baby formula is better for the child than breastfeeding has been extremely
effective at convincing many parents that formula is an essential product for child raising.
However, breastfeeding appears to be the preferred option amongst the most affluent families, at 41%
(vs 35% on average) amongst those with monthly household incomes of RMB25,000+, whilst usage of
baby formula drops off in this income group. This could be explained by the higher exposure to
international trends amongst the more affluent Chinese consumers. This trend is also helped by the
growth in baby feeding and changing rooms in public spaces and restaurants.

The Next Generation of Little Emperors Marketing to Children China, November 2012
© Mintel Group Ltd. All rights reserved. 35
The movement towards breastfeeding is expected to be accelerated by a combination of a growing
appreciation of all things natural, continuing product scares around infant formula products and their
currently rising prices.
Parents' anxieties fuel preference for foreign brands of baby formula
“You stated that you used infant formula in the past 12 months. Which of the following brands, if any, did you purchase in the past 12 months?”
FIGURE 21: BRAND OF INFANT FORMULA USED, JULY 2012 Base: 533 internet users aged 20-49 who are classified as middle class with one child aged 0-4 who used baby formula in the past 12 months
SOURCE: QQSURVEY/MINTEL
Mintel report Consumer Lifestyles: Food Scares – China, September 2012 showed that over half of
middle class parents had a definite preference for foreign brands of infant formula over domestic ones.
This is linked with the food scares and scandals around tainted baby food products, such as elevated
hormone levels in infant formula milk reported in 2010 and 2011. This had led to a surge in buying
and hoarding of foreign brands of infant formula, believed to be safer, even if manufactured in China.
Mintel data collected exclusively for this report confirm the strong preference for foreign brands of
infant formula, despite the typical 15-20% premium price tag compared with domestic brands. There is
a strong market for infant formula even with breastfeeding making a comeback, with Nestlé and
Wyeth leading the market with 54% of parents who buy their products. However, domestic brands
have some way to go in terms of rebuilding customer trust and loyalty in the wake of the repeated food
scares, despite their lower price points.
Distribution is key in the market as the middle class expands out from the key tier 1 and tier 2 cities to
other locations. Brands with good tier 2 and tier 3 distribution have a better chance of establishing
themselves in a strong position.

The Next Generation of Little Emperors Marketing to Children China, November 2012
© Mintel Group Ltd. All rights reserved. 36
For instance, Synutra, a Chinese company, has a strong position in tier 2 cities, such as Nanjing,
despite being relatively highly priced. Over a fifth (21%) of parents in each city purchase it, a
percentage that falls to as low as 15% and 16% respectively in the tier 1 cities of Beijing and Shanghai
where competition and brand availability are wider. Synutra has built an especially strong provincial
distribution system – a network comprised of over 650 independent distributors and over 800
independent sub-distributors who sell Synutra products in over 67,000 retail outlets – that appears to
be paying dividends for the brand.
Taking a baby around FIGURE 22: ITEMS USED TO TRANSPORT THE CHILD, JULY 2012
“Thinking about getting around with your child, which of the following baby mobility items do you own, and which ones do you not have but plan to buy in future?”
Base: 661 internet users aged 20-49 who are classified as middle class with one child aged 0-4
SOURCE: QQSURVEY/MINTEL
Over eight in ten (86%) middle class urban families own a pushchair, with another 12% planning to
buy one in the future. Buggies can be seen as a display of wealth, but are also safer for the child to be
transported in. As with nappies and suncare products, pushchairs are not traditional items in China and
have been adopted almost solely by the emergent middle class to date. Pushchairs go with diapers and
other modern baby items as products the new middle class want for their Little Emperors.
The pushchair market has emerged strongly in all the cities surveyed – over 80% in Beijing, Shanghai,
Guangzhou, Nanjing and Chengdu – and across all financial brackets of the middle class. This perhaps
indicates their position, not just as a protection item, but also as a desirable accoutrement to the
modern middle class aspirational parenting.
Car seat ownership is far from universal, with 66% of respondents claiming to own a car seat
(ownership tends to be lower in tier 2 cities than tier 1) indicating that awareness is still growing and
resistance to this obvious form of child protection remains. This also means that there are opportunities
for more sales if education and awareness continue to be raised.

The Next Generation of Little Emperors Marketing to Children China, November 2012
© Mintel Group Ltd. All rights reserved. 37
Older parents focus on fitness of toddlers FIGURE 23: ATTITUDES TOWARDS TRANSPORT OF THE CHILD, JULY 2012 Base: 661 internet users aged 20-49 who are classified as middle class with one child aged 0-4
SOURCE: QQSURVEY/MINTEL
Attitudes towards transporting a toddler around vary greatly by gender and age of parents. Mothers,
and particularly those aged 30-49 (52%), are more likely to find carrying a baby around exhausting.
Thus, older mums would be especially amenable to purchasing a pushchair to transport their little one,
with 87% amongst them who own one versus 83% of younger mums. This especially holds true as
only 3% of Chinese urban middle class parents think that pushchairs are too expensive for them.
Younger dads aged 20-29 are particularly anxious about the safety of their little ones, perhaps to an
extreme, as 17% of dads in this age group carry their toddlers everywhere, so as not to tire them out
too much. On the other hand, older parents put more emphasis on exercise, with nearly six in ten
(58%) who ensure their children walk as often as possible to stay fit.
With four in ten Chinese middle class mums and dads finding it exhausting carrying around the child
without any props, the market for pushchairs, and to a lesser extent slings and back carriers, will
continue to grow. Whilst in the minority, over one in ten (11%) parents agreed that buggies can be
impractical when getting around in large cities, indicating a need for developing more compact and
manoeuvrable models.
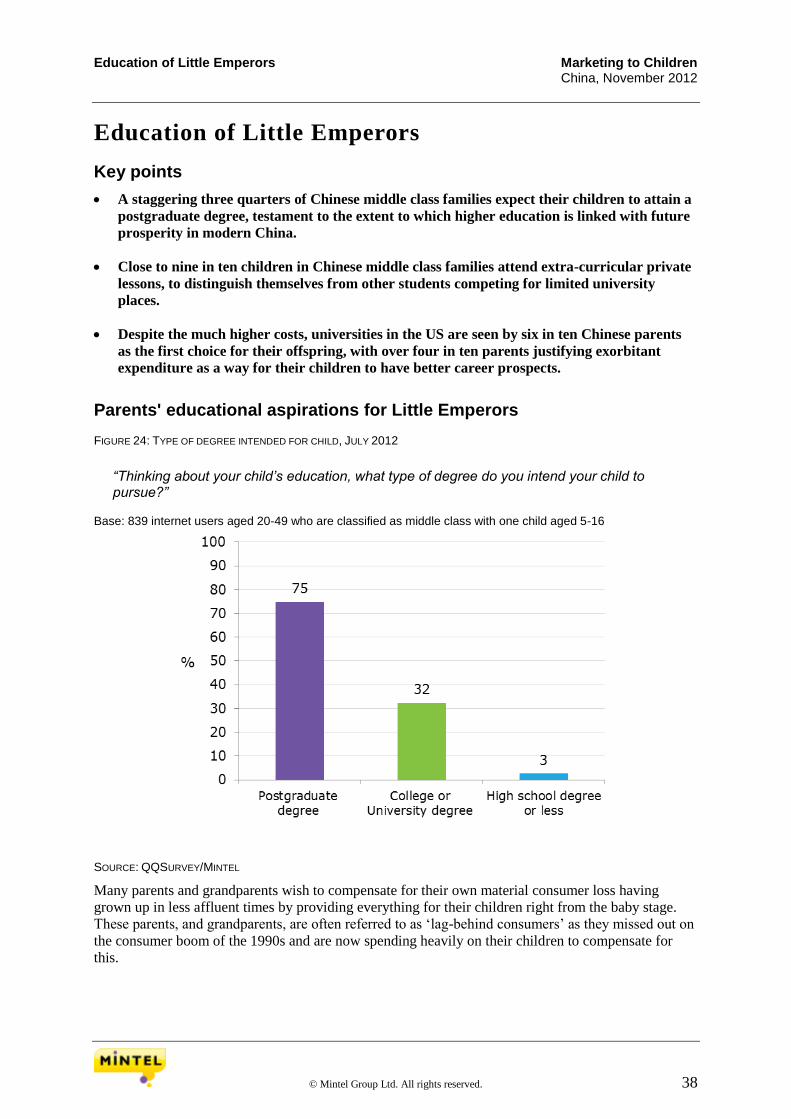
Education of Little Emperors Marketing to Children China, November 2012
© Mintel Group Ltd. All rights reserved. 38
Education of Little Emperors
Key points
A staggering three quarters of Chinese middle class families expect their children to attain a
postgraduate degree, testament to the extent to which higher education is linked with future
prosperity in modern China.
Close to nine in ten children in Chinese middle class families attend extra-curricular private
lessons, to distinguish themselves from other students competing for limited university
places.
Despite the much higher costs, universities in the US are seen by six in ten Chinese parents
as the first choice for their offspring, with over four in ten parents justifying exorbitant
expenditure as a way for their children to have better career prospects.
Parents' educational aspirations for Little Emperors FIGURE 24: TYPE OF DEGREE INTENDED FOR CHILD, JULY 2012
“Thinking about your child’s education, what type of degree do you intend your child to pursue?”
Base: 839 internet users aged 20-49 who are classified as middle class with one child aged 5-16
SOURCE: QQSURVEY/MINTEL
Many parents and grandparents wish to compensate for their own material consumer loss having
grown up in less affluent times by providing everything for their children right from the baby stage.
These parents, and grandparents, are often referred to as ‘lag-behind consumers’ as they missed out on
the consumer boom of the 1990s and are now spending heavily on their children to compensate for
this.

Education of Little Emperors Marketing to Children China, November 2012
© Mintel Group Ltd. All rights reserved. 39
Education is where parents and grandparents start compensating for their own losses first. Education is
central to the Chinese middle class experience, the cornerstone of middle class achievement, as
demonstrated in Mintel’s Consumer Lifestyles: China’s Middle Class – China, June 2012 report.
While grandparents of the current infant generation will have largely missed out on a formal education
beyond high school due to living circumstances, lack of finances or the chaos of the Cultural
Revolution period, invariably the parents of today’s infant Little Emperors have received a higher
education and benefited from that edge in the job market which then financially allows them to live a
middle class lifestyle. Simply put, higher education has been a key component to middle class entry,
formation and reproduction.
Once formal schooling begins the pressure really starts to pile on the Little Emperors. On average high
school aged children spend 6.3 hours a day at school with another hour daily spent attending extra-
curricular classes. With an average of 1.4 hours a day spent travelling to and from school and an hour
of sports activities it’s easily a ten-hour day before any time can be found for leisure activities or
spending time with their parents and family.
In a prime example of the burden of expectation, 75% of Chinese middle class parents expect their
child to attain a postgraduate degree with only 32% happy that their child completes their education at
only graduate level. These expectations are fairly constant across all income bands and cities as well as
being expected of both girls and boys.
Parents aged 20-39 more likely to opt for private school FIGURE 25: TYPE OF SCHOOL THE CHILD ATTENDS, JULY 2012
“Which of the following best describes the type of school your child goes to?” Base: 839 internet users aged 20-49 who are classified as middle class with one child aged 5-16
SOURCE: QQSURVEY/MINTEL
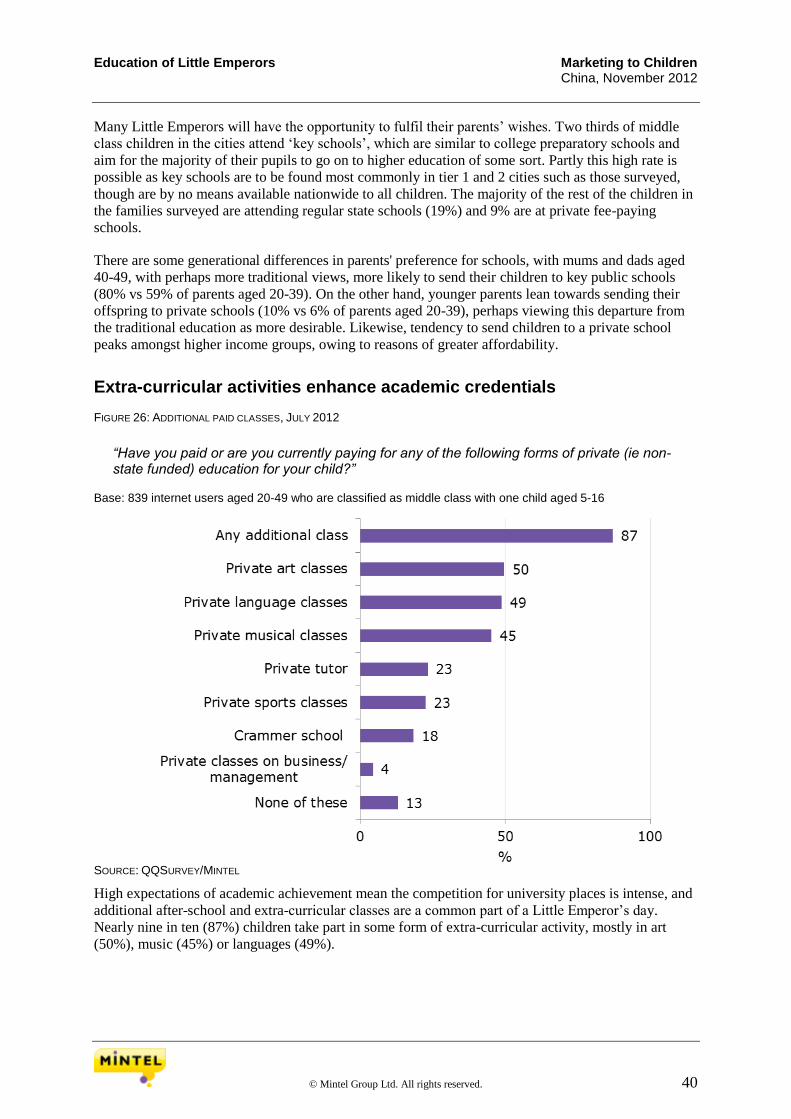
Education of Little Emperors Marketing to Children China, November 2012
© Mintel Group Ltd. All rights reserved. 40
Many Little Emperors will have the opportunity to fulfil their parents’ wishes. Two thirds of middle
class children in the cities attend ‘key schools’, which are similar to college preparatory schools and
aim for the majority of their pupils to go on to higher education of some sort. Partly this high rate is
possible as key schools are to be found most commonly in tier 1 and 2 cities such as those surveyed,
though are by no means available nationwide to all children. The majority of the rest of the children in
the families surveyed are attending regular state schools (19%) and 9% are at private fee-paying
schools.
There are some generational differences in parents' preference for schools, with mums and dads aged
40-49, with perhaps more traditional views, more likely to send their children to key public schools
(80% vs 59% of parents aged 20-39). On the other hand, younger parents lean towards sending their
offspring to private schools (10% vs 6% of parents aged 20-39), perhaps viewing this departure from
the traditional education as more desirable. Likewise, tendency to send children to a private school
peaks amongst higher income groups, owing to reasons of greater affordability.
Extra-curricular activities enhance academic credentials FIGURE 26: ADDITIONAL PAID CLASSES, JULY 2012
“Have you paid or are you currently paying for any of the following forms of private (ie non-state funded) education for your child?”
Base: 839 internet users aged 20-49 who are classified as middle class with one child aged 5-16
SOURCE: QQSURVEY/MINTEL
High expectations of academic achievement mean the competition for university places is intense, and
additional after-school and extra-curricular classes are a common part of a Little Emperor’s day.
Nearly nine in ten (87%) children take part in some form of extra-curricular activity, mostly in art
(50%), music (45%) or languages (49%).

Education of Little Emperors Marketing to Children China, November 2012
© Mintel Group Ltd. All rights reserved. 41
Whilst these are not necessarily seen as core subjects, Chinese universities often look for activities and
extra skills to make distinctions among students with commonly good grades. Activities that are not
looked at closely for college entrance, such as sports (except for the elite sports schools), are
noticeably less popular with parents (23%).
The ability to have private lessons is largely connected with a household’s income; uptake of any
private classes rises dramatically with income. Equally, private classes appear to be more popular in
households with just three members, whilst it's likely the case that grandparents take on a larger role in
the child's education in larger households instead.
Parents wish for a brighter future for their offspring FIGURE 27: WILLINGNESS TO FUND THE CHILD’S STUDIES ABROAD, JULY 2012
“Would you be willing to fund your child to study abroad?” Base: 839 internet users aged 20-49 who are classified as middle class with one child aged 5-16
SOURCE: QQSURVEY/MINTEL
Nearly nine in ten (87%) Chinese parents are willing to fund study abroad and, according to the
Beijing Overseas-Study Service Association, approximately 550,000-600,000 do so each year, with
the figure rising by 30% per annum. Having their child study abroad is growing in popularity for
middle class parents for two main reasons. Firstly, a foreign education may well be seen as counting
for more when they return than a purely PRC education. Secondly, with places limited at Chinese
universities some Little Emperors may only get their under- and postgraduate education by going
overseas and paying.

Education of Little Emperors Marketing to Children China, November 2012
© Mintel Group Ltd. All rights reserved. 42
Some students, who are finding the high school and college entry exams too hard and the competition
too intense, opt for study abroad at pre-university level – 7% of parents are willing to fund a year of
high school overseas.
Annual costs of studying overseas are high: RMB150,000 (approximately US$23,770) to
RMB200,000 (approximately US$31,695) for lower-cost UK, Australian or Canadian colleges rises
significantly to over RMB250,000 (approximately US$40,000) for elite colleges in Europe and in the
US.
This is a massive financial burden on parents and they may not realise the true costs (including living
costs, rent, flights to and from China, healthcare, etc.) in advance, despite their best wishes. There is
some evidence to believe this is the case, as only 15% of parents are willing to admit that sending their
children to university is going to be a big financial burden (see below). Richer parents are more able to
offer this funding – in the group with personal incomes above RMB15,000 per month 95% are willing
to fund study abroad, but this drops to 79% in the under RMB10,000 per month group.
A very small proportion, only just over one in ten (13%) Chinese parents, agree they would like their
offspring to study in China. As many parents and virtually all grandparents were denied a university
education and had no chance of studying abroad, they now wish for a brighter future for their Little
Emperors.
American institutions are favoured FIGURE 28: PREFERRED COUNTRY FOR CHILD’S STUDIES ABROAD, JULY 2012 Base: 724 internet users aged 20-49 who are classified as middle class with children aged 5-16 and who would be willing to fund studies abroad or have already funded Rank 1 Rank 2 Rank 3 % % %
US 60 13 10 Canada 15 19 10 United Kingdom 14 39 13 EU (excluding the United Kingdom) 2 5 16 Australia 5 12 20 Hong Kong 2 5 12 Singapore 2 5 11 Japan 1 2 7 Other country - - - SOURCE: QQSURVEY/MINTEL
Studying abroad has become a regular rite of passage for many teenage Little Emperors, and they are
prepared for it by language lessons (49%) well in advance. Given a choice of their child studying
anywhere in the world, the US is most preferred and ranked first by 60% of parents reflecting the
strong opinion of American higher education (particularly the Ivy League institutions) despite the high
costs. For that reason, the pull of American universities is stronger amongst more affluent families as
well as those who live in wealthier cities, such as Beijing.
Canada and the UK are strong choices both as first or second options. In recent years Australia has
become an increasingly popular option for Chinese parents and students in terms of cost, lifestyles and
college life.

Education of Little Emperors Marketing to Children China, November 2012
© Mintel Group Ltd. All rights reserved. 43
Attitudes towards supporting children financially FIGURE 29: FINANCIAL IMPACT OF COVERING CHILD’S EDUCATION, JULY 2012
“Please tell us what impact your children’s education might have on your financial and personal situation?”
Base: 839 internet users aged 20-49 who are classified as middle class with one child aged 5-16 %
I started saving money for my child’s education early in order to afford a good college/ university 58 I want my child to compete with the best academically, for this I am willing to pay a significant amount of money
56
It’s worth paying a lot for education fees because my child will get a higher-paid job afterwards 41 My child is likely to receive financial support from my whole family ie parents, grandparents to pursue a good education
28
I would surrender my last resources to allow my child higher education 26 I cut back on my spend on non-essentials ie leisure activities or luxury goods in order to save money for my child/ children’s education
23
I am willing to take on debt in order to send my child to a good college/ university 17
Sending my child to university will be a huge financial burden 15 I count on my child to support me financially after I retire 5 SOURCE: QQSURVEY/MINTEL
Despite the high costs, Chinese middle class parents are willing to put their time and money where
their hopes are in order to ensure their children’s education, future success and security. Over four in
ten (44%) indicate they regularly spend time helping their child with their homework and the majority
take their children to school and collect them at the end of the day (see A Day in the Life of a Little
Emperor section).
Besides encouraging their offspring to study hard, Chinese middle class parents make a lot of financial
compromises to ensure they can foot the bill for their child’s education. Nearly six in ten parents
(58%) start saving for their child’s future education costs from birth. Over half (56%) agree that they
are willing to pay a significant amount of money for children's education and over four in ten (41%)
believe that their child will get a higher-paid job afterwards.
Over a quarter of Chinese middle class parents seemingly would give an arm and a leg to put their
children through university, by surrendering their last resources for their child’s higher education.
However, such self-sacrificing by parents is only necessary when family financial resources are
limited, whilst wealthier parents don't have to make the same compromises to provide for the future of
their offspring.
For example, whilst 37% of mums and dads in Chengdu are willing to surrender all resources for their
children's education, only 18% in Guangzhou would do the same. Nearly three in ten (28%) would ask
for financial help from the entire extended family to ensure Little Emperors get the best education,
with the tendency most evident amongst Nanjing (tier 2) households (34%) with somewhat less
wealthy backgrounds.

Spending Power of Little Emperors Marketing to Children China, November 2012
© Mintel Group Ltd. All rights reserved. 44
Spending Power of Little Emperors
Key points
Even though pocket money is a relatively new concept, over nine in ten parents now give
their offspring a monthly allowance, with nearly half of grandparents contributing as well.
Fathers aged 40-49 are the most generous with their Little Emperors, and also tend to dish
out pocket money with no strings attached.
Mothers are much more disciplinarian and more likely to require that children do
housework, behave well and do well in school before giving them any money.
Six in ten parents want their offspring to focus on their education first and foremost, taking
care of their financial and other needs, so there are no distractions. Whilst they may have
their children’s best interests in mind, this may actually be to the detriment of children’s
future independence.
Sources of children’s income FIGURE 30: SOURCES OF CHILD’S INCOME, JULY 2012
“Specifically thinking about your child’s finances, does your child receive monthly allowance ie pocket money or any other sort of monetary funds from you, your partner or someone else?”
Base: 839 internet users aged 20-49 who are classified as middle class with one child aged 5-16
SOURCE: QQSURVEY/MINTEL
The notion of pocket money, or an allowance given by parents or grandparents to children, is relatively
new in China. Children would receive the traditional red envelopes (红包hongbao) with some money at
Chinese New Year, but not regular weekly or monthly allowances.
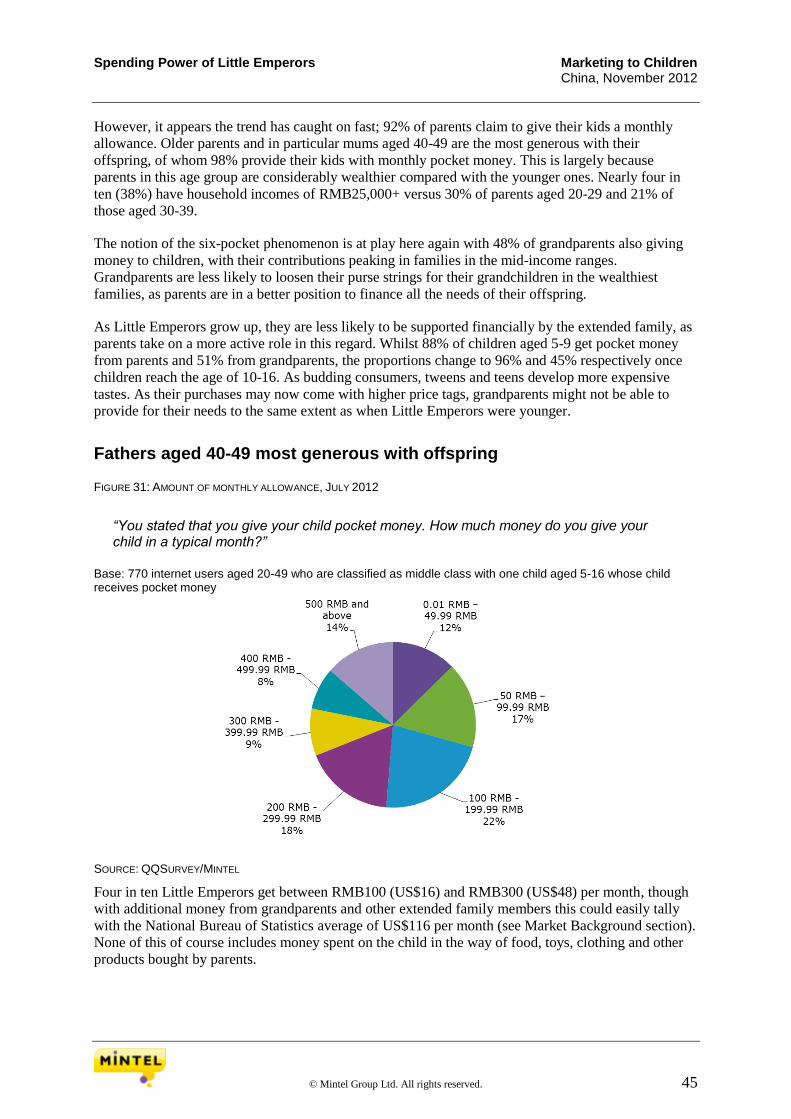
Spending Power of Little Emperors Marketing to Children China, November 2012
© Mintel Group Ltd. All rights reserved. 45
However, it appears the trend has caught on fast; 92% of parents claim to give their kids a monthly
allowance. Older parents and in particular mums aged 40-49 are the most generous with their
offspring, of whom 98% provide their kids with monthly pocket money. This is largely because
parents in this age group are considerably wealthier compared with the younger ones. Nearly four in
ten (38%) have household incomes of RMB25,000+ versus 30% of parents aged 20-29 and 21% of
those aged 30-39.
The notion of the six-pocket phenomenon is at play here again with 48% of grandparents also giving
money to children, with their contributions peaking in families in the mid-income ranges.
Grandparents are less likely to loosen their purse strings for their grandchildren in the wealthiest
families, as parents are in a better position to finance all the needs of their offspring.
As Little Emperors grow up, they are less likely to be supported financially by the extended family, as
parents take on a more active role in this regard. Whilst 88% of children aged 5-9 get pocket money
from parents and 51% from grandparents, the proportions change to 96% and 45% respectively once
children reach the age of 10-16. As budding consumers, tweens and teens develop more expensive
tastes. As their purchases may now come with higher price tags, grandparents might not be able to
provide for their needs to the same extent as when Little Emperors were younger.
Fathers aged 40-49 most generous with offspring FIGURE 31: AMOUNT OF MONTHLY ALLOWANCE, JULY 2012
“You stated that you give your child pocket money. How much money do you give your child in a typical month?”
Base: 770 internet users aged 20-49 who are classified as middle class with one child aged 5-16 whose child receives pocket money
SOURCE: QQSURVEY/MINTEL
Four in ten Little Emperors get between RMB100 (US$16) and RMB300 (US$48) per month, though
with additional money from grandparents and other extended family members this could easily tally
with the National Bureau of Statistics average of US$116 per month (see Market Background section).
None of this of course includes money spent on the child in the way of food, toys, clothing and other
products bought by parents.

Spending Power of Little Emperors Marketing to Children China, November 2012
© Mintel Group Ltd. All rights reserved. 46
Amount of monthly pocket money is positively correlated with household income. In addition,
families living in Beijing appear to be the most generous with their Little Emperors, as over three in
ten (31%) give their children pocket money in excess of RMB500 a month.
Whilst older parents (aged 40-49) overall are more generous with their children compared with
younger parents, with 26% handing out pocket money of RMB500+ a month, it’s older fathers who
outspend all others, with 38% giving their children the same amount.
Mothers require more discipline from Little Emperors FIGURE 32: CONDITION MONTHLY ALLOWANCE IS BASED ON, JULY 2012
“Is this monthly allowance linked to any of the following in exchange?” Base: 770 internet users aged 20-49 who are classified as middle class with one child aged 5-16 whose child receives pocket money
SOURCE: QQSURVEY/MINTEL
Over half (54%) of parents give pocket money based on their child’s behaviour at home and fewer
(49%) on their child’s performance in school and at after-school extra-curricular classes. Mothers
place more emphasis on linking monthly allowance to children’s behaviour and diligence around the
house, whilst dads appear to be more lax, and much more willing to provide their Little Emperors with
pocket money with no strings attached (35% vs 24% for mothers).
Division of responsibilities in modern Chinese households appears to be very traditional, with mothers
taking care of the large chunk of duties related to raising children. Mintel data show that mums (and
particularly younger mums) are considerably more likely compared with dads to help children get
dressed, prepare their meals, buy their treats, do their clothes shopping and listen to children’s
complaints (see A Day in the Life of a Little Emperor section).
As Chinese mothers are more actively involved in the upbringing of their children, they would place
more emphasis on discipline and obedience, as evidenced by the fact that they are more likely to place
conditions on children’s money allowance.
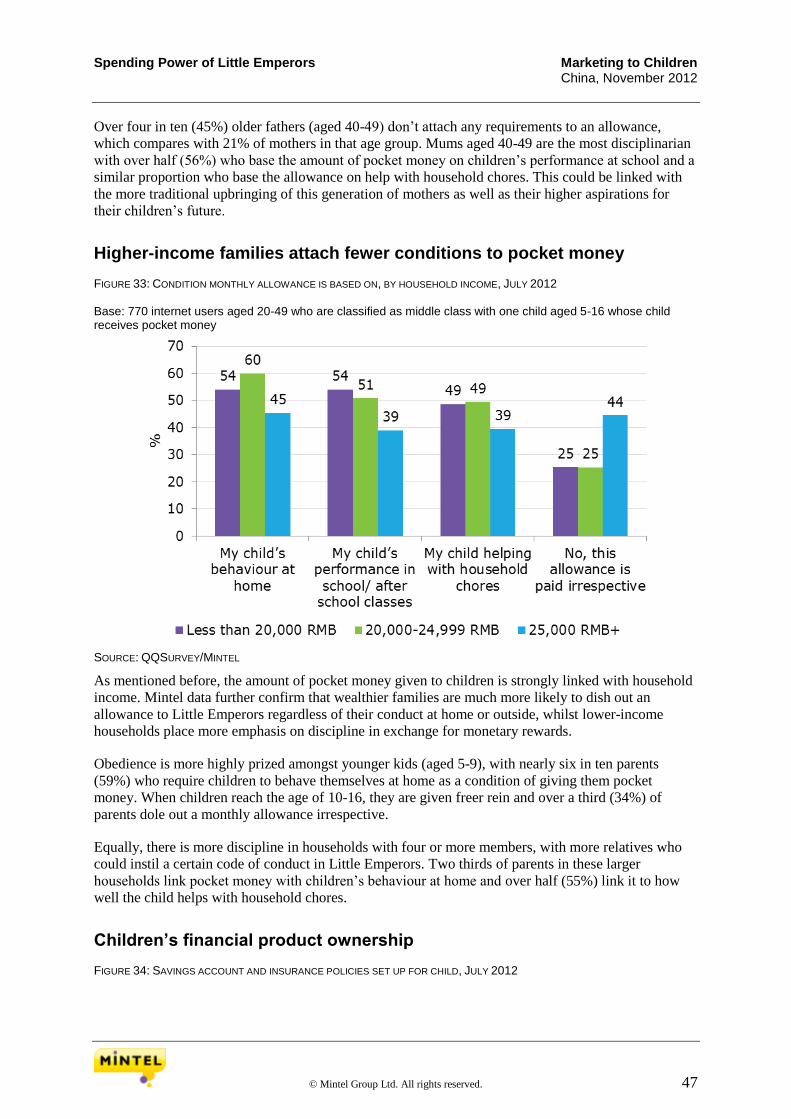
Spending Power of Little Emperors Marketing to Children China, November 2012
© Mintel Group Ltd. All rights reserved. 47
Over four in ten (45%) older fathers (aged 40-49) don’t attach any requirements to an allowance,
which compares with 21% of mothers in that age group. Mums aged 40-49 are the most disciplinarian
with over half (56%) who base the amount of pocket money on children’s performance at school and a
similar proportion who base the allowance on help with household chores. This could be linked with
the more traditional upbringing of this generation of mothers as well as their higher aspirations for
their children’s future.
Higher-income families attach fewer conditions to pocket money FIGURE 33: CONDITION MONTHLY ALLOWANCE IS BASED ON, BY HOUSEHOLD INCOME, JULY 2012 Base: 770 internet users aged 20-49 who are classified as middle class with one child aged 5-16 whose child receives pocket money
SOURCE: QQSURVEY/MINTEL
As mentioned before, the amount of pocket money given to children is strongly linked with household
income. Mintel data further confirm that wealthier families are much more likely to dish out an
allowance to Little Emperors regardless of their conduct at home or outside, whilst lower-income
households place more emphasis on discipline in exchange for monetary rewards.
Obedience is more highly prized amongst younger kids (aged 5-9), with nearly six in ten parents
(59%) who require children to behave themselves at home as a condition of giving them pocket
money. When children reach the age of 10-16, they are given freer rein and over a third (34%) of
parents dole out a monthly allowance irrespective.
Equally, there is more discipline in households with four or more members, with more relatives who
could instil a certain code of conduct in Little Emperors. Two thirds of parents in these larger
households link pocket money with children’s behaviour at home and over half (55%) link it to how
well the child helps with household chores.
Children’s financial product ownership FIGURE 34: SAVINGS ACCOUNT AND INSURANCE POLICIES SET UP FOR CHILD, JULY 2012

Spending Power of Little Emperors Marketing to Children China, November 2012
© Mintel Group Ltd. All rights reserved. 48
“Have you set up a savings account or insurance policies for your child?” Base: 839 internet users aged 20-49 who are classified as middle class with one child aged 5-16
SOURCE: QQSURVEY/MINTEL
Despite the apparent generosity of Chinese middle class families with their offspring (particularly
those as the higher end of the income scale), parents are also eager to teach their Little Emperors how
to be financially savvy as well as provide for their future from an early age.
Nearly all (95%) parents have also set up some form of financial product for their children. Invariably
this is either a savings account or an insurance policy with 70% opening both types of financial
products for their child.
As with pocket money, propensity towards financial product ownership rises amongst children in
wealthy households, as well as those with older parents, and as there is a high overlap between the
two.
Focus on education FIGURE 35: ATTITUDES TOWARDS THE CHILD’S DEVELOPMENT AND FAMILY FINANCES, JULY 2012
“Please tell me the extent to which you agree or disagree with each of the following statements.”
Base: 1,500 internet users aged 20-49 who are classified as middle class with one child aged 0-16 Any agree Neither agree
nor disagree Any disagree
% % %
I am teaching my child to be independent 85 12 3 I don’t want my child to feel pressured all the time 77 15 7

Spending Power of Little Emperors Marketing to Children China, November 2012
© Mintel Group Ltd. All rights reserved. 49
I want my child to focus on its education instead of wasting time on activities such as watching TV
60 25 15
Study is the most important activity for my child 59 26 15 If I want to buy something for myself, I first check if I cannot better spend that money on my child
43 28 28
I am concerned about my child’s ability to live independently after it leaves home
43 29 29
My child has a significant influence on household decisions 41 38 21 I need to purchase a property for my child before he/ she gets married
37 35 28
I am worried about our financial situation if I try to fulfil all my child’s needs
33 34 34
I cut back on household expenditures to pay for items my child would like to have
29 33 38
I want my child to pursue the career that we as parents have chosen for him/ her
28 32 40
My child will always be able to rely on us financially independent of his/ her age
23 25 52
I am likely to struggle financially once my child grows older 21 29 50 SOURCE: QQSURVEY/MINTEL
It could be argued that a strong desire for children to succeed and do well while also enjoying life and
being independent are largely universal values for any parent. However, the fast pace of economic
growth and the changing demands and requirements of the urban labour market all mean parents
demand more of their children in Chinese middle class families.
Educational expectations are the main example of the sort of burden middle class parents place on
their children. Little Emperors know from an early age that, although they are privileged in relation to
most Chinese kids and can have much of what they want without any questions asked, they must
perform and achieve. Six in ten parents want their child to focus on their education instead of wasting
time on leisure activities, and a similar proportion indicate that studying is the most important goal in
their child’s life.
Perhaps the high level of financial and other support that Chinese middle class parents provide their
children with makes them worry more about their wellbeing once they fly the nest and become
independent. Over four in ten (43%) parents express concerns about their child’s ability to live
independently, despite the high proportion who report trying to instil an independent spirit in their
Little Emperors (85%). Such wishes may simply be a sign of a halo effect, with parents conforming to
a certain acceptable response, whilst ignoring the fact that their hyper-involvement in all aspects of
their child’s life may actually be to the detriment of their independence.

Spending Power of Little Emperors Marketing to Children China, November 2012
© Mintel Group Ltd. All rights reserved. 50
Boys more vocal about what they want FIGURE 36: ATTITUDES TOWARDS THE CHILD’S DEVELOPMENT AND FAMILY FINANCES, BY GENDER OF CHILD, JULY 2012 Base: 1,500 internet users aged 20-49 who are classified as middle class with one child aged 0-16
SOURCE: QQSURVEY/MINTEL
The high expectations work both ways, however. While Little Emperors may be expected to achieve
academically, study hard and get good jobs, there is evidence to believe that children have high
expectations of parents as well.
Over four in ten (41%) parents report that their child has a significant influence on the household’s
decisions, such as what food to buy and where to go on holidays, whilst a third are even worried about
their financial situation if they try to give into their child’s pester power fully. This perhaps
underscores the relative inability of Chinese parents to refuse anything to their precious offspring.
Having grown up with so little, this generation of parents doesn’t want to deny their children all the
things that they didn’t have in their childhood.
This leads many parents along a dangerous path, as children realise they can ask for anything they
want, regardless of cost, and their wishes will be fulfilled. In fact, nearly three in ten (29%) parents cut
back on regular household expenditure to accommodate the cost of the items their child would like to
have.
Boys appear to be more influential in modern Chinese households, and parents are prepared to make
more sacrifices for the sake of their male children. Over four in ten (46% vs 40% of girls) parents first
check whether money can be spent on their boy, even if they wanted to buy something for themselves.
Further, a third re-prioritised their household spending to buy something for their male child,
compared with only under a quarter (23%) of parents with girls. This could mean that boys are simply
socialised to be more vocal about what they would like to have, but equally, this could be owing to
more traditionally ingrained gender preferences in China (see Market Background section).

Family Spending Habits Marketing to Children China, November 2012
© Mintel Group Ltd. All rights reserved. 51
Family Spending Habits
Key points
Chinese middle class families spend a great deal of their disposable income on activities done
together with the family, as over six in ten parents spend their extra money on days out with
children and family holidays.
Foreign brands of casual/sportswear are preferred by far, with girls being the most likely to
choose ‘big name’ international brands (eg adidas, Puma, Converse), compared with boys.
Children from wealthier backgrounds are more vocal about their clothing choices and have
more influence on their parents.
Dads are considerably more lenient with their offspring, whilst mums are more likely to
assume a disciplinarian role.
Children’s bedrooms are full of technology (particularly true of those in tier 1 cities).
However, parents are more eager to spend on devices that help children study, rather than
those used exclusively for entertainment/gaming.
What families spend extra income on FIGURE 37: MONTHLY DISCRETIONARY EXPENDITURE, JULY 2012
“Thinking about discretionary expenditure, by which we mean money spent on non-essential products and activities such as dining out, DVDs etc. Where do you choose to spend your extra money (once all of your bills are paid and you have bought all of the things you really need)?”
Base: 1,500 internet users aged 20-49 who are classified as middle class with one child aged 0-16
SOURCE: QQSURVEY/MINTEL
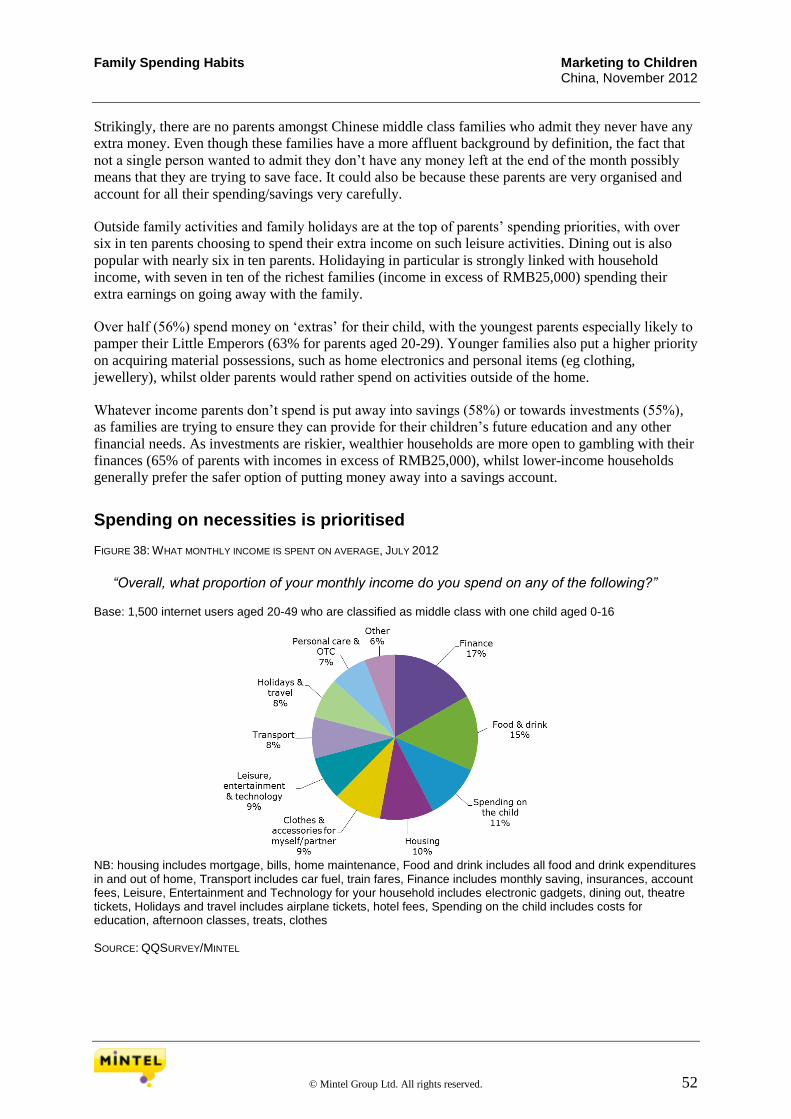
Family Spending Habits Marketing to Children China, November 2012
© Mintel Group Ltd. All rights reserved. 52
Strikingly, there are no parents amongst Chinese middle class families who admit they never have any
extra money. Even though these families have a more affluent background by definition, the fact that
not a single person wanted to admit they don’t have any money left at the end of the month possibly
means that they are trying to save face. It could also be because these parents are very organised and
account for all their spending/savings very carefully.
Outside family activities and family holidays are at the top of parents’ spending priorities, with over
six in ten parents choosing to spend their extra income on such leisure activities. Dining out is also
popular with nearly six in ten parents. Holidaying in particular is strongly linked with household
income, with seven in ten of the richest families (income in excess of RMB25,000) spending their
extra earnings on going away with the family.
Over half (56%) spend money on ‘extras’ for their child, with the youngest parents especially likely to
pamper their Little Emperors (63% for parents aged 20-29). Younger families also put a higher priority
on acquiring material possessions, such as home electronics and personal items (eg clothing,
jewellery), whilst older parents would rather spend on activities outside of the home.
Whatever income parents don’t spend is put away into savings (58%) or towards investments (55%),
as families are trying to ensure they can provide for their children’s future education and any other
financial needs. As investments are riskier, wealthier households are more open to gambling with their
finances (65% of parents with incomes in excess of RMB25,000), whilst lower-income households
generally prefer the safer option of putting money away into a savings account.
Spending on necessities is prioritised FIGURE 38: WHAT MONTHLY INCOME IS SPENT ON AVERAGE, JULY 2012
“Overall, what proportion of your monthly income do you spend on any of the following?” Base: 1,500 internet users aged 20-49 who are classified as middle class with one child aged 0-16
NB: housing includes mortgage, bills, home maintenance, Food and drink includes all food and drink expenditures in and out of home, Transport includes car fuel, train fares, Finance includes monthly saving, insurances, account fees, Leisure, Entertainment and Technology for your household includes electronic gadgets, dining out, theatre tickets, Holidays and travel includes airplane tickets, hotel fees, Spending on the child includes costs for education, afternoon classes, treats, clothes SOURCE: QQSURVEY/MINTEL

Family Spending Habits Marketing to Children China, November 2012
© Mintel Group Ltd. All rights reserved. 53
Financial products, savings and investments comprise the largest chunk of household spending (17%),
testament to the longer-term outlook espoused by Chinese middle class families. The desire to save or
put money towards financial products is stronger amongst lower-income households, as they recognise
the need to put more effort into safeguarding their children’s future. Owing to more disposable
income, wealthier households have more choice in how they spend their monthly finances.
After the necessary spend on food and drink is taken care of (15%), the needs of the child come next
(11%). Younger parents (aged 20-29) with lower disposable incomes spend proportionately more of
their earnings on their children, with 15% who allocate at least a fifth of their income each month to
provide for the needs of the offspring. As the main income providers, males aged 20-29 are especially
likely to contribute nearly a fifth of their incomes, at 19%.
On average, a tenth of household income is spent on housing costs, with younger parents paying larger
shares as they are trying to pay off their mortgage costs. With younger families taking care of the costs
of necessities, such as housing, food and drink costs and products for children, they have little left for
anything else. Parents aged 20-29 spend less on personal care products, leisure and entertainment,
holidays and travel and clothing, compared with parents aged 40-49.
Clothing purchases for children FIGURE 39: BRANDED CHILDREN’S CLOTHING BOUGHT, JULY 2012
“Have you bought any branded children’s clothing (ie adidas, Li Ning, etc.) for your child in the past 12 months? If yes, which items of clothing did you buy?”
Base: 839 internet users aged 20-49 who are classified as middle class with one child aged 5-16 %
T-shirt 87 Sportswear 84 Footwear 81 Pants/ trousers 78 Jeans 70 Button down/polo shirt 58 Accessories (eg belts, hats, scarfs, etc.) 57 Jumper 52 I have not bought any children’s clothing in the past 12 months - I have not bought any branded children’s clothing in the past 12 months - SOURCE: QQSURVEY/MINTEL
What brands and products China’s Little Emperors want as they move on from diapers, pushchairs and
car seats is important to understand. Clothing is the obvious first consideration where brands can
cement their influence. While the parents are the ones with the purse/wallet, the Little Emperor tween
or teen has some degree of say in the decision-making process. Over a quarter of parents say their
children have a say in what clothes are bought for them.
Chinese parents are extremely willing to purchase branded clothing for their children across most
major clothing categories and especially those where brand is most significant to young people, such
as sportswear (84%), jeans (70%) and T-shirts (87%). In fact, there wasn’t a single parent who
admitted that they haven’t bought any branded products for their children in the last year. This could
again be owing to the phenomenon of trying to save face, lest they appear to be callous or uncaring
towards their Little Emperors.

Family Spending Habits Marketing to Children China, November 2012
© Mintel Group Ltd. All rights reserved. 54
Most schools in China do not enforce a uniform code so branded clothing is an important part of
presentation amongst their peers. Casual sportswear is the norm or jeans and polo shirts, hence the
high rating for purchasing branded items in these key categories (84%, 70% and 58% respectively).
Girls prefer international brands of casualwear
FIGURE 40: SPORTSWEAR BRANDS BOUGHT FOR CHILD, JULY 2012
“Which, if any, of the following brands of sportswear products have you purchased for your child in the past 12 months?”
Base: 837 internet users aged 20-49 who are classified as middle class with one child aged 5-16 who purchased branded sportswear products in the past 12 months
SOURCE: QQSURVEY/MINTEL
Foreign brands dominate within the sportswear sector, with sportswear essentially equating to the
casual everyday wear for most Chinese tweens and teens. adidas and Nike rule the roost (78% and
75% respectively), although it should be noted, Li Ning (the largest Chinese sports brands in terms of
both store outlet numbers and sales) is also a favourite. The Li Ning brand broke through following its
heavy domestic exposure during the 2008 Beijing Olympics and has been the only Chinese sports
brand to seriously challenge the domination of Nike and adidas.
Puma, Converse and Kappa (technically Italian though the brand is owned and managed in China by
Dongxiang) have all been popular for some years now as sports/casual brands of both clothing and
footwear. None of these brands ostensibly advertise themselves linked to sports but rather as casual
brands – Converse to street trends such as skateboarding, Puma to nightclubs and music and Kappa to
stylish streetwear.
Anta, Peak and Dongxiang are primarily tier 2 brands and their ranges, though extensive and covering
footwear as well as sport/casual clothing, are significantly cheaper than either the international brands
or Li Ning.
There are some gender preferences in brands with girls preferring adidas (82%), whilst boys are
marginally more likely to go for Nike (76%). In general, girls appear to be more interested in foreign
brands and also more likely to choose Puma, Converse and Reebok sportswear, whilst boys prefer
cheaper domestic labels, such as Anta and Peak.

Family Spending Habits Marketing to Children China, November 2012
© Mintel Group Ltd. All rights reserved. 55
Parents of older generations are less keen on local brands than their kids. Coming from the 1980s and
1990s, when international brands were highly aspirational and domestic brands considered
significantly inferior, they have a more negative view of domestic brands than do their children.
Income is a driver of foreign brand purchases, with higher band middle class parents preferring
international brands to those on lower incomes. For instance, 84% purchased Nike products in Beijing
as opposed to only 66% in Nanjing. It should be noted that prices for Nike and adidas footwear ranges
are roughly equivalent to Western markets, making many largely unaffordable for families of lower
means. Another factor at play is distribution, as local brands are more widely purchased in tier 2 cities,
where stores for these makes are more plentiful than for the international brands.
Attitudes towards buying clothes for children FIGURE 41: ATTITUDES TOWARDS CHILD’S CLOTHING, JULY 2012
“Please tell us which of the following statements regarding the purchase of clothing for your child you would agree with?”
Base: 839 internet users aged 20-49 who are classified as middle class with one child aged 5-16 %
I make sure my child dresses according to his/ her age 70 If my child wants an item of clothing I generally purchase it for him/ her 64 I ensure my child wears fashionable clothes 45 I buy most of my child’s clothing without involving him/ her 34 TV commercials/ adverts in magazines influence my child in his/ her choice of clothes 28 I want to buy the best brands for my child since I only have one child 27 My child decides what clothes to buy 26 My child decides which brand of clothing we buy for him/her 21 My child selects the clothes he/ she wants to wear every day 18 Peer pressure amongst my child’s classmates forces me to buy branded clothes 5 I only have a limited budget for what I can spend on clothing for my child 4 I won’t spend an unreasonable amount of money on an item of clothing even if my child begs for it 3 SOURCE: QQSURVEY/MINTEL
The extreme willingness of Chinese middle class parents to purchase branded clothing for their
children likely stems from their desire to please the child, as nearly two thirds (64%) of parents would
generally purchase an item of clothing that the child asks for. However, children’s power is likely not
the only explanation, as there is evidence that parents want to ensure their offspring are well dressed.
Nearly half (45%) make sure that their child wears fashionable clothing, whilst over a third (34%) buy
more of their children’s clothing without involving them.
Children in tier 1 cities are comparatively more influential than those in tier 2 areas. While 36% of
Beijing parents and 24% of Shanghai parents stated that their child decides what clothes to buy, this
fell to lower rates in other cities and just 12% in Chengdu.
Children from wealthier backgrounds also get to make more decisions. Nearly four in ten (39%)
children of parents with monthly personal incomes of RMB15,000+ got to decide what clothing they
bought, compared to just 16% in the lower income bands.

Family Spending Habits Marketing to Children China, November 2012
© Mintel Group Ltd. All rights reserved. 56
Dads are more lenient with Little Emperors FIGURE 42: ATTITUDES TOWARDS CHILD’S CLOTHING, BY GENDER OF PARENT, JULY 2012 Base: 839 internet users aged 20-49 who are classified as middle class with one child aged 5-16
SOURCE: QQSURVEY/MINTEL
Dads appear to be more lax when their offspring asks for something, with nearly a third (32% vs 15%
of mums) who agree that their child decides what clothes to buy and a quarter (vs 14% of mums) who
let the child decide on the brands. Dads also place more emphasis on status and image, and are more
inclined to ensure that their Little Emperor wears fashionable clothing (48%).
Re-affirming mums’ disciplinarian role, nearly half (47%) buy most clothing for their child without
consulting them. Mums are also less soft when it comes to giving into children’s pester power, with
under six in ten (59%) who buy clothes for the child if they ask for it, compared with 68% of dads.
Parents report a higher influence of television and magazine adverts (28%) compared with children’s
peers in school (5%). Considering the emphasis on studying and extra-curricular activities, Little
Emperors are left with little time to spend with their friends. On an average day, children would spend
about nine hours on commuting to school, attending classes, doing extra-curricular activities and
homework and exercising. Only two hours are allocated to socialising with friends, which perhaps
limits friends’ influence on the Little Emperors. At the same time, high ownership of books and
magazines (87%) and TVs (45%) in children’s bedrooms gives them plenty of opportunities to get
ideas about clothing they would like to wear.
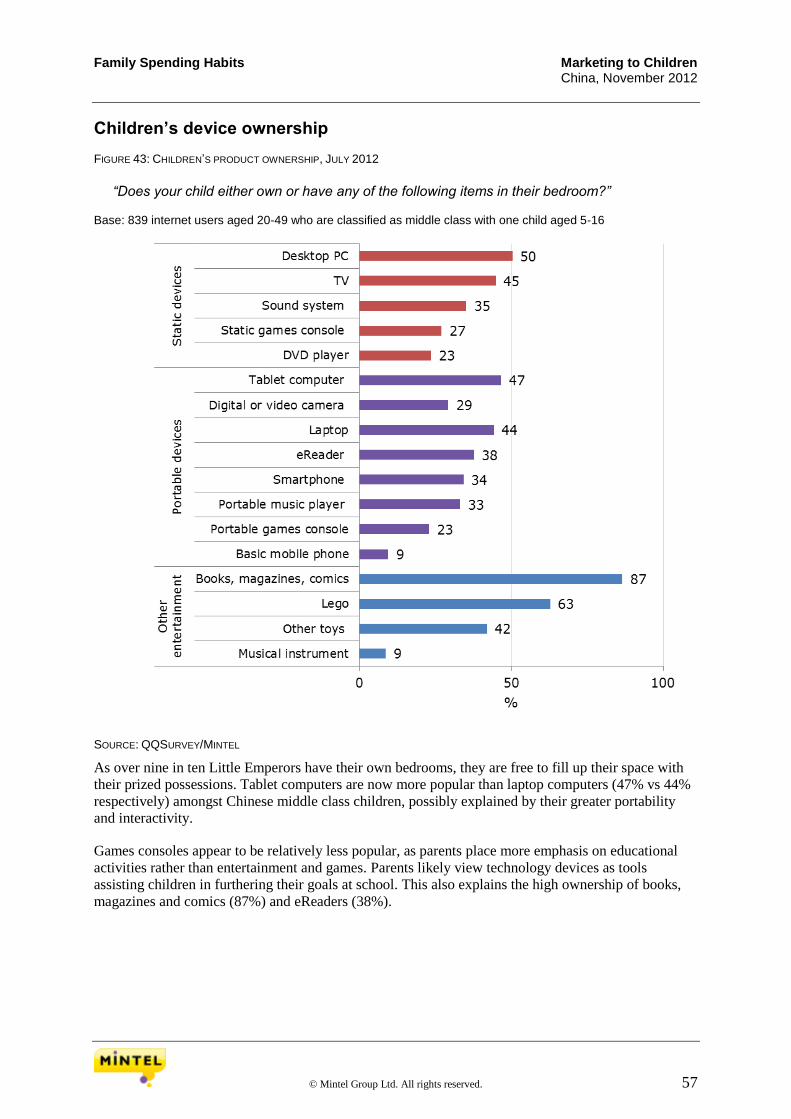
Family Spending Habits Marketing to Children China, November 2012
© Mintel Group Ltd. All rights reserved. 57
Children’s device ownership FIGURE 43: CHILDREN’S PRODUCT OWNERSHIP, JULY 2012
“Does your child either own or have any of the following items in their bedroom?” Base: 839 internet users aged 20-49 who are classified as middle class with one child aged 5-16
SOURCE: QQSURVEY/MINTEL
As over nine in ten Little Emperors have their own bedrooms, they are free to fill up their space with
their prized possessions. Tablet computers are now more popular than laptop computers (47% vs 44%
respectively) amongst Chinese middle class children, possibly explained by their greater portability
and interactivity.
Games consoles appear to be relatively less popular, as parents place more emphasis on educational
activities rather than entertainment and games. Parents likely view technology devices as tools
assisting children in furthering their goals at school. This also explains the high ownership of books,
magazines and comics (87%) and eReaders (38%).
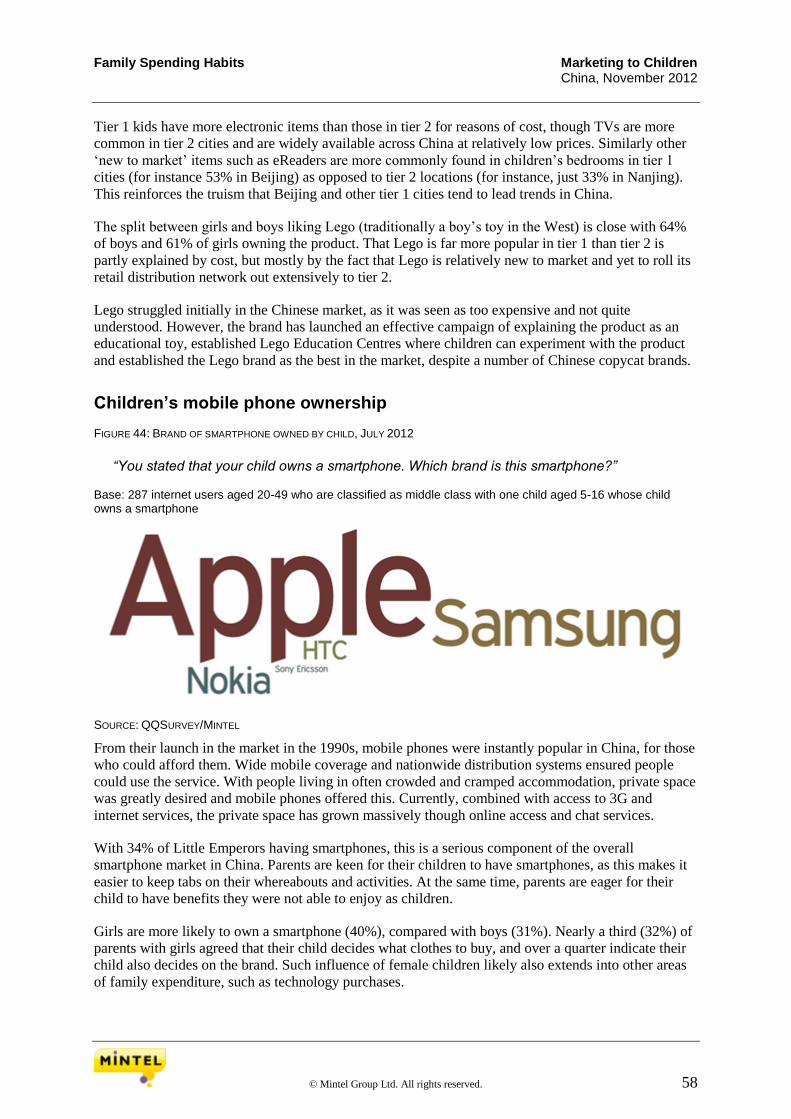
Family Spending Habits Marketing to Children China, November 2012
© Mintel Group Ltd. All rights reserved. 58
Tier 1 kids have more electronic items than those in tier 2 for reasons of cost, though TVs are more
common in tier 2 cities and are widely available across China at relatively low prices. Similarly other
‘new to market’ items such as eReaders are more commonly found in children’s bedrooms in tier 1
cities (for instance 53% in Beijing) as opposed to tier 2 locations (for instance, just 33% in Nanjing).
This reinforces the truism that Beijing and other tier 1 cities tend to lead trends in China.
The split between girls and boys liking Lego (traditionally a boy’s toy in the West) is close with 64%
of boys and 61% of girls owning the product. That Lego is far more popular in tier 1 than tier 2 is
partly explained by cost, but mostly by the fact that Lego is relatively new to market and yet to roll its
retail distribution network out extensively to tier 2.
Lego struggled initially in the Chinese market, as it was seen as too expensive and not quite
understood. However, the brand has launched an effective campaign of explaining the product as an
educational toy, established Lego Education Centres where children can experiment with the product
and established the Lego brand as the best in the market, despite a number of Chinese copycat brands.
Children’s mobile phone ownership FIGURE 44: BRAND OF SMARTPHONE OWNED BY CHILD, JULY 2012
“You stated that your child owns a smartphone. Which brand is this smartphone?” Base: 287 internet users aged 20-49 who are classified as middle class with one child aged 5-16 whose child owns a smartphone
SOURCE: QQSURVEY/MINTEL
From their launch in the market in the 1990s, mobile phones were instantly popular in China, for those
who could afford them. Wide mobile coverage and nationwide distribution systems ensured people
could use the service. With people living in often crowded and cramped accommodation, private space
was greatly desired and mobile phones offered this. Currently, combined with access to 3G and
internet services, the private space has grown massively though online access and chat services.
With 34% of Little Emperors having smartphones, this is a serious component of the overall
smartphone market in China. Parents are keen for their children to have smartphones, as this makes it
easier to keep tabs on their whereabouts and activities. At the same time, parents are eager for their
child to have benefits they were not able to enjoy as children.
Girls are more likely to own a smartphone (40%), compared with boys (31%). Nearly a third (32%) of
parents with girls agreed that their child decides what clothes to buy, and over a quarter indicate their
child also decides on the brand. Such influence of female children likely also extends into other areas
of family expenditure, such as technology purchases.
Family Spending Habits Marketing to Children China, November 2012
© Mintel Group Ltd. All rights reserved. 59
Nearly half (49%) of kids with a smartphone have an Apple iPhone, though Samsung has also been
popular (23%). The Samsung brand benefits from the general belief among most middle class Chinese
consumers that products made in South Korea are well made, technologically advanced and good
quality.
Chinese middle class children’s bedrooms are heavily equipped with latest technologies, making
Littler Emperors highly connected at any moment. There is ample room for brands to interact with
these budding consumers, as already evidenced by the high influence of TV and magazine content on
children’s clothing choices. However, there is a danger that technology may replace real world social
interactions, with children dedicating most of their time to one form of educational activity or another.
Perhaps, parents should play a greater role in introducing greater balance into their child’s daily
routines.

Family Leisure and Holiday Habits Marketing to Children China, November 2012
© Mintel Group Ltd. All rights reserved. 60
Family Leisure and Holiday Habits
Key points
As the Chinese middle class is growing, they are increasingly travelling abroad, with 16%
who travelled to Europe and 17% who travelled to the US over the past year.
With their known preference for foreign brands of clothing, shoes and accessories, Chinese
tourists hold great purchasing potential. This segment is especially lucrative, as they tend to
travel with children and are likely to give in to their demands.
Just as in the West, television dominates family leisure time, with nearly seven in ten families
regularly watching TV or DVDs.
Spending days out and dining out are also popular with Chinese families, however, families
start spending less time together as children get older and focus on their studies or develop
new circles of friends.
Family holiday habits FIGURE 45: HOLIDAYS TAKEN IN THE PAST 12 MONTHS, JULY 2012
“Which, if any, of these holidays have you taken with your child in the past 12 months?” Base: 1,500 internet users aged 20-49 who are classified as middle class with one child aged 0-16
SOURCE: QQSURVEY/MINTEL
Over the last decade international travel has become much more accessible and affordable and China’s
middle class is travelling as never before (for more on middle class travel destinations, plans and
habits when abroad see Mintel report Consumer Lifestyles: China’s Middle Class – China, June 2012).

Family Leisure and Holiday Habits Marketing to Children China, November 2012
© Mintel Group Ltd. All rights reserved. 61
Nearly nine in ten (88%) families went on some sort of holiday, mostly in Asia (for which Hong Kong
and Macao account for 85% of those holidays) over the past year. However, 16% travelled to Europe
(primarily to the UK and France with 12% and 9% respectively). In 2012, the UK surpassed France as
the major European destination helped by the fact that London hosted the Olympics and the Queen’s
Jubilee celebrations but also owing to many Chinese having already visited France and to the cheap
Pound relative to the RMB.
Propensity to travel to North America, Australasia and Europe rises with household income, and these
most affluent families will likely travel not just for the scenery and culture, but also to purchase their
favourite foreign brands.
The Little Emperors are the first generation of Chinese to go abroad en masse as children and see the
world outside of China. This will go a long way to shaping their worldviews later in life, their
expectations and their willingness to study abroad.
Overseas travel is growing FIGURE 46: HOLIDAYS TAKEN IN THE PAST 12 MONTHS, JULY 2012 Base: 1,500 internet users aged 20-49 who are classified as middle class with one child aged 0-16
SOURCE: QQSURVEY/MINTEL
In 2012, Chinese tourists became the single largest national group of visitors to Australia. That 17%
went to America is a sign of things to come – America has long been the number one ‘most wanted’
destination, but ‘approved destination status’ was denied travel groups from China for decades by
Beijing, while visa issuance from the American side was limited. The trend changed when America
started issuing more visas to attract high-spending Chinese tourists in the recession, and Beijing
granted the US ‘approved destination status’.
According to the World Tourism Organization, the number of overseas trips made by Chinese people
will surge from 70 million in 2011 to 100 million by the end of the decade, up from just 5 million 15
years ago. Rapid growth in Chinese affluent middle class, and increasing propensity towards
international travel with children, means that government policies should be aiming to capture their
growing spending power.
This is especially important as Chinese middle class families are big purchasers of luxury and other
higher-end brands, and are prone to succumbing to their children’s demands. Current visa UK
restrictions as well as a lengthy application process may serve as an impediment for this lucrative
segment of shoppers, especially in the face of continuing economic downturn.

Family Leisure and Holiday Habits Marketing to Children China, November 2012
© Mintel Group Ltd. All rights reserved. 62
Family leisure activities FIGURE 47: FAMILY LEISURE ACTIVITIES DONE REGULARLY, JULY 2012
“Thinking about what you do with your child in your leisure time and how often you do it, which, if any, of the following do you do?”
Base: 1,500 internet users aged 20-49 who are classified as middle class with one child aged 0-16
SOURCE: QQSURVEY/MINTEL
Watching TV is the most popular activity, with nearly seven in ten (68%) families who report doing it
regularly. Nearly two thirds (65%) of Chinese middle class families frequently eat out together. As
Chinese extended families rarely eat at home together, restaurants are an important part of family
leisure. Spending on days out and dining out are at the top of what extra income is spent on (see
Family Spending Habits section), and is further testament to how important family experiences are to
Chinese middle class parents.
Nearly half (47%) of Chinese parents go shopping with their child, and over half (56%) admit they
spend their extra income on small treats for their offspring. Coupled with parents’ inability to refuse
buying things for children if they ask, shopping trips likely result in many unplanned purchases.
Visiting relatives is an important activity in China, with 41% paying a visit at least once a week and
48% at least once a month. However, this figure may not be as high as it once was given the massive
flows of internal migration within China and the large number of families now spread across the
country. As mentioned previously, while grandparents are still important as child carers, they are often
no longer living in close proximity to their grandchildren. Equally, visits to aunts and uncles are now
rarer given that the current generation often has no aunts and uncles due to the One-Child Policy.

Family Leisure and Holiday Habits Marketing to Children China, November 2012
© Mintel Group Ltd. All rights reserved. 63
Generally, family activities are more regular when children are younger. As they grow up and have
more demands on their time, such as studying or doing extra-curricular activities, spending time with
family outside of home drops off somewhat. This trend also coincides with older children (especially
those aged 10-16) starting to develop their own preferences for what they would like to do in their
spare time. Perhaps, influence of their friends also comes to the fore.

A Day in the Life of a Little Emperor Marketing to Children China, November 2012
© Mintel Group Ltd. All rights reserved. 64
A Day in the Life of a Little Emperor
Key points
An average of eight hours is allocated to activities related to schooling, be it commuting to
school, attending classes or doing homework.
Parents would typically assume the main responsibility for looking after their Little
Emperors, however, grandparents are also likely to pitch in, especially when it comes to
making meals and doing outside activities.
There is a very traditional division of household duties in Chinese middle class households,
with mothers doing the majority of childcare-related tasks.
The older the child, the more time he/she spends on his/her own (eg studying/playing in their
bedroom). Whilst this is indubitably for the benefit of their grades, it might also mean that
Little Emperors grow up lacking in ‘soft’ skills, such as confidence in a group,
communication and negotiation skills, highly prized in modern global businesses.

A Day in the Life of a Little Emperor Marketing to Children China, November 2012
© Mintel Group Ltd. All rights reserved. 65
A child’s typical day FIGURE 48: A CHILD’S DAY – AVERAGE TIME SPENT ON EACH ACTIVITY, JULY 2012 Base: 839 internet users aged 20-49 who are classified as middle class with one child aged 5-16
SOURCE: QQSURVEY/MINTEL
The largest chunk of a typical day is allocated to activities related to children’s education, with
commuting to school, classes and extra-curricular activities attendance and homework taking on
average eight hours each day.
Children spend on average about four hours a day with friends and family, but in reality there is likely
some crossover between time spent with parents and friends and doing homework or other academic
activities. Children get about an hour a day to spend on leisure, which likely takes the form of
watching TV (see Family Leisure and Holiday Habits section).
Boys spend marginally more time doing homework, compared with girls, who are instead more likely
to hang out with their friends, which is perhaps an indication that parents might be putting more
pressure on boys to succeed academically in order to be future income providers in their families.
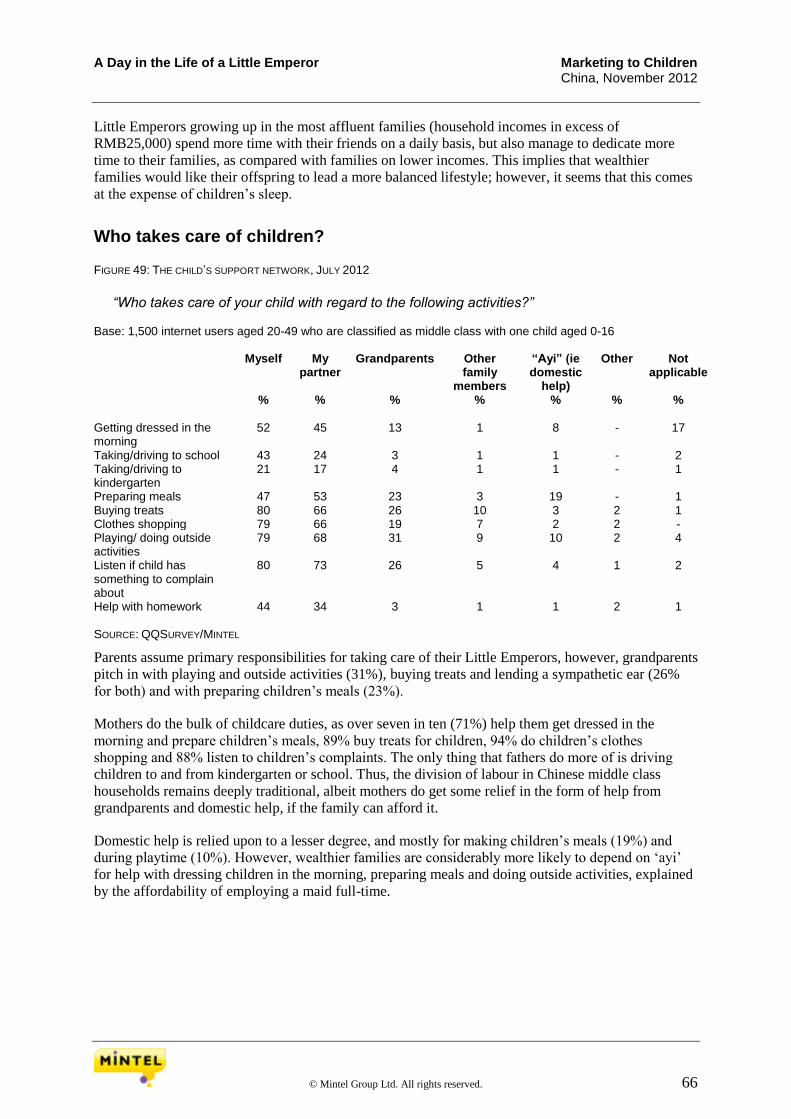
A Day in the Life of a Little Emperor Marketing to Children China, November 2012
© Mintel Group Ltd. All rights reserved. 66
Little Emperors growing up in the most affluent families (household incomes in excess of
RMB25,000) spend more time with their friends on a daily basis, but also manage to dedicate more
time to their families, as compared with families on lower incomes. This implies that wealthier
families would like their offspring to lead a more balanced lifestyle; however, it seems that this comes
at the expense of children’s sleep.
Who takes care of children? FIGURE 49: THE CHILD’S SUPPORT NETWORK, JULY 2012
“Who takes care of your child with regard to the following activities?” Base: 1,500 internet users aged 20-49 who are classified as middle class with one child aged 0-16 Myself My
partner Grandparents Other
family members
“Ayi” (ie domestic
help)
Other Not applicable
% % % % % % %
Getting dressed in the morning
52 45 13 1 8 - 17
Taking/driving to school 43 24 3 1 1 - 2 Taking/driving to kindergarten
21 17 4 1 1 - 1
Preparing meals 47 53 23 3 19 - 1 Buying treats 80 66 26 10 3 2 1 Clothes shopping 79 66 19 7 2 2 - Playing/ doing outside activities
79 68 31 9 10 2 4
Listen if child has something to complain about
80 73 26 5 4 1 2
Help with homework 44 34 3 1 1 2 1 SOURCE: QQSURVEY/MINTEL
Parents assume primary responsibilities for taking care of their Little Emperors, however, grandparents
pitch in with playing and outside activities (31%), buying treats and lending a sympathetic ear (26%
for both) and with preparing children’s meals (23%).
Mothers do the bulk of childcare duties, as over seven in ten (71%) help them get dressed in the
morning and prepare children’s meals, 89% buy treats for children, 94% do children’s clothes
shopping and 88% listen to children’s complaints. The only thing that fathers do more of is driving
children to and from kindergarten or school. Thus, the division of labour in Chinese middle class
households remains deeply traditional, albeit mothers do get some relief in the form of help from
grandparents and domestic help, if the family can afford it.
Domestic help is relied upon to a lesser degree, and mostly for making children’s meals (19%) and
during playtime (10%). However, wealthier families are considerably more likely to depend on ‘ayi’
for help with dressing children in the morning, preparing meals and doing outside activities, explained
by the affordability of employing a maid full-time.

A Day in the Life of a Little Emperor Marketing to Children China, November 2012
© Mintel Group Ltd. All rights reserved. 67
How connected are children with other family members? FIGURE 50: PEOPLE THE CHILD SPENDS TIME WITH – AVERAGE TIME SPENT WITH EACH, JULY 2012
“Of such a typical day, how much time would you say your child spends in the company of each of the following…?”
Base: 1,500 internet users aged 20-49 who are classified as middle class with one child aged 0-16
SOURCE: QQSURVEY/MINTEL
As mothers and fathers are typically the ones most heavily involved in taking care of their offspring, it
follows that parents are the most likely to spend ten or more hours a day with the Little Emperor.
However, over a third of children spend five or more hours a day on their own, likely in their bedroom
and surrounded by toys and technology devices (see Family Spending Habits section).
As children grow up they start spending more and more time without any company, with over half
(52%) of children aged 10-16 spending five hours or more by themselves, which is likely linked to the
fact that they are single children. Time spent with any other family members decreases dramatically
with children’s age, and grandparents in particular take on a much less active role in bringing up
grandkids.
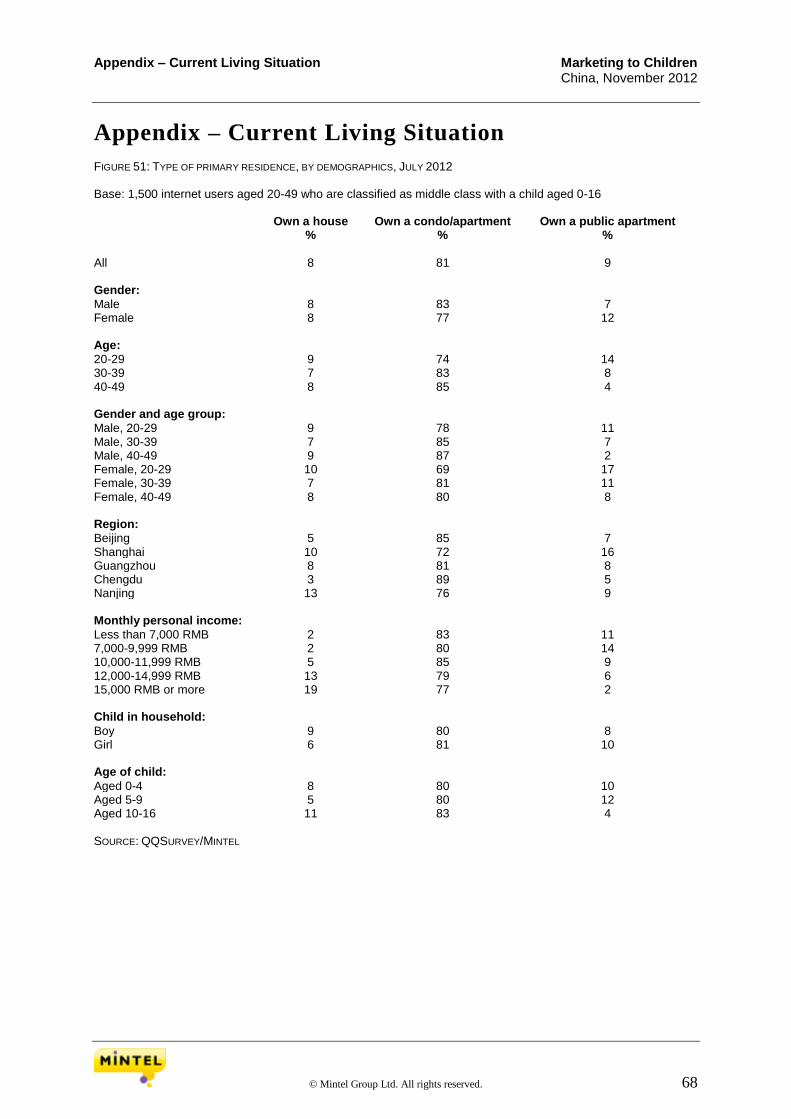
Appendix – Current Living Situation Marketing to Children China, November 2012
© Mintel Group Ltd. All rights reserved. 68
Appendix – Current Living Situation FIGURE 51: TYPE OF PRIMARY RESIDENCE, BY DEMOGRAPHICS, JULY 2012 Base: 1,500 internet users aged 20-49 who are classified as middle class with a child aged 0-16 Own a house Own a condo/apartment Own a public apartment % % %
All 8 81 9 Gender: Male 8 83 7 Female 8 77 12 Age: 20-29 9 74 14 30-39 7 83 8 40-49 8 85 4 Gender and age group: Male, 20-29 9 78 11 Male, 30-39 7 85 7 Male, 40-49 9 87 2 Female, 20-29 10 69 17 Female, 30-39 7 81 11 Female, 40-49 8 80 8 Region: Beijing 5 85 7 Shanghai 10 72 16 Guangzhou 8 81 8 Chengdu 3 89 5 Nanjing 13 76 9 Monthly personal income: Less than 7,000 RMB 2 83 11 7,000-9,999 RMB 2 80 14 10,000-11,999 RMB 5 85 9 12,000-14,999 RMB 13 79 6 15,000 RMB or more 19 77 2 Child in household: Boy 9 80 8 Girl 6 81 10 Age of child: Aged 0-4 8 80 10 Aged 5-9 5 80 12 Aged 10-16 11 83 4 SOURCE: QQSURVEY/MINTEL
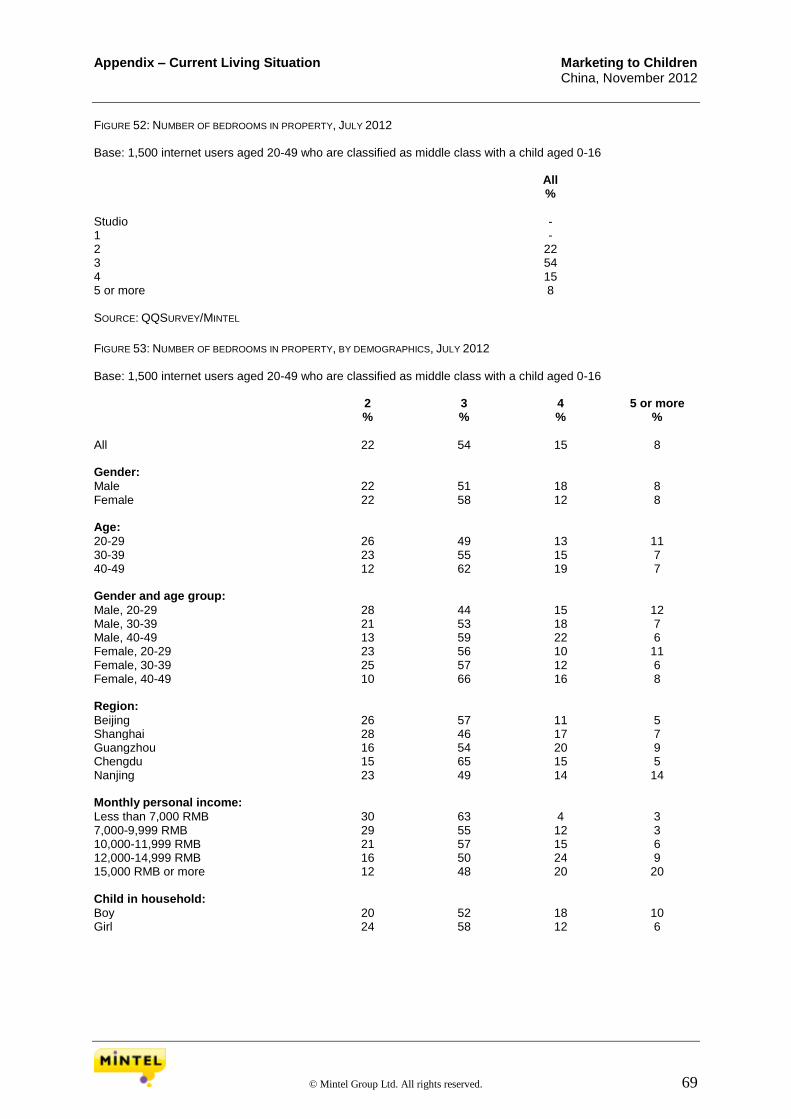
Appendix – Current Living Situation Marketing to Children China, November 2012
© Mintel Group Ltd. All rights reserved. 69
FIGURE 52: NUMBER OF BEDROOMS IN PROPERTY, JULY 2012 Base: 1,500 internet users aged 20-49 who are classified as middle class with a child aged 0-16 All %
Studio - 1 - 2 22 3 54 4 15 5 or more 8 SOURCE: QQSURVEY/MINTEL
FIGURE 53: NUMBER OF BEDROOMS IN PROPERTY, BY DEMOGRAPHICS, JULY 2012 Base: 1,500 internet users aged 20-49 who are classified as middle class with a child aged 0-16 2 3 4 5 or more % % % %
All 22 54 15 8 Gender: Male 22 51 18 8 Female 22 58 12 8 Age: 20-29 26 49 13 11 30-39 23 55 15 7 40-49 12 62 19 7 Gender and age group: Male, 20-29 28 44 15 12 Male, 30-39 21 53 18 7 Male, 40-49 13 59 22 6 Female, 20-29 23 56 10 11 Female, 30-39 25 57 12 6 Female, 40-49 10 66 16 8 Region: Beijing 26 57 11 5 Shanghai 28 46 17 7 Guangzhou 16 54 20 9 Chengdu 15 65 15 5 Nanjing 23 49 14 14 Monthly personal income: Less than 7,000 RMB 30 63 4 3 7,000-9,999 RMB 29 55 12 3 10,000-11,999 RMB 21 57 15 6 12,000-14,999 RMB 16 50 24 9 15,000 RMB or more 12 48 20 20 Child in household: Boy 20 52 18 10 Girl 24 58 12 6
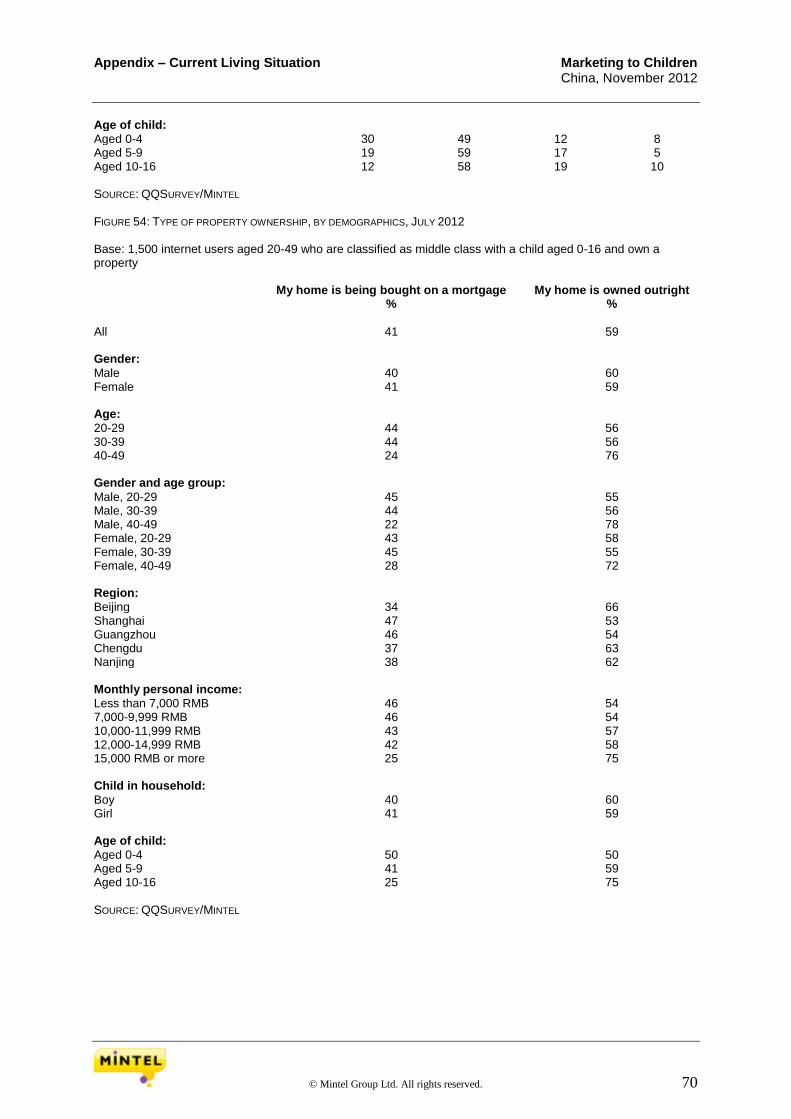
Appendix – Current Living Situation Marketing to Children China, November 2012
© Mintel Group Ltd. All rights reserved. 70
Age of child: Aged 0-4 30 49 12 8 Aged 5-9 19 59 17 5 Aged 10-16 12 58 19 10 SOURCE: QQSURVEY/MINTEL FIGURE 54: TYPE OF PROPERTY OWNERSHIP, BY DEMOGRAPHICS, JULY 2012 Base: 1,500 internet users aged 20-49 who are classified as middle class with a child aged 0-16 and own a property My home is being bought on a mortgage My home is owned outright % %
All 41 59 Gender: Male 40 60 Female 41 59 Age: 20-29 44 56 30-39 44 56 40-49 24 76 Gender and age group: Male, 20-29 45 55 Male, 30-39 44 56 Male, 40-49 22 78 Female, 20-29 43 58 Female, 30-39 45 55 Female, 40-49 28 72 Region: Beijing 34 66 Shanghai 47 53 Guangzhou 46 54 Chengdu 37 63 Nanjing 38 62 Monthly personal income: Less than 7,000 RMB 46 54 7,000-9,999 RMB 46 54 10,000-11,999 RMB 43 57 12,000-14,999 RMB 42 58 15,000 RMB or more 25 75 Child in household: Boy 40 60 Girl 41 59 Age of child: Aged 0-4 50 50 Aged 5-9 41 59 Aged 10-16 25 75 SOURCE: QQSURVEY/MINTEL
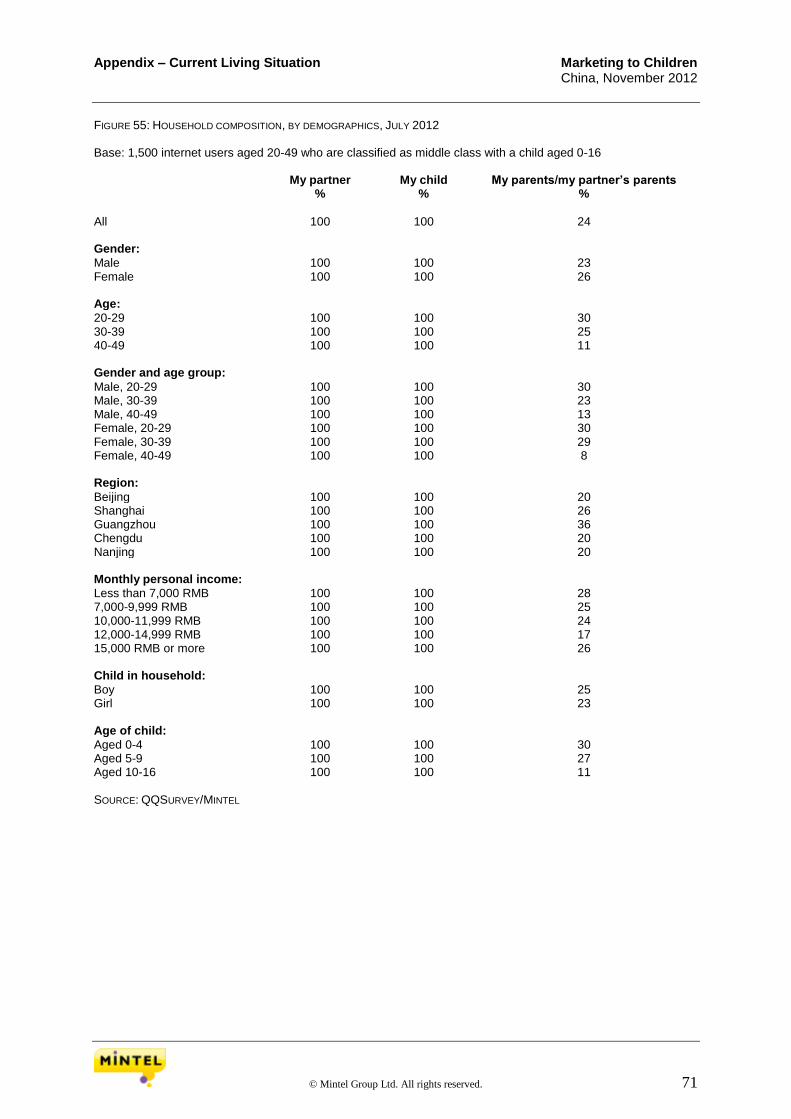
Appendix – Current Living Situation Marketing to Children China, November 2012
© Mintel Group Ltd. All rights reserved. 71
FIGURE 55: HOUSEHOLD COMPOSITION, BY DEMOGRAPHICS, JULY 2012 Base: 1,500 internet users aged 20-49 who are classified as middle class with a child aged 0-16 My partner My child My parents/my partner’s parents % % %
All 100 100 24 Gender: Male 100 100 23 Female 100 100 26 Age: 20-29 100 100 30 30-39 100 100 25 40-49 100 100 11 Gender and age group: Male, 20-29 100 100 30 Male, 30-39 100 100 23 Male, 40-49 100 100 13 Female, 20-29 100 100 30 Female, 30-39 100 100 29 Female, 40-49 100 100 8 Region: Beijing 100 100 20 Shanghai 100 100 26 Guangzhou 100 100 36 Chengdu 100 100 20 Nanjing 100 100 20 Monthly personal income: Less than 7,000 RMB 100 100 28 7,000-9,999 RMB 100 100 25 10,000-11,999 RMB 100 100 24 12,000-14,999 RMB 100 100 17 15,000 RMB or more 100 100 26 Child in household: Boy 100 100 25 Girl 100 100 23 Age of child: Aged 0-4 100 100 30 Aged 5-9 100 100 27 Aged 10-16 100 100 11 SOURCE: QQSURVEY/MINTEL
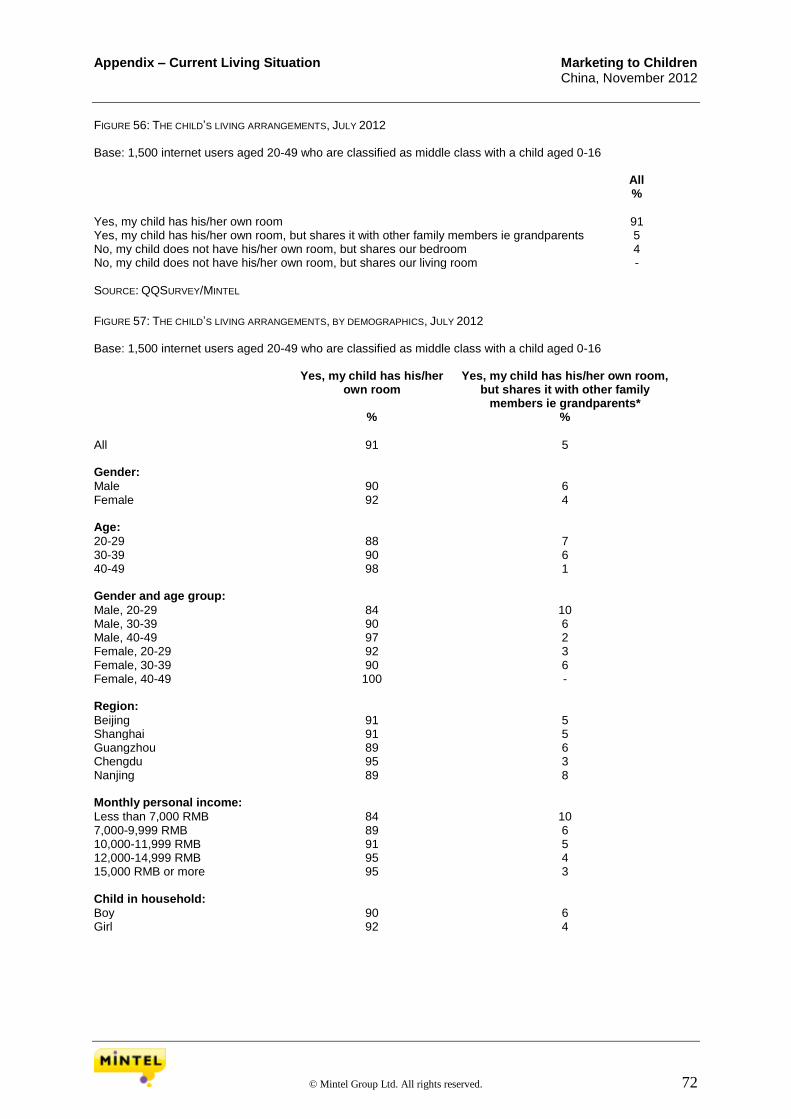
Appendix – Current Living Situation Marketing to Children China, November 2012
© Mintel Group Ltd. All rights reserved. 72
FIGURE 56: THE CHILD’S LIVING ARRANGEMENTS, JULY 2012 Base: 1,500 internet users aged 20-49 who are classified as middle class with a child aged 0-16 All %
Yes, my child has his/her own room 91 Yes, my child has his/her own room, but shares it with other family members ie grandparents 5 No, my child does not have his/her own room, but shares our bedroom 4 No, my child does not have his/her own room, but shares our living room - SOURCE: QQSURVEY/MINTEL
FIGURE 57: THE CHILD’S LIVING ARRANGEMENTS, BY DEMOGRAPHICS, JULY 2012 Base: 1,500 internet users aged 20-49 who are classified as middle class with a child aged 0-16 Yes, my child has his/her
own room Yes, my child has his/her own room,
but shares it with other family members ie grandparents*
% %
All 91 5 Gender: Male 90 6 Female 92 4 Age: 20-29 88 7 30-39 90 6 40-49 98 1 Gender and age group: Male, 20-29 84 10 Male, 30-39 90 6 Male, 40-49 97 2 Female, 20-29 92 3 Female, 30-39 90 6 Female, 40-49 100 - Region: Beijing 91 5 Shanghai 91 5 Guangzhou 89 6 Chengdu 95 3 Nanjing 89 8 Monthly personal income: Less than 7,000 RMB 84 10 7,000-9,999 RMB 89 6 10,000-11,999 RMB 91 5 12,000-14,999 RMB 95 4 15,000 RMB or more 95 3 Child in household: Boy 90 6 Girl 92 4
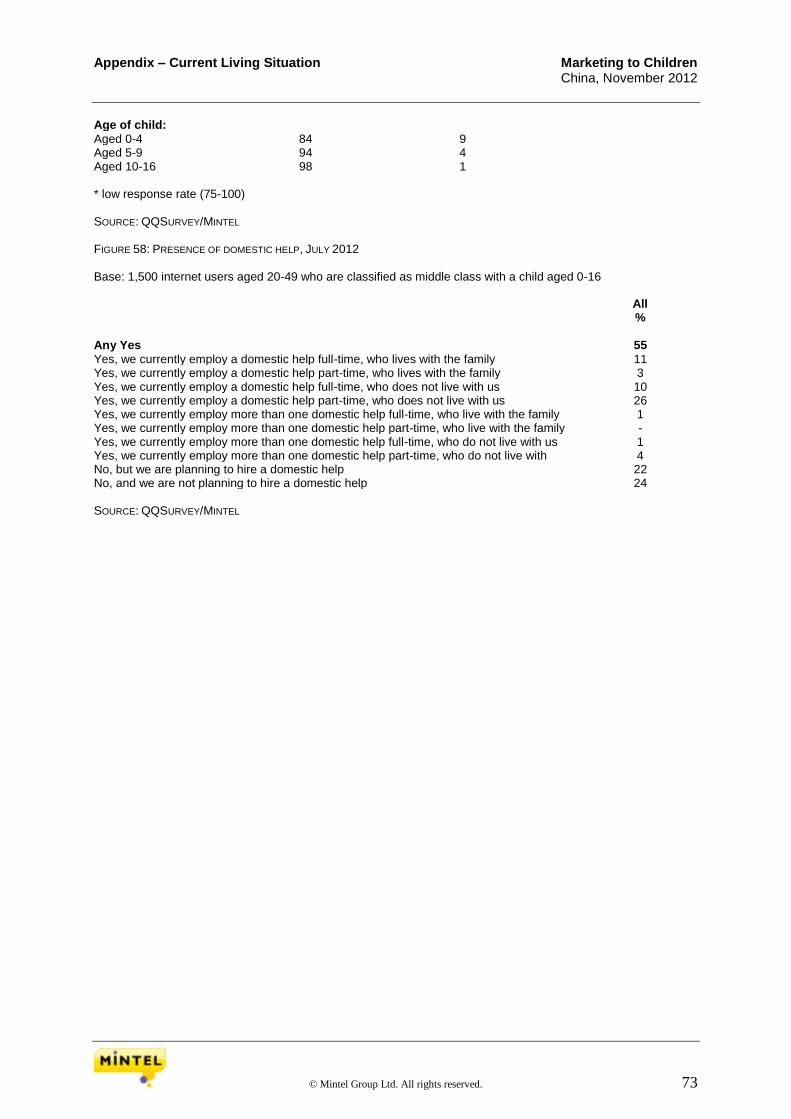
Appendix – Current Living Situation Marketing to Children China, November 2012
© Mintel Group Ltd. All rights reserved. 73
Age of child: Aged 0-4 84 9 Aged 5-9 94 4 Aged 10-16 98 1 * low response rate (75-100) SOURCE: QQSURVEY/MINTEL FIGURE 58: PRESENCE OF DOMESTIC HELP, JULY 2012 Base: 1,500 internet users aged 20-49 who are classified as middle class with a child aged 0-16 All %
Any Yes 55
Yes, we currently employ a domestic help full-time, who lives with the family 11 Yes, we currently employ a domestic help part-time, who lives with the family 3 Yes, we currently employ a domestic help full-time, who does not live with us 10 Yes, we currently employ a domestic help part-time, who does not live with us 26 Yes, we currently employ more than one domestic help full-time, who live with the family 1 Yes, we currently employ more than one domestic help part-time, who live with the family - Yes, we currently employ more than one domestic help full-time, who do not live with us 1 Yes, we currently employ more than one domestic help part-time, who do not live with 4 No, but we are planning to hire a domestic help 22 No, and we are not planning to hire a domestic help 24 SOURCE: QQSURVEY/MINTEL

Appendix – Current Living Situation Marketing to Children China, November 2012
© Mintel Group Ltd. All rights reserved. 74
FIGURE 59: PRESENCE OF DOMESTIC HELP, BY DEMOGRAPHICS, JULY 2012 Base: 1,500 internet users aged 20-49 who are classified as middle class with a child aged 0-16 Any Yes Yes, we currently
employ a domestic help full-time, who lives with the
family
Yes, we currently employ a
domestic help full-time, who does not live
with us
Yes, we currently employ a domestic help part-time, who does not
live with us
% % % %
All 55 11 10 26 Gender: Male 56 12 10 26 Female 52 10 9 27 Age: 20-29 61 16 8 27 30-39 53 11 11 25 40-49 49 4 8 30 Gender and age group: Male, 20-29 60 17 9 21 Male, 30-39 54 11 12 24 Male, 40-49 57 5 7 40 Female, 20-29 63 14 7 35 Female, 30-39 51 11 10 26 Female, 40-49 36 3 11 14 Region: Beijing 61 9 8 33 Shanghai 62 14 11 30 Guangzhou 52 9 12 24 Chengdu 52 11 9 25 Nanjing 46 13 8 18 Monthly personal income: Less than 7,000 RMB 39 7 3 22 7,000-9,999 RMB 47 5 10 24 10,000-11,999 RMB 49 11 9 22 12,000-14,999 RMB 63 12 13 30 15,000 RMB or more 75 23 11 33 Child in household: Boy 55 13 11 24 Girl 54 9 7 30 Age of child: Aged 0-4 59 15 9 24 Aged 5-9 53 7 11 28 Aged 10-16 50 9 9 29 SOURCE: QQSURVEY/MINTEL

Appendix – Current Living Situation Marketing to Children China, November 2012
© Mintel Group Ltd. All rights reserved. 75
FIGURE 60: PRESENCE OF DOMESTIC HELP, BY DEMOGRAPHICS, JULY 2012 Base: 1,500 internet users aged 20-49 who are classified as middle class with a child aged 0-16 No, but we are planning to hire a
domestic help No, and we are not planning to hire a
domestic help % %
All 22 24 Gender: Male 21 23 Female 23 25 Age: 20-29 24 15 30-39 21 26 40-49 19 32 Gender and age group: Male, 20-29 23 17 Male, 30-39 21 25 Male, 40-49 17 26 Female, 20-29 25 13 Female, 30-39 21 27 Female, 40-49 22 42 Region: Beijing 19 20 Shanghai 23 15 Guangzhou 24 24 Chengdu 19 29 Nanjing 22 32 Monthly personal income: Less than 7,000 RMB 26 36 7,000-9,999 RMB 26 27 10,000-11,999 RMB 25 26 12,000-14,999 RMB 18 19 15,000 RMB or more 12 13 Child in household: Boy 21 24 Girl 23 23 Age of child: Aged 0-4 24 17 Aged 5-9 19 29 Aged 10-16 20 29 SOURCE: QQSURVEY/MINTEL
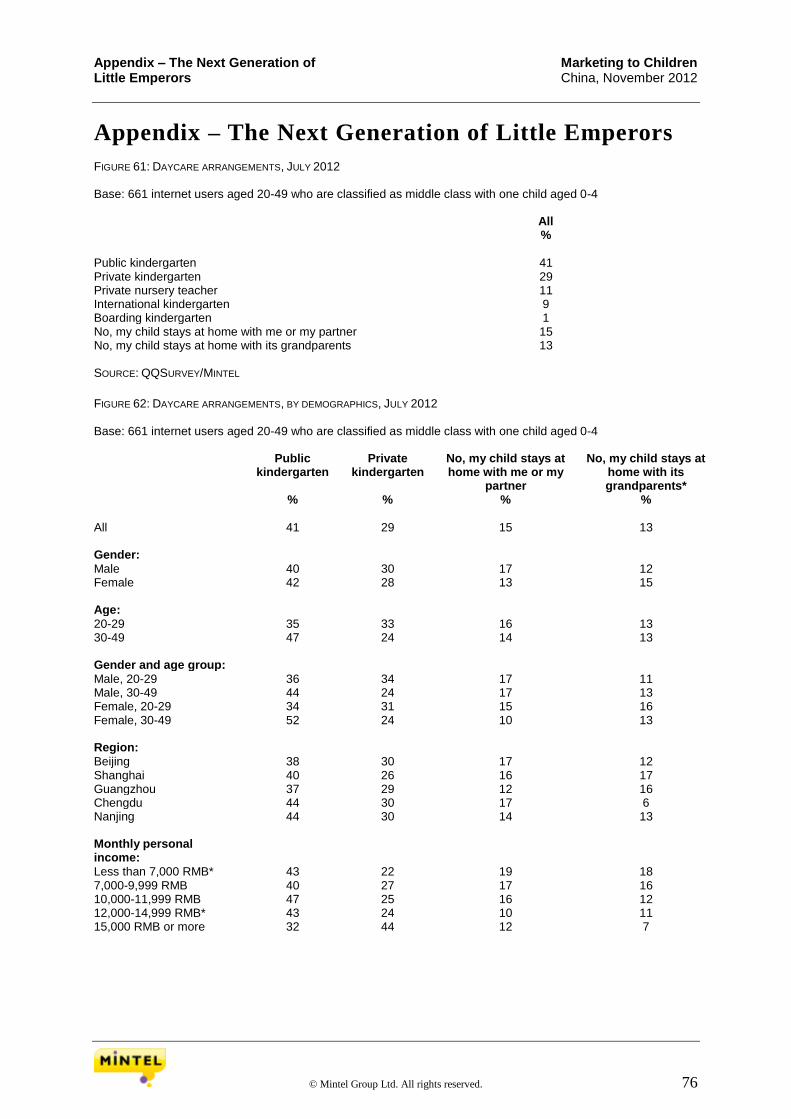
Appendix – The Next Generation of Marketing to Children Little Emperors China, November 2012
© Mintel Group Ltd. All rights reserved. 76
Appendix – The Next Generation of Little Emperors FIGURE 61: DAYCARE ARRANGEMENTS, JULY 2012 Base: 661 internet users aged 20-49 who are classified as middle class with one child aged 0-4 All %
Public kindergarten 41 Private kindergarten 29 Private nursery teacher 11 International kindergarten 9 Boarding kindergarten 1 No, my child stays at home with me or my partner 15 No, my child stays at home with its grandparents 13 SOURCE: QQSURVEY/MINTEL
FIGURE 62: DAYCARE ARRANGEMENTS, BY DEMOGRAPHICS, JULY 2012 Base: 661 internet users aged 20-49 who are classified as middle class with one child aged 0-4 Public
kindergarten Private
kindergarten No, my child stays at home with me or my
partner
No, my child stays at home with its grandparents*
% % % %
All 41 29 15 13 Gender: Male 40 30 17 12 Female 42 28 13 15 Age: 20-29 35 33 16 13 30-49 47 24 14 13 Gender and age group: Male, 20-29 36 34 17 11 Male, 30-49 44 24 17 13 Female, 20-29 34 31 15 16 Female, 30-49 52 24 10 13 Region: Beijing 38 30 17 12 Shanghai 40 26 16 17 Guangzhou 37 29 12 16 Chengdu 44 30 17 6 Nanjing 44 30 14 13 Monthly personal income:
Less than 7,000 RMB* 43 22 19 18 7,000-9,999 RMB 40 27 17 16 10,000-11,999 RMB 47 25 16 12 12,000-14,999 RMB* 43 24 10 11 15,000 RMB or more 32 44 12 7
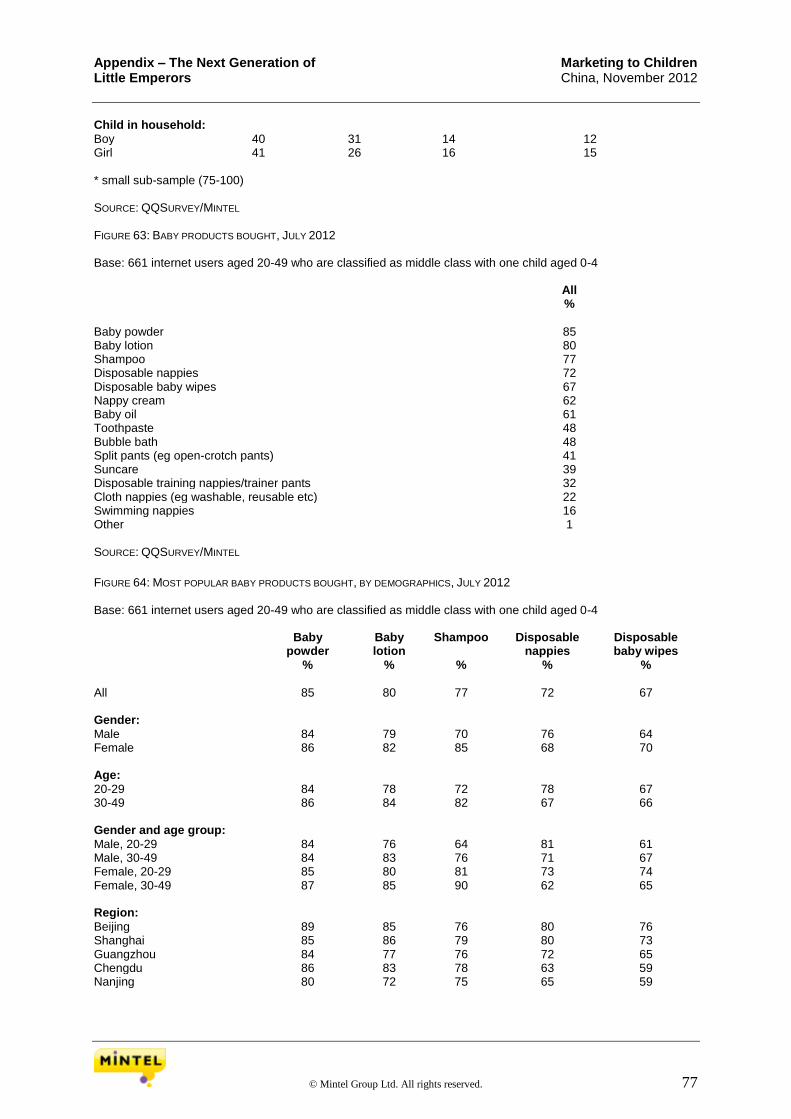
Appendix – The Next Generation of Marketing to Children Little Emperors China, November 2012
© Mintel Group Ltd. All rights reserved. 77
Child in household: Boy 40 31 14 12 Girl 41 26 16 15 * small sub-sample (75-100) SOURCE: QQSURVEY/MINTEL FIGURE 63: BABY PRODUCTS BOUGHT, JULY 2012 Base: 661 internet users aged 20-49 who are classified as middle class with one child aged 0-4 All %
Baby powder 85 Baby lotion 80 Shampoo 77 Disposable nappies 72 Disposable baby wipes 67 Nappy cream 62 Baby oil 61 Toothpaste 48 Bubble bath 48 Split pants (eg open-crotch pants) 41 Suncare 39 Disposable training nappies/trainer pants 32 Cloth nappies (eg washable, reusable etc) 22 Swimming nappies 16 Other 1 SOURCE: QQSURVEY/MINTEL
FIGURE 64: MOST POPULAR BABY PRODUCTS BOUGHT, BY DEMOGRAPHICS, JULY 2012 Base: 661 internet users aged 20-49 who are classified as middle class with one child aged 0-4 Baby
powder Baby lotion
Shampoo Disposable nappies
Disposable baby wipes
% % % % %
All 85 80 77 72 67 Gender: Male 84 79 70 76 64 Female 86 82 85 68 70 Age: 20-29 84 78 72 78 67 30-49 86 84 82 67 66 Gender and age group: Male, 20-29 84 76 64 81 61 Male, 30-49 84 83 76 71 67 Female, 20-29 85 80 81 73 74 Female, 30-49 87 85 90 62 65 Region: Beijing 89 85 76 80 76 Shanghai 85 86 79 80 73 Guangzhou 84 77 76 72 65 Chengdu 86 83 78 63 59 Nanjing 80 72 75 65 59
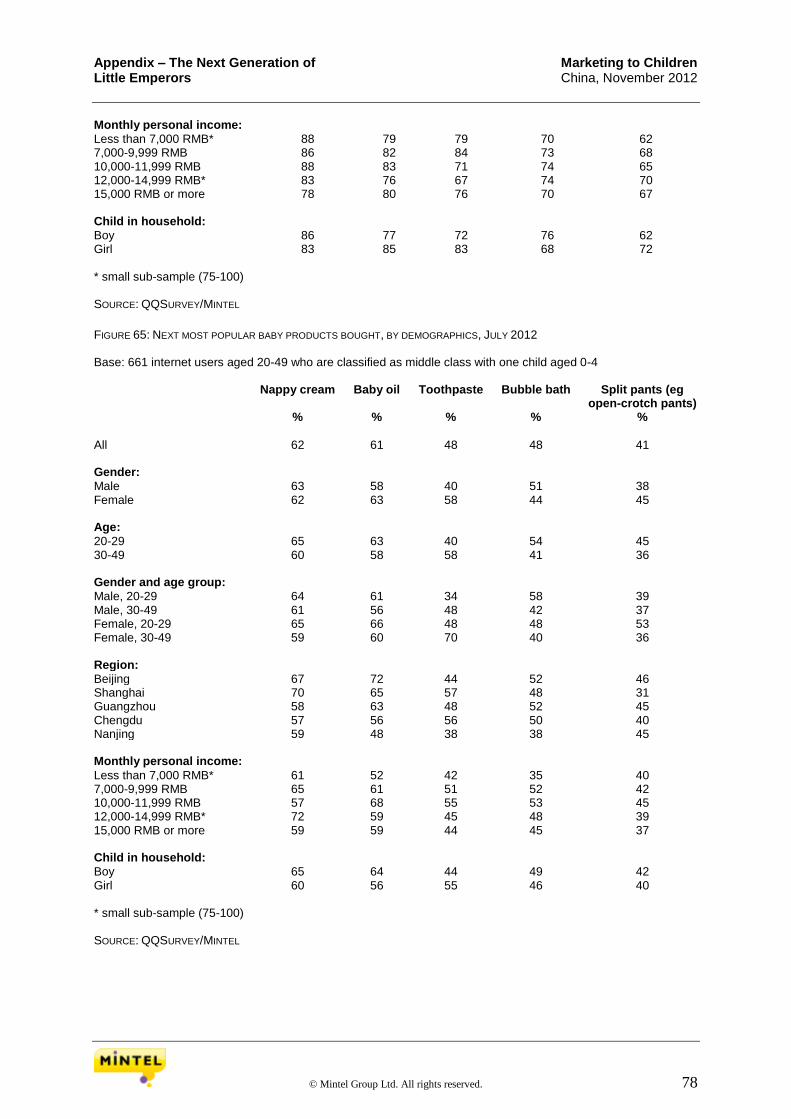
Appendix – The Next Generation of Marketing to Children Little Emperors China, November 2012
© Mintel Group Ltd. All rights reserved. 78
Monthly personal income: Less than 7,000 RMB* 88 79 79 70 62 7,000-9,999 RMB 86 82 84 73 68 10,000-11,999 RMB 88 83 71 74 65 12,000-14,999 RMB* 83 76 67 74 70 15,000 RMB or more 78 80 76 70 67 Child in household: Boy 86 77 72 76 62 Girl 83 85 83 68 72 * small sub-sample (75-100) SOURCE: QQSURVEY/MINTEL
FIGURE 65: NEXT MOST POPULAR BABY PRODUCTS BOUGHT, BY DEMOGRAPHICS, JULY 2012 Base: 661 internet users aged 20-49 who are classified as middle class with one child aged 0-4 Nappy cream Baby oil Toothpaste Bubble bath Split pants (eg
open-crotch pants) % % % % %
All 62 61 48 48 41 Gender: Male 63 58 40 51 38 Female 62 63 58 44 45 Age: 20-29 65 63 40 54 45 30-49 60 58 58 41 36 Gender and age group: Male, 20-29 64 61 34 58 39 Male, 30-49 61 56 48 42 37 Female, 20-29 65 66 48 48 53 Female, 30-49 59 60 70 40 36 Region: Beijing 67 72 44 52 46 Shanghai 70 65 57 48 31 Guangzhou 58 63 48 52 45 Chengdu 57 56 56 50 40 Nanjing 59 48 38 38 45 Monthly personal income: Less than 7,000 RMB* 61 52 42 35 40 7,000-9,999 RMB 65 61 51 52 42 10,000-11,999 RMB 57 68 55 53 45 12,000-14,999 RMB* 72 59 45 48 39 15,000 RMB or more 59 59 44 45 37 Child in household: Boy 65 64 44 49 42 Girl 60 56 55 46 40 * small sub-sample (75-100) SOURCE: QQSURVEY/MINTEL
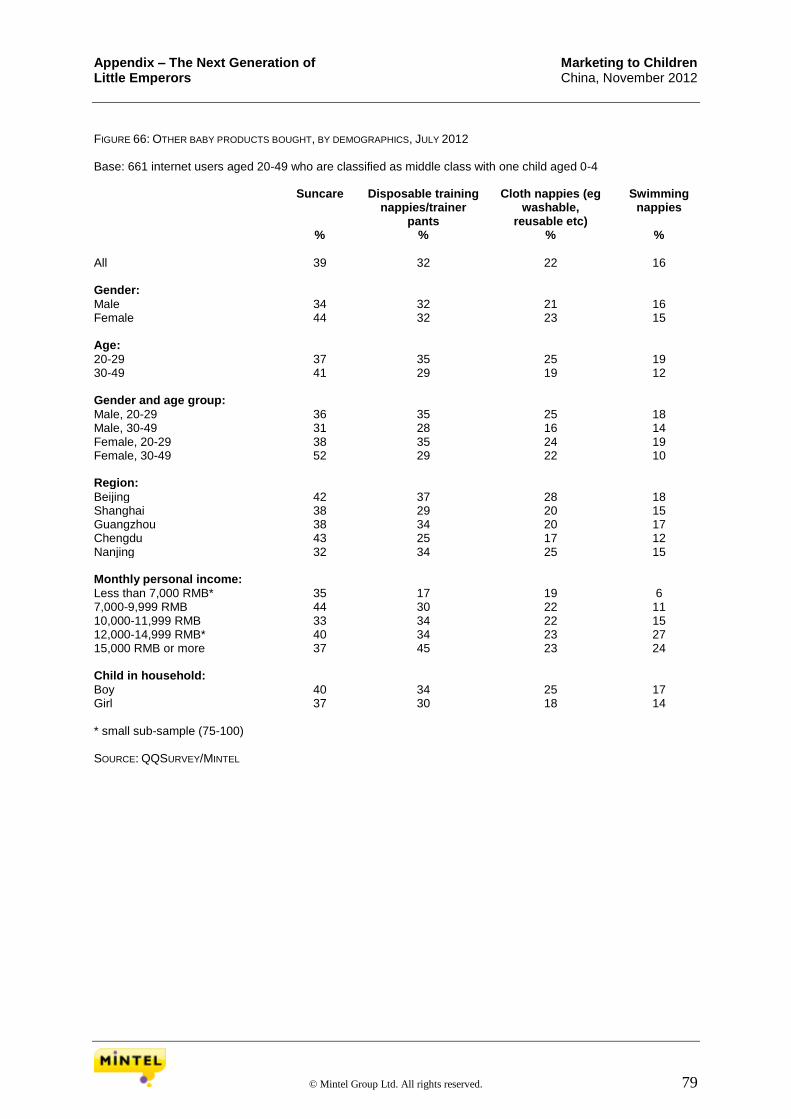
Appendix – The Next Generation of Marketing to Children Little Emperors China, November 2012
© Mintel Group Ltd. All rights reserved. 79
FIGURE 66: OTHER BABY PRODUCTS BOUGHT, BY DEMOGRAPHICS, JULY 2012 Base: 661 internet users aged 20-49 who are classified as middle class with one child aged 0-4 Suncare Disposable training
nappies/trainer pants
Cloth nappies (eg washable,
reusable etc)
Swimming nappies
% % % %
All 39 32 22 16 Gender: Male 34 32 21 16 Female 44 32 23 15 Age: 20-29 37 35 25 19 30-49 41 29 19 12 Gender and age group: Male, 20-29 36 35 25 18 Male, 30-49 31 28 16 14 Female, 20-29 38 35 24 19 Female, 30-49 52 29 22 10 Region: Beijing 42 37 28 18 Shanghai 38 29 20 15 Guangzhou 38 34 20 17 Chengdu 43 25 17 12 Nanjing 32 34 25 15 Monthly personal income: Less than 7,000 RMB* 35 17 19 6 7,000-9,999 RMB 44 30 22 11 10,000-11,999 RMB 33 34 22 15 12,000-14,999 RMB* 40 34 23 27 15,000 RMB or more 37 45 23 24 Child in household: Boy 40 34 25 17 Girl 37 30 18 14 * small sub-sample (75-100) SOURCE: QQSURVEY/MINTEL
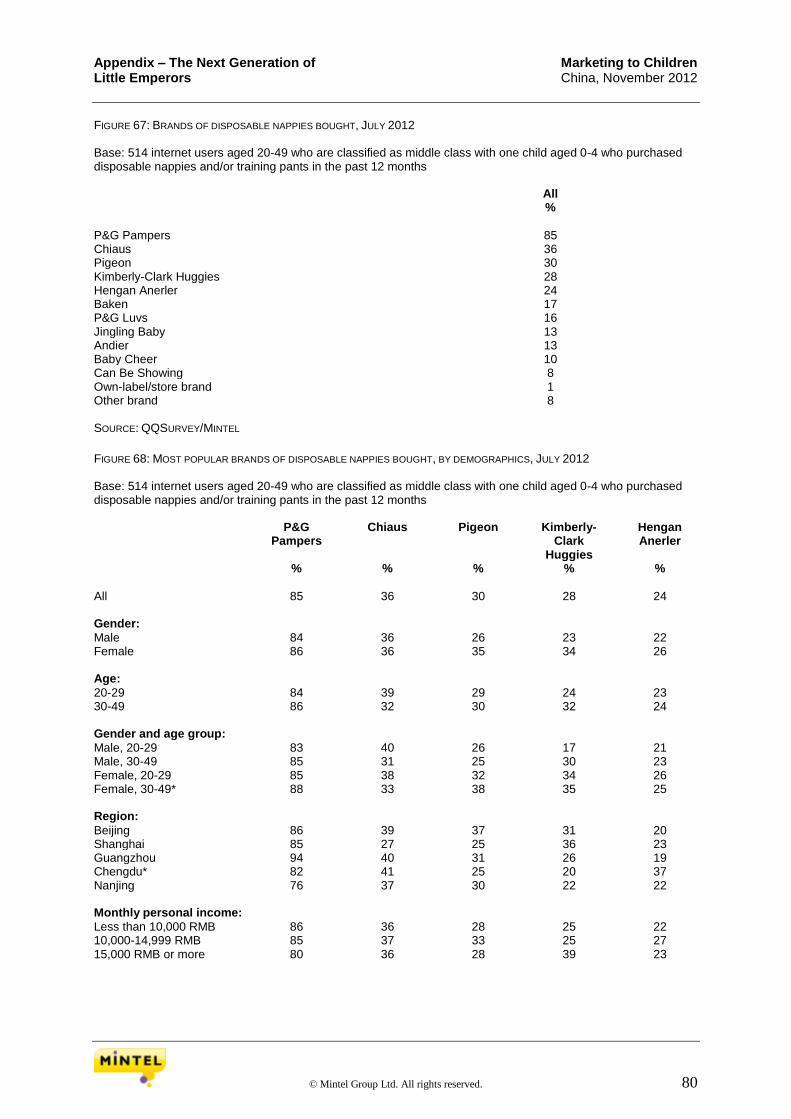
Appendix – The Next Generation of Marketing to Children Little Emperors China, November 2012
© Mintel Group Ltd. All rights reserved. 80
FIGURE 67: BRANDS OF DISPOSABLE NAPPIES BOUGHT, JULY 2012 Base: 514 internet users aged 20-49 who are classified as middle class with one child aged 0-4 who purchased disposable nappies and/or training pants in the past 12 months All %
P&G Pampers 85 Chiaus 36 Pigeon 30 Kimberly-Clark Huggies 28 Hengan Anerler 24 Baken 17 P&G Luvs 16 Jingling Baby 13 Andier 13 Baby Cheer 10 Can Be Showing 8 Own-label/store brand 1 Other brand 8 SOURCE: QQSURVEY/MINTEL
FIGURE 68: MOST POPULAR BRANDS OF DISPOSABLE NAPPIES BOUGHT, BY DEMOGRAPHICS, JULY 2012 Base: 514 internet users aged 20-49 who are classified as middle class with one child aged 0-4 who purchased disposable nappies and/or training pants in the past 12 months P&G
Pampers Chiaus Pigeon Kimberly-
Clark Huggies
Hengan Anerler
% % % % %
All 85 36 30 28 24 Gender: Male 84 36 26 23 22 Female 86 36 35 34 26 Age: 20-29 84 39 29 24 23 30-49 86 32 30 32 24 Gender and age group: Male, 20-29 83 40 26 17 21 Male, 30-49 85 31 25 30 23 Female, 20-29 85 38 32 34 26 Female, 30-49* 88 33 38 35 25 Region: Beijing 86 39 37 31 20 Shanghai 85 27 25 36 23 Guangzhou 94 40 31 26 19 Chengdu* 82 41 25 20 37 Nanjing 76 37 30 22 22 Monthly personal income: Less than 10,000 RMB 86 36 28 25 22 10,000-14,999 RMB 85 37 33 25 27 15,000 RMB or more 80 36 28 39 23
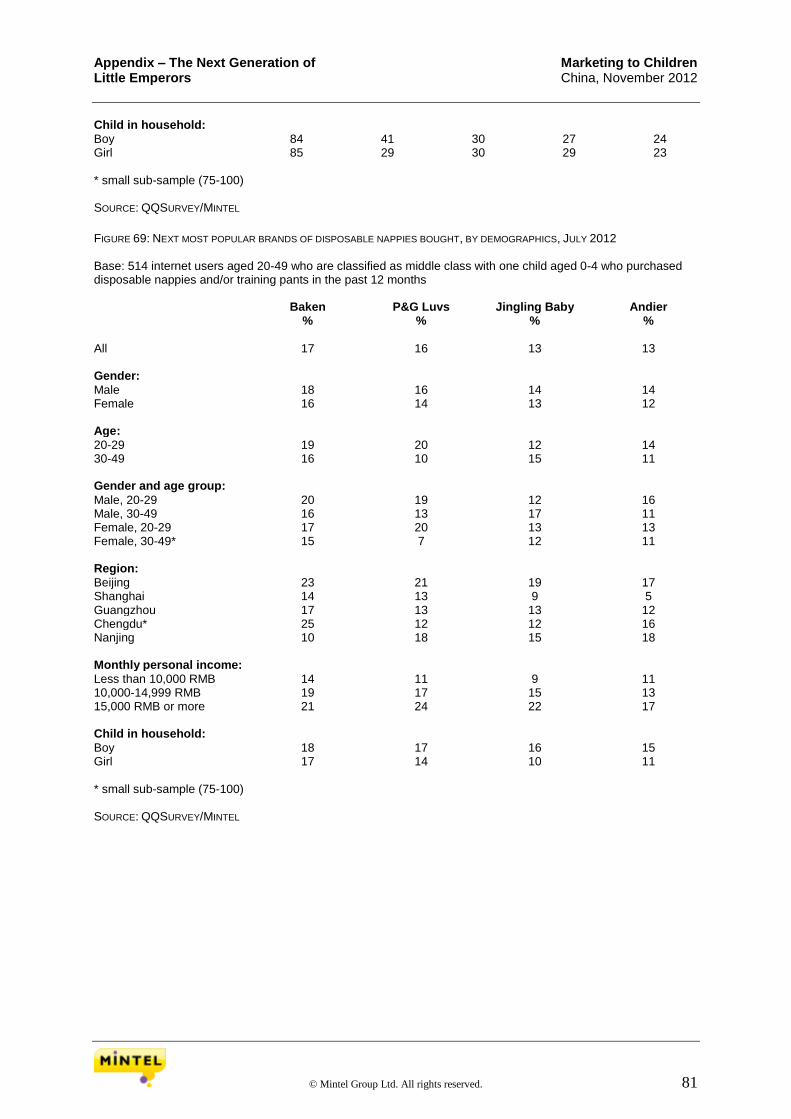
Appendix – The Next Generation of Marketing to Children Little Emperors China, November 2012
© Mintel Group Ltd. All rights reserved. 81
Child in household: Boy 84 41 30 27 24 Girl 85 29 30 29 23 * small sub-sample (75-100) SOURCE: QQSURVEY/MINTEL
FIGURE 69: NEXT MOST POPULAR BRANDS OF DISPOSABLE NAPPIES BOUGHT, BY DEMOGRAPHICS, JULY 2012 Base: 514 internet users aged 20-49 who are classified as middle class with one child aged 0-4 who purchased disposable nappies and/or training pants in the past 12 months Baken P&G Luvs Jingling Baby Andier % % % %
All 17 16 13 13 Gender: Male 18 16 14 14 Female 16 14 13 12 Age: 20-29 19 20 12 14 30-49 16 10 15 11 Gender and age group: Male, 20-29 20 19 12 16 Male, 30-49 16 13 17 11 Female, 20-29 17 20 13 13 Female, 30-49* 15 7 12 11 Region: Beijing 23 21 19 17 Shanghai 14 13 9 5 Guangzhou 17 13 13 12 Chengdu* 25 12 12 16 Nanjing 10 18 15 18 Monthly personal income: Less than 10,000 RMB 14 11 9 11 10,000-14,999 RMB 19 17 15 13 15,000 RMB or more 21 24 22 17 Child in household: Boy 18 17 16 15 Girl 17 14 10 11 * small sub-sample (75-100) SOURCE: QQSURVEY/MINTEL
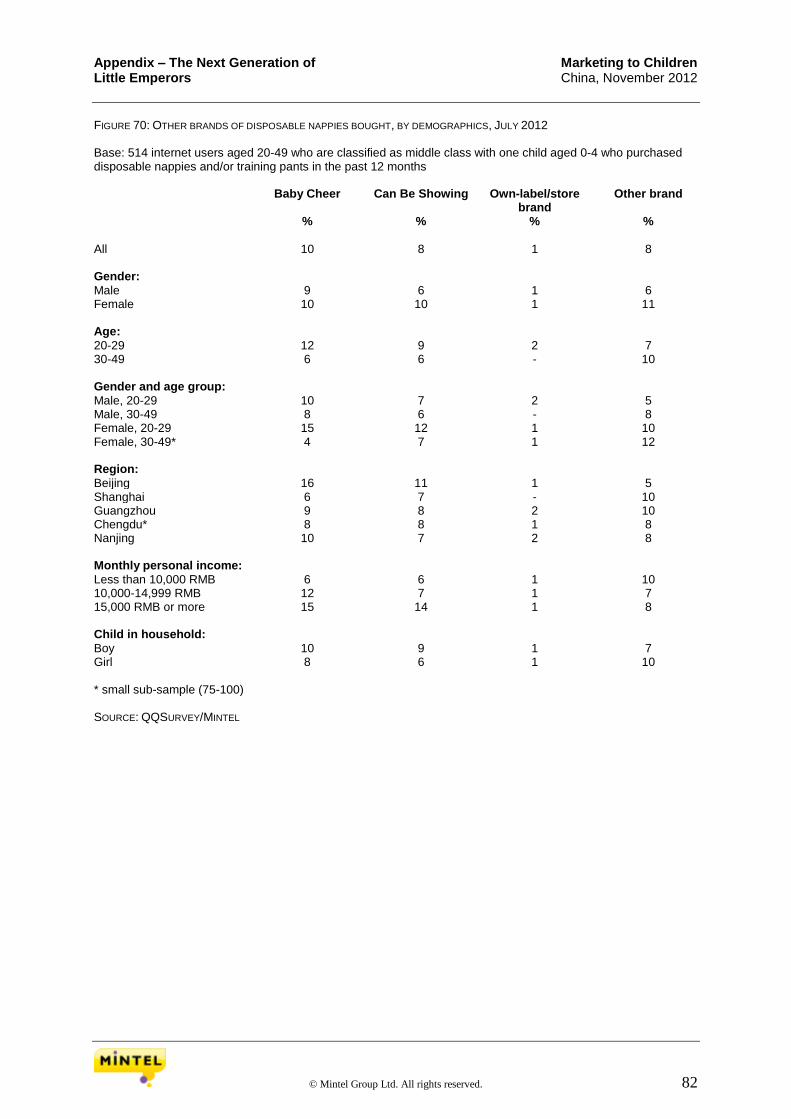
Appendix – The Next Generation of Marketing to Children Little Emperors China, November 2012
© Mintel Group Ltd. All rights reserved. 82
FIGURE 70: OTHER BRANDS OF DISPOSABLE NAPPIES BOUGHT, BY DEMOGRAPHICS, JULY 2012 Base: 514 internet users aged 20-49 who are classified as middle class with one child aged 0-4 who purchased disposable nappies and/or training pants in the past 12 months Baby Cheer Can Be Showing Own-label/store
brand Other brand
% % % %
All 10 8 1 8 Gender: Male 9 6 1 6 Female 10 10 1 11 Age: 20-29 12 9 2 7 30-49 6 6 - 10 Gender and age group: Male, 20-29 10 7 2 5 Male, 30-49 8 6 - 8 Female, 20-29 15 12 1 10 Female, 30-49* 4 7 1 12 Region: Beijing 16 11 1 5 Shanghai 6 7 - 10 Guangzhou 9 8 2 10 Chengdu* 8 8 1 8 Nanjing 10 7 2 8 Monthly personal income: Less than 10,000 RMB 6 6 1 10 10,000-14,999 RMB 12 7 1 7 15,000 RMB or more 15 14 1 8 Child in household: Boy 10 9 1 7 Girl 8 6 1 10 * small sub-sample (75-100) SOURCE: QQSURVEY/MINTEL
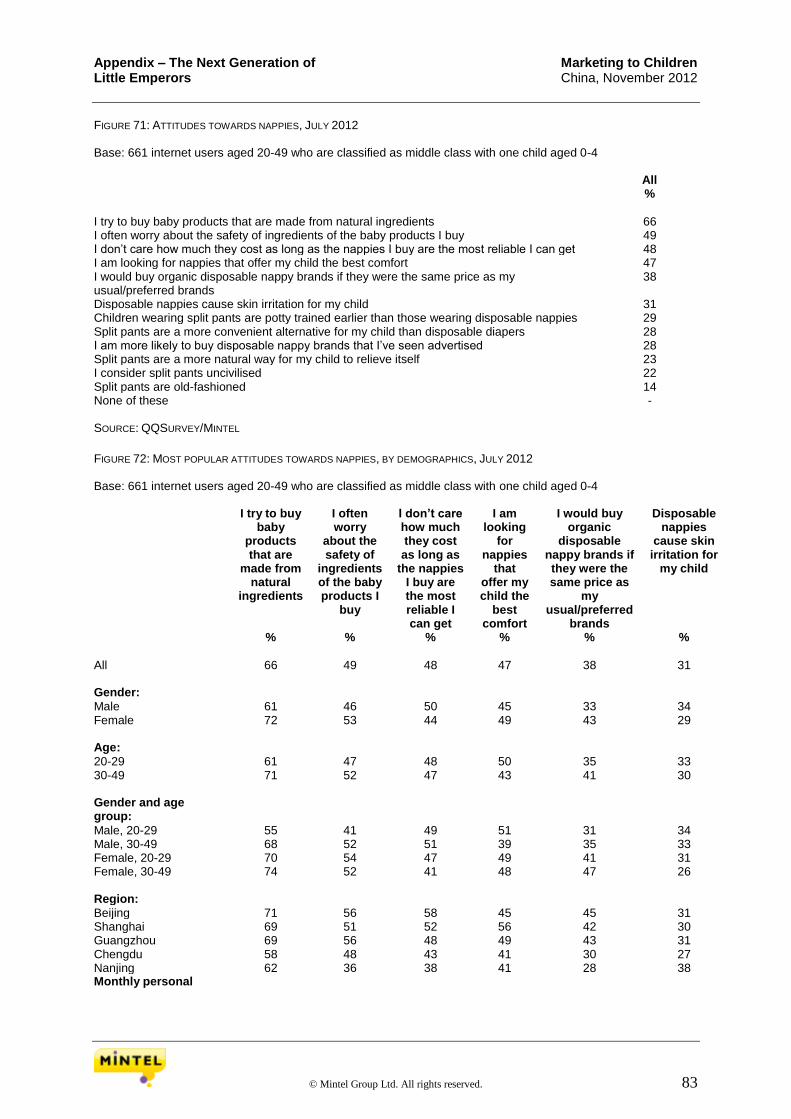
Appendix – The Next Generation of Marketing to Children Little Emperors China, November 2012
© Mintel Group Ltd. All rights reserved. 83
FIGURE 71: ATTITUDES TOWARDS NAPPIES, JULY 2012 Base: 661 internet users aged 20-49 who are classified as middle class with one child aged 0-4 All %
I try to buy baby products that are made from natural ingredients 66 I often worry about the safety of ingredients of the baby products I buy 49 I don’t care how much they cost as long as the nappies I buy are the most reliable I can get 48 I am looking for nappies that offer my child the best comfort 47 I would buy organic disposable nappy brands if they were the same price as my usual/preferred brands
38
Disposable nappies cause skin irritation for my child 31 Children wearing split pants are potty trained earlier than those wearing disposable nappies 29 Split pants are a more convenient alternative for my child than disposable diapers 28 I am more likely to buy disposable nappy brands that I’ve seen advertised 28 Split pants are a more natural way for my child to relieve itself 23 I consider split pants uncivilised 22 Split pants are old-fashioned 14 None of these - SOURCE: QQSURVEY/MINTEL
FIGURE 72: MOST POPULAR ATTITUDES TOWARDS NAPPIES, BY DEMOGRAPHICS, JULY 2012 Base: 661 internet users aged 20-49 who are classified as middle class with one child aged 0-4 I try to buy
baby products that are
made from natural
ingredients
I often worry
about the safety of
ingredients of the baby products I
buy
I don’t care how much they cost as long as
the nappies I buy are the most reliable I can get
I am looking
for nappies
that offer my child the
best comfort
I would buy organic
disposable nappy brands if they were the same price as
my usual/preferred
brands
Disposable nappies
cause skin irritation for
my child
% % % % % %
All 66 49 48 47 38 31 Gender: Male 61 46 50 45 33 34 Female 72 53 44 49 43 29 Age: 20-29 61 47 48 50 35 33 30-49 71 52 47 43 41 30 Gender and age group:
Male, 20-29 55 41 49 51 31 34 Male, 30-49 68 52 51 39 35 33 Female, 20-29 70 54 47 49 41 31 Female, 30-49 74 52 41 48 47 26 Region: Beijing 71 56 58 45 45 31 Shanghai 69 51 52 56 42 30 Guangzhou 69 56 48 49 43 31 Chengdu 58 48 43 41 30 27 Nanjing 62 36 38 41 28 38 Monthly personal

Appendix – The Next Generation of Marketing to Children Little Emperors China, November 2012
© Mintel Group Ltd. All rights reserved. 84
income:
Less than 7,000 RMB* 57 42 26 38 21 37 7,000-9,999 RMB 67 55 44 47 43 35 10,000-11,999 RMB 69 54 47 55 41 30 12,000-14,999 RMB* 68 46 50 49 35 33 15,000 RMB or more 67 41 71 43 40 21 Child in household: Boy 65 45 51 48 36 30 Girl 67 55 43 45 41 34 * small sub-sample (75-100) SOURCE: QQSURVEY/MINTEL
FIGURE 73: NEXT MOST POPULAR ATTITUDES TOWARDS NAPPIES, BY DEMOGRAPHICS, JULY 2012 Base: 661 internet users aged 20-49 who are classified as middle class with one child aged 0-4 Children
wearing split pants are potty trained earlier
than those wearing
disposable nappies
Split pants are a more convenient alternative
for my child than disposable
diapers
I am more likely to
buy disposable
nappy brands that I’ve
seen advertised
Split pants are a more
natural way for
my child to relieve
itself
I consider split pants uncivilised
Split pants are old-
fashioned**
% % % % % %
All 29 28 28 23 22 14 Gender: Male 26 29 27 22 21 12 Female 31 27 28 24 23 16 Age: 20-29 28 28 24 20 20 12 30-49 29 28 31 25 24 15 Gender and age group: Male, 20-29 26 32 25 21 19 11 Male, 30-49 27 26 30 23 23 13 Female, 20-29 31 23 23 20 21 13 Female, 30-49 32 30 33 28 25 18 Region: Beijing 21 33 35 22 23 12 Shanghai 30 20 28 17 26 18 Guangzhou 29 29 27 21 22 10 Chengdu 30 35 29 29 17 14 Nanjing 33 27 20 27 19 14 Monthly personal income:
Less than 7,000 RMB* 27 27 18 32 21 13 7,000-9,999 RMB 29 31 28 22 18 14 10,000-11,999 RMB 28 29 34 21 22 12 12,000-14,999 RMB* 38 33 30 23 21 9 15,000 RMB or more 23 20 24 17 28 20
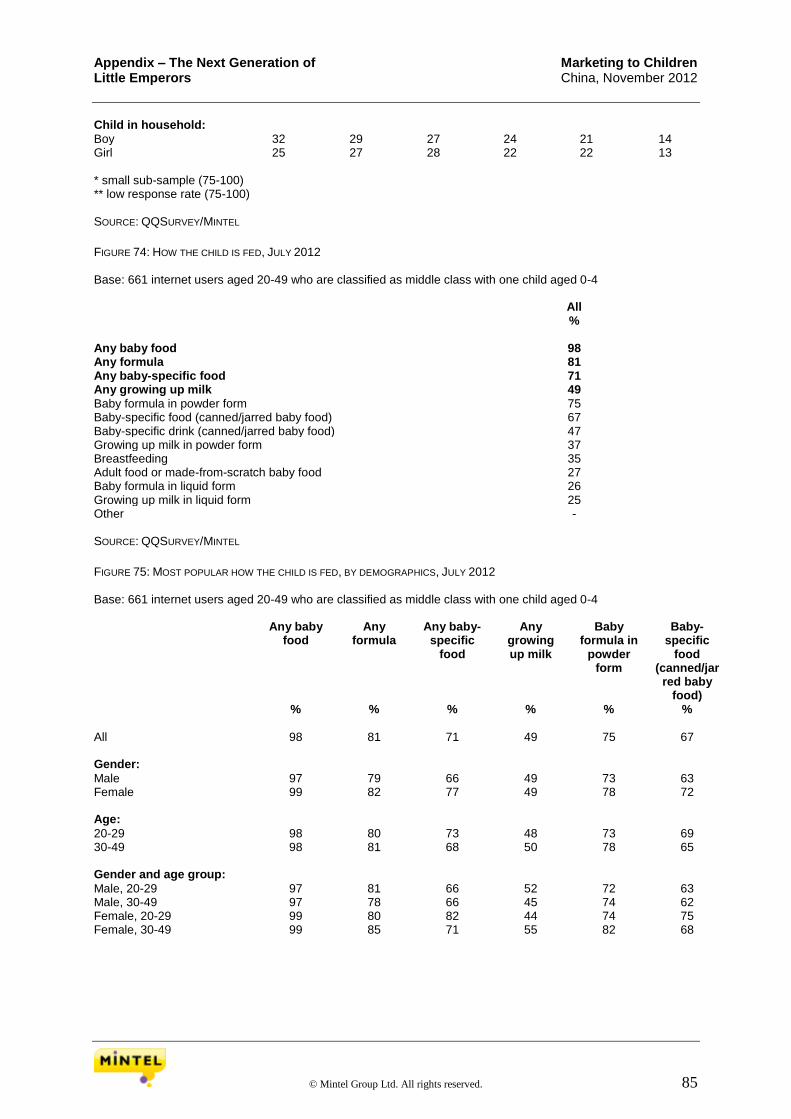
Appendix – The Next Generation of Marketing to Children Little Emperors China, November 2012
© Mintel Group Ltd. All rights reserved. 85
Child in household: Boy 32 29 27 24 21 14 Girl 25 27 28 22 22 13 * small sub-sample (75-100) ** low response rate (75-100) SOURCE: QQSURVEY/MINTEL
FIGURE 74: HOW THE CHILD IS FED, JULY 2012 Base: 661 internet users aged 20-49 who are classified as middle class with one child aged 0-4 All %
Any baby food 98 Any formula 81 Any baby-specific food 71 Any growing up milk 49
Baby formula in powder form 75 Baby-specific food (canned/jarred baby food) 67 Baby-specific drink (canned/jarred baby food) 47 Growing up milk in powder form 37 Breastfeeding 35 Adult food or made-from-scratch baby food 27 Baby formula in liquid form 26 Growing up milk in liquid form 25 Other - SOURCE: QQSURVEY/MINTEL
FIGURE 75: MOST POPULAR HOW THE CHILD IS FED, BY DEMOGRAPHICS, JULY 2012 Base: 661 internet users aged 20-49 who are classified as middle class with one child aged 0-4 Any baby
food Any
formula Any baby-
specific food
Any growing up milk
Baby formula in
powder form
Baby-specific
food (canned/jar
red baby food)
% % % % % %
All 98 81 71 49 75 67 Gender: Male 97 79 66 49 73 63 Female 99 82 77 49 78 72 Age: 20-29 98 80 73 48 73 69 30-49 98 81 68 50 78 65 Gender and age group: Male, 20-29 97 81 66 52 72 63 Male, 30-49 97 78 66 45 74 62 Female, 20-29 99 80 82 44 74 75 Female, 30-49 99 85 71 55 82 68
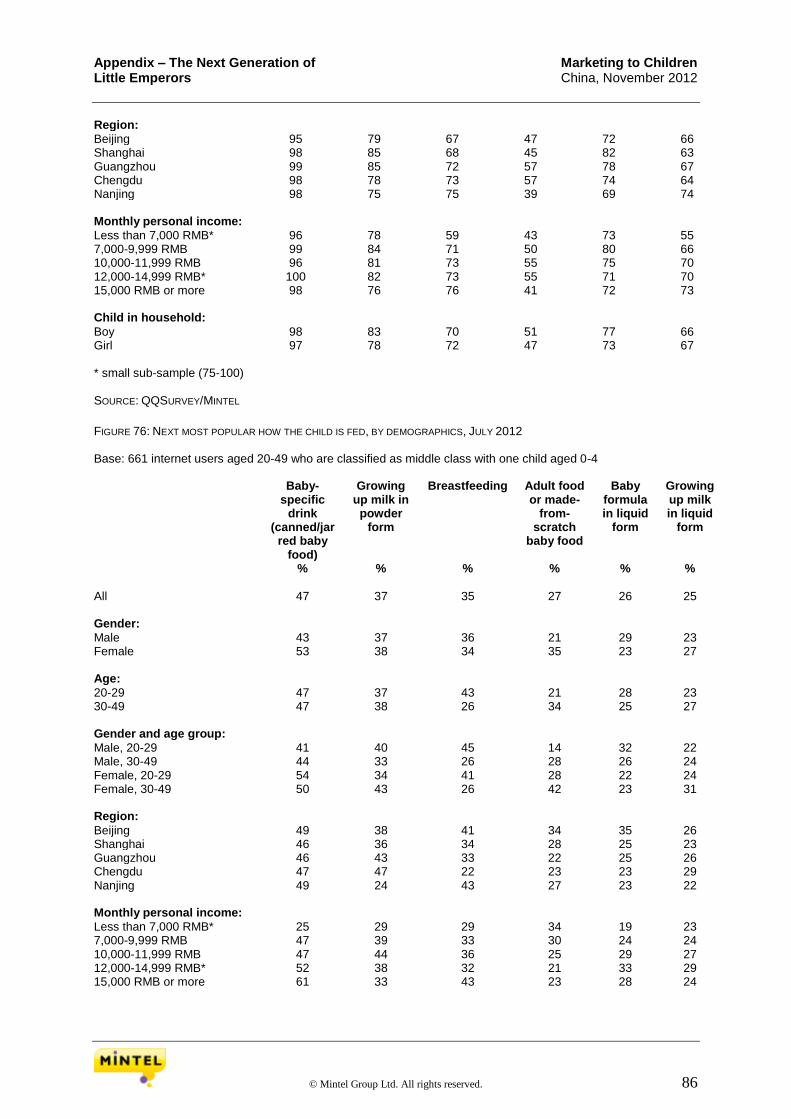
Appendix – The Next Generation of Marketing to Children Little Emperors China, November 2012
© Mintel Group Ltd. All rights reserved. 86
Region: Beijing 95 79 67 47 72 66 Shanghai 98 85 68 45 82 63 Guangzhou 99 85 72 57 78 67 Chengdu 98 78 73 57 74 64 Nanjing 98 75 75 39 69 74 Monthly personal income: Less than 7,000 RMB* 96 78 59 43 73 55 7,000-9,999 RMB 99 84 71 50 80 66 10,000-11,999 RMB 96 81 73 55 75 70 12,000-14,999 RMB* 100 82 73 55 71 70 15,000 RMB or more 98 76 76 41 72 73 Child in household: Boy 98 83 70 51 77 66 Girl 97 78 72 47 73 67 * small sub-sample (75-100) SOURCE: QQSURVEY/MINTEL
FIGURE 76: NEXT MOST POPULAR HOW THE CHILD IS FED, BY DEMOGRAPHICS, JULY 2012 Base: 661 internet users aged 20-49 who are classified as middle class with one child aged 0-4 Baby-
specific drink
(canned/jarred baby
food)
Growing up milk in
powder form
Breastfeeding Adult food or made-
from-scratch
baby food
Baby formula in liquid
form
Growing up milk in liquid
form
% % % % % %
All 47 37 35 27 26 25 Gender: Male 43 37 36 21 29 23 Female 53 38 34 35 23 27 Age: 20-29 47 37 43 21 28 23 30-49 47 38 26 34 25 27 Gender and age group: Male, 20-29 41 40 45 14 32 22 Male, 30-49 44 33 26 28 26 24 Female, 20-29 54 34 41 28 22 24 Female, 30-49 50 43 26 42 23 31 Region: Beijing 49 38 41 34 35 26 Shanghai 46 36 34 28 25 23 Guangzhou 46 43 33 22 25 26 Chengdu 47 47 22 23 23 29 Nanjing 49 24 43 27 23 22 Monthly personal income: Less than 7,000 RMB* 25 29 29 34 19 23 7,000-9,999 RMB 47 39 33 30 24 24 10,000-11,999 RMB 47 44 36 25 29 27 12,000-14,999 RMB* 52 38 32 21 33 29 15,000 RMB or more 61 33 43 23 28 24
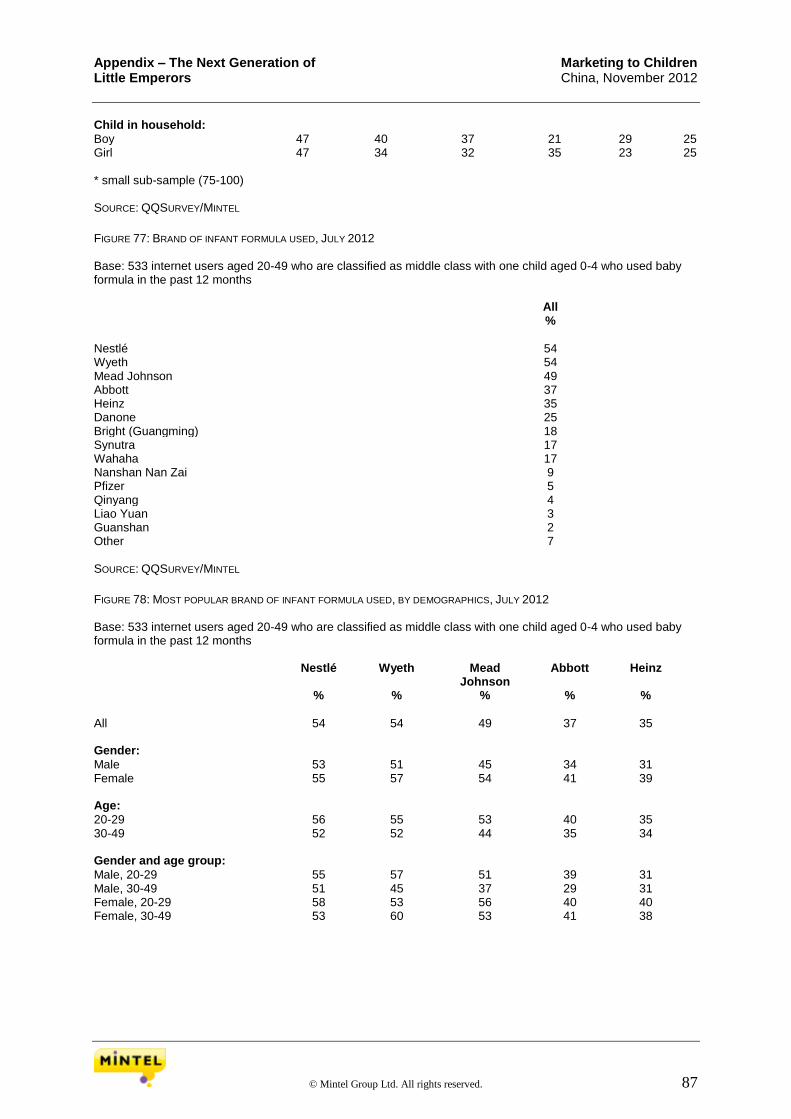
Appendix – The Next Generation of Marketing to Children Little Emperors China, November 2012
© Mintel Group Ltd. All rights reserved. 87
Child in household: Boy 47 40 37 21 29 25 Girl 47 34 32 35 23 25 * small sub-sample (75-100) SOURCE: QQSURVEY/MINTEL
FIGURE 77: BRAND OF INFANT FORMULA USED, JULY 2012 Base: 533 internet users aged 20-49 who are classified as middle class with one child aged 0-4 who used baby formula in the past 12 months All %
Nestlé 54 Wyeth 54 Mead Johnson 49 Abbott 37 Heinz 35 Danone 25 Bright (Guangming) 18 Synutra 17 Wahaha 17 Nanshan Nan Zai 9 Pfizer 5 Qinyang 4 Liao Yuan 3 Guanshan 2 Other 7 SOURCE: QQSURVEY/MINTEL
FIGURE 78: MOST POPULAR BRAND OF INFANT FORMULA USED, BY DEMOGRAPHICS, JULY 2012 Base: 533 internet users aged 20-49 who are classified as middle class with one child aged 0-4 who used baby formula in the past 12 months Nestlé Wyeth Mead
Johnson Abbott Heinz
% % % % %
All 54 54 49 37 35 Gender: Male 53 51 45 34 31 Female 55 57 54 41 39 Age: 20-29 56 55 53 40 35 30-49 52 52 44 35 34 Gender and age group: Male, 20-29 55 57 51 39 31 Male, 30-49 51 45 37 29 31 Female, 20-29 58 53 56 40 40 Female, 30-49 53 60 53 41 38
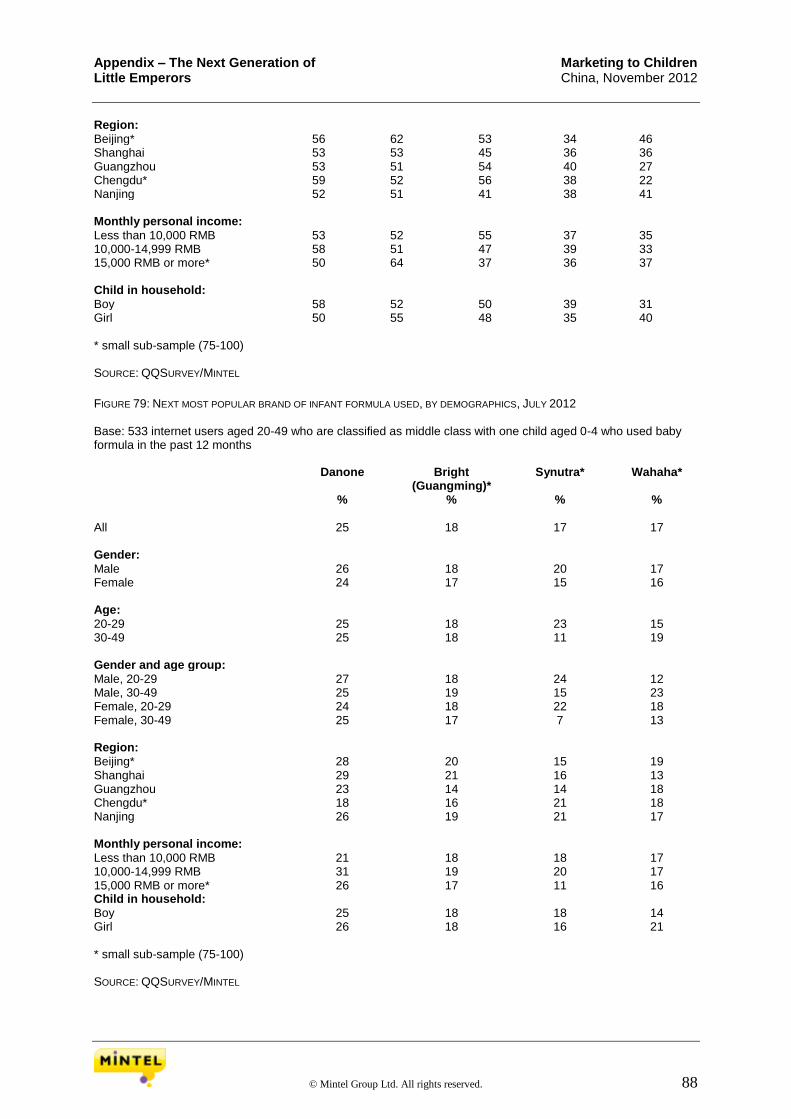
Appendix – The Next Generation of Marketing to Children Little Emperors China, November 2012
© Mintel Group Ltd. All rights reserved. 88
Region: Beijing* 56 62 53 34 46 Shanghai 53 53 45 36 36 Guangzhou 53 51 54 40 27 Chengdu* 59 52 56 38 22 Nanjing 52 51 41 38 41 Monthly personal income: Less than 10,000 RMB 53 52 55 37 35 10,000-14,999 RMB 58 51 47 39 33 15,000 RMB or more* 50 64 37 36 37 Child in household: Boy 58 52 50 39 31 Girl 50 55 48 35 40 * small sub-sample (75-100) SOURCE: QQSURVEY/MINTEL
FIGURE 79: NEXT MOST POPULAR BRAND OF INFANT FORMULA USED, BY DEMOGRAPHICS, JULY 2012 Base: 533 internet users aged 20-49 who are classified as middle class with one child aged 0-4 who used baby formula in the past 12 months Danone Bright
(Guangming)* Synutra* Wahaha*
% % % %
All 25 18 17 17 Gender: Male 26 18 20 17 Female 24 17 15 16 Age: 20-29 25 18 23 15 30-49 25 18 11 19 Gender and age group: Male, 20-29 27 18 24 12 Male, 30-49 25 19 15 23 Female, 20-29 24 18 22 18 Female, 30-49 25 17 7 13 Region: Beijing* 28 20 15 19 Shanghai 29 21 16 13 Guangzhou 23 14 14 18 Chengdu* 18 16 21 18 Nanjing 26 19 21 17 Monthly personal income: Less than 10,000 RMB 21 18 18 17 10,000-14,999 RMB 31 19 20 17 15,000 RMB or more* 26 17 11 16 Child in household: Boy 25 18 18 14 Girl 26 18 16 21 * small sub-sample (75-100) SOURCE: QQSURVEY/MINTEL
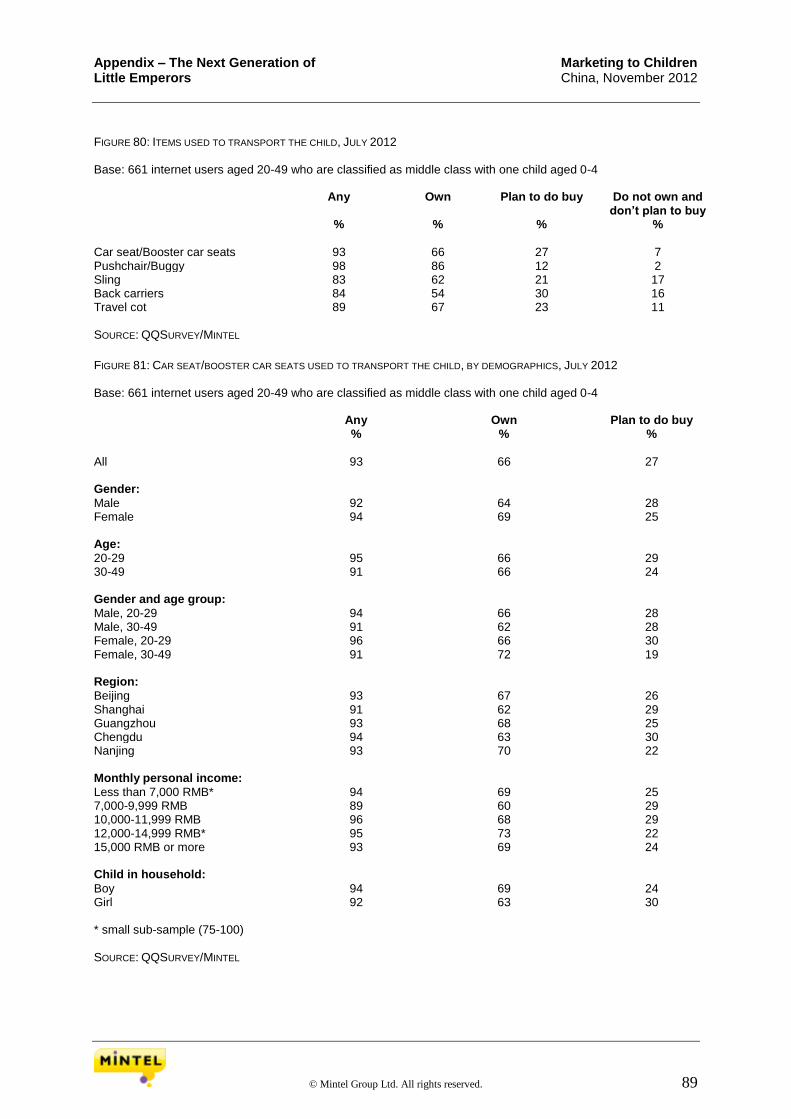
Appendix – The Next Generation of Marketing to Children Little Emperors China, November 2012
© Mintel Group Ltd. All rights reserved. 89
FIGURE 80: ITEMS USED TO TRANSPORT THE CHILD, JULY 2012 Base: 661 internet users aged 20-49 who are classified as middle class with one child aged 0-4 Any Own Plan to do buy Do not own and
don’t plan to buy % % % %
Car seat/Booster car seats 93 66 27 7 Pushchair/Buggy 98 86 12 2 Sling 83 62 21 17 Back carriers 84 54 30 16 Travel cot 89 67 23 11 SOURCE: QQSURVEY/MINTEL
FIGURE 81: CAR SEAT/BOOSTER CAR SEATS USED TO TRANSPORT THE CHILD, BY DEMOGRAPHICS, JULY 2012 Base: 661 internet users aged 20-49 who are classified as middle class with one child aged 0-4 Any Own Plan to do buy % % %
All 93 66 27 Gender: Male 92 64 28 Female 94 69 25 Age: 20-29 95 66 29 30-49 91 66 24 Gender and age group: Male, 20-29 94 66 28 Male, 30-49 91 62 28 Female, 20-29 96 66 30 Female, 30-49 91 72 19 Region: Beijing 93 67 26 Shanghai 91 62 29 Guangzhou 93 68 25 Chengdu 94 63 30 Nanjing 93 70 22 Monthly personal income: Less than 7,000 RMB* 94 69 25 7,000-9,999 RMB 89 60 29 10,000-11,999 RMB 96 68 29 12,000-14,999 RMB* 95 73 22 15,000 RMB or more 93 69 24 Child in household: Boy 94 69 24 Girl 92 63 30 * small sub-sample (75-100) SOURCE: QQSURVEY/MINTEL
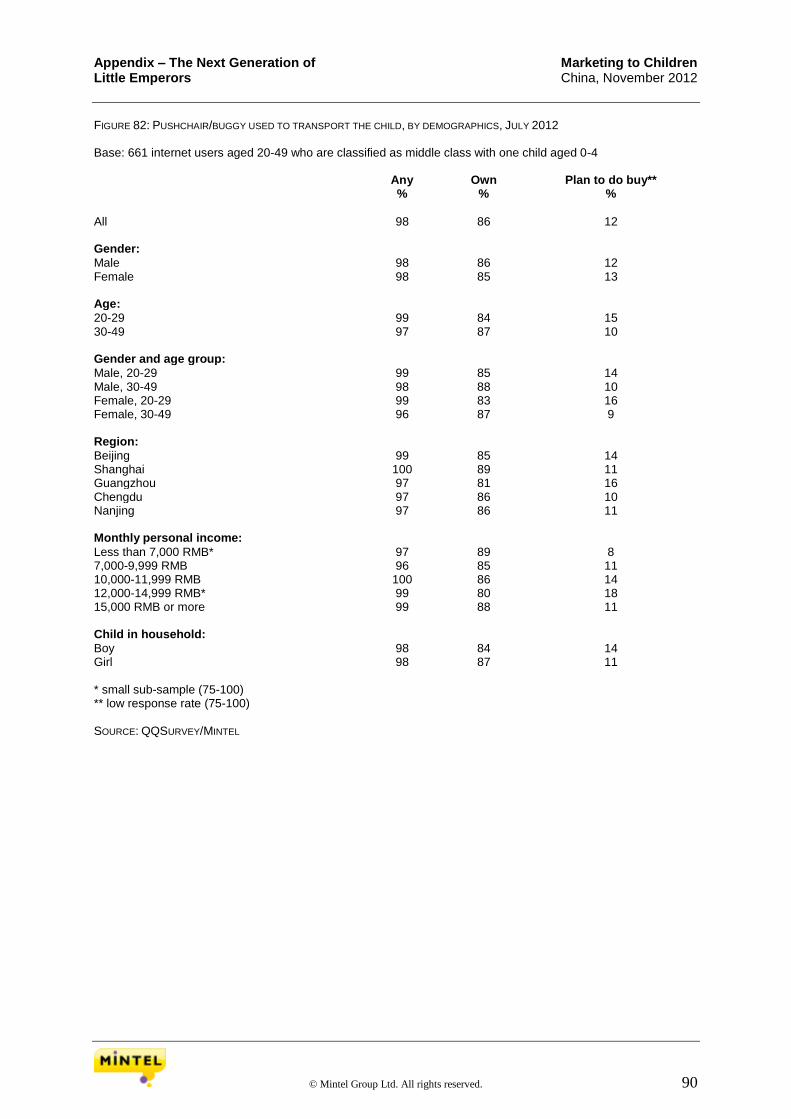
Appendix – The Next Generation of Marketing to Children Little Emperors China, November 2012
© Mintel Group Ltd. All rights reserved. 90
FIGURE 82: PUSHCHAIR/BUGGY USED TO TRANSPORT THE CHILD, BY DEMOGRAPHICS, JULY 2012 Base: 661 internet users aged 20-49 who are classified as middle class with one child aged 0-4 Any Own Plan to do buy** % % %
All 98 86 12 Gender: Male 98 86 12 Female 98 85 13 Age: 20-29 99 84 15 30-49 97 87 10 Gender and age group: Male, 20-29 99 85 14 Male, 30-49 98 88 10 Female, 20-29 99 83 16 Female, 30-49 96 87 9 Region: Beijing 99 85 14 Shanghai 100 89 11 Guangzhou 97 81 16 Chengdu 97 86 10 Nanjing 97 86 11 Monthly personal income: Less than 7,000 RMB* 97 89 8 7,000-9,999 RMB 96 85 11 10,000-11,999 RMB 100 86 14 12,000-14,999 RMB* 99 80 18 15,000 RMB or more 99 88 11 Child in household: Boy 98 84 14 Girl 98 87 11 * small sub-sample (75-100) ** low response rate (75-100) SOURCE: QQSURVEY/MINTEL

Appendix – The Next Generation of Marketing to Children Little Emperors China, November 2012
© Mintel Group Ltd. All rights reserved. 91
FIGURE 83: SLING USED TO TRANSPORT THE CHILD, BY DEMOGRAPHICS, JULY 2012 Base: 661 internet users aged 20-49 who are classified as middle class with one child aged 0-4 Any Own Plan to do buy Do not own and
don’t plan to buy % % % %
All 83 62 21 17 Gender: Male 83 63 20 17 Female 84 62 22 16 Age: 20-29 85 63 23 15 30-49 81 62 19 19 Gender and age group: Male, 20-29 82 59 23 18 Male, 30-49 84 67 17 16 Female, 20-29 90 67 23 10 Female, 30-49 77 57 21 23 Region: Beijing 83 65 18 17 Shanghai 79 58 21 21 Guangzhou 86 61 25 14 Chengdu 83 70 14 17 Nanjing 85 60 25 15 Monthly personal income: Less than 7,000 RMB* 80 61 19 20 7,000-9,999 RMB 82 60 22 18 10,000-11,999 RMB 89 67 22 11 12,000-14,999 RMB* 85 67 18 15 15,000 RMB or more 80 60 20 20 Child in household: Boy 84 60 24 16 Girl 82 65 16 18 * small sub-sample (75-100) SOURCE: QQSURVEY/MINTEL
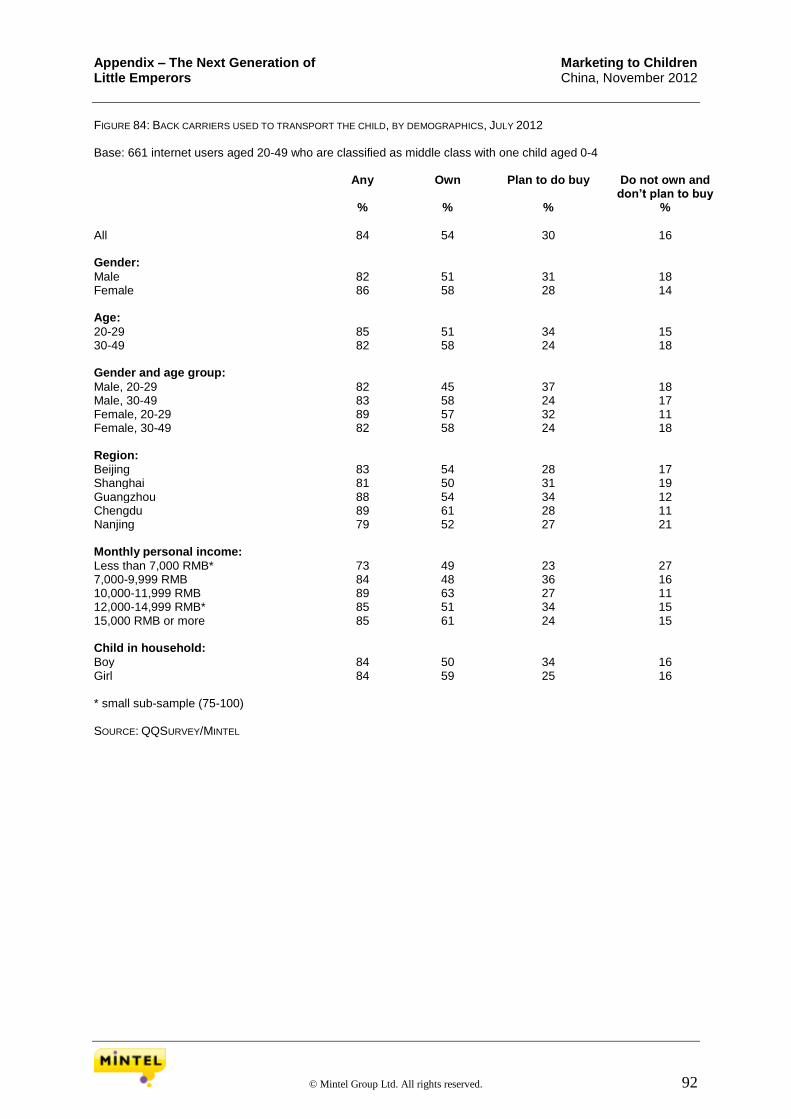
Appendix – The Next Generation of Marketing to Children Little Emperors China, November 2012
© Mintel Group Ltd. All rights reserved. 92
FIGURE 84: BACK CARRIERS USED TO TRANSPORT THE CHILD, BY DEMOGRAPHICS, JULY 2012 Base: 661 internet users aged 20-49 who are classified as middle class with one child aged 0-4 Any Own Plan to do buy Do not own and
don’t plan to buy % % % %
All 84 54 30 16 Gender: Male 82 51 31 18 Female 86 58 28 14 Age: 20-29 85 51 34 15 30-49 82 58 24 18 Gender and age group: Male, 20-29 82 45 37 18 Male, 30-49 83 58 24 17 Female, 20-29 89 57 32 11 Female, 30-49 82 58 24 18 Region: Beijing 83 54 28 17 Shanghai 81 50 31 19 Guangzhou 88 54 34 12 Chengdu 89 61 28 11 Nanjing 79 52 27 21 Monthly personal income: Less than 7,000 RMB* 73 49 23 27 7,000-9,999 RMB 84 48 36 16 10,000-11,999 RMB 89 63 27 11 12,000-14,999 RMB* 85 51 34 15 15,000 RMB or more 85 61 24 15 Child in household: Boy 84 50 34 16 Girl 84 59 25 16 * small sub-sample (75-100) SOURCE: QQSURVEY/MINTEL

Appendix – The Next Generation of Marketing to Children Little Emperors China, November 2012
© Mintel Group Ltd. All rights reserved. 93
FIGURE 85: TRAVEL COT USED TO TRANSPORT THE CHILD, BY DEMOGRAPHICS, JULY 2012 Base: 661 internet users aged 20-49 who are classified as middle class with one child aged 0-4 Any Own Plan to do buy % % %
All 89 67 23 Gender: Male 90 64 25 Female 89 69 19 Age: 20-29 93 68 25 30-49 85 65 20 Gender and age group: Male, 20-29 92 64 28 Male, 30-49 88 65 23 Female, 20-29 94 72 22 Female, 30-49 82 66 16 Region: Beijing 89 66 24 Shanghai 91 72 19 Guangzhou 90 57 32 Chengdu 85 63 23 Nanjing 91 73 17 Monthly personal income: Less than 7,000 RMB* 81 62 19 7,000-9,999 RMB 88 65 22 10,000-11,999 RMB 94 66 27 12,000-14,999 RMB* 90 63 27 15,000 RMB or more 93 76 18 Child in household: Boy 91 66 24 Girl 87 67 20 * small sub-sample (75-100) SOURCE: QQSURVEY/MINTEL
FIGURE 86: ATTITUDES TOWARDS TRANSPORT OF THE CHILD, JULY 2012 Base: 661 internet users aged 20-49 who are classified as middle class with one child aged 5-16 All %
I let my child walk as often as possible to allow him/her some physical exercise 50 I find it exhausting to carry my child in my arms 40 My child is mostly carried around as walking would exhaust him/her too much 13 I prefer to carry my child wherever I go since it is more convenient than using a pushchair 11 Pushchairs are impractical when getting around in large cities 11 Baby slings/back carriers are a waste of money when you can simply carry your child in your arms 4 Pushchairs are too expensive 3 None of these 16 SOURCE: QQSURVEY/MINTEL
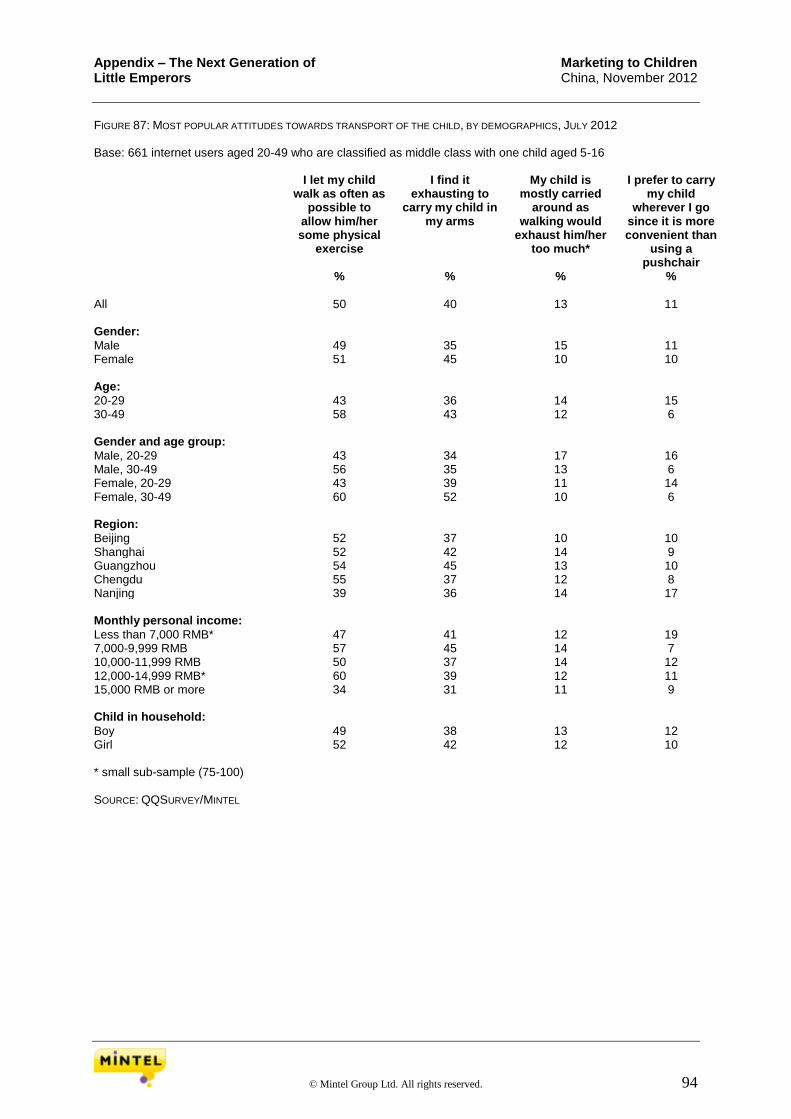
Appendix – The Next Generation of Marketing to Children Little Emperors China, November 2012
© Mintel Group Ltd. All rights reserved. 94
FIGURE 87: MOST POPULAR ATTITUDES TOWARDS TRANSPORT OF THE CHILD, BY DEMOGRAPHICS, JULY 2012 Base: 661 internet users aged 20-49 who are classified as middle class with one child aged 5-16 I let my child
walk as often as possible to
allow him/her some physical
exercise
I find it exhausting to
carry my child in my arms
My child is mostly carried
around as walking would
exhaust him/her too much*
I prefer to carry my child
wherever I go since it is more convenient than
using a pushchair
% % % %
All 50 40 13 11 Gender: Male 49 35 15 11 Female 51 45 10 10 Age: 20-29 43 36 14 15 30-49 58 43 12 6 Gender and age group: Male, 20-29 43 34 17 16 Male, 30-49 56 35 13 6 Female, 20-29 43 39 11 14 Female, 30-49 60 52 10 6 Region: Beijing 52 37 10 10 Shanghai 52 42 14 9 Guangzhou 54 45 13 10 Chengdu 55 37 12 8 Nanjing 39 36 14 17 Monthly personal income: Less than 7,000 RMB* 47 41 12 19 7,000-9,999 RMB 57 45 14 7 10,000-11,999 RMB 50 37 14 12 12,000-14,999 RMB* 60 39 12 11 15,000 RMB or more 34 31 11 9 Child in household: Boy 49 38 13 12 Girl 52 42 12 10 * small sub-sample (75-100) SOURCE: QQSURVEY/MINTEL

Appendix – Education of Little Emperors Marketing to Children China, November 2012
© Mintel Group Ltd. All rights reserved. 95
Appendix – Education of Little Emperors FIGURE 88: TYPE OF DEGREE INTENDED FOR CHILD, BY DEMOGRAPHICS, JULY 2012 Base: 839 internet users aged 20-49 who are classified as middle class with one child aged 5-16 College or University degree
(College, Undergraduate) Postgraduate degree (Graduate
and above) % %
All 32 75 Gender: Male 31 75 Female 34 75 Age: 20-39 34 74 40-49 29 77 Gender and age group: Male, 20-39 33 73 Male, 40-49 27 78 Female, 20-39 35 75 Female, 40-49* 32 74 Region: Beijing 26 82 Shanghai 36 66 Guangzhou 37 72 Chengdu 35 76 Nanjing 28 77 Monthly personal income: Less than 10,000 RMB 40 68 10,000-14,999 RMB 32 76 15,000 RMB or more 19 85 Child in household: Boy 32 76 Girl 32 73 * small sub-sample (75-100) SOURCE: QQSURVEY/MINTEL
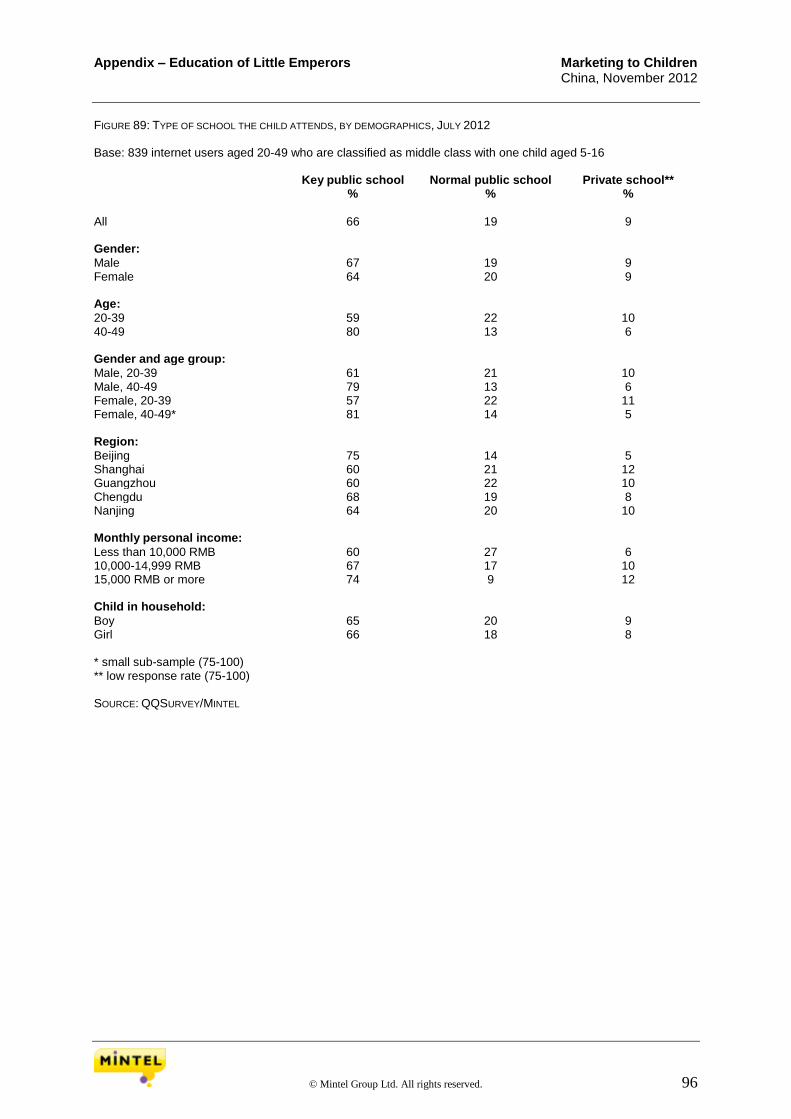
Appendix – Education of Little Emperors Marketing to Children China, November 2012
© Mintel Group Ltd. All rights reserved. 96
FIGURE 89: TYPE OF SCHOOL THE CHILD ATTENDS, BY DEMOGRAPHICS, JULY 2012 Base: 839 internet users aged 20-49 who are classified as middle class with one child aged 5-16 Key public school Normal public school Private school** % % %
All 66 19 9 Gender: Male 67 19 9 Female 64 20 9 Age: 20-39 59 22 10 40-49 80 13 6 Gender and age group: Male, 20-39 61 21 10 Male, 40-49 79 13 6 Female, 20-39 57 22 11 Female, 40-49* 81 14 5 Region: Beijing 75 14 5 Shanghai 60 21 12 Guangzhou 60 22 10 Chengdu 68 19 8 Nanjing 64 20 10 Monthly personal income: Less than 10,000 RMB 60 27 6 10,000-14,999 RMB 67 17 10 15,000 RMB or more 74 9 12 Child in household: Boy 65 20 9 Girl 66 18 8 * small sub-sample (75-100) ** low response rate (75-100) SOURCE: QQSURVEY/MINTEL
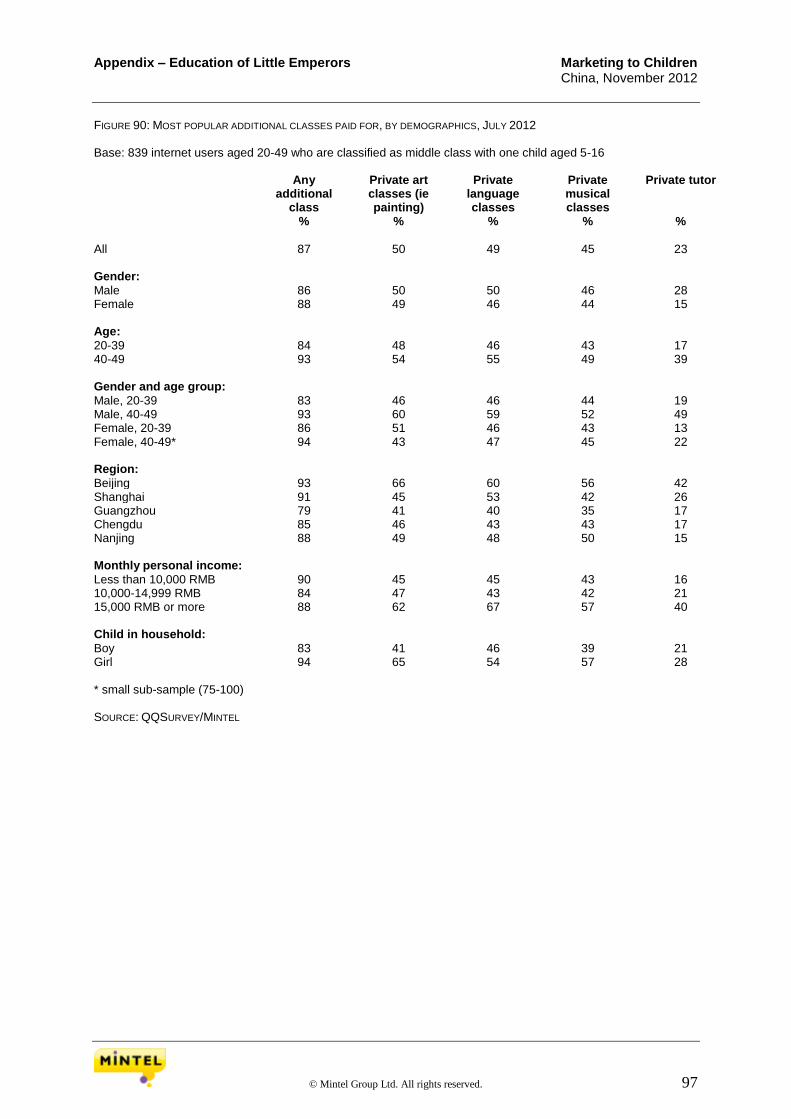
Appendix – Education of Little Emperors Marketing to Children China, November 2012
© Mintel Group Ltd. All rights reserved. 97
FIGURE 90: MOST POPULAR ADDITIONAL CLASSES PAID FOR, BY DEMOGRAPHICS, JULY 2012 Base: 839 internet users aged 20-49 who are classified as middle class with one child aged 5-16 Any
additional class
Private art classes (ie painting)
Private language classes
Private musical classes
Private tutor
% % % % %
All 87 50 49 45 23 Gender: Male 86 50 50 46 28 Female 88 49 46 44 15 Age: 20-39 84 48 46 43 17 40-49 93 54 55 49 39 Gender and age group: Male, 20-39 83 46 46 44 19 Male, 40-49 93 60 59 52 49 Female, 20-39 86 51 46 43 13 Female, 40-49* 94 43 47 45 22 Region: Beijing 93 66 60 56 42 Shanghai 91 45 53 42 26 Guangzhou 79 41 40 35 17 Chengdu 85 46 43 43 17 Nanjing 88 49 48 50 15 Monthly personal income: Less than 10,000 RMB 90 45 45 43 16 10,000-14,999 RMB 84 47 43 42 21 15,000 RMB or more 88 62 67 57 40 Child in household: Boy 83 41 46 39 21 Girl 94 65 54 57 28 * small sub-sample (75-100) SOURCE: QQSURVEY/MINTEL

Appendix – Education of Little Emperors Marketing to Children China, November 2012
© Mintel Group Ltd. All rights reserved. 98
FIGURE 91: NEXT MOST POPULAR ADDITIONAL CLASSES PAID FOR, BY DEMOGRAPHICS, JULY 2012 Base: 839 internet users aged 20-49 who are classified as middle class with one child aged 5-16 Private sports classes Crammer school (ie specific
preparation for exams) None of these
% % %
All 23 18 13 Gender: Male 26 17 14 Female 17 21 12 Age: 20-39 18 14 16 40-49 32 28 7 Gender and age group: Male, 20-39 19 14 17 Male, 40-49 41 24 7 Female, 20-39 17 15 14 Female, 40-49* 17 35 6 Region: Beijing 44 17 7 Shanghai 18 24 9 Guangzhou 13 13 21 Chengdu 17 21 15 Nanjing 20 17 12 Monthly personal income: Less than 10,000 RMB 17 21 10 10,000-14,999 RMB 19 20 16 15,000 RMB or more 41 12 12 Child in household: Boy 20 21 17 Girl 27 14 6 * small sub-sample (75-100) SOURCE: QQSURVEY/MINTEL

Appendix – Education of Little Emperors Marketing to Children China, November 2012
© Mintel Group Ltd. All rights reserved. 99
FIGURE 92: MOST POPULAR WILLINGNESS TO FUND THE CHILD’S STUDIES ABROAD, BY DEMOGRAPHICS, JULY 2012 Base: 839 internet users aged 20-49 who are classified as middle class with one child aged 5-16 Any
Yes Yes, the full
length of his/her
undergraduate studies abroad
Yes, a semester
during his/her
postgraduate studies abroad*
Yes, the full length of his/her
postgraduate studies abroad
Yes, an additional
further education
No, I prefer my
child studies within China
% % % % % %
All 87 31 9 33 44 13 Gender: Male 89 32 7 38 47 11 Female 83 31 12 26 39 17 Age: 20-39 84 32 8 29 42 16 40-49 93 29 10 45 49 7 Gender and age group:
Male, 20-39 86 37 8 32 42 13 Male, 40-49 94 20 6 52 57 6 Female, 20-39 80 26 9 24 40 19 Female, 40-49* 90 45 18 32 34 10 Region: Beijing 94 37 8 53 53 5 Shanghai 88 33 9 25 47 11 Guangzhou 85 28 8 32 42 15 Chengdu 80 28 10 26 39 20 Nanjing 86 31 9 30 38 14 Monthly personal income:
Less than 10,000 RMB 79 32 11 20 39 20 10,000-14,999 RMB 89 31 10 31 43 11 15,000 RMB or more 95 32 4 63 53 5 Child in household: Boy 89 33 10 32 44 11 Girl 82 28 7 37 43 18 * small sub-sample (75-100) SOURCE: QQSURVEY/MINTEL

Appendix – Education of Little Emperors Marketing to Children China, November 2012
© Mintel Group Ltd. All rights reserved. 100
FIGURE 93: MOST POPULAR FINANCIAL IMPACT OF CHILD’S EDUCATION, BY DEMOGRAPHICS, JULY 2012 Base: 839 internet users aged 20-49 who are classified as middle class with one child aged 5-16 I started
saving money for my
child’s education
early in order to afford a
good college/ university
I want my child to
compete with the best
academically, for this I am
willing to pay a significant amount of
money
It’s worth paying a lot
for education fees because my child will get a higher-
paid job afterwards
My child is likely to receive
financial support from
my whole family ie parents,
grandparents to pursue a
good education
I would surrender my
last resources to
allow my child higher education
% % % % %
All 58 56 41 28 26 Gender: Male 52 61 42 28 26 Female 67 47 38 27 26 Age: 20-39 63 56 40 30 28 40-49 47 55 42 23 22 Gender and age group: Male, 20-39 59 60 39 32 31 Male, 40-49 38 64 49 19 16 Female, 20-39 69 50 41 26 24 Female, 40-49* 63 40 29 30 31 Region: Beijing 46 66 54 21 25 Shanghai 62 58 38 30 20 Guangzhou 60 47 40 27 18 Chengdu 63 51 33 28 37 Nanjing 60 58 38 34 29 Monthly personal income: Less than 10,000 RMB 66 49 37 26 28 10,000-14,999 RMB 64 57 37 31 28 15,000 RMB or more 31 66 54 24 20 Child in household: Boy 61 53 37 32 25 Girl 53 61 47 21 28 * small sub-sample (75-100) SOURCE: QQSURVEY/MINTEL
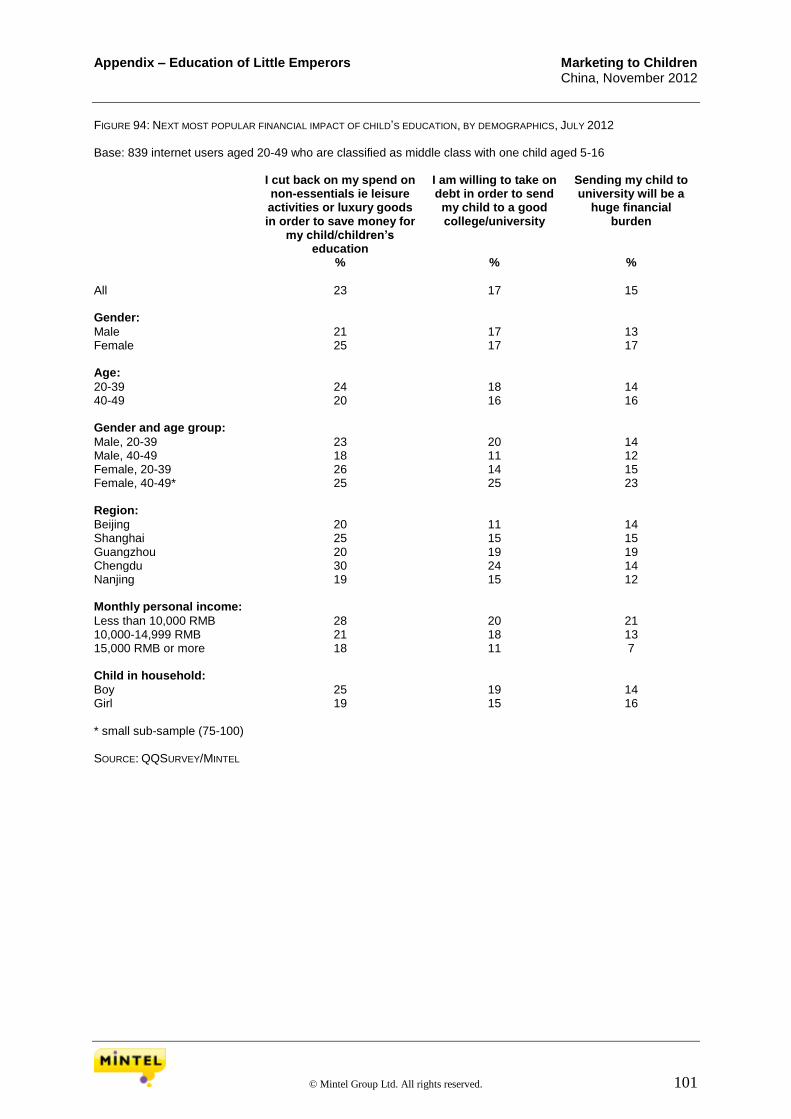
Appendix – Education of Little Emperors Marketing to Children China, November 2012
© Mintel Group Ltd. All rights reserved. 101
FIGURE 94: NEXT MOST POPULAR FINANCIAL IMPACT OF CHILD’S EDUCATION, BY DEMOGRAPHICS, JULY 2012 Base: 839 internet users aged 20-49 who are classified as middle class with one child aged 5-16 I cut back on my spend on
non-essentials ie leisure activities or luxury goods in order to save money for
my child/children’s education
I am willing to take on debt in order to send
my child to a good college/university
Sending my child to university will be a
huge financial burden
% % %
All 23 17 15 Gender: Male 21 17 13 Female 25 17 17 Age: 20-39 24 18 14 40-49 20 16 16 Gender and age group: Male, 20-39 23 20 14 Male, 40-49 18 11 12 Female, 20-39 26 14 15 Female, 40-49* 25 25 23 Region: Beijing 20 11 14 Shanghai 25 15 15 Guangzhou 20 19 19 Chengdu 30 24 14 Nanjing 19 15 12 Monthly personal income: Less than 10,000 RMB 28 20 21 10,000-14,999 RMB 21 18 13 15,000 RMB or more 18 11 7 Child in household: Boy 25 19 14 Girl 19 15 16 * small sub-sample (75-100) SOURCE: QQSURVEY/MINTEL

Appendix – Education of Little Emperors Marketing to Children China, November 2012
© Mintel Group Ltd. All rights reserved. 102
FIGURE 95: AGREEMENT WITH THE STATEMENTS ‘INDEPENDENCE IS AN IMPORTANT TREAT A CHILD HAS TO LEARN’ AND ‘I AM
TEACHING TRYING TO TEACH MY CHILD TO BE INDEPENDENT’, BY DEMOGRAPHICS, JULY 2012 Base: 1,500 internet users aged 20-49 who are classified as middle class with a child aged 0-16 Independence is
an important treat a child has
to learn
I am teaching trying to teach my child to be independent
Any agree Neither agree nor disagree
Any agree Neither agree nor disagree
% % % %
All 91 8 85 12 Gender: Male 90 9 85 12 Female 92 6 85 13 Age: 20-29 87 12 79 19 30-39 93 6 88 10 40-49 91 8 89 10 Gender and age group: Male, 20-29 86 13 77 20 Male, 30-39 91 7 88 9 Male, 40-49 91 8 90 8 Female, 20-29 88 10 81 17 Female, 30-39 95 4 88 10 Female, 40-49 92 8 86 13 Region: Beijing 91 8 85 11 Shanghai 91 7 86 10 Guangzhou 92 7 84 14 Chengdu 89 8 87 11 Nanjing 90 9 83 15 Monthly personal income:
Less than 7,000 RMB 89 8 81 17 7,000-9,999 RMB 93 5 86 12 10,000-11,999 RMB 89 9 86 11 12,000-14,999 RMB 89 8 86 12 15,000 RMB or more 90 9 85 12 Child in household: Boy 90 9 84 13 Girl 92 6 86 11 Age of child: 90 8 81 17 Aged 0-4 90 8 87 10 Aged 5-9 92 7 90 8 Aged 10-16 90 8 81 17 SOURCE: QQSURVEY/MINTEL
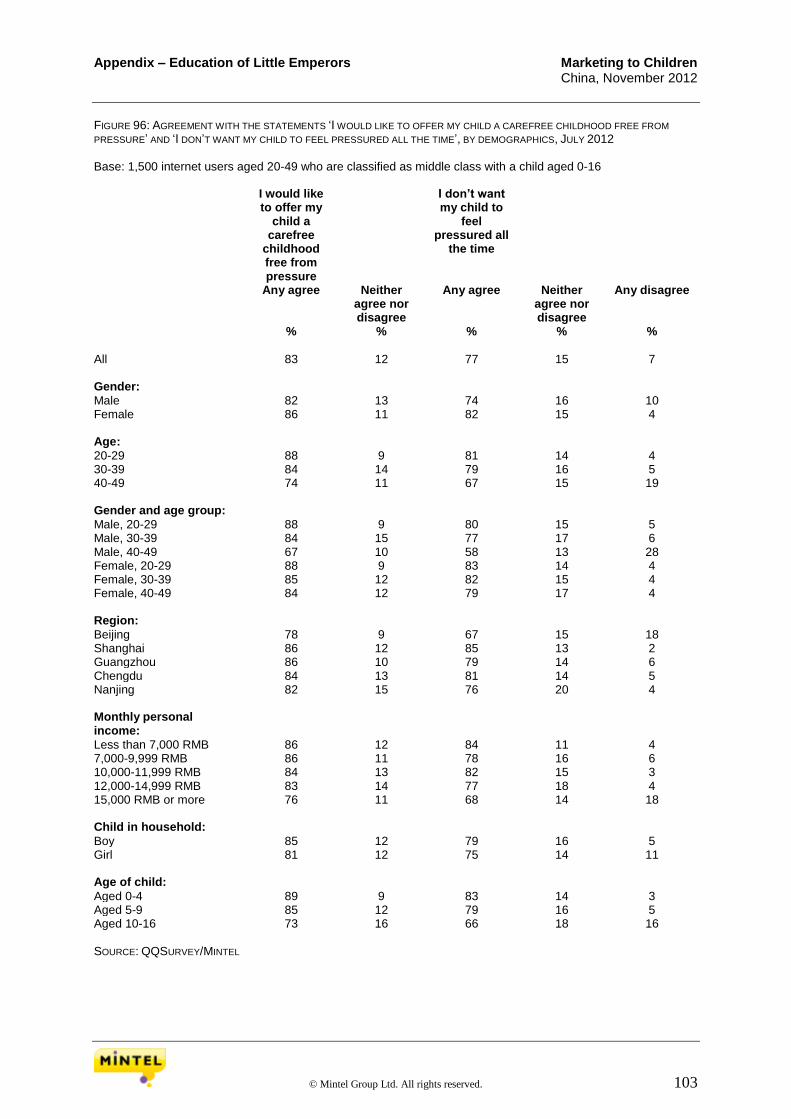
Appendix – Education of Little Emperors Marketing to Children China, November 2012
© Mintel Group Ltd. All rights reserved. 103
FIGURE 96: AGREEMENT WITH THE STATEMENTS ‘I WOULD LIKE TO OFFER MY CHILD A CAREFREE CHILDHOOD FREE FROM
PRESSURE’ AND ‘I DON’T WANT MY CHILD TO FEEL PRESSURED ALL THE TIME’, BY DEMOGRAPHICS, JULY 2012 Base: 1,500 internet users aged 20-49 who are classified as middle class with a child aged 0-16 I would like
to offer my child a
carefree childhood free from pressure
I don’t want my child to
feel pressured all
the time
Any agree Neither agree nor disagree
Any agree Neither agree nor disagree
Any disagree
% % % % %
All 83 12 77 15 7 Gender: Male 82 13 74 16 10 Female 86 11 82 15 4 Age: 20-29 88 9 81 14 4 30-39 84 14 79 16 5 40-49 74 11 67 15 19 Gender and age group: Male, 20-29 88 9 80 15 5 Male, 30-39 84 15 77 17 6 Male, 40-49 67 10 58 13 28 Female, 20-29 88 9 83 14 4 Female, 30-39 85 12 82 15 4 Female, 40-49 84 12 79 17 4 Region: Beijing 78 9 67 15 18 Shanghai 86 12 85 13 2 Guangzhou 86 10 79 14 6 Chengdu 84 13 81 14 5 Nanjing 82 15 76 20 4 Monthly personal income:
Less than 7,000 RMB 86 12 84 11 4 7,000-9,999 RMB 86 11 78 16 6 10,000-11,999 RMB 84 13 82 15 3 12,000-14,999 RMB 83 14 77 18 4 15,000 RMB or more 76 11 68 14 18 Child in household: Boy 85 12 79 16 5 Girl 81 12 75 14 11 Age of child: Aged 0-4 89 9 83 14 3 Aged 5-9 85 12 79 16 5 Aged 10-16 73 16 66 18 16 SOURCE: QQSURVEY/MINTEL

Appendix – Education of Little Emperors Marketing to Children China, November 2012
© Mintel Group Ltd. All rights reserved. 104
FIGURE 97: AGREEMENT WITH THE STATEMENTS ‘I WANT MY CHILD TO FOCUS ON ITS EDUCATION INSTEAD OF WASTING TIME
ON ACTIVITIES SUCH AS WATCHING TV’ AND ‘STUDY IS THE MOST IMPORTANT ACTIVITY FOR MY CHILD’, BY DEMOGRAPHICS, JULY 2012 Base: 1,500 internet users aged 20-49 who are classified as middle class with a child aged 0-16 I want my child
to focus on its education instead of
wasting time on activities
such as watching TV
Study is the most
important activity for my child
Any agree Neither agree nor disagree
Any disagree
Any agree Neither agree nor disagree
Any disagree
% % % % % %
All 60 25 15 59 26 15 Gender: Male 61 22 17 61 24 15 Female 60 28 12 56 29 16 Age: 20-29 57 27 16 48 31 21 30-39 64 25 11 59 26 15 40-49 55 19 26 76 17 7 Gender and age group: Male, 20-29 60 24 16 51 30 20 Male, 30-39 64 25 11 60 25 15 Male, 40-49 51 13 36 80 13 7 Female, 20-29 54 31 15 45 33 23 Female, 30-39 64 25 11 57 28 14 Female, 40-49 60 29 10 70 23 8 Region: Beijing 50 25 26 54 29 16 Shanghai 67 21 12 61 27 12 Guangzhou 61 27 11 54 34 12 Chengdu 56 29 15 60 21 19 Nanjing 68 21 11 64 18 17 Monthly personal income:
Less than 7,000 RMB 62 25 13 54 25 20 7,000-9,999 RMB 57 31 12 56 26 18 10,000-11,999 RMB 65 21 14 61 25 14 12,000-14,999 RMB 68 23 9 68 23 10 15,000 RMB or more 53 20 27 56 30 14 Child in household: Boy 64 24 12 60 26 14 Girl 55 25 20 57 26 17 Age of child: Aged 0-4 57 27 16 45 32 24 Aged 5-9 65 26 9 63 27 10 Aged 10-16 62 19 19 77 16 8 SOURCE: QQSURVEY/MINTEL
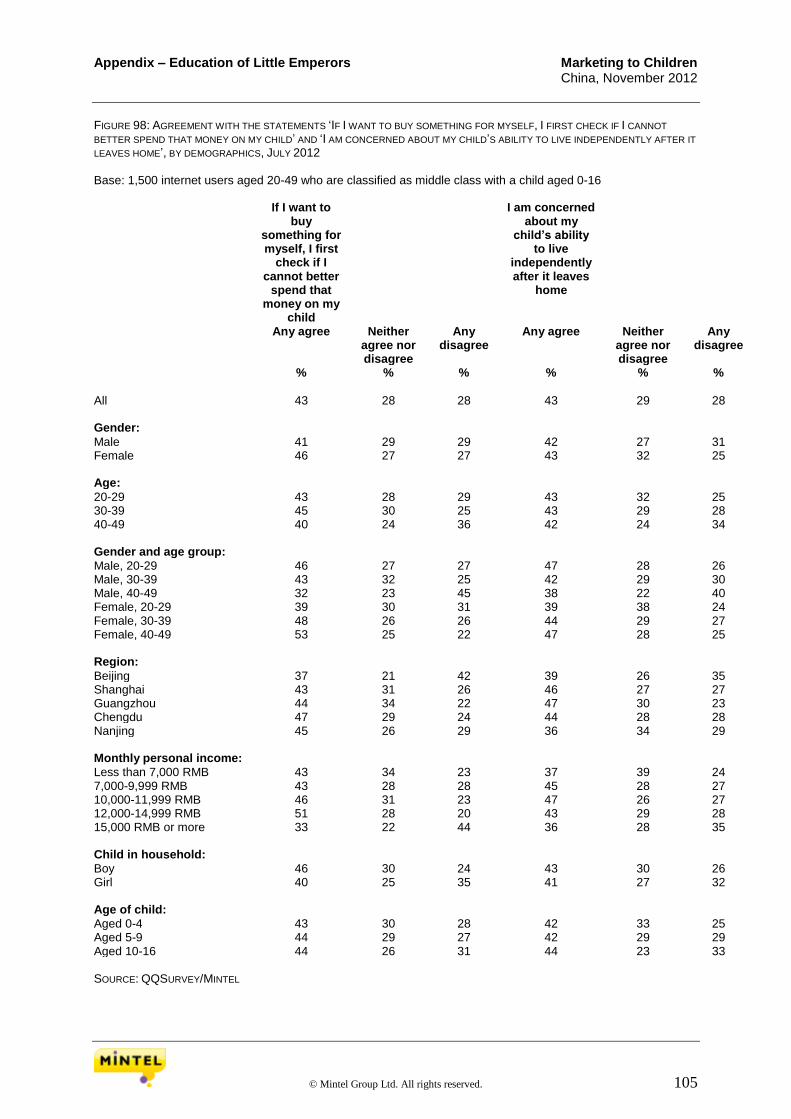
Appendix – Education of Little Emperors Marketing to Children China, November 2012
© Mintel Group Ltd. All rights reserved. 105
FIGURE 98: AGREEMENT WITH THE STATEMENTS ‘IF I WANT TO BUY SOMETHING FOR MYSELF, I FIRST CHECK IF I CANNOT
BETTER SPEND THAT MONEY ON MY CHILD’ AND ‘I AM CONCERNED ABOUT MY CHILD’S ABILITY TO LIVE INDEPENDENTLY AFTER IT
LEAVES HOME’, BY DEMOGRAPHICS, JULY 2012 Base: 1,500 internet users aged 20-49 who are classified as middle class with a child aged 0-16 If I want to
buy something for myself, I first
check if I cannot better
spend that money on my
child
I am concerned about my
child’s ability to live
independently after it leaves
home
Any agree Neither agree nor disagree
Any disagree
Any agree Neither agree nor disagree
Any disagree
% % % % % %
All 43 28 28 43 29 28 Gender: Male 41 29 29 42 27 31 Female 46 27 27 43 32 25 Age: 20-29 43 28 29 43 32 25 30-39 45 30 25 43 29 28 40-49 40 24 36 42 24 34 Gender and age group: Male, 20-29 46 27 27 47 28 26 Male, 30-39 43 32 25 42 29 30 Male, 40-49 32 23 45 38 22 40 Female, 20-29 39 30 31 39 38 24 Female, 30-39 48 26 26 44 29 27 Female, 40-49 53 25 22 47 28 25 Region: Beijing 37 21 42 39 26 35 Shanghai 43 31 26 46 27 27 Guangzhou 44 34 22 47 30 23 Chengdu 47 29 24 44 28 28 Nanjing 45 26 29 36 34 29 Monthly personal income: Less than 7,000 RMB 43 34 23 37 39 24 7,000-9,999 RMB 43 28 28 45 28 27 10,000-11,999 RMB 46 31 23 47 26 27 12,000-14,999 RMB 51 28 20 43 29 28 15,000 RMB or more 33 22 44 36 28 35 Child in household: Boy 46 30 24 43 30 26 Girl 40 25 35 41 27 32 Age of child: Aged 0-4 43 30 28 42 33 25 Aged 5-9 44 29 27 42 29 29 Aged 10-16 44 26 31 44 23 33 SOURCE: QQSURVEY/MINTEL
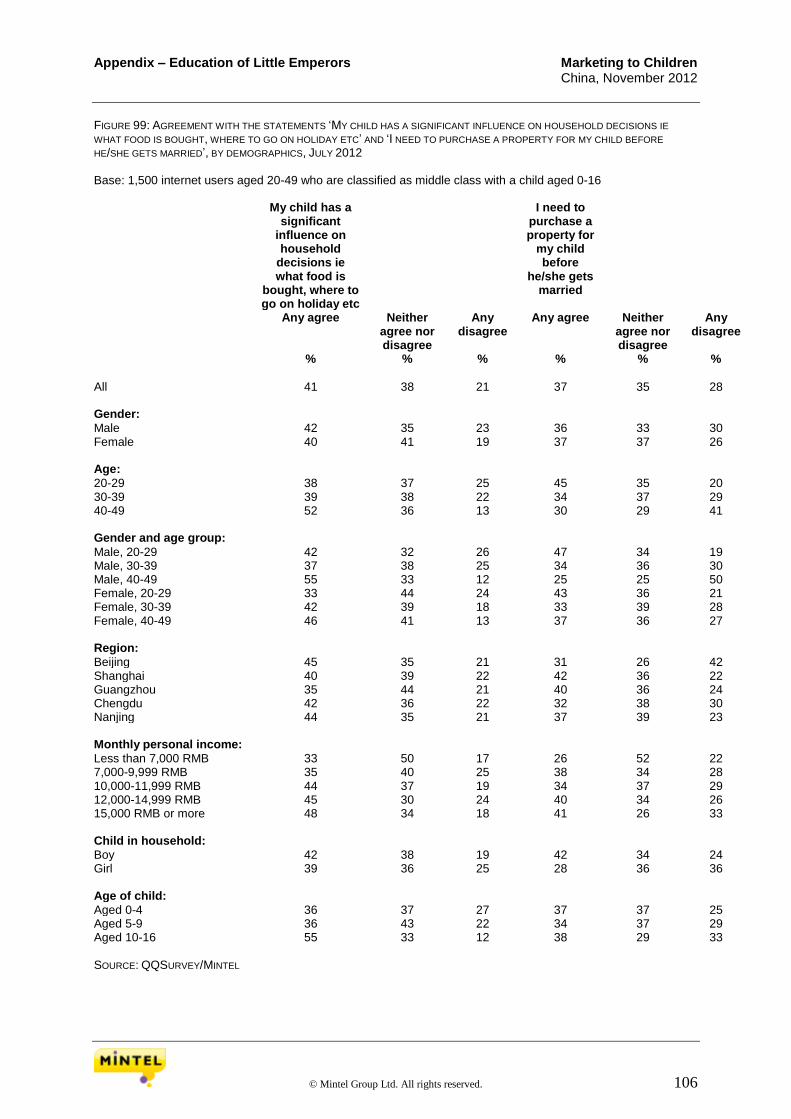
Appendix – Education of Little Emperors Marketing to Children China, November 2012
© Mintel Group Ltd. All rights reserved. 106
FIGURE 99: AGREEMENT WITH THE STATEMENTS ‘MY CHILD HAS A SIGNIFICANT INFLUENCE ON HOUSEHOLD DECISIONS IE
WHAT FOOD IS BOUGHT, WHERE TO GO ON HOLIDAY ETC’ AND ‘I NEED TO PURCHASE A PROPERTY FOR MY CHILD BEFORE
HE/SHE GETS MARRIED’, BY DEMOGRAPHICS, JULY 2012 Base: 1,500 internet users aged 20-49 who are classified as middle class with a child aged 0-16 My child has a
significant influence on household
decisions ie what food is
bought, where to go on holiday etc
I need to purchase a property for
my child before
he/she gets married
Any agree Neither agree nor disagree
Any disagree
Any agree Neither agree nor disagree
Any disagree
% % % % % %
All 41 38 21 37 35 28 Gender: Male 42 35 23 36 33 30 Female 40 41 19 37 37 26 Age: 20-29 38 37 25 45 35 20 30-39 39 38 22 34 37 29 40-49 52 36 13 30 29 41 Gender and age group: Male, 20-29 42 32 26 47 34 19 Male, 30-39 37 38 25 34 36 30 Male, 40-49 55 33 12 25 25 50 Female, 20-29 33 44 24 43 36 21 Female, 30-39 42 39 18 33 39 28 Female, 40-49 46 41 13 37 36 27 Region: Beijing 45 35 21 31 26 42 Shanghai 40 39 22 42 36 22 Guangzhou 35 44 21 40 36 24 Chengdu 42 36 22 32 38 30 Nanjing 44 35 21 37 39 23 Monthly personal income: Less than 7,000 RMB 33 50 17 26 52 22 7,000-9,999 RMB 35 40 25 38 34 28 10,000-11,999 RMB 44 37 19 34 37 29 12,000-14,999 RMB 45 30 24 40 34 26 15,000 RMB or more 48 34 18 41 26 33 Child in household: Boy 42 38 19 42 34 24 Girl 39 36 25 28 36 36 Age of child: Aged 0-4 36 37 27 37 37 25 Aged 5-9 36 43 22 34 37 29 Aged 10-16 55 33 12 38 29 33 SOURCE: QQSURVEY/MINTEL
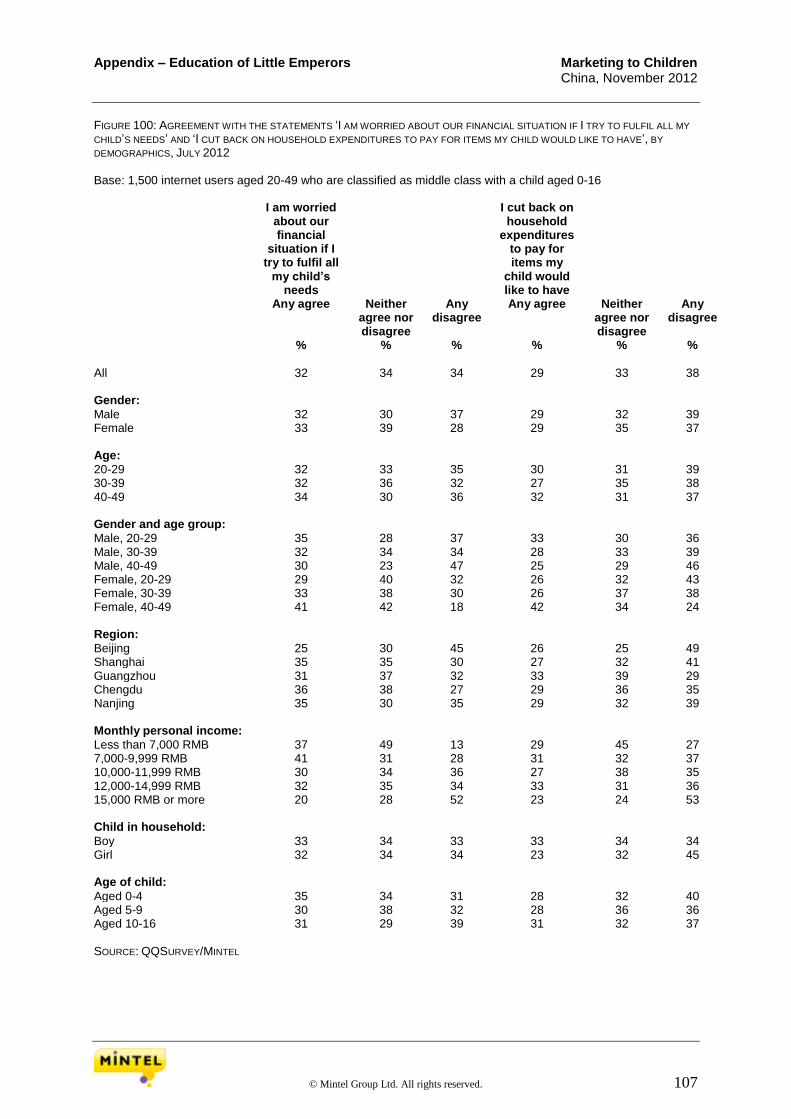
Appendix – Education of Little Emperors Marketing to Children China, November 2012
© Mintel Group Ltd. All rights reserved. 107
FIGURE 100: AGREEMENT WITH THE STATEMENTS ‘I AM WORRIED ABOUT OUR FINANCIAL SITUATION IF I TRY TO FULFIL ALL MY
CHILD’S NEEDS’ AND ‘I CUT BACK ON HOUSEHOLD EXPENDITURES TO PAY FOR ITEMS MY CHILD WOULD LIKE TO HAVE’, BY
DEMOGRAPHICS, JULY 2012 Base: 1,500 internet users aged 20-49 who are classified as middle class with a child aged 0-16 I am worried
about our financial
situation if I try to fulfil all
my child’s needs
I cut back on household
expenditures to pay for items my
child would like to have
Any agree Neither agree nor disagree
Any disagree
Any agree Neither agree nor disagree
Any disagree
% % % % % %
All 32 34 34 29 33 38 Gender: Male 32 30 37 29 32 39 Female 33 39 28 29 35 37 Age: 20-29 32 33 35 30 31 39 30-39 32 36 32 27 35 38 40-49 34 30 36 32 31 37 Gender and age group: Male, 20-29 35 28 37 33 30 36 Male, 30-39 32 34 34 28 33 39 Male, 40-49 30 23 47 25 29 46 Female, 20-29 29 40 32 26 32 43 Female, 30-39 33 38 30 26 37 38 Female, 40-49 41 42 18 42 34 24 Region: Beijing 25 30 45 26 25 49 Shanghai 35 35 30 27 32 41 Guangzhou 31 37 32 33 39 29 Chengdu 36 38 27 29 36 35 Nanjing 35 30 35 29 32 39 Monthly personal income: Less than 7,000 RMB 37 49 13 29 45 27 7,000-9,999 RMB 41 31 28 31 32 37 10,000-11,999 RMB 30 34 36 27 38 35 12,000-14,999 RMB 32 35 34 33 31 36 15,000 RMB or more 20 28 52 23 24 53 Child in household: Boy 33 34 33 33 34 34 Girl 32 34 34 23 32 45 Age of child: Aged 0-4 35 34 31 28 32 40 Aged 5-9 30 38 32 28 36 36 Aged 10-16 31 29 39 31 32 37 SOURCE: QQSURVEY/MINTEL

Appendix – Education of Little Emperors Marketing to Children China, November 2012
© Mintel Group Ltd. All rights reserved. 108
FIGURE 101: AGREEMENT WITH THE STATEMENTS ‘I WANT MY CHILD TO PURSUE THE CAREER THAT WE AS PARENTS HAVE
CHOSEN FOR HIM/HER’ AND ‘MY CHILD WILL ALWAYS BE ABLE TO RELY ON US FINANCIALLY INDEPENDENT OF HIS/HER AGE’, BY
DEMOGRAPHICS, JULY 2012 Base: 1,500 internet users aged 20-49 who are classified as middle class with a child aged 0-16 I want my
child to pursue the career that
we as parents have chosen for him/her
My child will always be able to rely
on us financially
independent of his/her
age
Any agree Neither agree nor disagree
Any disagree
Any agree Neither agree nor disagree
Any disagree
% % % % % %
All 28 32 40 23 25 52 Gender: Male 28 30 42 23 25 52 Female 28 35 37 23 25 52 Age: 20-29 28 30 42 25 29 46 30-39 27 33 40 21 26 53 40-49 31 31 38 24 17 59 Gender and age group: Male, 20-29 31 26 43 27 28 45 Male, 30-39 27 33 40 22 26 52 Male, 40-49 26 28 46 19 19 62 Female, 20-29 23 36 42 23 30 47 Female, 30-39 27 34 39 21 26 54 Female, 40-49 39 36 25 30 15 55 Region: Beijing 18 29 53 20 23 57 Shanghai 31 32 37 24 24 51 Guangzhou 29 37 35 24 29 47 Chengdu 30 31 39 20 28 52 Nanjing 32 30 38 26 23 52 Monthly personal income: Less than 7,000 RMB 20 37 43 16 33 51 7,000-9,999 RMB 24 33 43 18 24 58 10,000-11,999 RMB 29 32 39 24 25 51 12,000-14,999 RMB 37 31 32 23 27 50 15,000 RMB or more 29 28 43 33 22 45 Child in household: Boy 31 32 37 25 25 50 Girl 23 31 46 19 27 54 Age of child: Aged 0-4 23 31 47 23 27 50 Aged 5-9 30 32 39 22 27 51 Aged 10-16 34 34 32 24 21 55 SOURCE: QQSURVEY/MINTEL
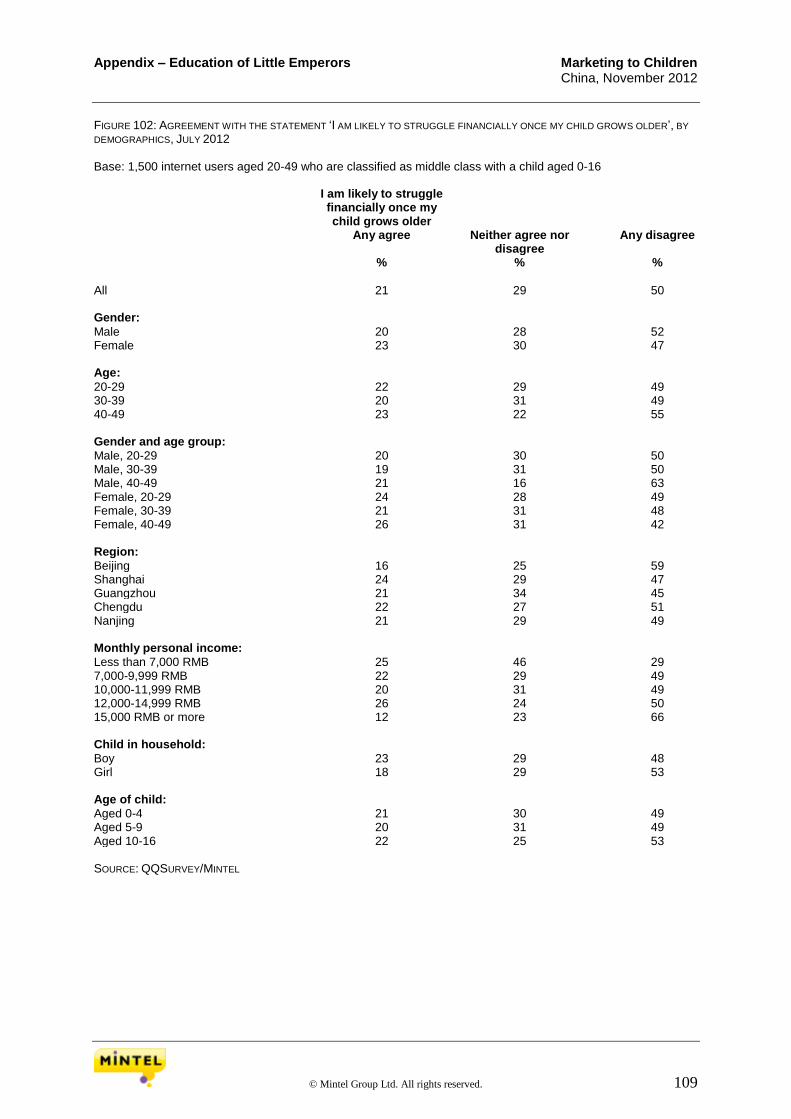
Appendix – Education of Little Emperors Marketing to Children China, November 2012
© Mintel Group Ltd. All rights reserved. 109
FIGURE 102: AGREEMENT WITH THE STATEMENT ‘I AM LIKELY TO STRUGGLE FINANCIALLY ONCE MY CHILD GROWS OLDER’, BY
DEMOGRAPHICS, JULY 2012 Base: 1,500 internet users aged 20-49 who are classified as middle class with a child aged 0-16 I am likely to struggle
financially once my child grows older
Any agree Neither agree nor disagree
Any disagree
% % %
All 21 29 50 Gender: Male 20 28 52 Female 23 30 47 Age: 20-29 22 29 49 30-39 20 31 49 40-49 23 22 55 Gender and age group: Male, 20-29 20 30 50 Male, 30-39 19 31 50 Male, 40-49 21 16 63 Female, 20-29 24 28 49 Female, 30-39 21 31 48 Female, 40-49 26 31 42 Region: Beijing 16 25 59 Shanghai 24 29 47 Guangzhou 21 34 45 Chengdu 22 27 51 Nanjing 21 29 49 Monthly personal income: Less than 7,000 RMB 25 46 29 7,000-9,999 RMB 22 29 49 10,000-11,999 RMB 20 31 49 12,000-14,999 RMB 26 24 50 15,000 RMB or more 12 23 66 Child in household: Boy 23 29 48 Girl 18 29 53 Age of child: Aged 0-4 21 30 49 Aged 5-9 20 31 49 Aged 10-16 22 25 53 SOURCE: QQSURVEY/MINTEL

Appendix – Education of Little Emperors Marketing to Children China, November 2012
© Mintel Group Ltd. All rights reserved. 110
FIGURE 103: MOST POPULAR ATTITUDES TOWARDS THE CHILD’S DEVELOPMENT AND FINANCIAL BURDEN (ANY AGREE), BY
DEMOGRAPHICS, JULY 2012 Base: 1,500 internet users aged 20-49 who are classified as middle class with a child aged 0-16 Independence
is an important
treat a child has to learn
I am teaching trying to teach my
child to be independent
I would like to offer my
child a carefree
childhood free from pressure
I don’t want my child to
feel pressured all the time
I want my child to focus on its
education instead of
wasting time on activities such as watching TV
% % % % %
All 91 85 83 77 60 Gender: Male 90 85 82 74 61 Female 92 85 86 82 60 Age: 20-29 87 79 88 81 57 30-39 93 88 84 79 64 40-49 91 89 74 67 55 Gender and age group: Male, 20-29 86 77 88 80 60 Male, 30-39 91 88 84 77 64 Male, 40-49 91 90 67 58 51 Female, 20-29 88 81 88 83 54 Female, 30-39 95 88 85 82 64 Female, 40-49 92 86 84 79 60 Region: Beijing 91 85 78 67 50 Shanghai 91 86 86 85 67 Guangzhou 92 84 86 79 61 Chengdu 89 87 84 81 56 Nanjing 90 83 82 76 68 Monthly personal income: Less than 7,000 RMB 89 81 86 84 62 7,000-9,999 RMB 93 86 86 78 57 10,000-11,999 RMB 89 86 84 82 65 12,000-14,999 RMB 89 86 83 77 68 15,000 RMB or more 90 85 76 68 53 Child in household: Boy 90 84 85 79 64 Girl 92 86 81 75 55 Age of child: Aged 0-4 90 81 89 83 57 Aged 5-9 90 87 85 79 65 Aged 10-16 92 90 73 66 62 SOURCE: QQSURVEY/MINTEL
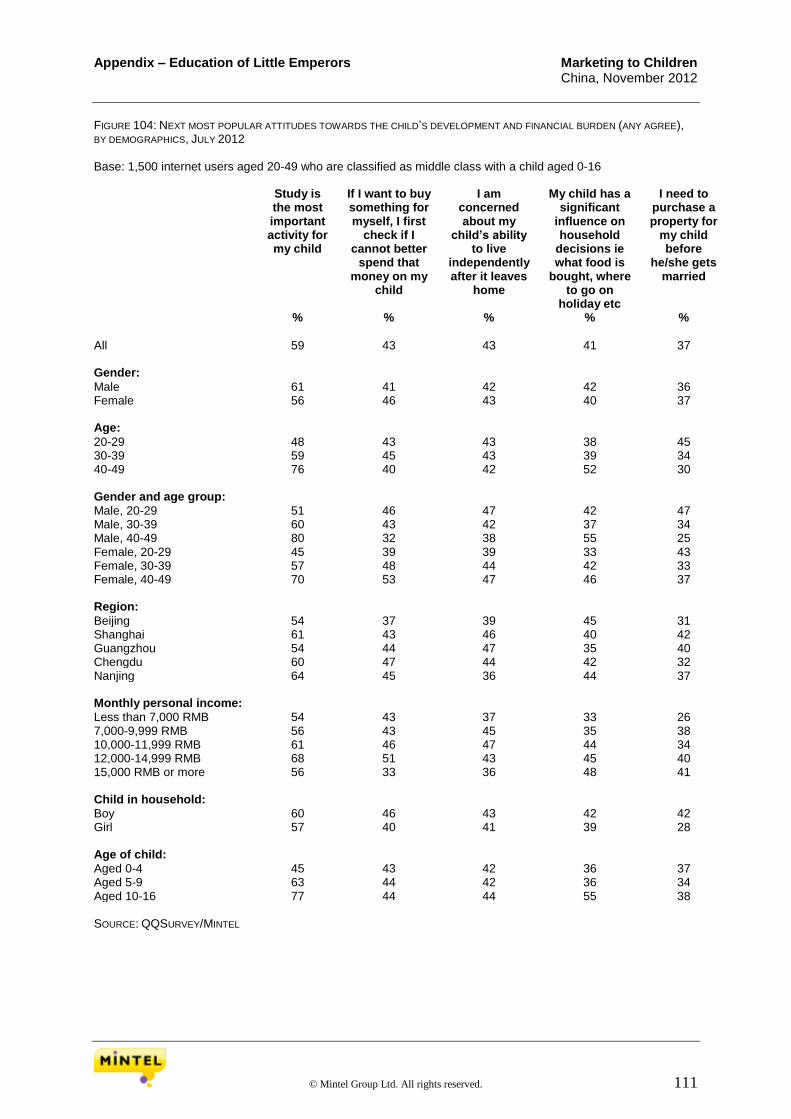
Appendix – Education of Little Emperors Marketing to Children China, November 2012
© Mintel Group Ltd. All rights reserved. 111
FIGURE 104: NEXT MOST POPULAR ATTITUDES TOWARDS THE CHILD’S DEVELOPMENT AND FINANCIAL BURDEN (ANY AGREE), BY DEMOGRAPHICS, JULY 2012 Base: 1,500 internet users aged 20-49 who are classified as middle class with a child aged 0-16 Study is
the most important activity for my child
If I want to buy something for myself, I first
check if I cannot better
spend that money on my
child
I am concerned about my
child’s ability to live
independently after it leaves
home
My child has a significant
influence on household
decisions ie what food is
bought, where to go on
holiday etc
I need to purchase a property for
my child before
he/she gets married
% % % % %
All 59 43 43 41 37 Gender: Male 61 41 42 42 36 Female 56 46 43 40 37 Age: 20-29 48 43 43 38 45 30-39 59 45 43 39 34 40-49 76 40 42 52 30 Gender and age group: Male, 20-29 51 46 47 42 47 Male, 30-39 60 43 42 37 34 Male, 40-49 80 32 38 55 25 Female, 20-29 45 39 39 33 43 Female, 30-39 57 48 44 42 33 Female, 40-49 70 53 47 46 37 Region: Beijing 54 37 39 45 31 Shanghai 61 43 46 40 42 Guangzhou 54 44 47 35 40 Chengdu 60 47 44 42 32 Nanjing 64 45 36 44 37 Monthly personal income: Less than 7,000 RMB 54 43 37 33 26 7,000-9,999 RMB 56 43 45 35 38 10,000-11,999 RMB 61 46 47 44 34 12,000-14,999 RMB 68 51 43 45 40 15,000 RMB or more 56 33 36 48 41 Child in household: Boy 60 46 43 42 42 Girl 57 40 41 39 28 Age of child: Aged 0-4 45 43 42 36 37 Aged 5-9 63 44 42 36 34 Aged 10-16 77 44 44 55 38 SOURCE: QQSURVEY/MINTEL
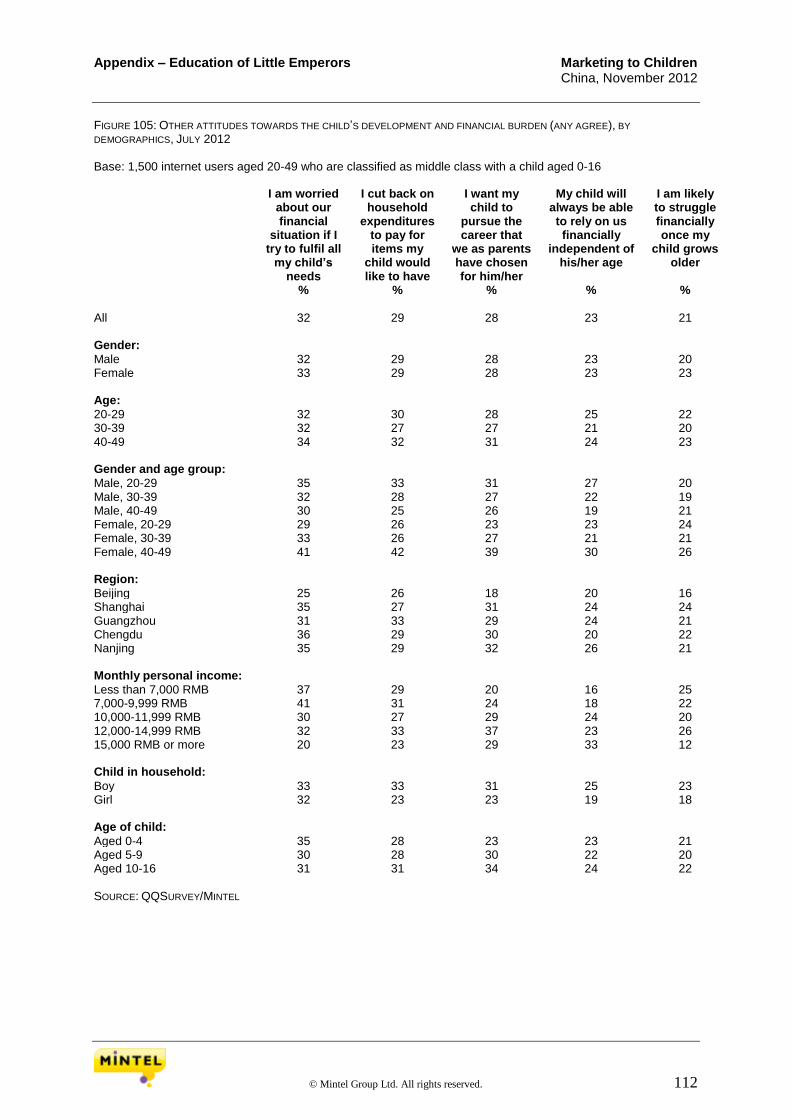
Appendix – Education of Little Emperors Marketing to Children China, November 2012
© Mintel Group Ltd. All rights reserved. 112
FIGURE 105: OTHER ATTITUDES TOWARDS THE CHILD’S DEVELOPMENT AND FINANCIAL BURDEN (ANY AGREE), BY
DEMOGRAPHICS, JULY 2012 Base: 1,500 internet users aged 20-49 who are classified as middle class with a child aged 0-16 I am worried
about our financial
situation if I try to fulfil all
my child’s needs
I cut back on household
expenditures to pay for items my
child would like to have
I want my child to
pursue the career that
we as parents have chosen for him/her
My child will always be able to rely on us financially
independent of his/her age
I am likely to struggle financially once my
child grows older
% % % % %
All 32 29 28 23 21 Gender: Male 32 29 28 23 20 Female 33 29 28 23 23 Age: 20-29 32 30 28 25 22 30-39 32 27 27 21 20 40-49 34 32 31 24 23 Gender and age group: Male, 20-29 35 33 31 27 20 Male, 30-39 32 28 27 22 19 Male, 40-49 30 25 26 19 21 Female, 20-29 29 26 23 23 24 Female, 30-39 33 26 27 21 21 Female, 40-49 41 42 39 30 26 Region: Beijing 25 26 18 20 16 Shanghai 35 27 31 24 24 Guangzhou 31 33 29 24 21 Chengdu 36 29 30 20 22 Nanjing 35 29 32 26 21 Monthly personal income: Less than 7,000 RMB 37 29 20 16 25 7,000-9,999 RMB 41 31 24 18 22 10,000-11,999 RMB 30 27 29 24 20 12,000-14,999 RMB 32 33 37 23 26 15,000 RMB or more 20 23 29 33 12 Child in household: Boy 33 33 31 25 23 Girl 32 23 23 19 18 Age of child: Aged 0-4 35 28 23 23 21 Aged 5-9 30 28 30 22 20 Aged 10-16 31 31 34 24 22 SOURCE: QQSURVEY/MINTEL

Appendix – Spending Power of Marketing to Children Little Emperors China, November 2012
© Mintel Group Ltd. All rights reserved. 113
Appendix – Spending Power of Little Emperors FIGURE 106: THE CHILD’S INCOME, BY DEMOGRAPHICS, JULY 2012 Base: 839 internet users aged 20-49 who are classified as middle class with one child aged 5-16 Monthly allowance (ie
pocket money) from parents
Money from grandparents
Money from other family members (eg
aunt, uncle etc) % % %
All 92 48 20 Gender: Male 91 47 20 Female 92 50 21 Age: 20-39 90 51 24 40-49 96 42 13 Gender and age group: Male, 20-39 90 54 25 Male, 40-49 95 33 7 Female, 20-39 90 46 21 Female, 40-49* 98 58 22 Region: Beijing 94 45 20 Shanghai 88 54 23 Guangzhou 92 42 20 Chengdu 95 56 21 Nanjing 89 44 17 Monthly personal income: Less than 10,000 RMB 91 50 20 10,000-14,999 RMB 92 53 20 15,000 RMB or more 94 34 22 Child in household: Boy 93 50 21 Girl 90 45 19 * small sub-sample (75-100) SOURCE: QQSURVEY/MINTEL

Appendix – Spending Power of Marketing to Children Little Emperors China, November 2012
© Mintel Group Ltd. All rights reserved. 114
FIGURE 107: CONDITION MONTHLY ALLOWANCE IS BASED ON, BY DEMOGRAPHICS, JULY 2012 Base: 770 internet users aged 20-49 who are classified as middle class with one child aged 5-16 whose child receives pocket money My child’s
behaviour at home
My child’s performance in
school/after-school classes
My child helping with household
chores
No, this allowance is
paid irrespective
% % % %
All 54 49 46 31 Gender: Male 51 46 43 35 Female 59 52 52 24 Age: 20-39 58 51 49 28 40-49 46 44 41 36 Gender and age group: Male, 20-39 55 51 48 30 Male, 40-49 42 37 32 45 Female, 20-39 62 50 50 26 Female, 40-49* 52 56 55 21 Region: Beijing 41 38 34 45 Shanghai 58 50 50 27 Guangzhou 52 54 51 27 Chengdu 64 53 53 22 Nanjing 53 49 46 31 Monthly personal income: Less than 10,000 RMB 55 49 50 27 10,000-14,999 RMB 58 53 47 27 15,000 RMB or more 44 40 38 45 Child in household: Boy 55 51 48 28 Girl 52 43 43 35 * small sub-sample (75-100) SOURCE: QQSURVEY/MINTEL
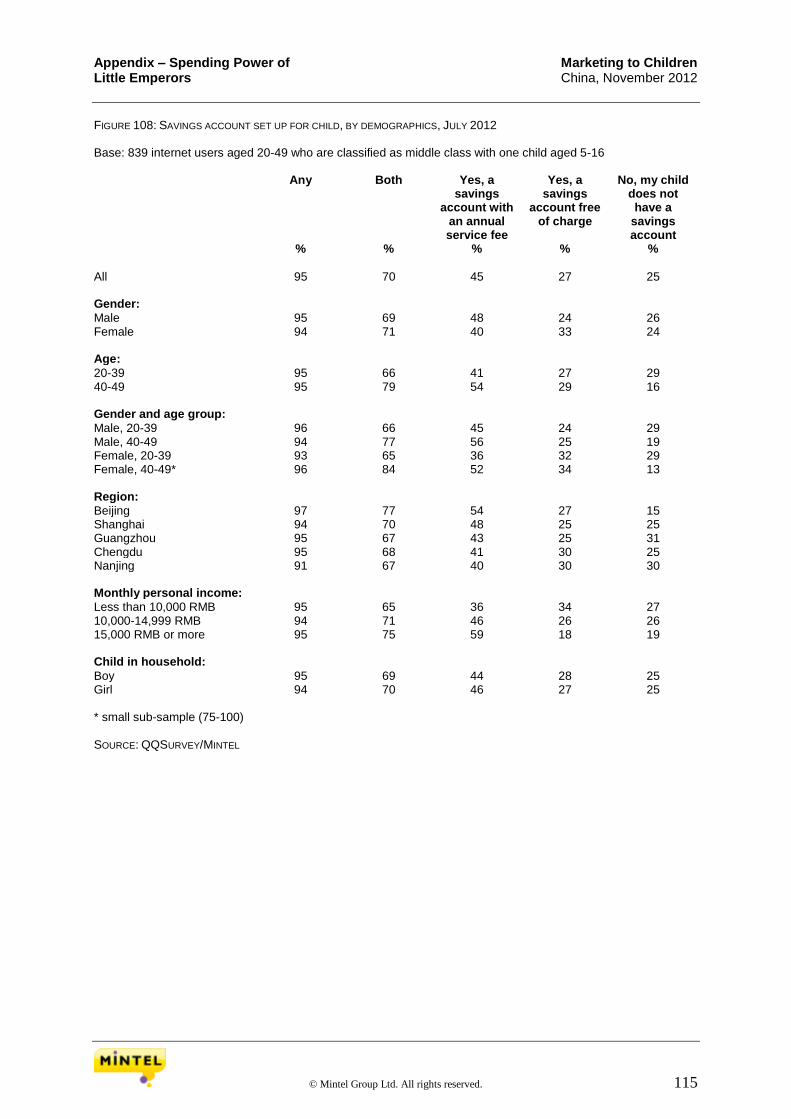
Appendix – Spending Power of Marketing to Children Little Emperors China, November 2012
© Mintel Group Ltd. All rights reserved. 115
FIGURE 108: SAVINGS ACCOUNT SET UP FOR CHILD, BY DEMOGRAPHICS, JULY 2012 Base: 839 internet users aged 20-49 who are classified as middle class with one child aged 5-16 Any Both Yes, a
savings account with
an annual service fee
Yes, a savings
account free of charge
No, my child does not have a
savings account
% % % % %
All 95 70 45 27 25 Gender: Male 95 69 48 24 26 Female 94 71 40 33 24 Age: 20-39 95 66 41 27 29 40-49 95 79 54 29 16 Gender and age group: Male, 20-39 96 66 45 24 29 Male, 40-49 94 77 56 25 19 Female, 20-39 93 65 36 32 29 Female, 40-49* 96 84 52 34 13 Region: Beijing 97 77 54 27 15 Shanghai 94 70 48 25 25 Guangzhou 95 67 43 25 31 Chengdu 95 68 41 30 25 Nanjing 91 67 40 30 30 Monthly personal income: Less than 10,000 RMB 95 65 36 34 27 10,000-14,999 RMB 94 71 46 26 26 15,000 RMB or more 95 75 59 18 19 Child in household: Boy 95 69 44 28 25 Girl 94 70 46 27 25 * small sub-sample (75-100) SOURCE: QQSURVEY/MINTEL

Appendix – Spending Power of Marketing to Children Little Emperors China, November 2012
© Mintel Group Ltd. All rights reserved. 116
FIGURE 109: INSURANCE POLICIES SET UP FOR CHILD, BY DEMOGRAPHICS, JULY 2012 Base: 839 internet users aged 20-49 who are classified as middle class with one child aged 5-16 Any Both Yes, a simple
insurance policy Yes, an
insurance policy combined with a saving element
% % % %
All 95 70 39 52 Gender: Male 95 69 42 50 Female 94 71 36 56 Age: 20-39 95 66 34 58 40-49 95 79 51 40 Gender and age group: Male, 20-39 96 66 36 57 Male, 40-49 94 77 55 35 Female, 20-39 93 65 32 58 Female, 40-49* 96 84 44 49 Region: Beijing 97 77 51 42 Shanghai 94 70 38 54 Guangzhou 95 67 39 54 Chengdu 95 68 37 55 Nanjing 91 67 31 57 Monthly personal income: Less than 10,000 RMB 95 65 38 52 10,000-14,999 RMB 94 71 35 58 15,000 RMB or more 95 75 52 41 Child in household: Boy 95 69 40 52 Girl 94 70 39 53 * small sub-sample (75-100) SOURCE: QQSURVEY/MINTEL

Appendix – Spending Power of Marketing to Children Little Emperors China, November 2012
© Mintel Group Ltd. All rights reserved. 117
FIGURE 110: TYPE OF DEGREE INTENDED FOR CHILD, BY DEMOGRAPHICS, JULY 2012 Base: 839 internet users aged 20-49 who are classified as middle class with one child aged 5-16 College or University degree
(College, Undergraduate) Postgraduate degree (Graduate
and above) % %
All 32 75 Gender: Male 31 75 Female 34 75 Age: 20-39 34 74 40-49 29 77 Gender and age group: Male, 20-39 33 73 Male, 40-49 27 78 Female, 20-39 35 75 Female, 40-49* 32 74 Region: Beijing 26 82 Shanghai 36 66 Guangzhou 37 72 Chengdu 35 76 Nanjing 28 77 Monthly personal income: Less than 10,000 RMB 40 68 10,000-14,999 RMB 32 76 15,000 RMB or more 19 85 Child in household: Boy 32 76 Girl 32 73 * small sub-sample (75-100) SOURCE: QQSURVEY/MINTEL
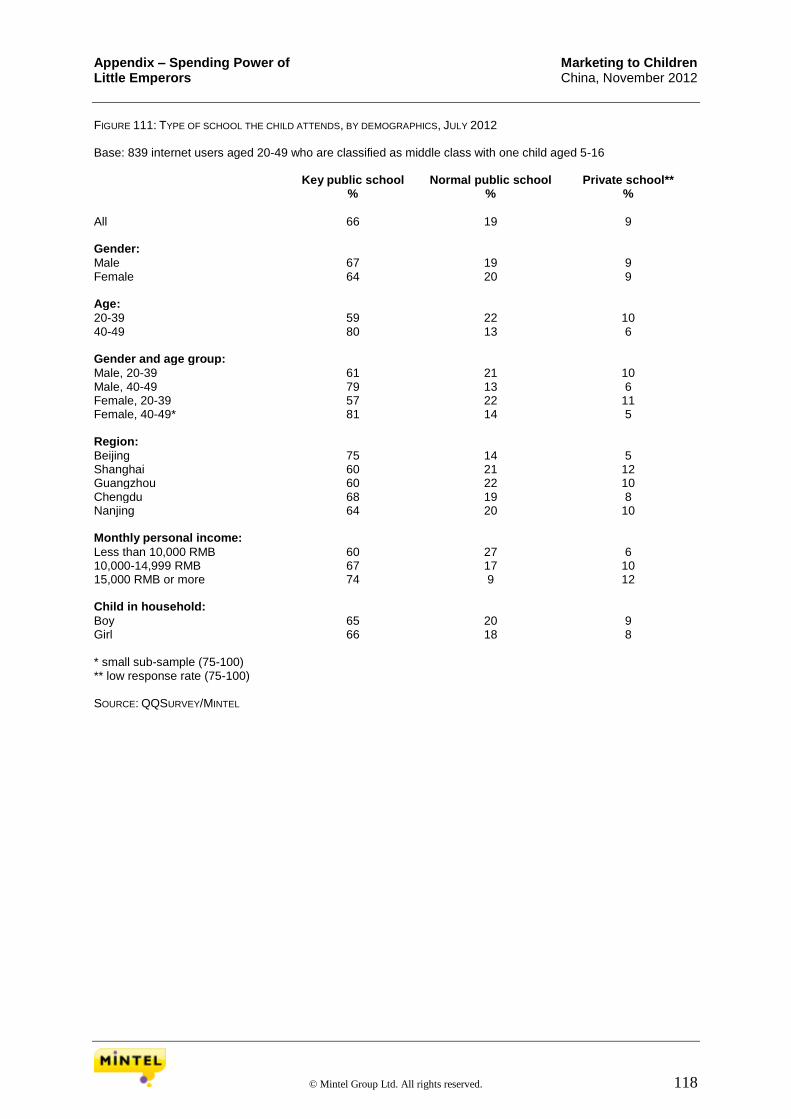
Appendix – Spending Power of Marketing to Children Little Emperors China, November 2012
© Mintel Group Ltd. All rights reserved. 118
FIGURE 111: TYPE OF SCHOOL THE CHILD ATTENDS, BY DEMOGRAPHICS, JULY 2012 Base: 839 internet users aged 20-49 who are classified as middle class with one child aged 5-16 Key public school Normal public school Private school** % % %
All 66 19 9 Gender: Male 67 19 9 Female 64 20 9 Age: 20-39 59 22 10 40-49 80 13 6 Gender and age group: Male, 20-39 61 21 10 Male, 40-49 79 13 6 Female, 20-39 57 22 11 Female, 40-49* 81 14 5 Region: Beijing 75 14 5 Shanghai 60 21 12 Guangzhou 60 22 10 Chengdu 68 19 8 Nanjing 64 20 10 Monthly personal income: Less than 10,000 RMB 60 27 6 10,000-14,999 RMB 67 17 10 15,000 RMB or more 74 9 12 Child in household: Boy 65 20 9 Girl 66 18 8 * small sub-sample (75-100) ** low response rate (75-100) SOURCE: QQSURVEY/MINTEL
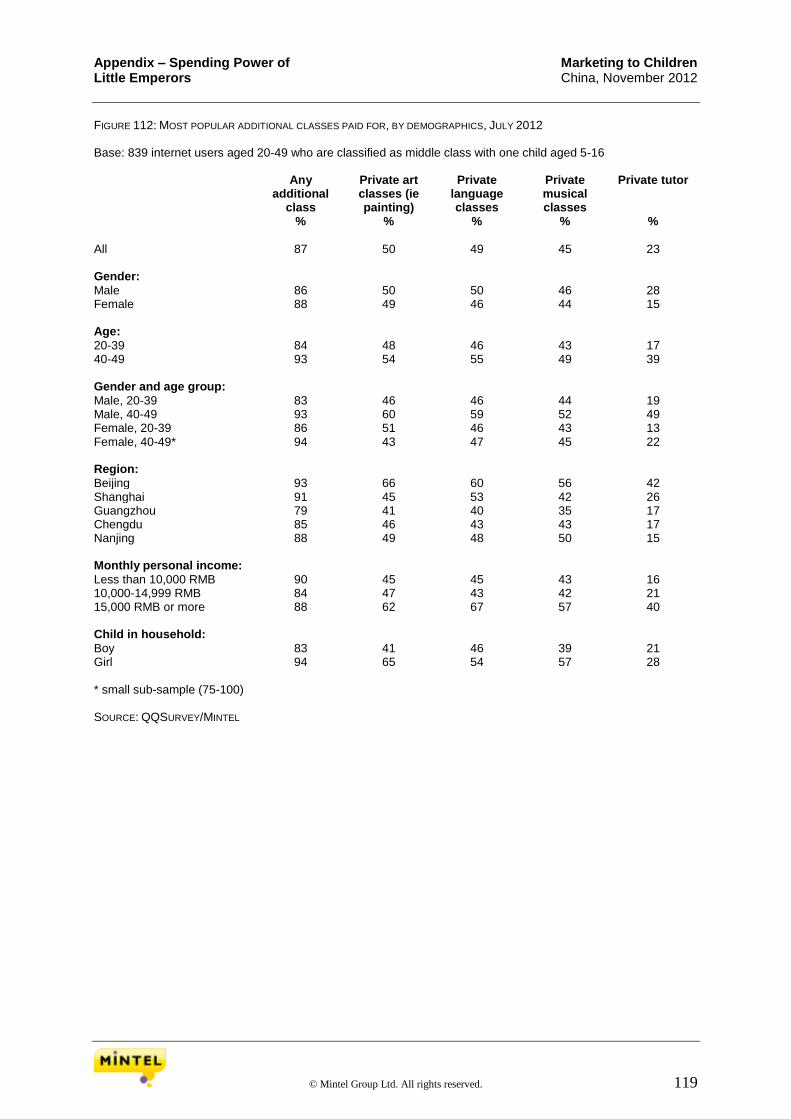
Appendix – Spending Power of Marketing to Children Little Emperors China, November 2012
© Mintel Group Ltd. All rights reserved. 119
FIGURE 112: MOST POPULAR ADDITIONAL CLASSES PAID FOR, BY DEMOGRAPHICS, JULY 2012 Base: 839 internet users aged 20-49 who are classified as middle class with one child aged 5-16 Any
additional class
Private art classes (ie painting)
Private language classes
Private musical classes
Private tutor
% % % % %
All 87 50 49 45 23 Gender: Male 86 50 50 46 28 Female 88 49 46 44 15 Age: 20-39 84 48 46 43 17 40-49 93 54 55 49 39 Gender and age group: Male, 20-39 83 46 46 44 19 Male, 40-49 93 60 59 52 49 Female, 20-39 86 51 46 43 13 Female, 40-49* 94 43 47 45 22 Region: Beijing 93 66 60 56 42 Shanghai 91 45 53 42 26 Guangzhou 79 41 40 35 17 Chengdu 85 46 43 43 17 Nanjing 88 49 48 50 15 Monthly personal income: Less than 10,000 RMB 90 45 45 43 16 10,000-14,999 RMB 84 47 43 42 21 15,000 RMB or more 88 62 67 57 40 Child in household: Boy 83 41 46 39 21 Girl 94 65 54 57 28 * small sub-sample (75-100) SOURCE: QQSURVEY/MINTEL
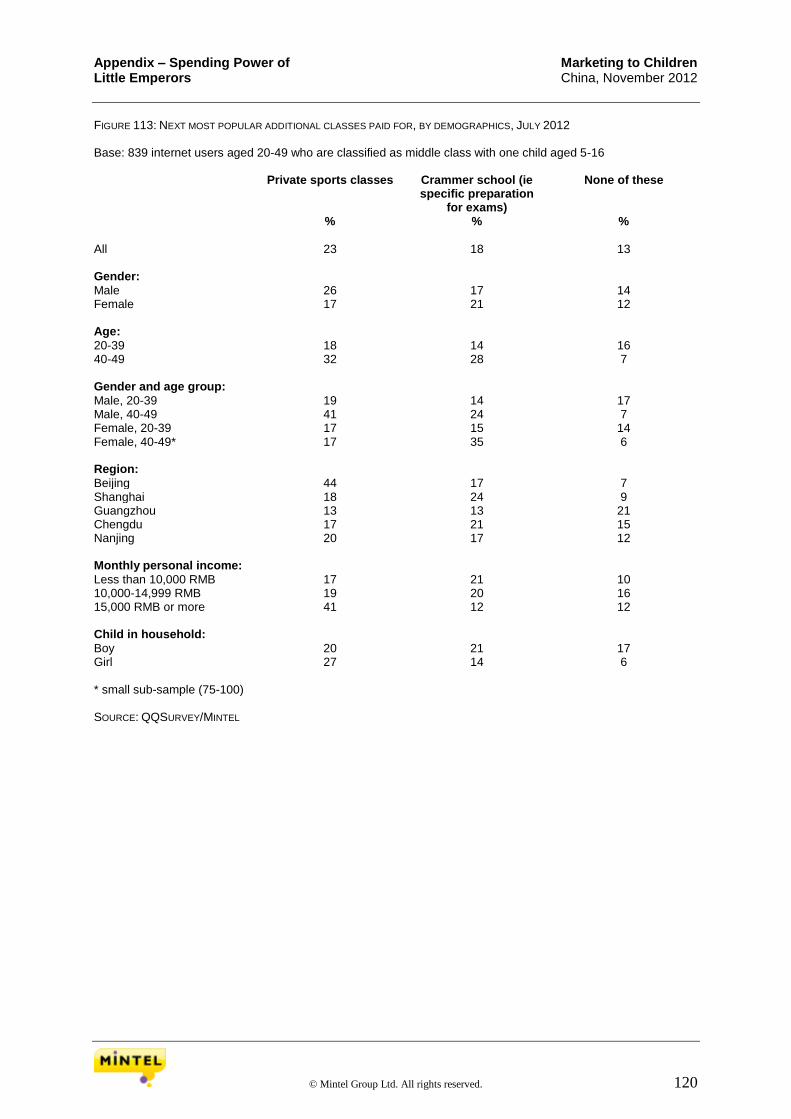
Appendix – Spending Power of Marketing to Children Little Emperors China, November 2012
© Mintel Group Ltd. All rights reserved. 120
FIGURE 113: NEXT MOST POPULAR ADDITIONAL CLASSES PAID FOR, BY DEMOGRAPHICS, JULY 2012 Base: 839 internet users aged 20-49 who are classified as middle class with one child aged 5-16 Private sports classes Crammer school (ie
specific preparation for exams)
None of these
% % %
All 23 18 13 Gender: Male 26 17 14 Female 17 21 12 Age: 20-39 18 14 16 40-49 32 28 7 Gender and age group: Male, 20-39 19 14 17 Male, 40-49 41 24 7 Female, 20-39 17 15 14 Female, 40-49* 17 35 6 Region: Beijing 44 17 7 Shanghai 18 24 9 Guangzhou 13 13 21 Chengdu 17 21 15 Nanjing 20 17 12 Monthly personal income: Less than 10,000 RMB 17 21 10 10,000-14,999 RMB 19 20 16 15,000 RMB or more 41 12 12 Child in household: Boy 20 21 17 Girl 27 14 6 * small sub-sample (75-100) SOURCE: QQSURVEY/MINTEL
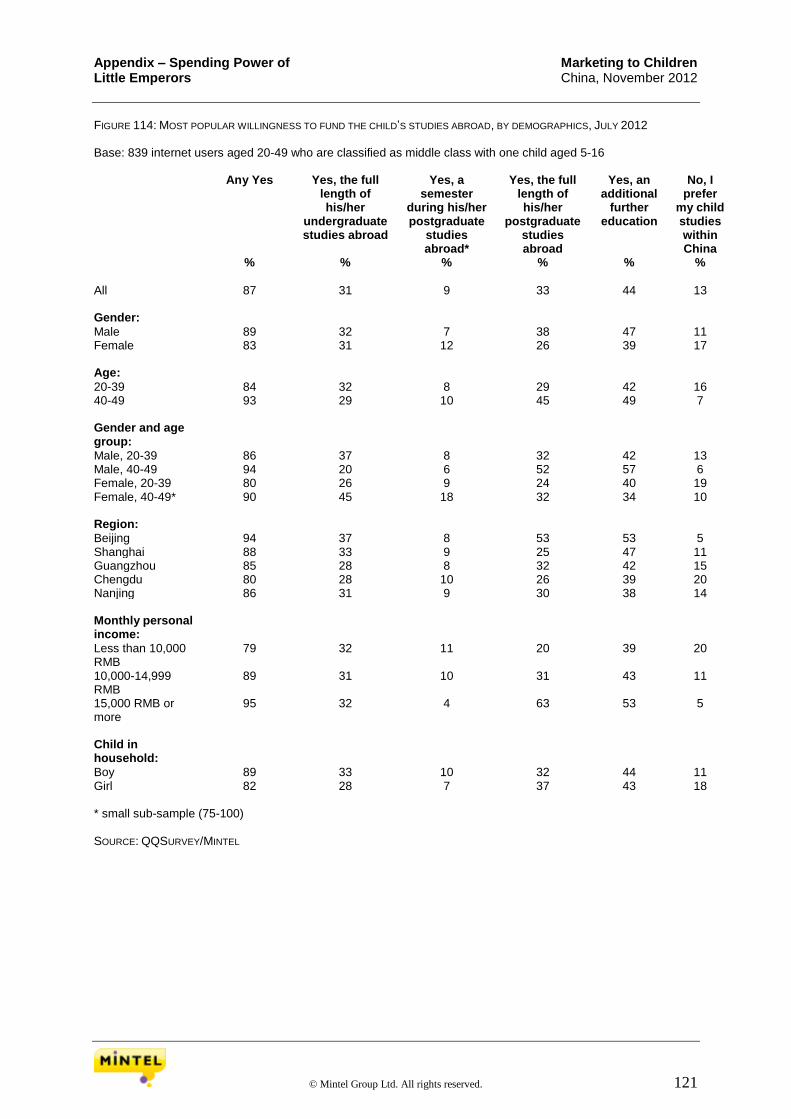
Appendix – Spending Power of Marketing to Children Little Emperors China, November 2012
© Mintel Group Ltd. All rights reserved. 121
FIGURE 114: MOST POPULAR WILLINGNESS TO FUND THE CHILD’S STUDIES ABROAD, BY DEMOGRAPHICS, JULY 2012 Base: 839 internet users aged 20-49 who are classified as middle class with one child aged 5-16 Any Yes Yes, the full
length of his/her
undergraduate studies abroad
Yes, a semester
during his/her postgraduate
studies abroad*
Yes, the full length of his/her
postgraduate studies abroad
Yes, an additional
further education
No, I prefer
my child studies within China
% % % % % %
All 87 31 9 33 44 13 Gender: Male 89 32 7 38 47 11 Female 83 31 12 26 39 17 Age: 20-39 84 32 8 29 42 16 40-49 93 29 10 45 49 7 Gender and age group:
Male, 20-39 86 37 8 32 42 13 Male, 40-49 94 20 6 52 57 6 Female, 20-39 80 26 9 24 40 19 Female, 40-49* 90 45 18 32 34 10 Region: Beijing 94 37 8 53 53 5 Shanghai 88 33 9 25 47 11 Guangzhou 85 28 8 32 42 15 Chengdu 80 28 10 26 39 20 Nanjing 86 31 9 30 38 14 Monthly personal income:
Less than 10,000 RMB
79 32 11 20 39 20
10,000-14,999 RMB
89 31 10 31 43 11
15,000 RMB or more
95 32 4 63 53 5
Child in household:
Boy 89 33 10 32 44 11 Girl 82 28 7 37 43 18 * small sub-sample (75-100) SOURCE: QQSURVEY/MINTEL

Appendix – Spending Power of Marketing to Children Little Emperors China, November 2012
© Mintel Group Ltd. All rights reserved. 122
FIGURE 115: MOST POPULAR FINANCIAL IMPACT OF CHILD’S EDUCATION, BY DEMOGRAPHICS, JULY 2012 Base: 839 internet users aged 20-49 who are classified as middle class with one child aged 5-16 I started
saving money for my
child’s education
early in order to afford a
good college/ university
I want my child to
compete with the best
academically, for this I am
willing to pay a significant amount of
money
It’s worth paying a lot
for education fees because my child will get a higher-
paid job afterwards
My child is likely to receive
financial support from
my whole family ie parents,
grandparents to pursue a
good education
I would surrender my
last resources to
allow my child higher education
% % % % %
All 58 56 41 28 26 Gender: Male 52 61 42 28 26 Female 67 47 38 27 26 Age: 20-39 63 56 40 30 28 40-49 47 55 42 23 22 Gender and age group: Male, 20-39 59 60 39 32 31 Male, 40-49 38 64 49 19 16 Female, 20-39 69 50 41 26 24 Female, 40-49* 63 40 29 30 31 Region: Beijing 46 66 54 21 25 Shanghai 62 58 38 30 20 Guangzhou 60 47 40 27 18 Chengdu 63 51 33 28 37 Nanjing 60 58 38 34 29 Monthly personal income: Less than 10,000 RMB 66 49 37 26 28 10,000-14,999 RMB 64 57 37 31 28 15,000 RMB or more 31 66 54 24 20 Child in household: Boy 61 53 37 32 25 Girl 53 61 47 21 28 * small sub-sample (75-100) SOURCE: QQSURVEY/MINTEL
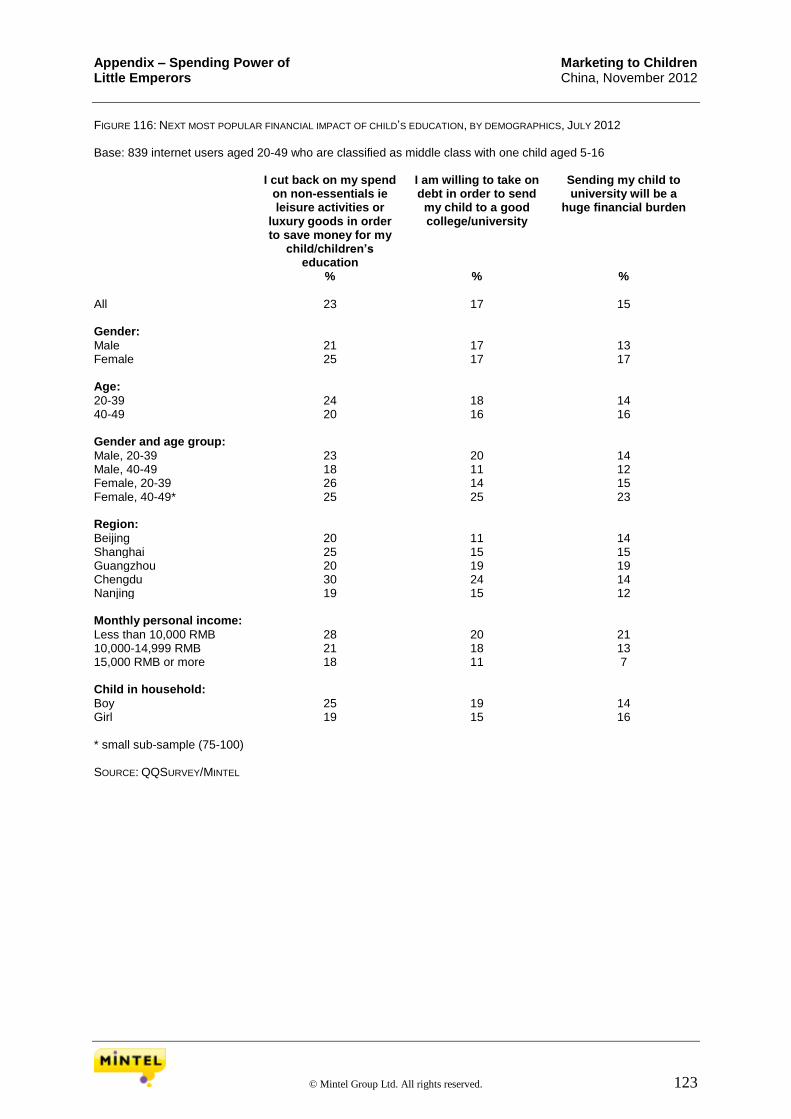
Appendix – Spending Power of Marketing to Children Little Emperors China, November 2012
© Mintel Group Ltd. All rights reserved. 123
FIGURE 116: NEXT MOST POPULAR FINANCIAL IMPACT OF CHILD’S EDUCATION, BY DEMOGRAPHICS, JULY 2012 Base: 839 internet users aged 20-49 who are classified as middle class with one child aged 5-16 I cut back on my spend
on non-essentials ie leisure activities or
luxury goods in order to save money for my
child/children’s education
I am willing to take on debt in order to send
my child to a good college/university
Sending my child to university will be a
huge financial burden
% % %
All 23 17 15 Gender: Male 21 17 13 Female 25 17 17 Age: 20-39 24 18 14 40-49 20 16 16 Gender and age group: Male, 20-39 23 20 14 Male, 40-49 18 11 12 Female, 20-39 26 14 15 Female, 40-49* 25 25 23 Region: Beijing 20 11 14 Shanghai 25 15 15 Guangzhou 20 19 19 Chengdu 30 24 14 Nanjing 19 15 12 Monthly personal income: Less than 10,000 RMB 28 20 21 10,000-14,999 RMB 21 18 13 15,000 RMB or more 18 11 7 Child in household: Boy 25 19 14 Girl 19 15 16 * small sub-sample (75-100) SOURCE: QQSURVEY/MINTEL
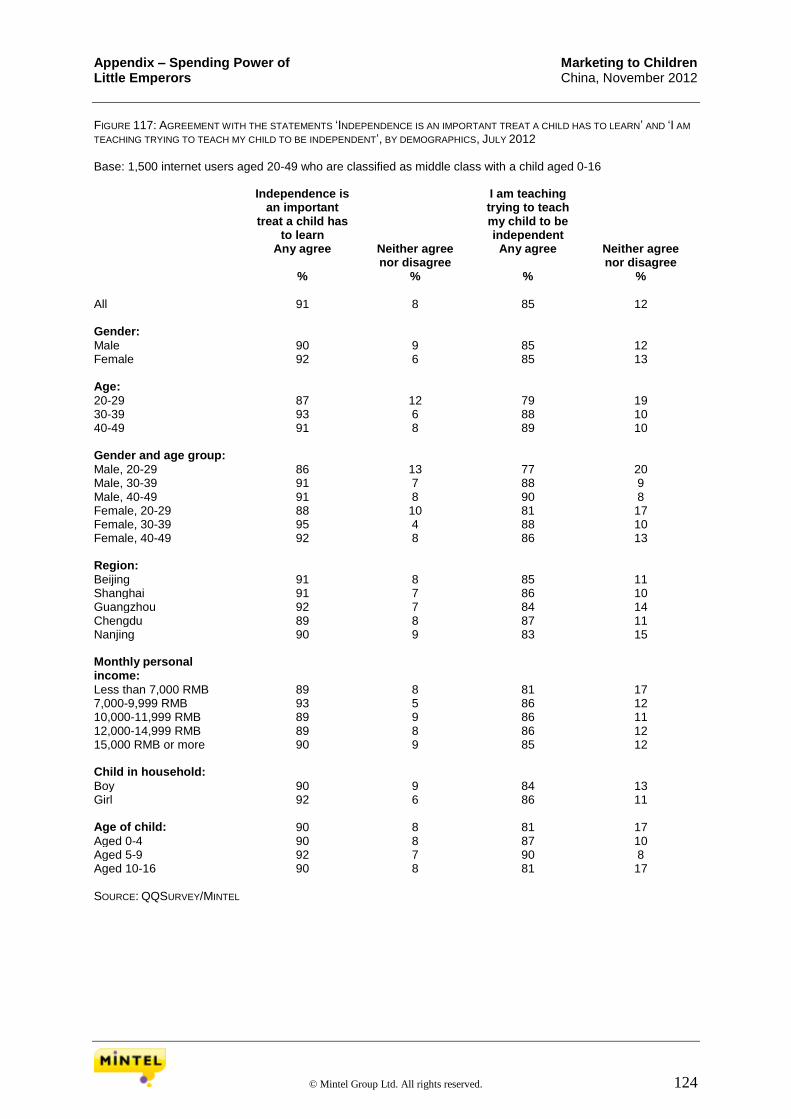
Appendix – Spending Power of Marketing to Children Little Emperors China, November 2012
© Mintel Group Ltd. All rights reserved. 124
FIGURE 117: AGREEMENT WITH THE STATEMENTS ‘INDEPENDENCE IS AN IMPORTANT TREAT A CHILD HAS TO LEARN’ AND ‘I AM
TEACHING TRYING TO TEACH MY CHILD TO BE INDEPENDENT’, BY DEMOGRAPHICS, JULY 2012 Base: 1,500 internet users aged 20-49 who are classified as middle class with a child aged 0-16 Independence is
an important treat a child has
to learn
I am teaching trying to teach my child to be independent
Any agree Neither agree nor disagree
Any agree Neither agree nor disagree
% % % %
All 91 8 85 12 Gender: Male 90 9 85 12 Female 92 6 85 13 Age: 20-29 87 12 79 19 30-39 93 6 88 10 40-49 91 8 89 10 Gender and age group: Male, 20-29 86 13 77 20 Male, 30-39 91 7 88 9 Male, 40-49 91 8 90 8 Female, 20-29 88 10 81 17 Female, 30-39 95 4 88 10 Female, 40-49 92 8 86 13 Region: Beijing 91 8 85 11 Shanghai 91 7 86 10 Guangzhou 92 7 84 14 Chengdu 89 8 87 11 Nanjing 90 9 83 15 Monthly personal income:
Less than 7,000 RMB 89 8 81 17 7,000-9,999 RMB 93 5 86 12 10,000-11,999 RMB 89 9 86 11 12,000-14,999 RMB 89 8 86 12 15,000 RMB or more 90 9 85 12 Child in household: Boy 90 9 84 13 Girl 92 6 86 11 Age of child: 90 8 81 17 Aged 0-4 90 8 87 10 Aged 5-9 92 7 90 8 Aged 10-16 90 8 81 17 SOURCE: QQSURVEY/MINTEL

Appendix – Spending Power of Marketing to Children Little Emperors China, November 2012
© Mintel Group Ltd. All rights reserved. 125
FIGURE 118: AGREEMENT WITH THE STATEMENTS ‘I WOULD LIKE TO OFFER MY CHILD A CAREFREE CHILDHOOD FREE FROM
PRESSURE’ AND ‘I DON’T WANT MY CHILD TO FEEL PRESSURED ALL THE TIME’, BY DEMOGRAPHICS, JULY 2012 Base: 1,500 internet users aged 20-49 who are classified as middle class with a child aged 0-16 I would like
to offer my child a
carefree childhood free from pressure
I don’t want my child to
feel pressured all
the time
Any agree Neither agree nor disagree
Any agree Neither agree nor disagree
Any disagree
% % % % %
All 83 12 77 15 7 Gender: Male 82 13 74 16 10 Female 86 11 82 15 4 Age: 20-29 88 9 81 14 4 30-39 84 14 79 16 5 40-49 74 11 67 15 19 Gender and age group: Male, 20-29 88 9 80 15 5 Male, 30-39 84 15 77 17 6 Male, 40-49 67 10 58 13 28 Female, 20-29 88 9 83 14 4 Female, 30-39 85 12 82 15 4 Female, 40-49 84 12 79 17 4 Region: Beijing 78 9 67 15 18 Shanghai 86 12 85 13 2 Guangzhou 86 10 79 14 6 Chengdu 84 13 81 14 5 Nanjing 82 15 76 20 4 Monthly personal income:
Less than 7,000 RMB 86 12 84 11 4 7,000-9,999 RMB 86 11 78 16 6 10,000-11,999 RMB 84 13 82 15 3 12,000-14,999 RMB 83 14 77 18 4 15,000 RMB or more 76 11 68 14 18 Child in household: Boy 85 12 79 16 5 Girl 81 12 75 14 11 Age of child: Aged 0-4 89 9 83 14 3 Aged 5-9 85 12 79 16 5 Aged 10-16 73 16 66 18 16 SOURCE: QQSURVEY/MINTEL
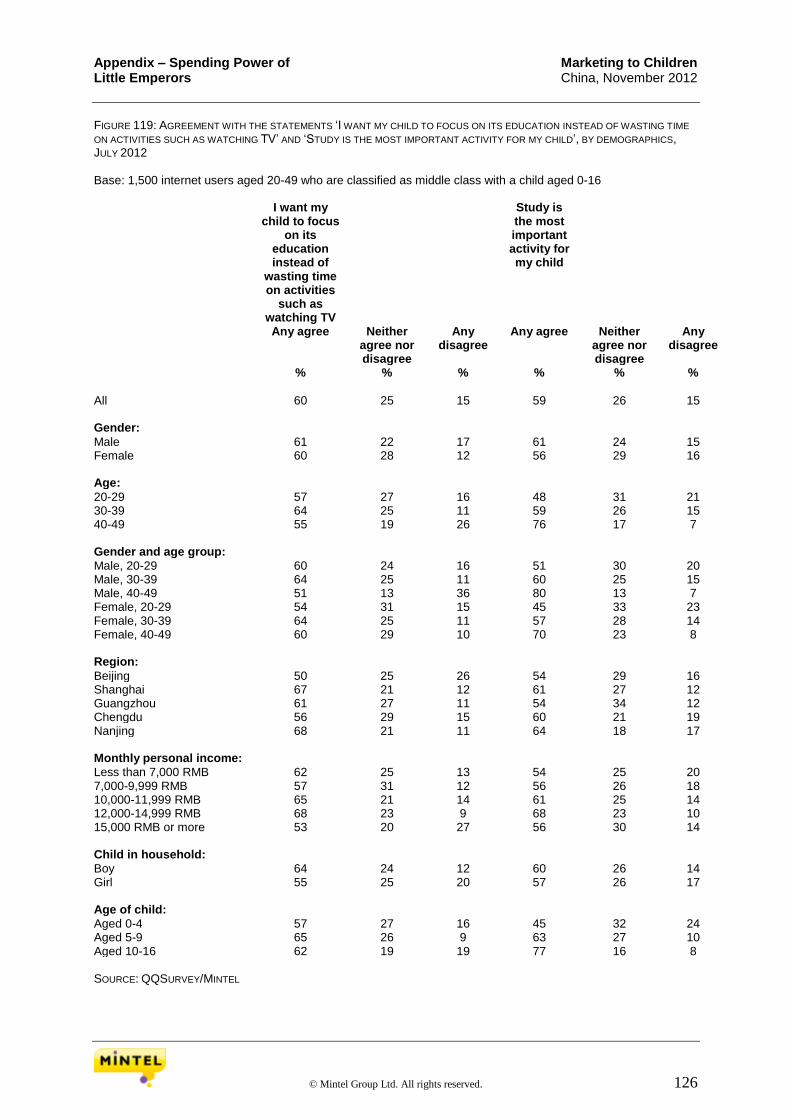
Appendix – Spending Power of Marketing to Children Little Emperors China, November 2012
© Mintel Group Ltd. All rights reserved. 126
FIGURE 119: AGREEMENT WITH THE STATEMENTS ‘I WANT MY CHILD TO FOCUS ON ITS EDUCATION INSTEAD OF WASTING TIME
ON ACTIVITIES SUCH AS WATCHING TV’ AND ‘STUDY IS THE MOST IMPORTANT ACTIVITY FOR MY CHILD’, BY DEMOGRAPHICS, JULY 2012 Base: 1,500 internet users aged 20-49 who are classified as middle class with a child aged 0-16 I want my
child to focus on its
education instead of
wasting time on activities
such as watching TV
Study is the most important activity for my child
Any agree Neither agree nor disagree
Any disagree
Any agree Neither agree nor disagree
Any disagree
% % % % % %
All 60 25 15 59 26 15 Gender: Male 61 22 17 61 24 15 Female 60 28 12 56 29 16 Age: 20-29 57 27 16 48 31 21 30-39 64 25 11 59 26 15 40-49 55 19 26 76 17 7 Gender and age group: Male, 20-29 60 24 16 51 30 20 Male, 30-39 64 25 11 60 25 15 Male, 40-49 51 13 36 80 13 7 Female, 20-29 54 31 15 45 33 23 Female, 30-39 64 25 11 57 28 14 Female, 40-49 60 29 10 70 23 8 Region: Beijing 50 25 26 54 29 16 Shanghai 67 21 12 61 27 12 Guangzhou 61 27 11 54 34 12 Chengdu 56 29 15 60 21 19 Nanjing 68 21 11 64 18 17 Monthly personal income: Less than 7,000 RMB 62 25 13 54 25 20 7,000-9,999 RMB 57 31 12 56 26 18 10,000-11,999 RMB 65 21 14 61 25 14 12,000-14,999 RMB 68 23 9 68 23 10 15,000 RMB or more 53 20 27 56 30 14 Child in household: Boy 64 24 12 60 26 14 Girl 55 25 20 57 26 17 Age of child: Aged 0-4 57 27 16 45 32 24 Aged 5-9 65 26 9 63 27 10 Aged 10-16 62 19 19 77 16 8 SOURCE: QQSURVEY/MINTEL

Appendix – Spending Power of Marketing to Children Little Emperors China, November 2012
© Mintel Group Ltd. All rights reserved. 127
FIGURE 120: AGREEMENT WITH THE STATEMENTS ‘IF I WANT TO BUY SOMETHING FOR MYSELF, I FIRST CHECK IF I CANNOT
BETTER SPEND THAT MONEY ON MY CHILD’ AND ‘I AM CONCERNED ABOUT MY CHILD’S ABILITY TO LIVE INDEPENDENTLY AFTER IT
LEAVES HOME’, BY DEMOGRAPHICS, JULY 2012 Base: 1,500 internet users aged 20-49 who are classified as middle class with a child aged 0-16 If I want to
buy something for myself, I first
check if I cannot better
spend that money on my
child
I am concerned about my
child’s ability to live
independently after it leaves
home
Any agree Neither agree nor disagree
Any disagree
Any agree Neither agree nor disagree
Any disagree
% % % % % %
All 43 28 28 43 29 28 Gender: Male 41 29 29 42 27 31 Female 46 27 27 43 32 25 Age: 20-29 43 28 29 43 32 25 30-39 45 30 25 43 29 28 40-49 40 24 36 42 24 34 Gender and age group: Male, 20-29 46 27 27 47 28 26 Male, 30-39 43 32 25 42 29 30 Male, 40-49 32 23 45 38 22 40 Female, 20-29 39 30 31 39 38 24 Female, 30-39 48 26 26 44 29 27 Female, 40-49 53 25 22 47 28 25 Region: Beijing 37 21 42 39 26 35 Shanghai 43 31 26 46 27 27 Guangzhou 44 34 22 47 30 23 Chengdu 47 29 24 44 28 28 Nanjing 45 26 29 36 34 29 Monthly personal income: Less than 7,000 RMB 43 34 23 37 39 24 7,000-9,999 RMB 43 28 28 45 28 27 10,000-11,999 RMB 46 31 23 47 26 27 12,000-14,999 RMB 51 28 20 43 29 28 15,000 RMB or more 33 22 44 36 28 35 Child in household: Boy 46 30 24 43 30 26 Girl 40 25 35 41 27 32 Age of child: Aged 0-4 43 30 28 42 33 25 Aged 5-9 44 29 27 42 29 29 Aged 10-16 44 26 31 44 23 33 SOURCE: QQSURVEY/MINTEL

Appendix – Spending Power of Marketing to Children Little Emperors China, November 2012
© Mintel Group Ltd. All rights reserved. 128
FIGURE 121: AGREEMENT WITH THE STATEMENTS ‘MY CHILD HAS A SIGNIFICANT INFLUENCE ON HOUSEHOLD DECISIONS IE
WHAT FOOD IS BOUGHT, WHERE TO GO ON HOLIDAY ETC’ AND ‘I NEED TO PURCHASE A PROPERTY FOR MY CHILD BEFORE
HE/SHE GETS MARRIED’, BY DEMOGRAPHICS, JULY 2012 Base: 1,500 internet users aged 20-49 who are classified as middle class with a child aged 0-16 My child has a
significant influence on household
decisions ie what food is
bought, where to go on
holiday etc
I need to purchase a
property for my child
before he/she gets
married
Any agree Neither agree nor disagree
Any disagree
Any agree Neither agree nor disagree
Any disagree
% % % % % %
All 41 38 21 37 35 28 Gender: Male 42 35 23 36 33 30 Female 40 41 19 37 37 26 Age: 20-29 38 37 25 45 35 20 30-39 39 38 22 34 37 29 40-49 52 36 13 30 29 41 Gender and age group: Male, 20-29 42 32 26 47 34 19 Male, 30-39 37 38 25 34 36 30 Male, 40-49 55 33 12 25 25 50 Female, 20-29 33 44 24 43 36 21 Female, 30-39 42 39 18 33 39 28 Female, 40-49 46 41 13 37 36 27 Region: Beijing 45 35 21 31 26 42 Shanghai 40 39 22 42 36 22 Guangzhou 35 44 21 40 36 24 Chengdu 42 36 22 32 38 30 Nanjing 44 35 21 37 39 23 Monthly personal income: Less than 7,000 RMB 33 50 17 26 52 22 7,000-9,999 RMB 35 40 25 38 34 28 10,000-11,999 RMB 44 37 19 34 37 29 12,000-14,999 RMB 45 30 24 40 34 26 15,000 RMB or more 48 34 18 41 26 33 Child in household: Boy 42 38 19 42 34 24 Girl 39 36 25 28 36 36 Age of child: Aged 0-4 36 37 27 37 37 25 Aged 5-9 36 43 22 34 37 29 Aged 10-16 55 33 12 38 29 33 SOURCE: QQSURVEY/MINTEL

Appendix – Spending Power of Marketing to Children Little Emperors China, November 2012
© Mintel Group Ltd. All rights reserved. 129
FIGURE 122: AGREEMENT WITH THE STATEMENTS ‘I AM WORRIED ABOUT OUR FINANCIAL SITUATION IF I TRY TO FULFIL ALL MY
CHILD’S NEEDS’ AND ‘I CUT BACK ON HOUSEHOLD EXPENDITURES TO PAY FOR ITEMS MY CHILD WOULD LIKE TO HAVE’, BY
DEMOGRAPHICS, JULY 2012 Base: 1,500 internet users aged 20-49 who are classified as middle class with a child aged 0-16 I am worried
about our financial
situation if I try to fulfil all
my child’s needs
I cut back on household
expenditures to pay for
items my child would like to
have
Any agree Neither agree nor disagree
Any disagree
Any agree Neither agree nor disagree
Any disagree
% % % % % %
All 32 34 34 29 33 38 Gender: Male 32 30 37 29 32 39 Female 33 39 28 29 35 37 Age: 20-29 32 33 35 30 31 39 30-39 32 36 32 27 35 38 40-49 34 30 36 32 31 37 Gender and age group: Male, 20-29 35 28 37 33 30 36 Male, 30-39 32 34 34 28 33 39 Male, 40-49 30 23 47 25 29 46 Female, 20-29 29 40 32 26 32 43 Female, 30-39 33 38 30 26 37 38 Female, 40-49 41 42 18 42 34 24 Region: Beijing 25 30 45 26 25 49 Shanghai 35 35 30 27 32 41 Guangzhou 31 37 32 33 39 29 Chengdu 36 38 27 29 36 35 Nanjing 35 30 35 29 32 39 Monthly personal income: Less than 7,000 RMB 37 49 13 29 45 27 7,000-9,999 RMB 41 31 28 31 32 37 10,000-11,999 RMB 30 34 36 27 38 35 12,000-14,999 RMB 32 35 34 33 31 36 15,000 RMB or more 20 28 52 23 24 53 Child in household: Boy 33 34 33 33 34 34 Girl 32 34 34 23 32 45 Age of child: Aged 0-4 35 34 31 28 32 40 Aged 5-9 30 38 32 28 36 36 Aged 10-16 31 29 39 31 32 37 : SOURCE QQSURVEY/MINTEL
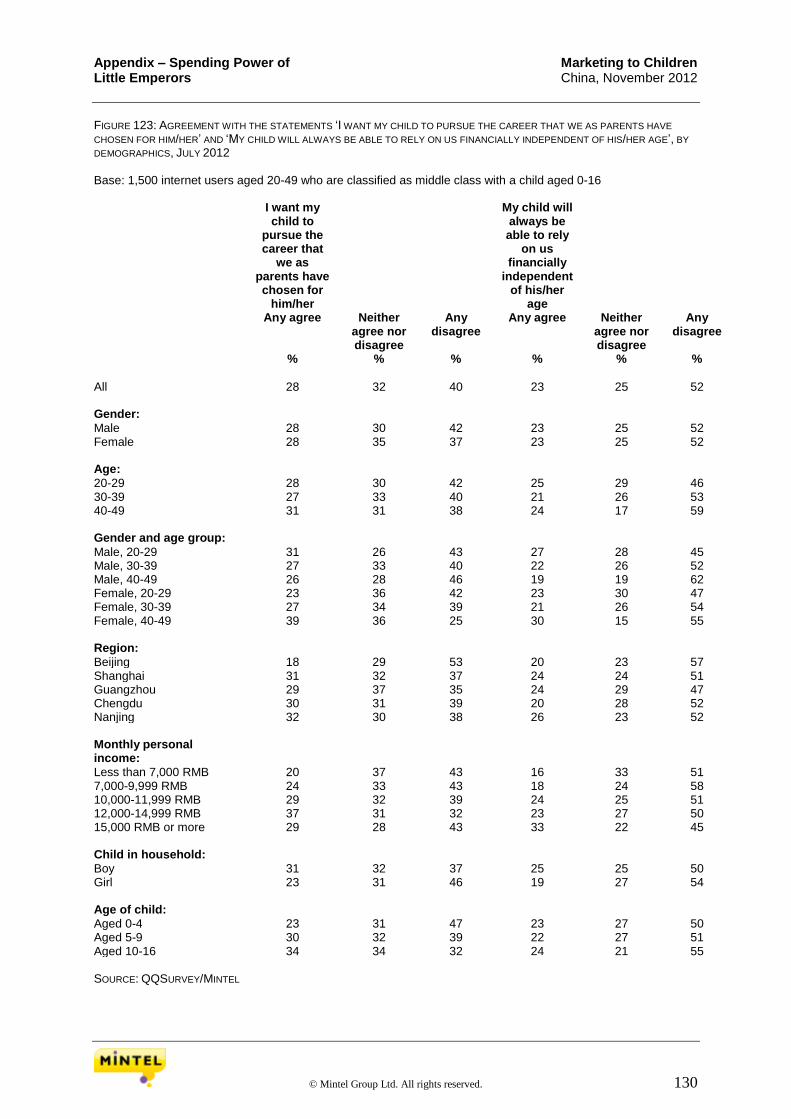
Appendix – Spending Power of Marketing to Children Little Emperors China, November 2012
© Mintel Group Ltd. All rights reserved. 130
FIGURE 123: AGREEMENT WITH THE STATEMENTS ‘I WANT MY CHILD TO PURSUE THE CAREER THAT WE AS PARENTS HAVE
CHOSEN FOR HIM/HER’ AND ‘MY CHILD WILL ALWAYS BE ABLE TO RELY ON US FINANCIALLY INDEPENDENT OF HIS/HER AGE’, BY
DEMOGRAPHICS, JULY 2012 Base: 1,500 internet users aged 20-49 who are classified as middle class with a child aged 0-16 I want my
child to pursue the career that
we as parents have chosen for
him/her
My child will always be able to rely
on us financially
independent of his/her
age
Any agree Neither agree nor disagree
Any disagree
Any agree Neither agree nor disagree
Any disagree
% % % % % %
All 28 32 40 23 25 52 Gender: Male 28 30 42 23 25 52 Female 28 35 37 23 25 52 Age: 20-29 28 30 42 25 29 46 30-39 27 33 40 21 26 53 40-49 31 31 38 24 17 59 Gender and age group: Male, 20-29 31 26 43 27 28 45 Male, 30-39 27 33 40 22 26 52 Male, 40-49 26 28 46 19 19 62 Female, 20-29 23 36 42 23 30 47 Female, 30-39 27 34 39 21 26 54 Female, 40-49 39 36 25 30 15 55 Region: Beijing 18 29 53 20 23 57 Shanghai 31 32 37 24 24 51 Guangzhou 29 37 35 24 29 47 Chengdu 30 31 39 20 28 52 Nanjing 32 30 38 26 23 52 Monthly personal income:
Less than 7,000 RMB 20 37 43 16 33 51 7,000-9,999 RMB 24 33 43 18 24 58 10,000-11,999 RMB 29 32 39 24 25 51 12,000-14,999 RMB 37 31 32 23 27 50 15,000 RMB or more 29 28 43 33 22 45 Child in household: Boy 31 32 37 25 25 50 Girl 23 31 46 19 27 54 Age of child: Aged 0-4 23 31 47 23 27 50 Aged 5-9 30 32 39 22 27 51 Aged 10-16 34 34 32 24 21 55 SOURCE: QQSURVEY/MINTEL

Appendix – Spending Power of Marketing to Children Little Emperors China, November 2012
© Mintel Group Ltd. All rights reserved. 131
FIGURE 124: AGREEMENT WITH THE STATEMENT ‘I AM LIKELY TO STRUGGLE FINANCIALLY ONCE MY CHILD GROWS OLDER’, BY
DEMOGRAPHICS, JULY 2012 Base: 1,500 internet users aged 20-49 who are classified as middle class with a child aged 0-16 I am likely to struggle
financially once my child grows older
Any agree Neither agree nor disagree
Any disagree
% % %
All 21 29 50 Gender: Male 20 28 52 Female 23 30 47 Age: 20-29 22 29 49 30-39 20 31 49 40-49 23 22 55 Gender and age group: Male, 20-29 20 30 50 Male, 30-39 19 31 50 Male, 40-49 21 16 63 Female, 20-29 24 28 49 Female, 30-39 21 31 48 Female, 40-49 26 31 42 Region: Beijing 16 25 59 Shanghai 24 29 47 Guangzhou 21 34 45 Chengdu 22 27 51 Nanjing 21 29 49 Monthly personal income: Less than 7,000 RMB 25 46 29 7,000-9,999 RMB 22 29 49 10,000-11,999 RMB 20 31 49 12,000-14,999 RMB 26 24 50 15,000 RMB or more 12 23 66 Child in household: Boy 23 29 48 Girl 18 29 53 Age of child: Aged 0-4 21 30 49 Aged 5-9 20 31 49 Aged 10-16 22 25 53 SOURCE: QQSURVEY/MINTEL
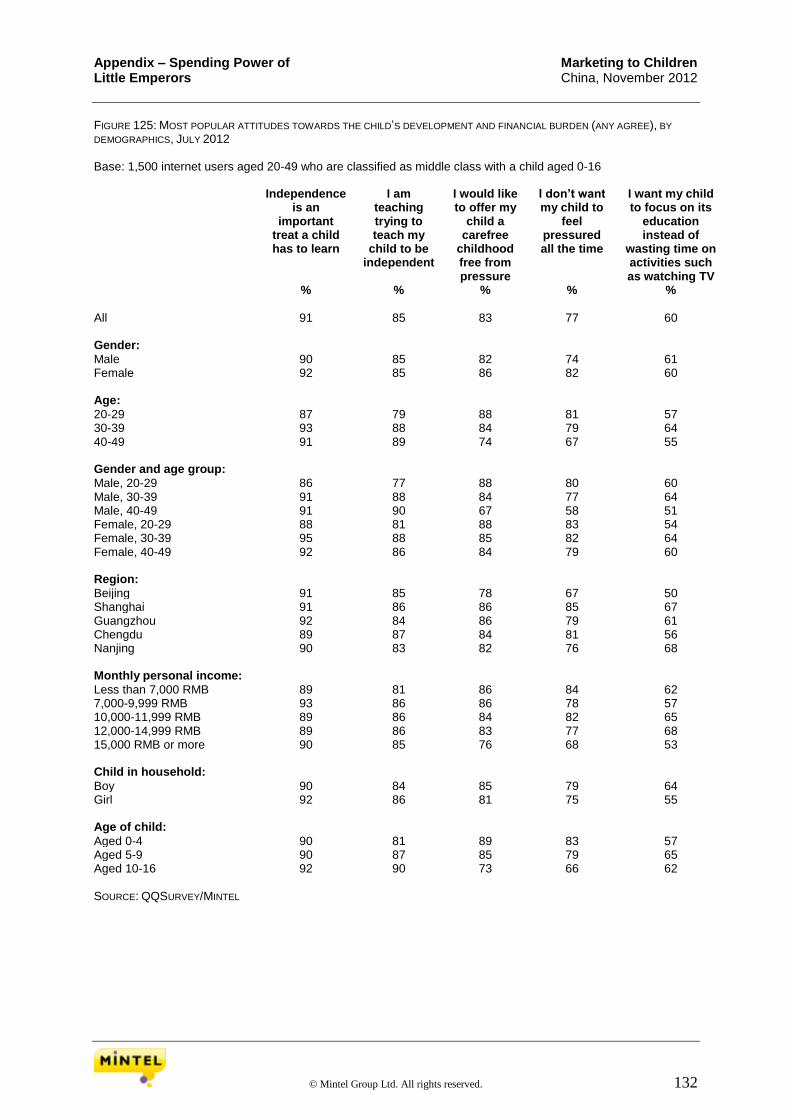
Appendix – Spending Power of Marketing to Children Little Emperors China, November 2012
© Mintel Group Ltd. All rights reserved. 132
FIGURE 125: MOST POPULAR ATTITUDES TOWARDS THE CHILD’S DEVELOPMENT AND FINANCIAL BURDEN (ANY AGREE), BY
DEMOGRAPHICS, JULY 2012 Base: 1,500 internet users aged 20-49 who are classified as middle class with a child aged 0-16 Independence
is an important
treat a child has to learn
I am teaching trying to teach my
child to be independent
I would like to offer my
child a carefree
childhood free from pressure
I don’t want my child to
feel pressured all the time
I want my child to focus on its
education instead of
wasting time on activities such as watching TV
% % % % %
All 91 85 83 77 60 Gender: Male 90 85 82 74 61 Female 92 85 86 82 60 Age: 20-29 87 79 88 81 57 30-39 93 88 84 79 64 40-49 91 89 74 67 55 Gender and age group: Male, 20-29 86 77 88 80 60 Male, 30-39 91 88 84 77 64 Male, 40-49 91 90 67 58 51 Female, 20-29 88 81 88 83 54 Female, 30-39 95 88 85 82 64 Female, 40-49 92 86 84 79 60 Region: Beijing 91 85 78 67 50 Shanghai 91 86 86 85 67 Guangzhou 92 84 86 79 61 Chengdu 89 87 84 81 56 Nanjing 90 83 82 76 68 Monthly personal income: Less than 7,000 RMB 89 81 86 84 62 7,000-9,999 RMB 93 86 86 78 57 10,000-11,999 RMB 89 86 84 82 65 12,000-14,999 RMB 89 86 83 77 68 15,000 RMB or more 90 85 76 68 53 Child in household: Boy 90 84 85 79 64 Girl 92 86 81 75 55 Age of child: Aged 0-4 90 81 89 83 57 Aged 5-9 90 87 85 79 65 Aged 10-16 92 90 73 66 62 SOURCE: QQSURVEY/MINTEL

Appendix – Spending Power of Marketing to Children Little Emperors China, November 2012
© Mintel Group Ltd. All rights reserved. 133
FIGURE 126: NEXT MOST POPULAR ATTITUDES TOWARDS THE CHILD’S DEVELOPMENT AND FINANCIAL BURDEN (ANY AGREE), BY DEMOGRAPHICS, JULY 2012 Base: 1,500 internet users aged 20-49 who are classified as middle class with a child aged 0-16 Study is
the most important activity for my child
If I want to buy something for myself, I first
check if I cannot better
spend that money on my
child
I am concerned about my
child’s ability to live
independently after it leaves
home
My child has a significant
influence on household
decisions ie what food is
bought, where to go on
holiday etc
I need to purchase a property for
my child before
he/she gets married
% % % % %
All 59 43 43 41 37 Gender: Male 61 41 42 42 36 Female 56 46 43 40 37 Age: 20-29 48 43 43 38 45 30-39 59 45 43 39 34 40-49 76 40 42 52 30 Gender and age group: Male, 20-29 51 46 47 42 47 Male, 30-39 60 43 42 37 34 Male, 40-49 80 32 38 55 25 Female, 20-29 45 39 39 33 43 Female, 30-39 57 48 44 42 33 Female, 40-49 70 53 47 46 37 Region: Beijing 54 37 39 45 31 Shanghai 61 43 46 40 42 Guangzhou 54 44 47 35 40 Chengdu 60 47 44 42 32 Nanjing 64 45 36 44 37 Monthly personal income: Less than 7,000 RMB 54 43 37 33 26 7,000-9,999 RMB 56 43 45 35 38 10,000-11,999 RMB 61 46 47 44 34 12,000-14,999 RMB 68 51 43 45 40 15,000 RMB or more 56 33 36 48 41 Child in household: Boy 60 46 43 42 42 Girl 57 40 41 39 28 Age of child: Aged 0-4 45 43 42 36 37 Aged 5-9 63 44 42 36 34 Aged 10-16 77 44 44 55 38 SOURCE: QQSURVEY/MINTEL
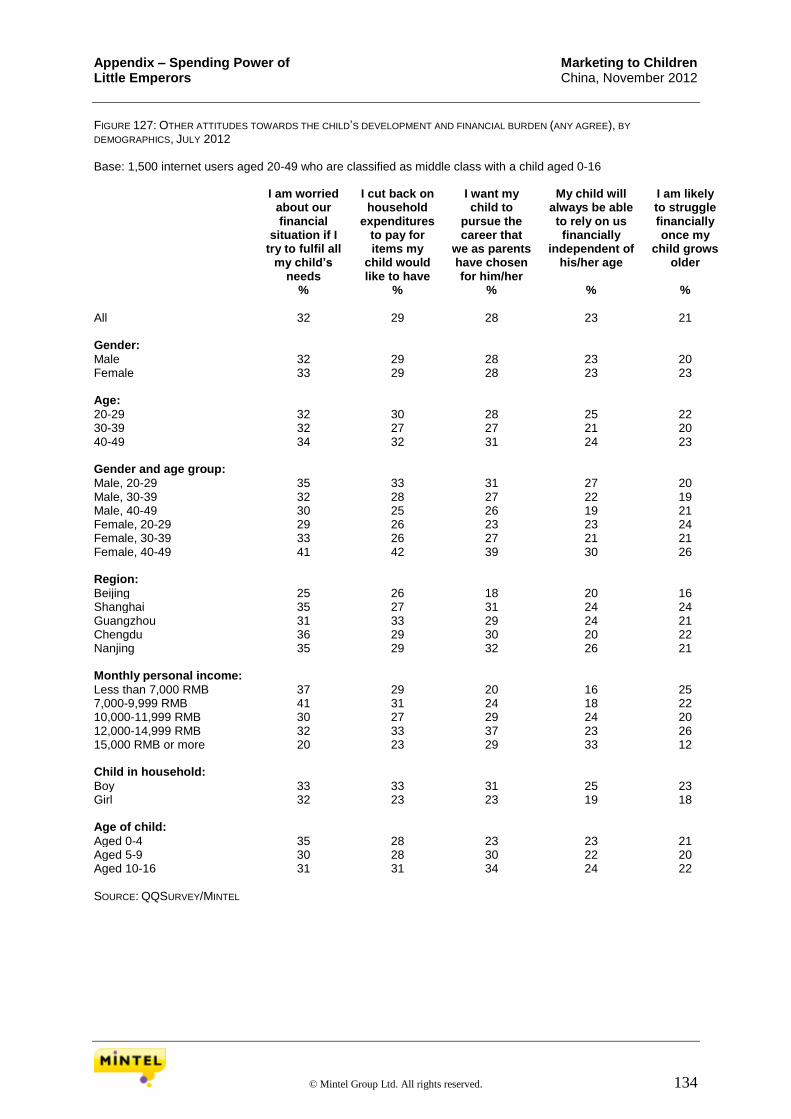
Appendix – Spending Power of Marketing to Children Little Emperors China, November 2012
© Mintel Group Ltd. All rights reserved. 134
FIGURE 127: OTHER ATTITUDES TOWARDS THE CHILD’S DEVELOPMENT AND FINANCIAL BURDEN (ANY AGREE), BY
DEMOGRAPHICS, JULY 2012 Base: 1,500 internet users aged 20-49 who are classified as middle class with a child aged 0-16 I am worried
about our financial
situation if I try to fulfil all
my child’s needs
I cut back on household
expenditures to pay for items my
child would like to have
I want my child to
pursue the career that
we as parents have chosen for him/her
My child will always be able to rely on us financially
independent of his/her age
I am likely to struggle financially once my
child grows older
% % % % %
All 32 29 28 23 21 Gender: Male 32 29 28 23 20 Female 33 29 28 23 23 Age: 20-29 32 30 28 25 22 30-39 32 27 27 21 20 40-49 34 32 31 24 23 Gender and age group: Male, 20-29 35 33 31 27 20 Male, 30-39 32 28 27 22 19 Male, 40-49 30 25 26 19 21 Female, 20-29 29 26 23 23 24 Female, 30-39 33 26 27 21 21 Female, 40-49 41 42 39 30 26 Region: Beijing 25 26 18 20 16 Shanghai 35 27 31 24 24 Guangzhou 31 33 29 24 21 Chengdu 36 29 30 20 22 Nanjing 35 29 32 26 21 Monthly personal income: Less than 7,000 RMB 37 29 20 16 25 7,000-9,999 RMB 41 31 24 18 22 10,000-11,999 RMB 30 27 29 24 20 12,000-14,999 RMB 32 33 37 23 26 15,000 RMB or more 20 23 29 33 12 Child in household: Boy 33 33 31 25 23 Girl 32 23 23 19 18 Age of child: Aged 0-4 35 28 23 23 21 Aged 5-9 30 28 30 22 20 Aged 10-16 31 31 34 24 22 SOURCE: QQSURVEY/MINTEL
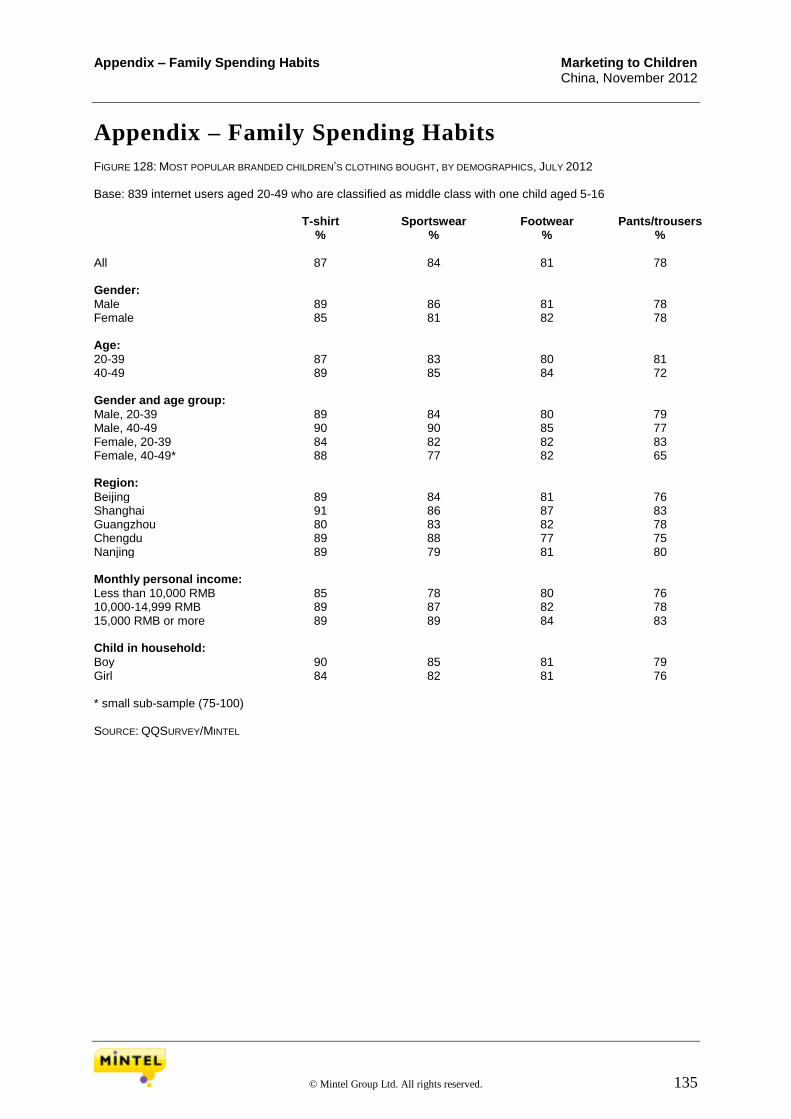
Appendix – Family Spending Habits Marketing to Children China, November 2012
© Mintel Group Ltd. All rights reserved. 135
Appendix – Family Spending Habits FIGURE 128: MOST POPULAR BRANDED CHILDREN’S CLOTHING BOUGHT, BY DEMOGRAPHICS, JULY 2012 Base: 839 internet users aged 20-49 who are classified as middle class with one child aged 5-16 T-shirt Sportswear Footwear Pants/trousers % % % %
All 87 84 81 78 Gender: Male 89 86 81 78 Female 85 81 82 78 Age: 20-39 87 83 80 81 40-49 89 85 84 72 Gender and age group: Male, 20-39 89 84 80 79 Male, 40-49 90 90 85 77 Female, 20-39 84 82 82 83 Female, 40-49* 88 77 82 65 Region: Beijing 89 84 81 76 Shanghai 91 86 87 83 Guangzhou 80 83 82 78 Chengdu 89 88 77 75 Nanjing 89 79 81 80 Monthly personal income: Less than 10,000 RMB 85 78 80 76 10,000-14,999 RMB 89 87 82 78 15,000 RMB or more 89 89 84 83 Child in household: Boy 90 85 81 79 Girl 84 82 81 76 * small sub-sample (75-100) SOURCE: QQSURVEY/MINTEL

Appendix – Family Spending Habits Marketing to Children China, November 2012
© Mintel Group Ltd. All rights reserved. 136
FIGURE 129: NEXT MOST POPULAR BRANDED CHILDREN’S CLOTHING BOUGHT, BY DEMOGRAPHICS, JULY 2012 Base: 839 internet users aged 20-49 who are classified as middle class with one child aged 5-16 Jeans Button down or
Polo shirt Accessories (eg
belts, hats, scarfs etc)
Jumper
% % % %
All 70 58 57 52 Gender: Male 69 60 59 49 Female 71 56 54 56 Age: 20-39 66 56 56 49 40-49 78 65 61 60 Gender and age group: Male, 20-39 66 56 56 44 Male, 40-49 76 69 67 61 Female, 20-39 66 55 56 56 Female, 40-49* 82 58 49 57 Region: Beijing 71 56 58 58 Shanghai 75 63 60 54 Guangzhou 59 58 58 55 Chengdu 75 59 57 41 Nanjing 69 56 54 54 Monthly personal income: Less than 10,000 RMB 66 47 54 44 10,000-14,999 RMB 72 63 58 53 15,000 RMB or more 71 69 64 65 Child in household: Boy 68 59 55 51 Girl 73 57 61 53 * small sub-sample (75-100) SOURCE: QQSURVEY/MINTEL

Appendix – Family Spending Habits Marketing to Children China, November 2012
© Mintel Group Ltd. All rights reserved. 137
FIGURE 130: SPORTSWEAR BRANDS BOUGHT FOR CHILD, JULY 2012 Base: 837 internet users aged 20-49 who are classified as middle class with one child aged 5-16 who purchased branded sportswear products in the past 12 months All %
adidas 78 Nike 75 Li Ning 54 Anta 34 Puma 31 Converse 30 Kappa 25 Reebok 22 Peak 14 China Dongxiang 5 Other brand 1 SOURCE: QQSURVEY/MINTEL
FIGURE 131: MOST POPULAR SPORTSWEAR BRANDS BOUGHT FOR CHILD, BY DEMOGRAPHICS, JULY 2012 Base: 837 internet users aged 20-49 who are classified as middle class with one child aged 5-16 who purchased branded sportswear products in the past 12 months adidas Nike Li Ning Anta Puma Converse % % % % % %
All 78 75 54 34 31 30 Gender: Male 76 75 55 34 32 28 Female 83 73 51 34 28 33 Age: 20-39 76 72 52 35 27 27 40-49 85 81 58 31 40 37 Gender and age group: Male, 20-39 72 72 52 37 26 24 Male, 40-49 84 83 61 28 46 39 Female, 20-39 82 71 51 32 27 33 Female, 40-49* 85 77 52 38 30 32 Region: Beijing 82 84 61 25 47 43 Shanghai 82 79 51 38 30 26 Guangzhou 81 72 45 36 27 36 Chengdu 78 72 58 42 26 28 Nanjing 69 66 51 30 22 17 Monthly personal income: Less than 10,000 RMB 73 67 53 39 22 23 10,000-14,999 RMB 80 78 55 36 29 26 15,000 RMB or more 85 81 52 21 49 51

Appendix – Family Spending Habits Marketing to Children China, November 2012
© Mintel Group Ltd. All rights reserved. 138
Child in household: Boy 76 76 53 36 27 27 Girl 82 73 54 30 37 35 * small sub-sample (75-100) SOURCE: QQSURVEY/MINTEL
FIGURE 132: NEXT MOST POPULAR SPORTSWEAR BRANDS BOUGHT FOR CHILD, BY DEMOGRAPHICS, JULY 2012 Base: 837 internet users aged 20-49 who are classified as middle class with one child aged 5-16 who purchased branded sportswear products in the past 12 months Kappa Reebok Peak % % %
All 25 22 14 Gender: Male 23 23 14 Female 27 19 14 Age: 20-39 26 17 15 40-49 22 33 12 Gender and age group: Male, 20-39 25 18 16 Male, 40-49 19 35 11 Female, 20-39 27 15 14 Female, 40-49* 26 29 14 Region: Beijing 24 38 11 Shanghai 28 22 17 Guangzhou 18 16 18 Chengdu 28 17 12 Nanjing 25 15 15 Monthly personal income: Less than 10,000 RMB 29 16 13 10,000-14,999 RMB 25 18 17 15,000 RMB or more 16 39 12 Child in household: Boy 25 18 17 Girl 25 27 10 * small sub-sample (75-100) SOURCE: QQSURVEY/MINTEL
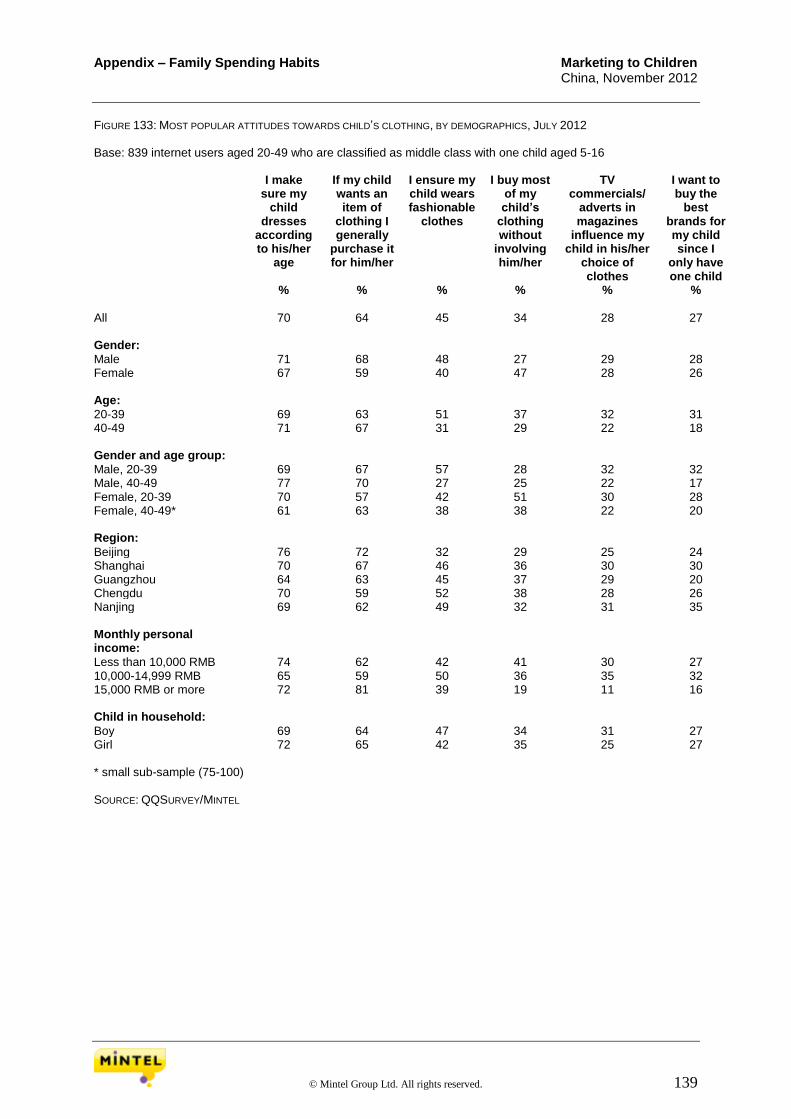
Appendix – Family Spending Habits Marketing to Children China, November 2012
© Mintel Group Ltd. All rights reserved. 139
FIGURE 133: MOST POPULAR ATTITUDES TOWARDS CHILD’S CLOTHING, BY DEMOGRAPHICS, JULY 2012 Base: 839 internet users aged 20-49 who are classified as middle class with one child aged 5-16 I make
sure my child
dresses according to his/her
age
If my child wants an item of
clothing I generally
purchase it for him/her
I ensure my child wears fashionable
clothes
I buy most of my child’s
clothing without
involving him/her
TV commercials/
adverts in magazines
influence my child in his/her
choice of clothes
I want to buy the
best brands for my child since I
only have one child
% % % % % %
All 70 64 45 34 28 27 Gender: Male 71 68 48 27 29 28 Female 67 59 40 47 28 26 Age: 20-39 69 63 51 37 32 31 40-49 71 67 31 29 22 18 Gender and age group: Male, 20-39 69 67 57 28 32 32 Male, 40-49 77 70 27 25 22 17 Female, 20-39 70 57 42 51 30 28 Female, 40-49* 61 63 38 38 22 20 Region: Beijing 76 72 32 29 25 24 Shanghai 70 67 46 36 30 30 Guangzhou 64 63 45 37 29 20 Chengdu 70 59 52 38 28 26 Nanjing 69 62 49 32 31 35 Monthly personal income:
Less than 10,000 RMB 74 62 42 41 30 27 10,000-14,999 RMB 65 59 50 36 35 32 15,000 RMB or more 72 81 39 19 11 16 Child in household: Boy 69 64 47 34 31 27 Girl 72 65 42 35 25 27 * small sub-sample (75-100) SOURCE: QQSURVEY/MINTEL

Appendix – Family Spending Habits Marketing to Children China, November 2012
© Mintel Group Ltd. All rights reserved. 140
FIGURE 134: NEXT MOST POPULAR ATTITUDES TOWARDS CHILD’S CLOTHING, BY DEMOGRAPHICS, JULY 2012 Base: 839 internet users aged 20-49 who are classified as middle class with one child aged 5-16 My child decides what
clothes to buy My child decides which brand of
clothing we buy for him/her
My child selects the clothes he/she wants
to wear every day
% % %
All 26 21 18 Gender: Male 32 25 17 Female 15 14 19 Age: 20-39 21 16 19 40-49 38 31 14 Gender and age group: Male, 20-39 27 18 19 Male, 40-49 45 40 12 Female, 20-39 12 12 19 Female, 40-49* 25 17 17 Region: Beijing 44 36 14 Shanghai 28 24 24 Guangzhou 14 12 17 Chengdu 21 12 14 Nanjing 22 20 21 Monthly personal income: Less than 10,000 RMB 18 16 20 10,000-14,999 RMB 23 16 18 15,000 RMB or more 46 39 14 Child in household: Boy 23 17 16 Girl 32 27 21 * small sub-sample (75-100) SOURCE: QQSURVEY/MINTEL

Appendix – Family Spending Habits Marketing to Children China, November 2012
© Mintel Group Ltd. All rights reserved. 141
FIGURE 135: MOST POPULAR PRODUCTS IN CHILD’S POSSESSION, BY DEMOGRAPHICS, JULY 2012 Base: 839 internet users aged 20-49 who are classified as middle class with one child aged 5-16 Books,
Magazines, Comics
Lego Desktop PC
Tablet computer (eg iPad)
TV Laptop
% % % % % %
All 87 63 50 47 45 44 Gender: Male 87 64 53 50 44 46 Female 87 61 45 42 46 41 Age: 20-39 85 65 45 43 46 40 40-49 89 57 63 55 42 55 Gender and age group: Male, 20-39 85 65 46 43 47 41 Male, 40-49 90 60 69 65 38 59 Female, 20-39 86 65 42 43 44 38 Female, 40-49* 88 52 52 39 49 47 Region: Beijing 83 68 55 61 35 52 Shanghai 87 68 54 54 69 50 Guangzhou 84 66 42 43 34 45 Chengdu 89 55 52 34 48 35 Nanjing 90 58 48 42 41 41 Monthly personal income: Less than 10,000 RMB 91 57 42 33 40 37 10,000-14,999 RMB 84 63 52 49 52 40 15,000 RMB or more 84 73 62 66 38 66 Child in household: Boy 84 62 50 43 47 43 Girl 91 63 51 52 40 46 * small sub-sample (75-100) SOURCE: QQSURVEY/MINTEL
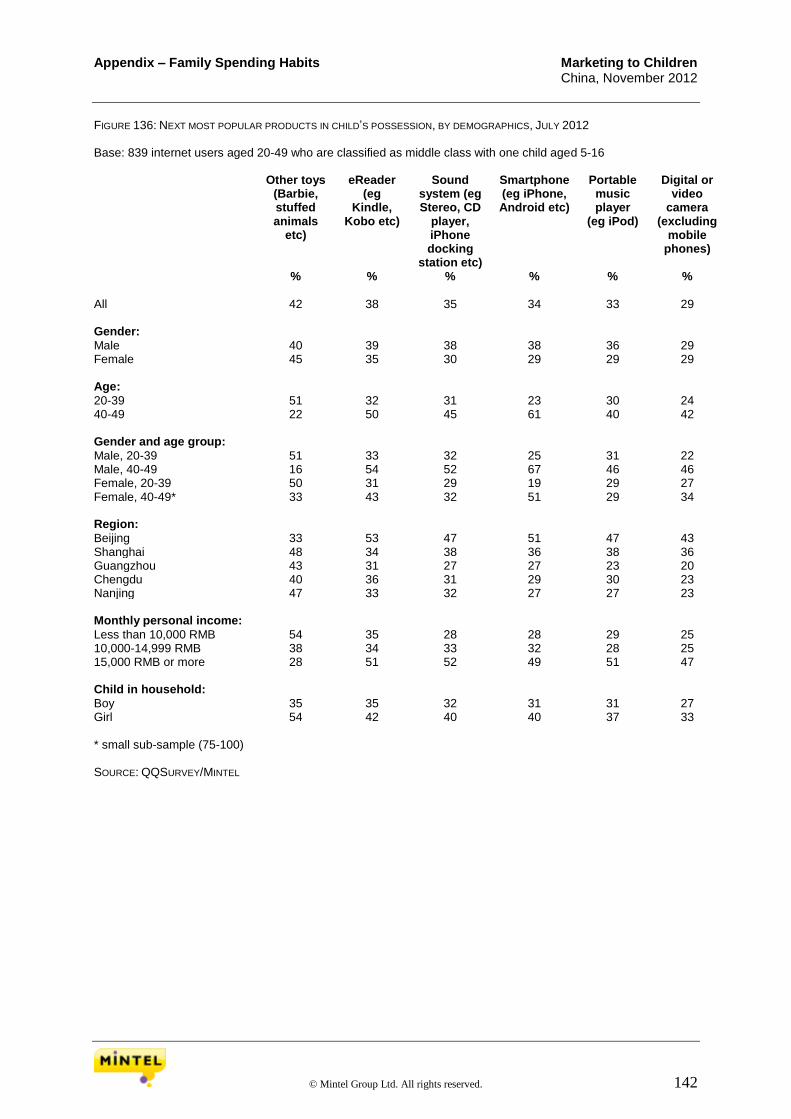
Appendix – Family Spending Habits Marketing to Children China, November 2012
© Mintel Group Ltd. All rights reserved. 142
FIGURE 136: NEXT MOST POPULAR PRODUCTS IN CHILD’S POSSESSION, BY DEMOGRAPHICS, JULY 2012 Base: 839 internet users aged 20-49 who are classified as middle class with one child aged 5-16 Other toys
(Barbie, stuffed animals
etc)
eReader (eg
Kindle, Kobo etc)
Sound system (eg Stereo, CD
player, iPhone docking
station etc)
Smartphone (eg iPhone, Android etc)
Portable music player
(eg iPod)
Digital or video
camera (excluding
mobile phones)
% % % % % %
All 42 38 35 34 33 29 Gender: Male 40 39 38 38 36 29 Female 45 35 30 29 29 29 Age: 20-39 51 32 31 23 30 24 40-49 22 50 45 61 40 42 Gender and age group: Male, 20-39 51 33 32 25 31 22 Male, 40-49 16 54 52 67 46 46 Female, 20-39 50 31 29 19 29 27 Female, 40-49* 33 43 32 51 29 34 Region: Beijing 33 53 47 51 47 43 Shanghai 48 34 38 36 38 36 Guangzhou 43 31 27 27 23 20 Chengdu 40 36 31 29 30 23 Nanjing 47 33 32 27 27 23 Monthly personal income: Less than 10,000 RMB 54 35 28 28 29 25 10,000-14,999 RMB 38 34 33 32 28 25 15,000 RMB or more 28 51 52 49 51 47 Child in household: Boy 35 35 32 31 31 27 Girl 54 42 40 40 37 33 * small sub-sample (75-100) SOURCE: QQSURVEY/MINTEL
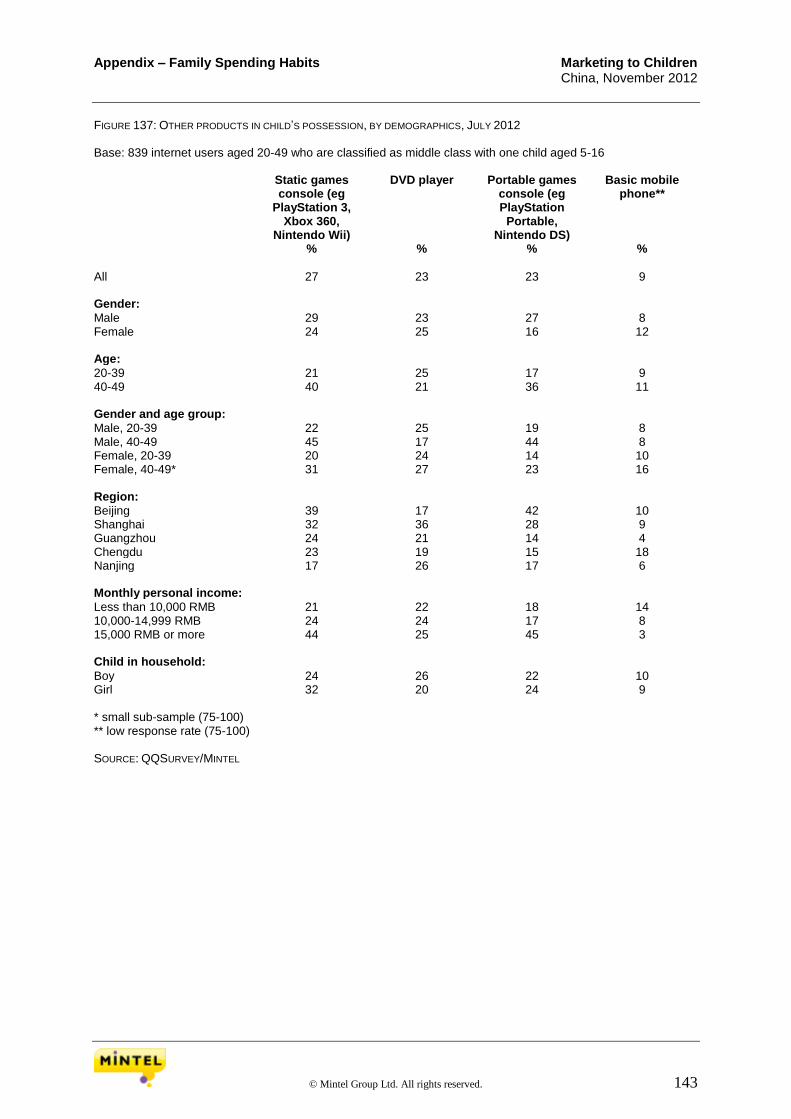
Appendix – Family Spending Habits Marketing to Children China, November 2012
© Mintel Group Ltd. All rights reserved. 143
FIGURE 137: OTHER PRODUCTS IN CHILD’S POSSESSION, BY DEMOGRAPHICS, JULY 2012 Base: 839 internet users aged 20-49 who are classified as middle class with one child aged 5-16 Static games
console (eg PlayStation 3,
Xbox 360, Nintendo Wii)
DVD player Portable games console (eg PlayStation
Portable, Nintendo DS)
Basic mobile phone**
% % % %
All 27 23 23 9 Gender: Male 29 23 27 8 Female 24 25 16 12 Age: 20-39 21 25 17 9 40-49 40 21 36 11 Gender and age group: Male, 20-39 22 25 19 8 Male, 40-49 45 17 44 8 Female, 20-39 20 24 14 10 Female, 40-49* 31 27 23 16 Region: Beijing 39 17 42 10 Shanghai 32 36 28 9 Guangzhou 24 21 14 4 Chengdu 23 19 15 18 Nanjing 17 26 17 6 Monthly personal income: Less than 10,000 RMB 21 22 18 14 10,000-14,999 RMB 24 24 17 8 15,000 RMB or more 44 25 45 3 Child in household: Boy 24 26 22 10 Girl 32 20 24 9 * small sub-sample (75-100) ** low response rate (75-100) SOURCE: QQSURVEY/MINTEL
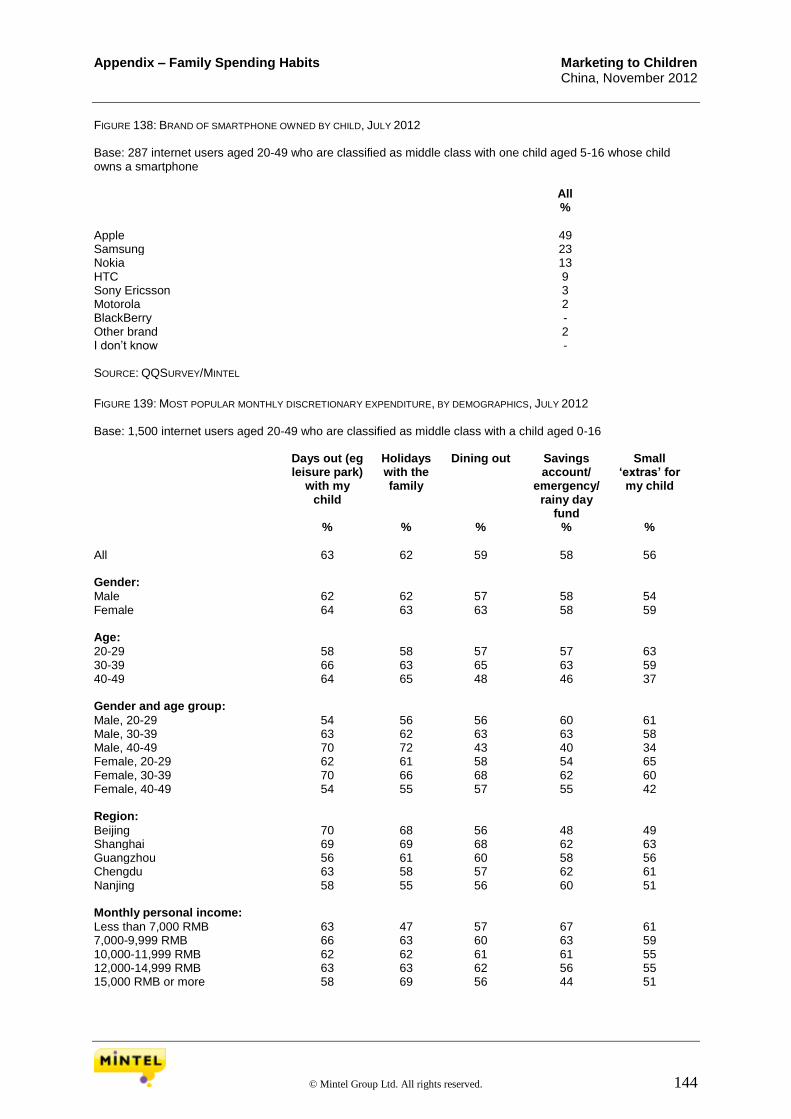
Appendix – Family Spending Habits Marketing to Children China, November 2012
© Mintel Group Ltd. All rights reserved. 144
FIGURE 138: BRAND OF SMARTPHONE OWNED BY CHILD, JULY 2012 Base: 287 internet users aged 20-49 who are classified as middle class with one child aged 5-16 whose child owns a smartphone All %
Apple 49 Samsung 23 Nokia 13 HTC 9 Sony Ericsson 3 Motorola 2 BlackBerry - Other brand 2 I don’t know - SOURCE: QQSURVEY/MINTEL
FIGURE 139: MOST POPULAR MONTHLY DISCRETIONARY EXPENDITURE, BY DEMOGRAPHICS, JULY 2012 Base: 1,500 internet users aged 20-49 who are classified as middle class with a child aged 0-16 Days out (eg
leisure park) with my
child
Holidays with the family
Dining out Savings account/
emergency/ rainy day
fund
Small ‘extras’ for my child
% % % % %
All 63 62 59 58 56 Gender: Male 62 62 57 58 54 Female 64 63 63 58 59 Age: 20-29 58 58 57 57 63 30-39 66 63 65 63 59 40-49 64 65 48 46 37 Gender and age group: Male, 20-29 54 56 56 60 61 Male, 30-39 63 62 63 63 58 Male, 40-49 70 72 43 40 34 Female, 20-29 62 61 58 54 65 Female, 30-39 70 66 68 62 60 Female, 40-49 54 55 57 55 42 Region: Beijing 70 68 56 48 49 Shanghai 69 69 68 62 63 Guangzhou 56 61 60 58 56 Chengdu 63 58 57 62 61 Nanjing 58 55 56 60 51 Monthly personal income: Less than 7,000 RMB 63 47 57 67 61 7,000-9,999 RMB 66 63 60 63 59 10,000-11,999 RMB 62 62 61 61 55 12,000-14,999 RMB 63 63 62 56 55 15,000 RMB or more 58 69 56 44 51
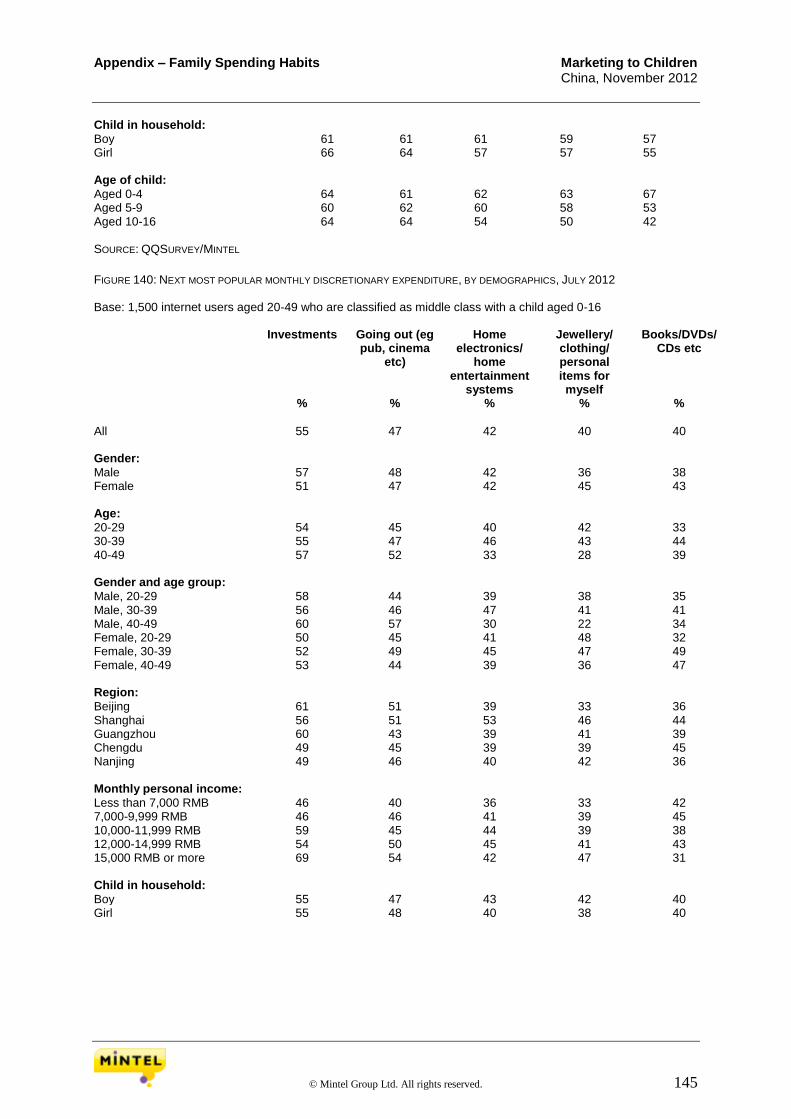
Appendix – Family Spending Habits Marketing to Children China, November 2012
© Mintel Group Ltd. All rights reserved. 145
Child in household: Boy 61 61 61 59 57 Girl 66 64 57 57 55 Age of child: Aged 0-4 64 61 62 63 67 Aged 5-9 60 62 60 58 53 Aged 10-16 64 64 54 50 42 SOURCE: QQSURVEY/MINTEL
FIGURE 140: NEXT MOST POPULAR MONTHLY DISCRETIONARY EXPENDITURE, BY DEMOGRAPHICS, JULY 2012 Base: 1,500 internet users aged 20-49 who are classified as middle class with a child aged 0-16 Investments Going out (eg
pub, cinema etc)
Home electronics/
home entertainment
systems
Jewellery/ clothing/ personal items for myself
Books/DVDs/CDs etc
% % % % %
All 55 47 42 40 40 Gender: Male 57 48 42 36 38 Female 51 47 42 45 43 Age: 20-29 54 45 40 42 33 30-39 55 47 46 43 44 40-49 57 52 33 28 39 Gender and age group: Male, 20-29 58 44 39 38 35 Male, 30-39 56 46 47 41 41 Male, 40-49 60 57 30 22 34 Female, 20-29 50 45 41 48 32 Female, 30-39 52 49 45 47 49 Female, 40-49 53 44 39 36 47 Region: Beijing 61 51 39 33 36 Shanghai 56 51 53 46 44 Guangzhou 60 43 39 41 39 Chengdu 49 45 39 39 45 Nanjing 49 46 40 42 36 Monthly personal income: Less than 7,000 RMB 46 40 36 33 42 7,000-9,999 RMB 46 46 41 39 45 10,000-11,999 RMB 59 45 44 39 38 12,000-14,999 RMB 54 50 45 41 43 15,000 RMB or more 69 54 42 47 31 Child in household: Boy 55 47 43 42 40 Girl 55 48 40 38 40

Appendix – Family Spending Habits Marketing to Children China, November 2012
© Mintel Group Ltd. All rights reserved. 146
Age of child: Aged 0-4 56 47 43 45 38 Aged 5-9 53 43 43 36 40 Aged 10-16 56 51 39 36 43 SOURCE: QQSURVEY/MINTEL
FIGURE 141: OTHER MONTHLY DISCRETIONARY EXPENDITURE, BY DEMOGRAPHICS, JULY 2012 Base: 1,500 internet users aged 20-49 who are classified as middle class with a child aged 0-16 Sweets/
chocolate etc
Food/drink at home for a
‘special’ occasions
Furniture/home improvements/
décor
Putting it toward a ‘major’
purchase (like buying a house or car)
Spend it without
particularly noticing what
it went on
% % % % %
All 33 28 28 27 9 Gender: Male 30 26 26 27 8 Female 38 32 30 27 10 Age: 20-29 31 29 27 26 8 30-39 36 29 30 30 11 40-49 26 24 23 21 5 Gender and age group: Male, 20-29 32 27 27 28 5 Male, 30-39 32 27 27 30 11 Male, 40-49 20 22 19 17 6 Female, 20-29 30 32 27 23 12 Female, 30-39 44 33 34 29 11 Female, 40-49 36 28 28 27 3 Region: Beijing 31 22 21 23 8 Shanghai 39 31 34 31 10 Guangzhou 30 28 31 30 8 Chengdu 37 31 30 26 9 Nanjing 28 30 22 24 9 Monthly personal income: Less than 7,000 RMB 35 30 23 23 8 7,000-9,999 RMB 33 32 28 27 10 10,000-11,999 RMB 34 26 31 28 7 12,000-14,999 RMB 38 30 32 32 8 15,000 RMB or more 27 24 23 23 12 Child in household: Boy 33 30 30 27 8 Girl 33 26 24 26 9 Age of child: Aged 0-4 36 32 29 30 10 Aged 5-9 30 26 27 25 6 Aged 10-16 32 26 27 24 9 SOURCE: QQSURVEY/MINTEL

Appendix – Family Spending Habits Marketing to Children China, November 2012
© Mintel Group Ltd. All rights reserved. 147
FIGURE 142: WHAT MONTHLY INCOME IS SPENT ON, JULY 2012 Base: 1,500 internet users aged 20-49 who are classified as middle class with a child aged 0-16 All %
Housing ie mortgage, bills, DIY etc: Less than 10% 45 10-19% 32 20-29% 15 30% or more 8 Food and drink ie all food and drink expenditures in and out of home: Less than 10% 15 10-19% 52 20-29% 24 30% or more 9 Transport ie car fuel, train fares etc: Less than 10% 50 10% or more 50 Finance ie monthly saving, insurances, account fees etc: Less than 10% 14 10-19% 46 20-29% 24 30-39% 11 40% or more 6 Personal care products and pharmaceuticals ie beauty and personal care products, OTC pharmaceuticals etc:
Less than 10% 65 10% or more 35 Leisure, Entertainment and technology for your household ie gadgets, dining out, theatre tickets etc:
Less than 10% 44 10% or more 56 Holidays and travel ie airplane tickets, hotel fees etc: Less than 10% 46 10% or more 54 Clothing and adornment for yourself or your partner: Less than 10% 34 10-19% 60 20% or more 6 Your child ie costs for education, afternoon classes, treats, clothes, mobile: Less than 10% 24 10-19% 63 20% or more 12 Other: Less than 10% 69 10-19% 23 20% or more 7 SOURCE: QQSURVEY/MINTEL
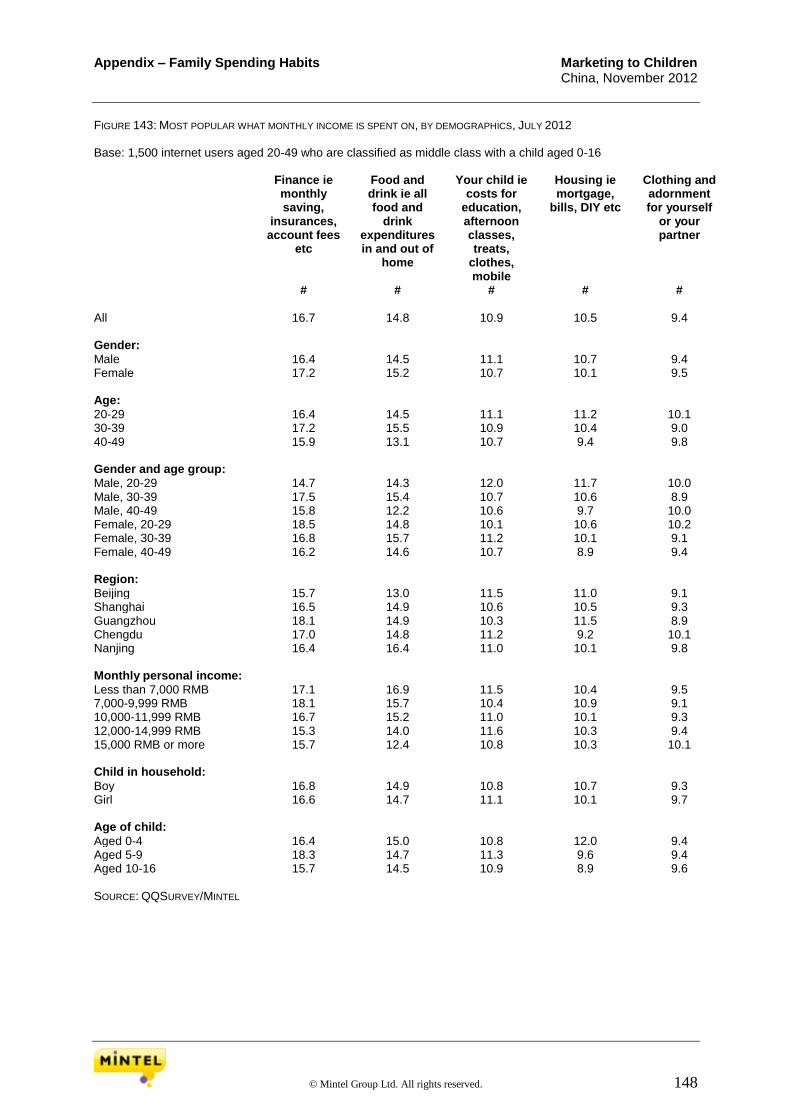
Appendix – Family Spending Habits Marketing to Children China, November 2012
© Mintel Group Ltd. All rights reserved. 148
FIGURE 143: MOST POPULAR WHAT MONTHLY INCOME IS SPENT ON, BY DEMOGRAPHICS, JULY 2012 Base: 1,500 internet users aged 20-49 who are classified as middle class with a child aged 0-16 Finance ie
monthly saving,
insurances, account fees
etc
Food and drink ie all food and
drink expenditures in and out of
home
Your child ie costs for
education, afternoon classes, treats,
clothes, mobile
Housing ie mortgage,
bills, DIY etc
Clothing and adornment for yourself
or your partner
# # # # #
All 16.7 14.8 10.9 10.5 9.4 Gender: Male 16.4 14.5 11.1 10.7 9.4 Female 17.2 15.2 10.7 10.1 9.5 Age: 20-29 16.4 14.5 11.1 11.2 10.1 30-39 17.2 15.5 10.9 10.4 9.0 40-49 15.9 13.1 10.7 9.4 9.8 Gender and age group: Male, 20-29 14.7 14.3 12.0 11.7 10.0 Male, 30-39 17.5 15.4 10.7 10.6 8.9 Male, 40-49 15.8 12.2 10.6 9.7 10.0 Female, 20-29 18.5 14.8 10.1 10.6 10.2 Female, 30-39 16.8 15.7 11.2 10.1 9.1 Female, 40-49 16.2 14.6 10.7 8.9 9.4 Region: Beijing 15.7 13.0 11.5 11.0 9.1 Shanghai 16.5 14.9 10.6 10.5 9.3 Guangzhou 18.1 14.9 10.3 11.5 8.9 Chengdu 17.0 14.8 11.2 9.2 10.1 Nanjing 16.4 16.4 11.0 10.1 9.8 Monthly personal income: Less than 7,000 RMB 17.1 16.9 11.5 10.4 9.5 7,000-9,999 RMB 18.1 15.7 10.4 10.9 9.1 10,000-11,999 RMB 16.7 15.2 11.0 10.1 9.3 12,000-14,999 RMB 15.3 14.0 11.6 10.3 9.4 15,000 RMB or more 15.7 12.4 10.8 10.3 10.1 Child in household: Boy 16.8 14.9 10.8 10.7 9.3 Girl 16.6 14.7 11.1 10.1 9.7 Age of child: Aged 0-4 16.4 15.0 10.8 12.0 9.4 Aged 5-9 18.3 14.7 11.3 9.6 9.4 Aged 10-16 15.7 14.5 10.9 8.9 9.6 SOURCE: QQSURVEY/MINTEL

Appendix – Family Spending Habits Marketing to Children China, November 2012
© Mintel Group Ltd. All rights reserved. 149
FIGURE 144: NEXT MOST POPULAR WHAT MONTHLY INCOME IS SPENT ON, BY DEMOGRAPHICS, JULY 2012 Base: 1,500 internet users aged 20-49 who are classified as middle class with a child aged 0-16 Leisure,
Entertainment and technology
for your household ie
gadgets, dining out, theatre tickets etc
Transport ie car fuel, train
fares etc
Holidays and travel ie airplane
tickets, hotel fees etc
Personal care products and
pharmaceuticals ie beauty and personal care products, OTC
pharmaceuticals etc
Other
# # # # #
All 8.5 8.1 8.0 7.1 6.0 Gender: Male 8.6 8.1 8.1 6.7 6.4 Female 8.4 8.0 7.9 7.6 5.4 Age: 20-29 8.5 7.9 7.2 7.3 5.8 30-39 8.4 8.2 8.1 6.9 5.4 40-49 8.8 8.1 9.1 7.4 7.8 Gender and age group: Male, 20-29 8.9 8.4 7.4 6.3 6.3 Male, 30-39 8.4 8.2 8.1 6.7 5.6 Male, 40-49 8.9 7.7 8.9 7.4 9.0 Female, 20-29 8.1 7.3 7.0 8.4 5.2 Female, 30-39 8.5 8.3 8.0 7.1 5.3 Female, 40-49 8.7 8.7 9.3 7.5 6.0 Region: Beijing 8.6 8.0 8.1 7.3 7.9 Shanghai 9.1 8.2 8.1 7.3 5.7 Guangzhou 7.9 7.7 7.7 7.6 5.5 Chengdu 8.7 8.5 8.3 7.0 5.1 Nanjing 8.4 8.1 7.8 6.4 5.7 Monthly personal income: Less than 7,000 RMB 7.8 8.4 6.6 6.2 5.6 7,000-9,999 RMB 8.1 7.9 7.7 7.4 4.7 10,000-11,999 RMB 8.7 8.0 7.8 7.3 5.9 12,000-14,999 RMB 9.1 8.8 9.0 7.0 5.6 15,000 RMB or more 8.9 7.7 8.6 7.0 8.6 Child in household: Boy 8.6 8.1 8.1 7.0 5.7 Girl 8.4 8.1 7.8 7.3 6.3 Age of child: Aged 0-4 8.5 8.2 7.5 6.7 5.7 Aged 5-9 8.1 7.9 7.8 7.3 5.5 Aged 10-16 9.0 8.1 9.0 7.5 6.9 SOURCE: QQSURVEY/MINTEL
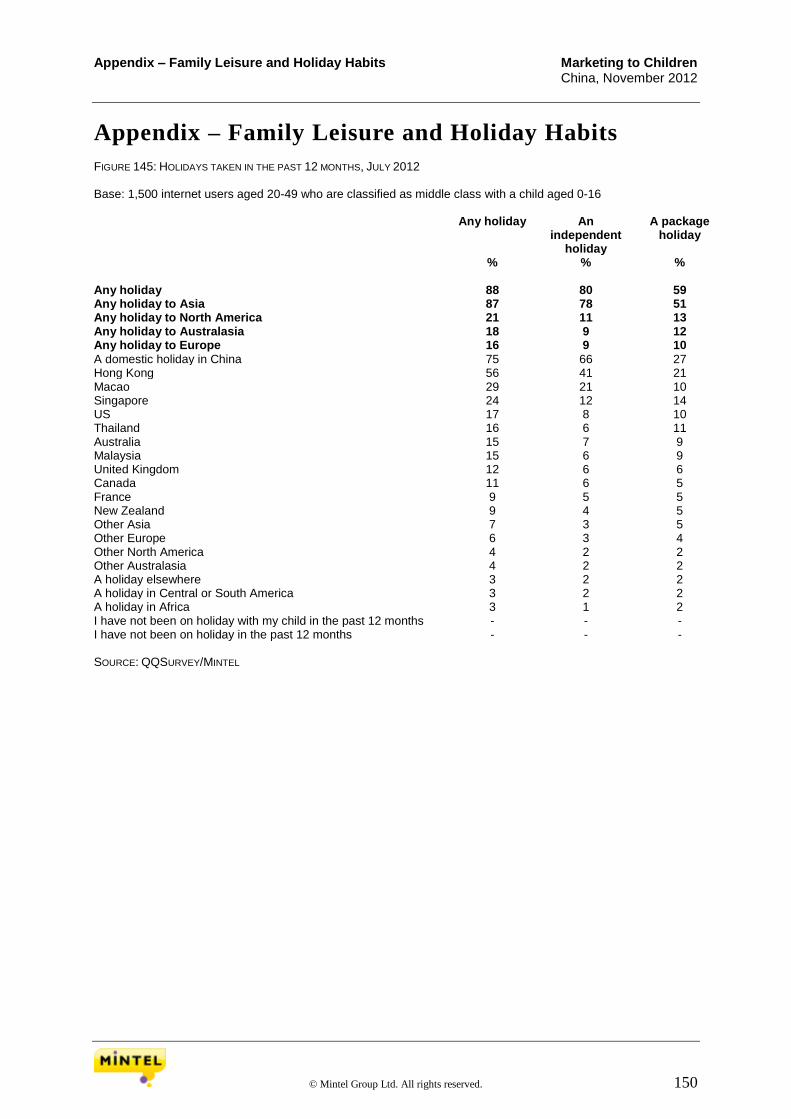
Appendix – Family Leisure and Holiday Habits Marketing to Children China, November 2012
© Mintel Group Ltd. All rights reserved. 150
Appendix – Family Leisure and Holiday Habits FIGURE 145: HOLIDAYS TAKEN IN THE PAST 12 MONTHS, JULY 2012 Base: 1,500 internet users aged 20-49 who are classified as middle class with a child aged 0-16 Any holiday An
independent holiday
A package holiday
% % %
Any holiday 88 80 59 Any holiday to Asia 87 78 51 Any holiday to North America 21 11 13 Any holiday to Australasia 18 9 12 Any holiday to Europe 16 9 10
A domestic holiday in China 75 66 27 Hong Kong 56 41 21 Macao 29 21 10 Singapore 24 12 14 US 17 8 10 Thailand 16 6 11 Australia 15 7 9 Malaysia 15 6 9 United Kingdom 12 6 6 Canada 11 6 5 France 9 5 5 New Zealand 9 4 5 Other Asia 7 3 5 Other Europe 6 3 4 Other North America 4 2 2 Other Australasia 4 2 2 A holiday elsewhere 3 2 2 A holiday in Central or South America 3 2 2 A holiday in Africa 3 1 2 I have not been on holiday with my child in the past 12 months - - - I have not been on holiday in the past 12 months - - - SOURCE: QQSURVEY/MINTEL
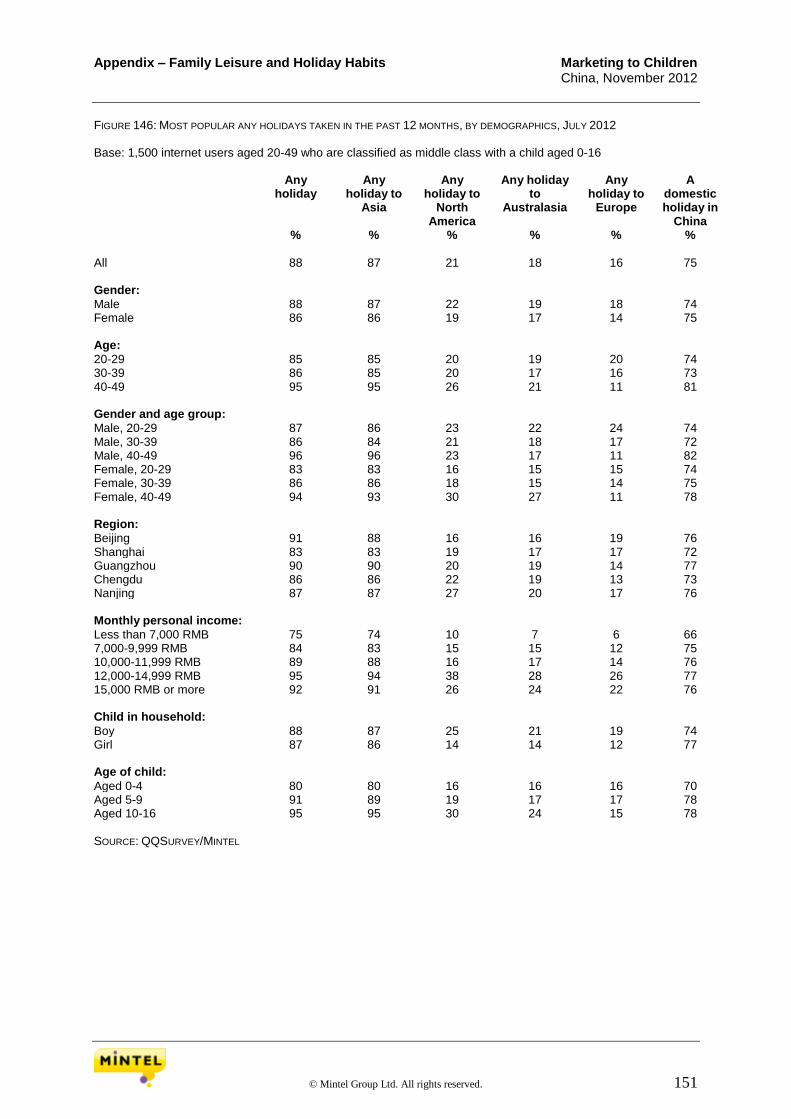
Appendix – Family Leisure and Holiday Habits Marketing to Children China, November 2012
© Mintel Group Ltd. All rights reserved. 151
FIGURE 146: MOST POPULAR ANY HOLIDAYS TAKEN IN THE PAST 12 MONTHS, BY DEMOGRAPHICS, JULY 2012 Base: 1,500 internet users aged 20-49 who are classified as middle class with a child aged 0-16 Any
holiday Any
holiday to Asia
Any holiday to
North America
Any holiday to
Australasia
Any holiday to
Europe
A domestic holiday in
China % % % % % %
All 88 87 21 18 16 75 Gender: Male 88 87 22 19 18 74 Female 86 86 19 17 14 75 Age: 20-29 85 85 20 19 20 74 30-39 86 85 20 17 16 73 40-49 95 95 26 21 11 81 Gender and age group: Male, 20-29 87 86 23 22 24 74 Male, 30-39 86 84 21 18 17 72 Male, 40-49 96 96 23 17 11 82 Female, 20-29 83 83 16 15 15 74 Female, 30-39 86 86 18 15 14 75 Female, 40-49 94 93 30 27 11 78 Region: Beijing 91 88 16 16 19 76 Shanghai 83 83 19 17 17 72 Guangzhou 90 90 20 19 14 77 Chengdu 86 86 22 19 13 73 Nanjing 87 87 27 20 17 76 Monthly personal income: Less than 7,000 RMB 75 74 10 7 6 66 7,000-9,999 RMB 84 83 15 15 12 75 10,000-11,999 RMB 89 88 16 17 14 76 12,000-14,999 RMB 95 94 38 28 26 77 15,000 RMB or more 92 91 26 24 22 76 Child in household: Boy 88 87 25 21 19 74 Girl 87 86 14 14 12 77 Age of child: Aged 0-4 80 80 16 16 16 70 Aged 5-9 91 89 19 17 17 78 Aged 10-16 95 95 30 24 15 78 SOURCE: QQSURVEY/MINTEL
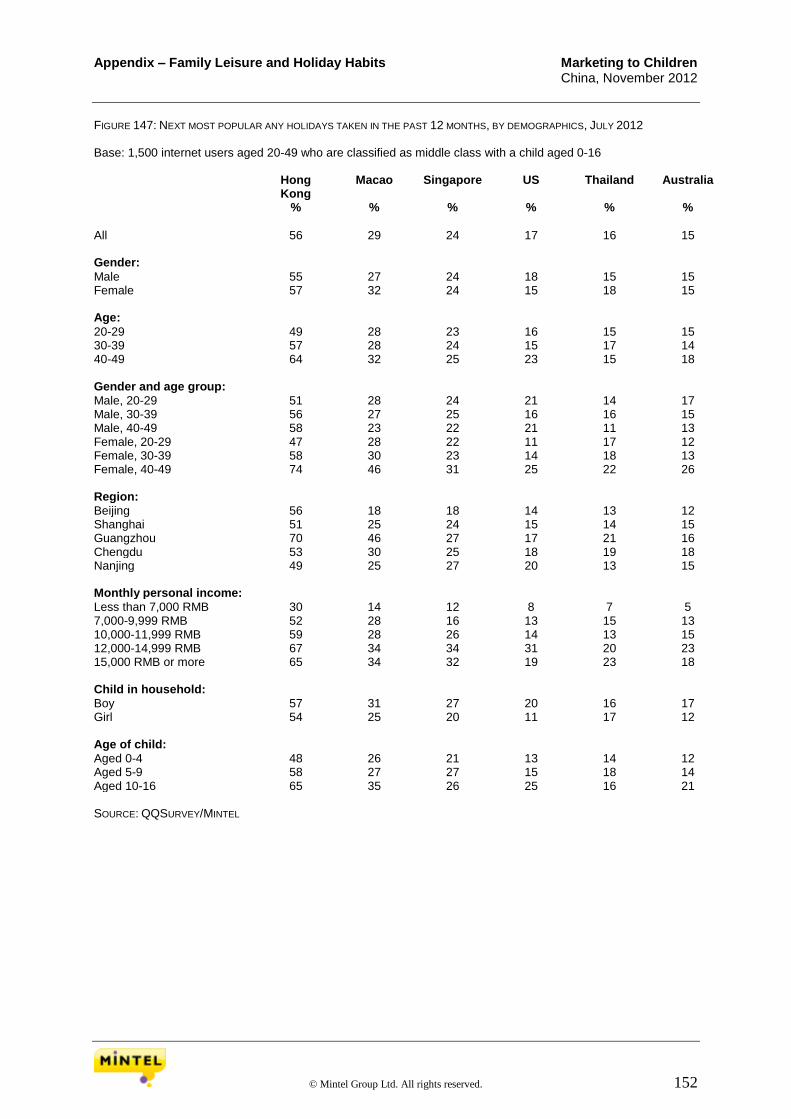
Appendix – Family Leisure and Holiday Habits Marketing to Children China, November 2012
© Mintel Group Ltd. All rights reserved. 152
FIGURE 147: NEXT MOST POPULAR ANY HOLIDAYS TAKEN IN THE PAST 12 MONTHS, BY DEMOGRAPHICS, JULY 2012 Base: 1,500 internet users aged 20-49 who are classified as middle class with a child aged 0-16 Hong
Kong Macao Singapore US Thailand Australia
% % % % % %
All 56 29 24 17 16 15 Gender: Male 55 27 24 18 15 15 Female 57 32 24 15 18 15 Age: 20-29 49 28 23 16 15 15 30-39 57 28 24 15 17 14 40-49 64 32 25 23 15 18 Gender and age group: Male, 20-29 51 28 24 21 14 17 Male, 30-39 56 27 25 16 16 15 Male, 40-49 58 23 22 21 11 13 Female, 20-29 47 28 22 11 17 12 Female, 30-39 58 30 23 14 18 13 Female, 40-49 74 46 31 25 22 26 Region: Beijing 56 18 18 14 13 12 Shanghai 51 25 24 15 14 15 Guangzhou 70 46 27 17 21 16 Chengdu 53 30 25 18 19 18 Nanjing 49 25 27 20 13 15 Monthly personal income: Less than 7,000 RMB 30 14 12 8 7 5 7,000-9,999 RMB 52 28 16 13 15 13 10,000-11,999 RMB 59 28 26 14 13 15 12,000-14,999 RMB 67 34 34 31 20 23 15,000 RMB or more 65 34 32 19 23 18 Child in household: Boy 57 31 27 20 16 17 Girl 54 25 20 11 17 12 Age of child: Aged 0-4 48 26 21 13 14 12 Aged 5-9 58 27 27 15 18 14 Aged 10-16 65 35 26 25 16 21 SOURCE: QQSURVEY/MINTEL
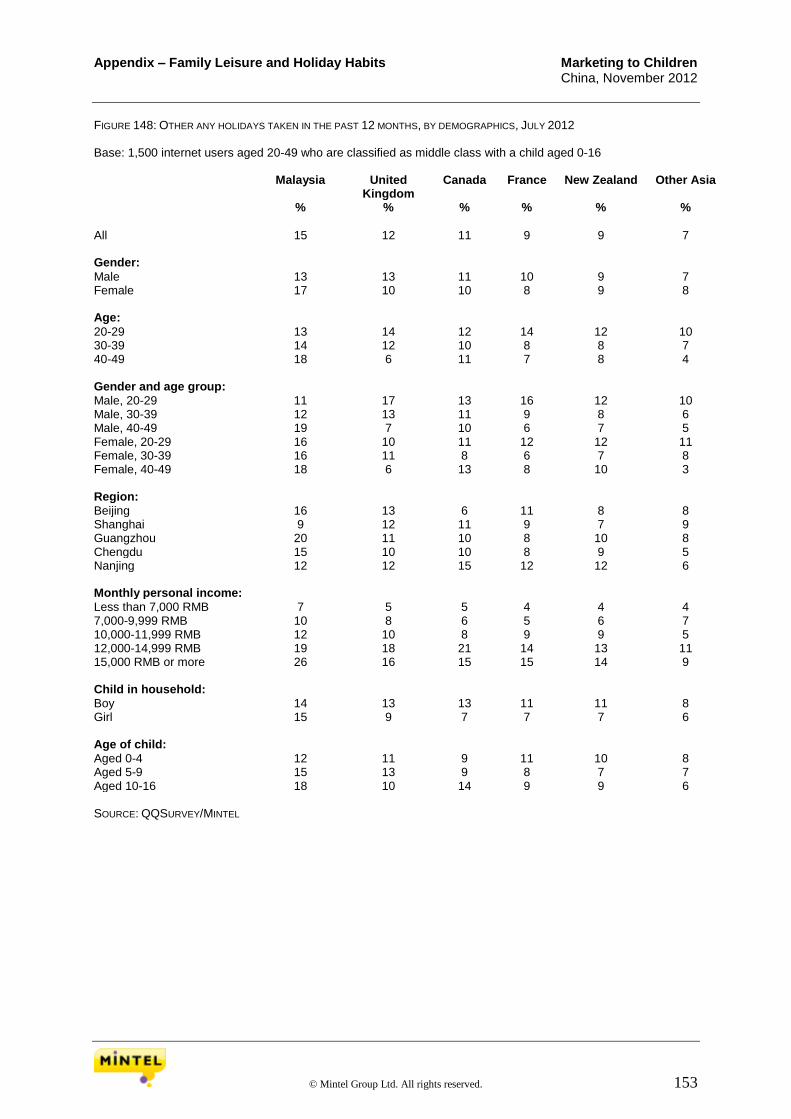
Appendix – Family Leisure and Holiday Habits Marketing to Children China, November 2012
© Mintel Group Ltd. All rights reserved. 153
FIGURE 148: OTHER ANY HOLIDAYS TAKEN IN THE PAST 12 MONTHS, BY DEMOGRAPHICS, JULY 2012 Base: 1,500 internet users aged 20-49 who are classified as middle class with a child aged 0-16 Malaysia United
Kingdom Canada France New Zealand Other Asia
% % % % % %
All 15 12 11 9 9 7 Gender: Male 13 13 11 10 9 7 Female 17 10 10 8 9 8 Age: 20-29 13 14 12 14 12 10 30-39 14 12 10 8 8 7 40-49 18 6 11 7 8 4 Gender and age group: Male, 20-29 11 17 13 16 12 10 Male, 30-39 12 13 11 9 8 6 Male, 40-49 19 7 10 6 7 5 Female, 20-29 16 10 11 12 12 11 Female, 30-39 16 11 8 6 7 8 Female, 40-49 18 6 13 8 10 3 Region: Beijing 16 13 6 11 8 8 Shanghai 9 12 11 9 7 9 Guangzhou 20 11 10 8 10 8 Chengdu 15 10 10 8 9 5 Nanjing 12 12 15 12 12 6 Monthly personal income: Less than 7,000 RMB 7 5 5 4 4 4 7,000-9,999 RMB 10 8 6 5 6 7 10,000-11,999 RMB 12 10 8 9 9 5 12,000-14,999 RMB 19 18 21 14 13 11 15,000 RMB or more 26 16 15 15 14 9 Child in household: Boy 14 13 13 11 11 8 Girl 15 9 7 7 7 6 Age of child: Aged 0-4 12 11 9 11 10 8 Aged 5-9 15 13 9 8 7 7 Aged 10-16 18 10 14 9 9 6 SOURCE: QQSURVEY/MINTEL
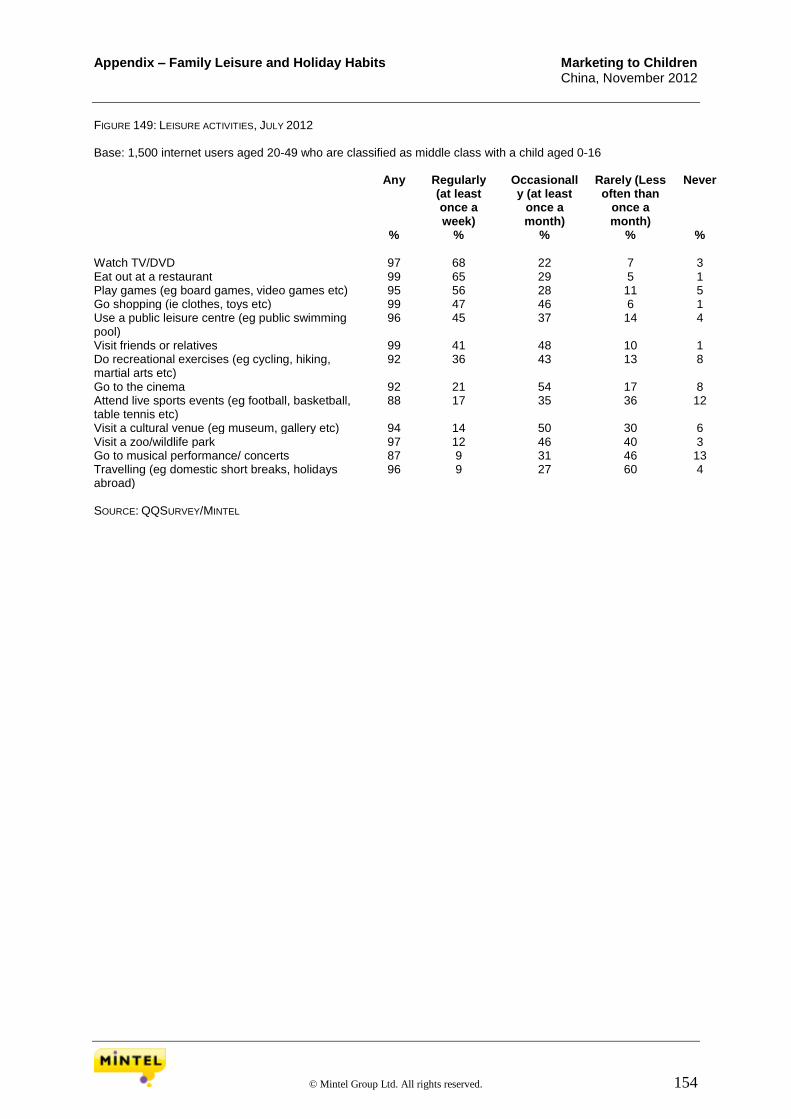
Appendix – Family Leisure and Holiday Habits Marketing to Children China, November 2012
© Mintel Group Ltd. All rights reserved. 154
FIGURE 149: LEISURE ACTIVITIES, JULY 2012 Base: 1,500 internet users aged 20-49 who are classified as middle class with a child aged 0-16 Any Regularly
(at least once a week)
Occasionally (at least
once a month)
Rarely (Less often than
once a month)
Never
% % % % %
Watch TV/DVD 97 68 22 7 3 Eat out at a restaurant 99 65 29 5 1 Play games (eg board games, video games etc) 95 56 28 11 5 Go shopping (ie clothes, toys etc) 99 47 46 6 1 Use a public leisure centre (eg public swimming pool)
96 45 37 14 4
Visit friends or relatives 99 41 48 10 1 Do recreational exercises (eg cycling, hiking, martial arts etc)
92 36 43 13 8
Go to the cinema 92 21 54 17 8 Attend live sports events (eg football, basketball, table tennis etc)
88 17 35 36 12
Visit a cultural venue (eg museum, gallery etc) 94 14 50 30 6 Visit a zoo/wildlife park 97 12 46 40 3 Go to musical performance/ concerts 87 9 31 46 13 Travelling (eg domestic short breaks, holidays abroad)
96 9 27 60 4
SOURCE: QQSURVEY/MINTEL
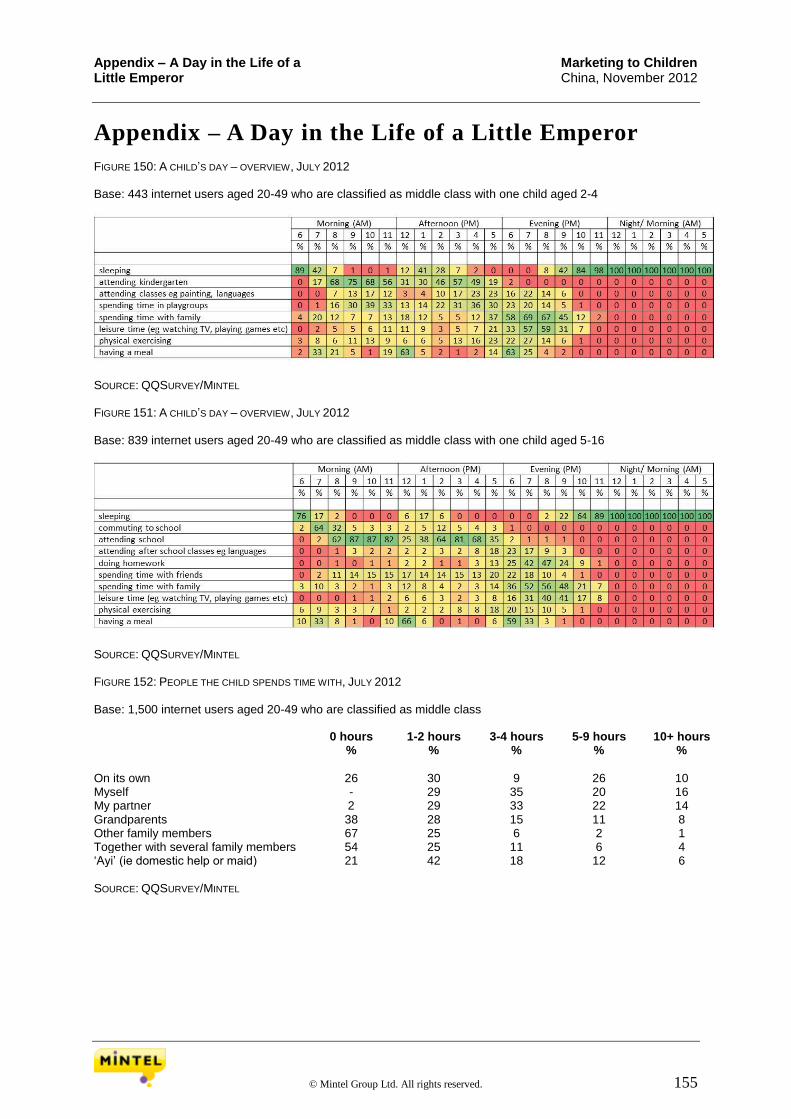
Appendix – A Day in the Life of a Marketing to Children Little Emperor China, November 2012
© Mintel Group Ltd. All rights reserved. 155
Appendix – A Day in the Life of a Little Emperor FIGURE 150: A CHILD’S DAY – OVERVIEW, JULY 2012 Base: 443 internet users aged 20-49 who are classified as middle class with one child aged 2-4
SOURCE: QQSURVEY/MINTEL FIGURE 151: A CHILD’S DAY – OVERVIEW, JULY 2012 Base: 839 internet users aged 20-49 who are classified as middle class with one child aged 5-16
SOURCE: QQSURVEY/MINTEL FIGURE 152: PEOPLE THE CHILD SPENDS TIME WITH, JULY 2012 Base: 1,500 internet users aged 20-49 who are classified as middle class 0 hours 1-2 hours 3-4 hours 5-9 hours 10+ hours % % % % %
On its own 26 30 9 26 10 Myself - 29 35 20 16 My partner 2 29 33 22 14 Grandparents 38 28 15 11 8 Other family members 67 25 6 2 1 Together with several family members 54 25 11 6 4 ‘Ayi’ (ie domestic help or maid) 21 42 18 12 6 SOURCE: QQSURVEY/MINTEL
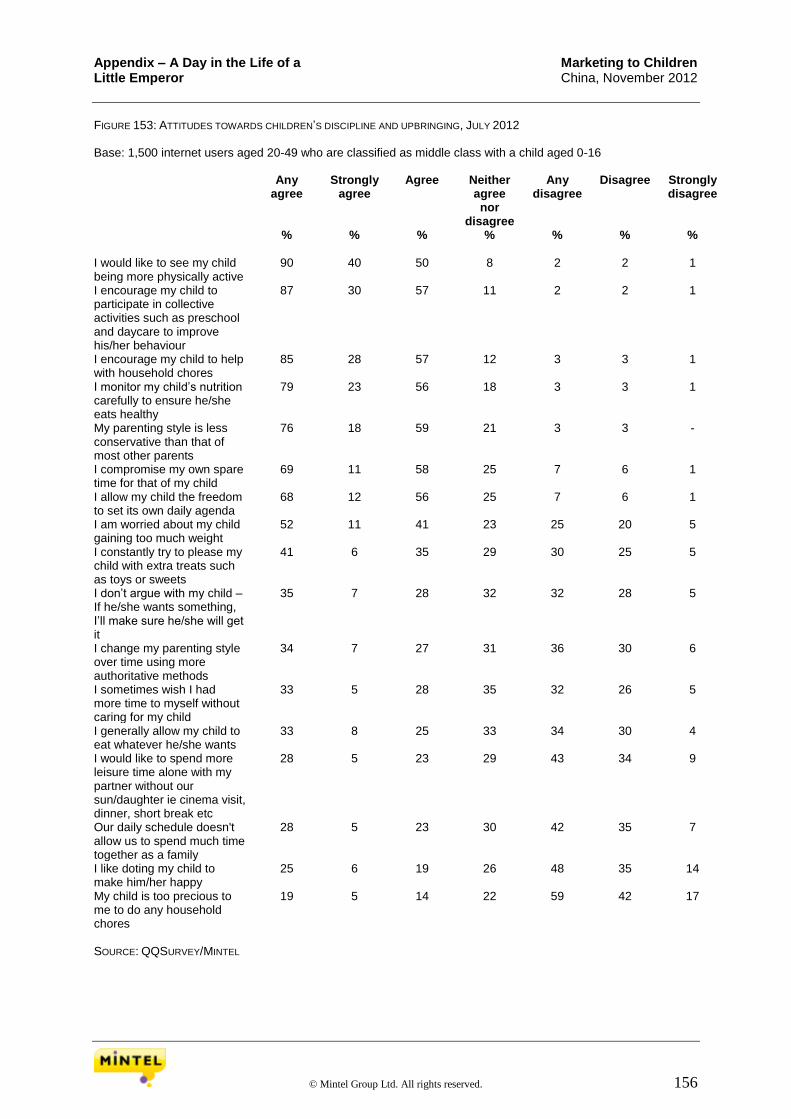
Appendix – A Day in the Life of a Marketing to Children Little Emperor China, November 2012
© Mintel Group Ltd. All rights reserved. 156
FIGURE 153: ATTITUDES TOWARDS CHILDREN’S DISCIPLINE AND UPBRINGING, JULY 2012 Base: 1,500 internet users aged 20-49 who are classified as middle class with a child aged 0-16 Any
agree Strongly
agree Agree Neither
agree nor
disagree
Any disagree
Disagree Strongly disagree
% % % % % % %
I would like to see my child being more physically active
90 40 50 8 2 2 1
I encourage my child to participate in collective activities such as preschool and daycare to improve his/her behaviour
87 30 57 11 2 2 1
I encourage my child to help with household chores
85 28 57 12 3 3 1
I monitor my child’s nutrition carefully to ensure he/she eats healthy
79 23 56 18 3 3 1
My parenting style is less conservative than that of most other parents
76 18 59 21 3 3 -
I compromise my own spare time for that of my child
69 11 58 25 7 6 1
I allow my child the freedom to set its own daily agenda
68 12 56 25 7 6 1
I am worried about my child gaining too much weight
52 11 41 23 25 20 5
I constantly try to please my child with extra treats such as toys or sweets
41 6 35 29 30 25 5
I don’t argue with my child – If he/she wants something, I’ll make sure he/she will get it
35 7 28 32 32 28 5
I change my parenting style over time using more authoritative methods
34 7 27 31 36 30 6
I sometimes wish I had more time to myself without caring for my child
33 5 28 35 32 26 5
I generally allow my child to eat whatever he/she wants
33 8 25 33 34 30 4
I would like to spend more leisure time alone with my partner without our sun/daughter ie cinema visit, dinner, short break etc
28 5 23 29 43 34 9
Our daily schedule doesn't allow us to spend much time together as a family
28 5 23 30 42 35 7
I like doting my child to make him/her happy
25 6 19 26 48 35 14
My child is too precious to me to do any household chores
19 5 14 22 59 42 17
SOURCE: QQSURVEY/MINTEL
Appendix: Research methodology

Appendix: China Research Methodology Marketing to Children China, November 2012
© Mintel Group Ltd. All rights reserved. 159
Appendix: China Research Methodology For its China report series, Mintel is running online consumer research in ten cities, completing 300
interviews per city with a total sample size of 3,000.
Our consumer research is based on a random sample of internet respondents from a panel recruited
by QQsurvey China online research (see more details below)
In each wave, we survey four major tier 1 cities, i.e. Shanghai, Beijing, Guangzhou and Chengdu
For tier 2 and tier 3 cities, we rotate amongst a selection of cities based on size and economic
development (see below)
The research is not representative of the population as a whole, and is not being analysed as such.
Mintel applies a quota-sampling approach with quotas on age, sex, region, income and education
in these cities
Our sample data can only be considered as indicative of urban consumers in those regions rather
than representative of China as a whole
For category reports (e.g. chocolate confectionery), consumers will typically be asked about usage,
frequency, location of purchase, consumption occasion, brand usage and a series of attitudinal
statements about the category
Lifestyle reports cover a broader range of attitudinal and behavioural topics
Confidence levels
Statistical confidence levels of +/- 2% or 3% can be applied to the data, depending on sample size and
percentage of respondents. For example, if 20% of a total sample of 1,000 adults say that they do
something, you can be 95% certain that the figure for the population lies between 17% and 23%. For a
sample of 3,000 adults, you can be 95% certain that the figure lies between 18% and 22%.
Consumer research is stored in a database supervised by Mintel's statisticians. Additional analysis of
information too abundant to be included in published reports can be made available.
Sample sizes by city
When the overall population of a city is large enough (> 20,000), sample size is not determined by the
size of population. It is only when the population becomes quite small (e.g. less than 10,000) that the
sample size calculation is affected.
As a result a sample size of 300 per city across all 10 cities in our survey was set. Statistically, this
enables us to apply a confidence level at 95% with a margin of error of 5.66%.
Sampling methodology and sampling structure
According to government figures, there are 645 cities in China. These cities are very different in terms
of size, economic development, culture, history and lifestyle. To meet Mintel’s client interests (by
region, by tier), ten cities are selected in each wave of research based on their geographic coverage and
level of economic development (GDP and per capita income).
The table below shows an example of cities covered:
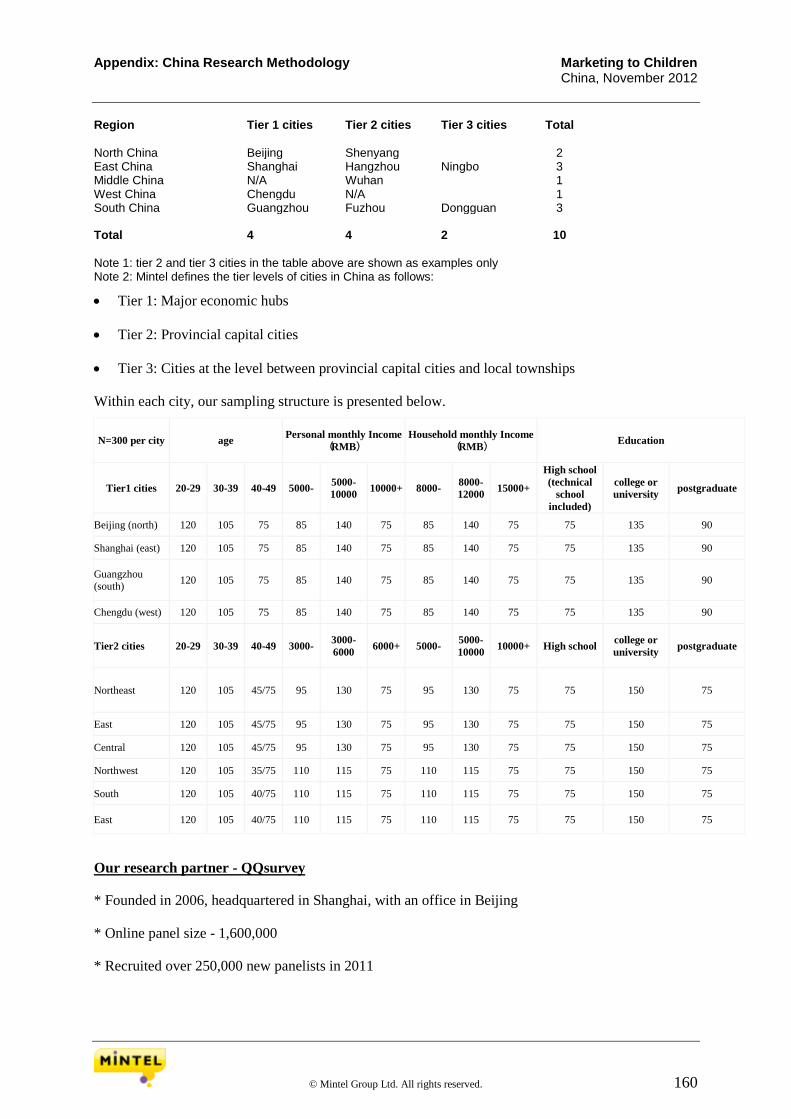
Appendix: China Research Methodology Marketing to Children China, November 2012
© Mintel Group Ltd. All rights reserved. 160
Region Tier 1 cities Tier 2 cities Tier 3 cities Total
North China Beijing Shenyang 2 East China Shanghai Hangzhou Ningbo 3 Middle China N/A Wuhan 1 West China Chengdu N/A 1 South China Guangzhou Fuzhou Dongguan 3 Total 4 4 2 10
Note 1: tier 2 and tier 3 cities in the table above are shown as examples only Note 2: Mintel defines the tier levels of cities in China as follows:
Tier 1: Major economic hubs
Tier 2: Provincial capital cities
Tier 3: Cities at the level between provincial capital cities and local townships
Within each city, our sampling structure is presented below.
N=300 per city age Personal monthly Income
(RMB)
Household monthly Income
(RMB) Education
Tier1 cities 20-29 30-39 40-49 5000- 5000-
10000 10000+ 8000-
8000-
12000 15000+
High school
(technical
school
included)
college or
university postgraduate
Beijing (north) 120 105 75 85 140 75 85 140 75 75 135 90
Shanghai (east) 120 105 75 85 140 75 85 140 75 75 135 90
Guangzhou (south)
120 105 75 85 140 75 85 140 75 75 135 90
Chengdu (west) 120 105 75 85 140 75 85 140 75 75 135 90
Tier2 cities 20-29 30-39 40-49 3000- 3000-
6000 6000+ 5000-
5000-
10000 10000+ High school
college or
university postgraduate
Northeast 120 105 45/75 95 130 75 95 130 75 75 150 75
East 120 105 45/75 95 130 75 95 130 75 75 150 75
Central 120 105 45/75 95 130 75 95 130 75 75 150 75
Northwest 120 105 35/75 110 115 75 110 115 75 75 150 75
South 120 105 40/75 110 115 75 110 115 75 75 150 75
East 120 105 40/75 110 115 75 110 115 75 75 150 75
Our research partner - QQsurvey
* Founded in 2006, headquartered in Shanghai, with an office in Beijing
* Online panel size - 1,600,000
* Recruited over 250,000 new panelists in 2011

Appendix: China Research Methodology Marketing to Children China, November 2012
© Mintel Group Ltd. All rights reserved. 161
* Owns the interactive panel website: www.1diaocha.com
* Member of the China Market Research Association (CMRA)
* Completed more than 1,000 projects and interviewed 400,000 respondents in 2011
* Provides panel data for major multinational research companies, including IPSOS, GMI, TNS,
Lightspeed, and have done projects for the likes of Nielsen, Kantar, Intage, Pulse, SSI, ResearchNow
(further details in the Appendix)
QQ’s sampling and Quality control
1.Screening
Exclude those who
have participated in any survey project in the past three months
are working in any sensitive or related industries
have participated in previous Mintel surveys
have not met sample criteria
2.Sampling
System will output all qualified panelists
Random sample 30,000 panelists and send out first wave of invitations via SMS or email
Random sample another 30,000 panelists and send out second wave of invitations
Random sample final batch of 30,000 panelists and send out third wave of invitations
3. Quality control
Each panelist has provided QQsurvey with his or her own IP address together with all personal
information
Each panelist needs to use the same IP address and cookie as registered IP address and cookie to
participate in any survey project, and he or she can participate in the same survey project only
once
Each respondent can use the weblink they have received once only
A sample will be deleted if the respondent
has given an answer to any open-ended question that is judged as of poor quality
has failed in any trap questions
has given any inconsistent answers, or contradicted his or her registered information
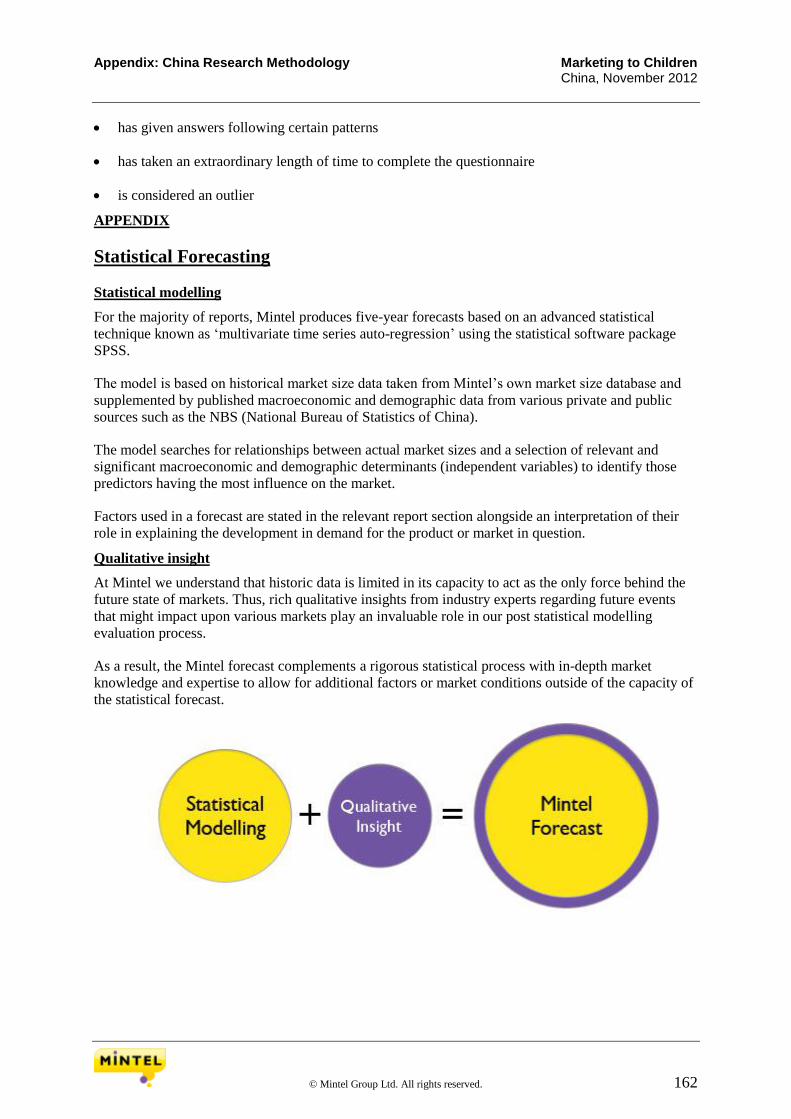
Appendix: China Research Methodology Marketing to Children China, November 2012
© Mintel Group Ltd. All rights reserved. 162
has given answers following certain patterns
has taken an extraordinary length of time to complete the questionnaire
is considered an outlier
APPENDIX
Statistical Forecasting
Statistical modelling
For the majority of reports, Mintel produces five-year forecasts based on an advanced statistical
technique known as ‘multivariate time series auto-regression’ using the statistical software package
SPSS.
The model is based on historical market size data taken from Mintel’s own market size database and
supplemented by published macroeconomic and demographic data from various private and public
sources such as the NBS (National Bureau of Statistics of China).
The model searches for relationships between actual market sizes and a selection of relevant and
significant macroeconomic and demographic determinants (independent variables) to identify those
predictors having the most influence on the market.
Factors used in a forecast are stated in the relevant report section alongside an interpretation of their
role in explaining the development in demand for the product or market in question.
Qualitative insight
At Mintel we understand that historic data is limited in its capacity to act as the only force behind the
future state of markets. Thus, rich qualitative insights from industry experts regarding future events
that might impact upon various markets play an invaluable role in our post statistical modelling
evaluation process.
As a result, the Mintel forecast complements a rigorous statistical process with in-depth market
knowledge and expertise to allow for additional factors or market conditions outside of the capacity of
the statistical forecast.
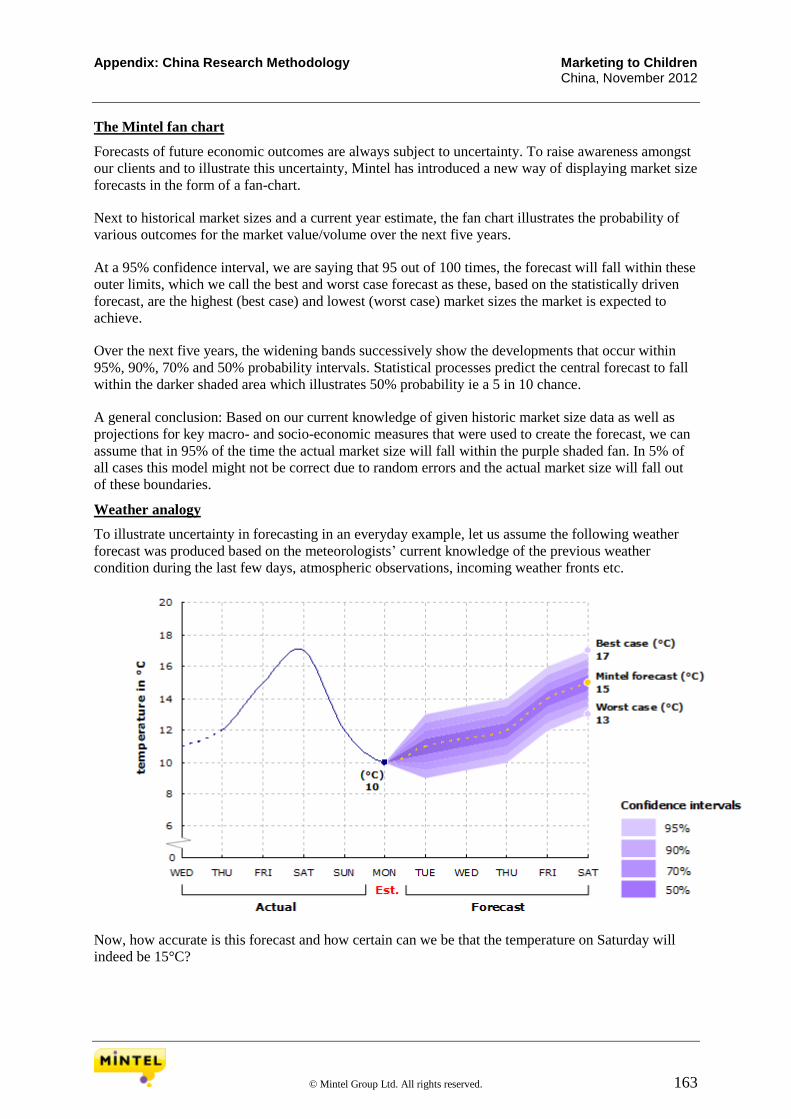
Appendix: China Research Methodology Marketing to Children China, November 2012
© Mintel Group Ltd. All rights reserved. 163
The Mintel fan chart
Forecasts of future economic outcomes are always subject to uncertainty. To raise awareness amongst
our clients and to illustrate this uncertainty, Mintel has introduced a new way of displaying market size
forecasts in the form of a fan-chart.
Next to historical market sizes and a current year estimate, the fan chart illustrates the probability of
various outcomes for the market value/volume over the next five years.
At a 95% confidence interval, we are saying that 95 out of 100 times, the forecast will fall within these
outer limits, which we call the best and worst case forecast as these, based on the statistically driven
forecast, are the highest (best case) and lowest (worst case) market sizes the market is expected to
achieve.
Over the next five years, the widening bands successively show the developments that occur within
95%, 90%, 70% and 50% probability intervals. Statistical processes predict the central forecast to fall
within the darker shaded area which illustrates 50% probability ie a 5 in 10 chance.
A general conclusion: Based on our current knowledge of given historic market size data as well as
projections for key macro- and socio-economic measures that were used to create the forecast, we can
assume that in 95% of the time the actual market size will fall within the purple shaded fan. In 5% of
all cases this model might not be correct due to random errors and the actual market size will fall out
of these boundaries.
Weather analogy
To illustrate uncertainty in forecasting in an everyday example, let us assume the following weather
forecast was produced based on the meteorologists’ current knowledge of the previous weather
condition during the last few days, atmospheric observations, incoming weather fronts etc.
Now, how accurate is this forecast and how certain can we be that the temperature on Saturday will
indeed be 15°C?

Appendix: China Research Methodology Marketing to Children China, November 2012
© Mintel Group Ltd. All rights reserved. 164
To state that the temperature in central London on Saturday will rise to exactly 15°C is possible but
one can’t be 100% certain about that fact.
To say the temperature on Saturday will be between 13°C and 17°C is a broader statement and much
more probable.
In general, we can say that based on the existing statistical model, one can be 95% certain that the
temperature on Saturday will be between 13°C and 17°C, and respectively 50% certain it will be
between about 14.5°C and 15.5°C. Again, only in 5% of all cases this model might not be correct due
to random errors and the actual temperature on Saturday will fall out of these boundaries and thus will
be below 13°C or above 17°C.
(To learn more about uncertainty in weather forecasts visit:
http://research.metoffice.gov.uk/research/nwp/ensemble/uncertainty.html)