markets and the environment - uc3mbaobab.uc3m.es/monet/monnet/img/pdf/mercadosymedio... · and if...
TRANSCRIPT
Markets and the Environment
Academic year 2015/16Fall Term
Organizational Issues
Evaluation
Final exam 60% (up to 100% in 2a convocatoria)
Midterm exam 30%
Problem sets and class participation 10%
Web resourcesAll course materials (syllabus with references, slides, exercises etc.) will beposted on Aula Global
aulaglobal.uc3m.es
TextbookKolstad, Charles (2011), Intermediate Environmental Economics,International 2nd Edition, Oxford University Press.
Markets and the Environment : 2

Markets and the Environment: Central questions
Fundamental problem in economics:How to allocate goods and scarce resources in an optimal fashion?
Natural Resource Economics:
At what moment should we use how much of our resources?(optimal intertemporal allocation)
Environmental Economics:
Do market mechanisms lead to optimal resource use? Or are theremarket failures?
And if the market fails to allocate resources optimally, how can wecorrect this failure?
Markets and the Environment : 3

Markets and the Environment: Course Program
1 Introduction2 Resource Management
I Non-renewable resourcesI Renewable resources
3 Instruments for correcting market failuresI The optimal level of pollutionI Interventionist solutionsI Market instruments
4 Valuation of natural resourcesI Revealed preferencesI Stated preferencesI Cost Benefit Analysis
5 International aspects and international environmental agreements
Markets and the Environment : 4

Topic 1Introduction
1 Functions of the environment
2 Market failures
3 Environmental regulation
4 International aspects
5 Growth and sustainability
Markets and the Environment Introduction: 5

1. Functions of the environment
provider of resources
receptor of residuals
generator of utility
Markets and the Environment Introduction: Functions of the environment 6
2. Market failures
Fundamental problem in economics:How to allocate goods and scarce resources efficiently?
First Theorem of Welfare Economics
The allocation of scarce resources through competitive markets is Paretoefficient if market prices exist for each good and they reflect the socialopportunity cost of resource use.
Markets and the Environment Introduction: Market failures 7

2. Market failures
The market equilibrium maximizes the sum of consumer surplus andproducer surplus.
Markets and the Environment Introduction: Market failures 8
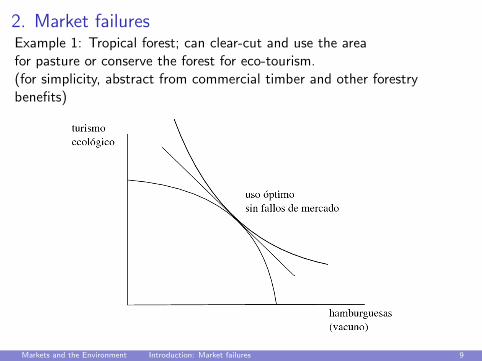
2. Market failuresExample 1: Tropical forest; can clear-cut and use the areafor pasture or conserve the forest for eco-tourism.(for simplicity, abstract from commercial timber and other forestrybenefits)
Markets and the Environment Introduction: Market failures 9
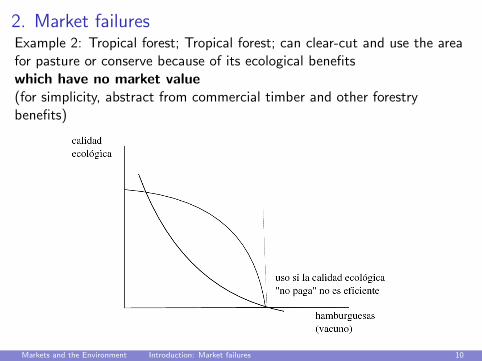
2. Market failuresExample 2: Tropical forest; Tropical forest; can clear-cut and use the areafor pasture or conserve because of its ecological benefitswhich have no market value(for simplicity, abstract from commercial timber and other forestrybenefits)
Markets and the Environment Introduction: Market failures 10
2. Market failures
Why do market prices not always reflect the economic value andopportunity cost of goods, giving rise to inefficient allocations?
Market failures:
externalities
public goods
asymmetric information
market power
non convexities
Markets and the Environment Introduction: Market failures 11

2. Market failures: Externalities
When the economic activity of one agent affects the profits or welfareof another agent and this effect is not properly reflected in prices,the level of economic activity is not optimal.
Markets and the Environment Introduction: Market failures 12

2. Market failures: Public goods and the commons
When a good is non rival and/or not excludable in consumption, thefollowing problems arise:
non rivalry: the social benefits of the good are given by the sum of allindividual WTPs
Markets and the Environment Introduction: Market failures 13
2. Market failures: Public goods and the commons
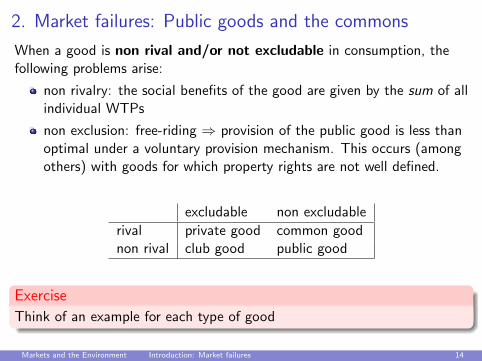
When a good is non rival and/or not excludable in consumption, thefollowing problems arise:
non rivalry: the social benefits of the good are given by the sum of allindividual WTPs
non exclusion: free-riding ⇒ provision of the public good is less thanoptimal under a voluntary provision mechanism. This occurs (amongothers) with goods for which property rights are not well defined.
excludable non excludable
rival private good common goodnon rival club good public good
Exercise
Think of an example for each type of good
Markets and the Environment Introduction: Market failures 14

3. Environmental regulationRegulatory instruments
Most prominent market failures in the use of natural resources:
externalities: pollution of the air, water and soil
public goods: transboundary pollution (climate change, ozone layer...)
Environmental policy aims at correcting these market failures.
national level: taxes, standards, tradable permits
international scale: international agreements between souvereign states toprotect the environment.
Markets and the Environment Introduction: Environmental regulation 15

3. Environmental regulationCost benefit analysis
Environmental regulation
Costs R Benefits
Economists: choose the policy that maximizes Benefits−Costs.To do this, it’s necessary to estimate the costs and benefits associatedwith the measures under consideration.
Markets and the Environment Introduction: Environmental regulation 16

3. Environmental regulationValuation
Environmental policy aims at improving air quality, water quality and theeco-system.⇒ these are non-market goods and amenities, so they have no marketprice.
Fundamental problem in cost-benefit analysis: How to compare the costand the benefits of a measure when the latter are not measured inmonetary terms (e.g. avoided deaths or diseases)?
⇒ Need to “translate” environmental benefits into monetary values.For a given measure, figure out willingness-to-pay (WTP) for the benefitsamong those who pay for its costs. Methods:
Stated preferences: surveys about WTP
Revealed preferences: infer WTP from other choices that peoplemake and which involve similar trade-offs.
Markets and the Environment Introduction: Environmental regulation 17

4. International aspects and multilateral agreements
Transboundary environmental problems
Examples: pollution of oceans and rivers, climate change, depletion ofthe stratospheric ozone layer, ...
Each country indiviudally has an incentive to overuse the commonresource.
⇒ countries are souvereign and they can behave strategically
Question:
Is it possible that all souvereign countries cooperate to ensure anefficient use of natural resources?
If so, what aspects are important in designing a multilateralagreement of cooperation?
If it’s not possible, what is the level of cooperation that aninternational treaty such as the Kyoto Protocol can achieve?
Markets and the Environment Introduction: International aspects 18
5. Growth and sustainability
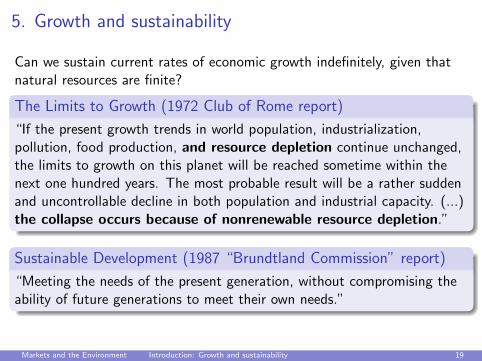
Can we sustain current rates of economic growth indefinitely, given thatnatural resources are finite?
The Limits to Growth (1972 Club of Rome report)
“If the present growth trends in world population, industrialization,pollution, food production, and resource depletion continue unchanged,the limits to growth on this planet will be reached sometime within thenext one hundred years. The most probable result will be a rather suddenand uncontrollable decline in both population and industrial capacity. (...)the collapse occurs because of nonrenewable resource depletion.”
Sustainable Development (1987 “Brundtland Commission” report)
“Meeting the needs of the present generation, without compromising theability of future generations to meet their own needs.”
Markets and the Environment Introduction: Growth and sustainability 19

5. Growth and sustainability:
Pessimist view: (Malthus, Club of Rome, environmentalist groups, ... )
growth of population / production requires ever more resources
⇒ eventually using up the resources with severe consequences for thequality of life
⇒ some are in favor of “zero growth”
Optimistic view: (many economists,...)
market forces prevent exhaustion of non-renewable resources:
reserves ↓MC of extraction ↑
}⇒ price ↑⇒
demand ↓alternative resources,technologies for substitutionand recycling ↑
point out that environmental quality tends to rise with per-capitaincome in developed countries (“Kuznets curve”)
Markets and the Environment Introduction: Growth and sustainability 20

5. Growth and sustainability
If technological change and alternative resources can replace naturalcapital, why should we preserve it?
Reasons
Natural capital necessary for the construction of built capital,substitutes not always available
Uncertainty about when new technologies become available tosubstitute natural resources
Scientific uncertainty and irreversibility
Natural capital can improve capacity to adapt to environmentalshocks
Intergenerational equity
Ethical concerns
Market failure: without intervention, resources will be overused
Markets and the Environment Introduction: Growth and sustainability 21

Topic 2Natural Resource Management
1 International Treaties
2 International Trade and the Environment
Markets and the Environment Natural Resource Management: 22

Natural resources: Concept and typology
Natural resources: goods provided by nature (not manmade) thatare consumed or used in the production of other goods; “naturalcapital”.
Non-renewable resources: use or consumption leads to a permanentreduction in the stock, as there is no regeneration (or whoseregeneration would take excessive amounts of time).Ex.: fossil fuels such as oil
Non-renewable resources with recyclable services: use orconsumption leads to a reduction in the stock which is subsequently(partially) reverted or transformed into another useful state by meansof an industrial process of recovery (reuse or recycling).Ex.: aluminium, waste water
Renewable resources: their use or consumption does not lead totheir exhaustion because of the ability to regenerate. The stock canincrease or decrease, depending on the quantity used.Ex.: forests, surface water, fisheries, atmospheric air
Markets and the Environment Natural Resource Management: Natural resources: Concept and typology 23

Natural Resource Management:Non-renewable resources (NRR)
1 International Treaties
2 International Trade and the Environment
Markets and the Environment Natural Resource Management: Non-renewable resources 24
1. Non-renewable resources: Concept
Non-renewable resources(NRR)
Usage or consumption of a unit of the NRR entails the destruction of thesame unit of reserves, and its regeneration would take an immense amountof time.
Essential questions: What is...
the rate of extraction that gives rise to an optimal exploitation of theNRR?
optimal period of time for depleting the resource stocks?
also: question of intergenerational equity
Markets and the Environment Natural Resource Management: Non-renewable resources 25

1. Non-renewable resources: Concept
Demand: for direct consumption ( U = U(C ,Z ) ) and for theproduction of other consumption goods ( Q = f (K , L,Z ) ).
Price elasticity of demand: depends on the availability of substitutegoods
Supply: Resource deposits are limited and possibly not all of themare known. The reserves are known deposits of adequate quality to beused with current technology; they determine the supply. Offer curve:P = CMg where..
Opportunity cost: costs of extraction of the resource + user costs(foregone future profits. )
Markets and the Environment Natural Resource Management: Non-renewable resources 26
2. The Hotelling Rule
Assumptions:
Exact amount of the resource stock (R) is known
Zero extraction cost
Amount of resource extracted has no influence on the price(individual acts in perfect competition)
Price is a known function p(t) of time
Markets and the Environment Natural Resource Management: Non-renewable resources 27
2. The Hotelling Rule
Hotelling: Resource owners have two options
1 extract resource and putproceeds in the bank⇒ interests
2 leave resource in the groundwhile its value appreciates
Exercise
What are the opportunity costs of each of the two alternatives?
Markets and the Environment Natural Resource Management: Non-renewable resources 28

2. The Hotelling Rule
If p1 > p0(1 + r) it is beneficial to extract in t = 1If p1 < p0(1 + r) it is beneficial to extract in t = 0
Markets and the Environment Natural Resource Management: Non-renewable resources 29

2. The Hotelling RuleSmall quantity, 2 periods, no extraction cost
Example
Normalize the endowment of the resource owner to 1 unit. She can sell itin t = 0 (“now”) or in t = 1 (“tomorrow”).
t 0 1
p(t) 120 130
The risk-free interest rate equals r = 10% and marginal extraction costc = 0.
Compare the benefit of selling “now ”p0 = 120 with the present value ofselling “tomorrow” p1
1+r = 118, 18 ⇒ sell now.
Markets and the Environment Natural Resource Management: Non-renewable resources 30

2. The Hotelling RuleSmall quantity, 2 periods, positive extraction cost
Exercise
What is the profit-maximizing decision if the owner of one unit of theresource has a cost of c = 40?The interest rate is r = 10% and prices are as in the previous example.
t 0 1
p(t) 120 130
Solution: Table after subtracting extraction cost:t 0 1
p(t) 80 90Sell today: 80. Sell tomorrow: 90/1, 1 = 81, 81 > 80, hence sellingtomorrow is the better option.
Markets and the Environment Natural Resource Management: Non-renewable resources 31
2. The Hotelling RuleAll reserves, 2 periods, no extraction cost
So far: individual decision in a market with perfect competition.Now consider the entire resource-depleting industry:
si p0 > (<) p11+r ⇒ all owners want to sell “now” (“tomorrow”)
⇒ supply “now” increases (declines) by a lot
⇒ relative prices have to change until equilibrium obtains where
p0 =p1
1 + r
indifference between extracting and postponing: market interest rateequals the rate of appreciation of the resource in situ.
Markets and the Environment Natural Resource Management: Non-renewable resources 32
2. The Hotelling RuleEquilibrium price path
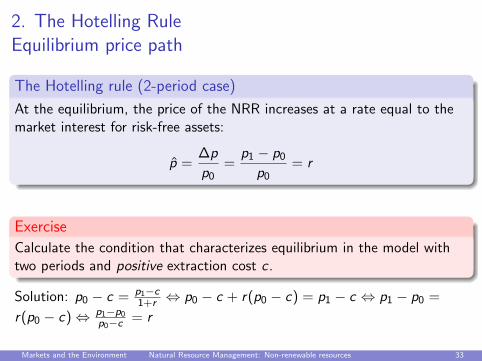
The Hotelling rule (2-period case)
At the equilibrium, the price of the NRR increases at a rate equal to themarket interest for risk-free assets:
p =∆p
p0=
p1 − p0p0
= r
Exercise
Calculate the condition that characterizes equilibrium in the model withtwo periods and positive extraction cost c .
Solution: p0 − c = p1−c1+r ⇔ p0 − c + r(p0 − c) = p1 − c ⇔ p1 − p0 =
r(p0 − c)⇔ p1−p0p0−c = r
Markets and the Environment Natural Resource Management: Non-renewable resources 33

2. The Hotelling RuleContinuous time, no extraction costIn reality, there are more than 2 periods when resources can be sold, andresource owners can own more than a single unit.At every moment t choose the extraction level Z (t) ≥ 0 such that thepresent discounted value of the resource∫
p(t)Z (t)e−rtdt
is maximized subject to the limited stock R of the resource.∫Z (t)dt = R.
⇒ Dynamic optimization problem with
control variable Z and state variable R
equation of motion: R(t) = −Z (t)
initial condition: R(0) = R and terminal condition: R(T ) ≥ 0
Markets and the Environment Natural Resource Management: Non-renewable resources 34

2. The Hotelling RuleContinuous time, no extraction cost
The optimal solution requires that p(t) = ertp0, whence
The Hotelling Rule (in continuous time)
The price of the NNR increases at a rate equal to the market rate ofinterest on risk-free assets:
p =p
p=
rertp0ertp0
= r
And the quantity sold?The present value of a unit of the resource is equal at every moment,that’s how we obtain a continuous supply of the resource (instead ofeverything now or in the indefinite future)
Markets and the Environment Natural Resource Management: Non-renewable resources 35
2. The Hotelling Rule
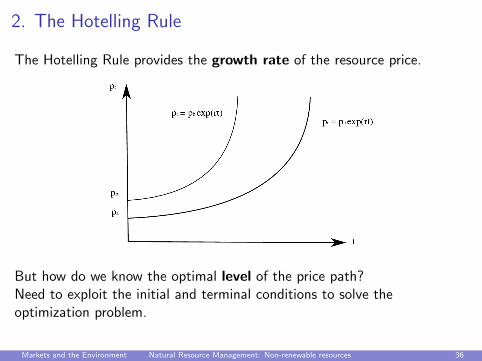
The Hotelling Rule provides the growth rate of the resource price.
But how do we know the optimal level of the price path?Need to exploit the initial and terminal conditions to solve theoptimization problem.
Markets and the Environment Natural Resource Management: Non-renewable resources 36
2. The Hotelling Rule
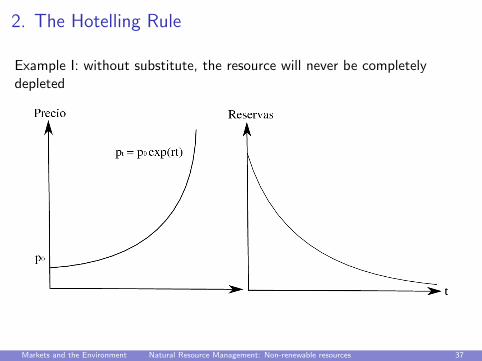
Example I: without substitute, the resource will never be completelydepleted
Markets and the Environment Natural Resource Management: Non-renewable resources 37

2. The Hotelling Rule
Example II: if there is a substitute with cost ps , the resource will bedepleted when the resource price reaches this level
Markets and the Environment Natural Resource Management: Non-renewable resources 38

2. Non-renewable resources: optimal extractionReference scenario:the optimal use of the resource maximizes welfare W in the society(including future generations!)
maxW =
∫Ut(Z (t)) · e−ρtdt
Assumptions:
U(Z ) is the net utility of all uses of the resource Z , be it inconsumption or productionW is additive in utility Ut over time(this assumption is not undisputed but it guarantees a Paretooptimum)U ′ > 0 y U ′′ < 0social discount rate ρ > 0 (somewhat controversial)
subject to
∫Z (t)dt = R , Z (t) ≥ 0
Markets and the Environment Natural Resource Management: Non-renewable resources 39
2. Non-renewable resources: optimal extraction
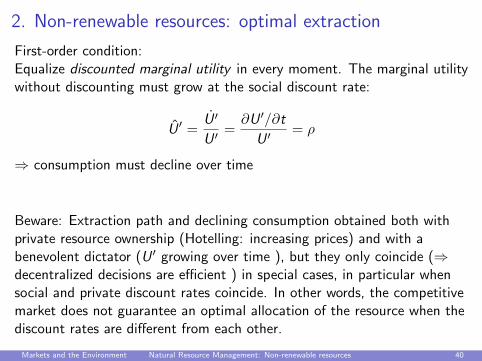
First-order condition:Equalize discounted marginal utility in every moment. The marginal utilitywithout discounting must grow at the social discount rate:
U ′ =U ′
U ′=∂U ′/∂t
U ′= ρ
⇒ consumption must decline over time
Beware: Extraction path and declining consumption obtained both withprivate resource ownership (Hotelling: increasing prices) and with abenevolent dictator (U ′ growing over time ), but they only coincide (⇒decentralized decisions are efficient ) in special cases, in particular whensocial and private discount rates coincide. In other words, the competitivemarket does not guarantee an optimal allocation of the resource when thediscount rates are different from each other.
Markets and the Environment Natural Resource Management: Non-renewable resources 40
3. Comparative statics
with respect to
1 discount rate
2 backstop technology
3 total resource stock
4 extraction costs
5 demand for the NRR
Markets and the Environment Natural Resource Management: Non-renewable resources 41
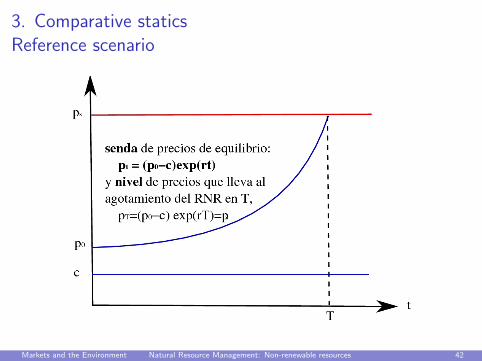
3. Comparative staticsReference scenario
Markets and the Environment Natural Resource Management: Non-renewable resources 42

3. Comparative staticsThe discount rate
Markets and the Environment Natural Resource Management: Non-renewable resources 43

3. Comparative staticsBackstop technology
Markets and the Environment Natural Resource Management: Non-renewable resources 44

3. Comparative staticsTotal stock of NRR
Markets and the Environment Natural Resource Management: Non-renewable resources 45

3. Comparative staticsTotal stock of NRR
Markets and the Environment Natural Resource Management: Non-renewable resources 46
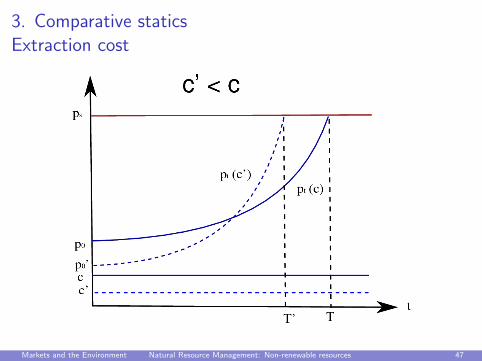
3. Comparative staticsExtraction cost
Markets and the Environment Natural Resource Management: Non-renewable resources 47

3. Comparative staticsDemand for the NRR
Markets and the Environment Natural Resource Management: Non-renewable resources 48
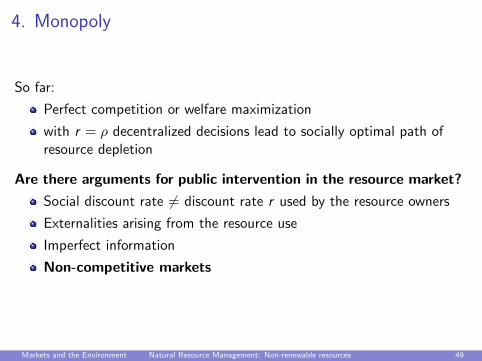
4. Monopoly
So far:
Perfect competition or welfare maximization
with r = ρ decentralized decisions lead to socially optimal path ofresource depletion
Are there arguments for public intervention in the resource market?
Social discount rate 6= discount rate r used by the resource owners
Externalities arising from the resource use
Imperfect information
Non-competitive markets
Markets and the Environment Natural Resource Management: Non-renewable resources 49
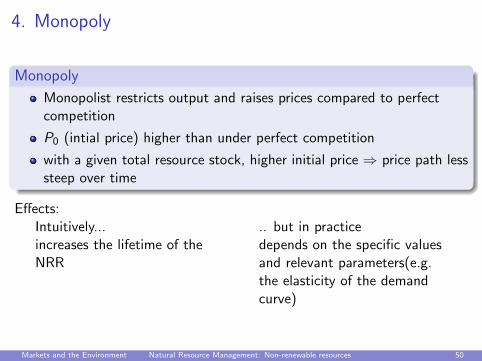
4. Monopoly
Monopoly
Monopolist restricts output and raises prices compared to perfectcompetition
P0 (intial price) higher than under perfect competition
with a given total resource stock, higher initial price ⇒ price path lesssteep over time
Effects:Intuitively...increases the lifetime of theNRR
.. but in practicedepends on the specific valuesand relevant parameters(e.g.the elasticity of the demandcurve)
Markets and the Environment Natural Resource Management: Non-renewable resources 50

4. Monopoly and the extraction rate
Markets and the Environment Natural Resource Management: Non-renewable resources 51

5. Recycling
If after being used or consumed a resource preserves certain physical orchemical properties etc.
⇒ the material can be recovered
Recycling...
increases total supply of the resource
reduces the quantity that needs to be extracted
⇒ extends the lifetime of the resource
buys us time for discovering substitutes
Recycling and sustainability
Recycling allows us to produce more while extracting smaller amounts ofscarce resources.
Markets and the Environment Natural Resource Management: Non-renewable resources 52
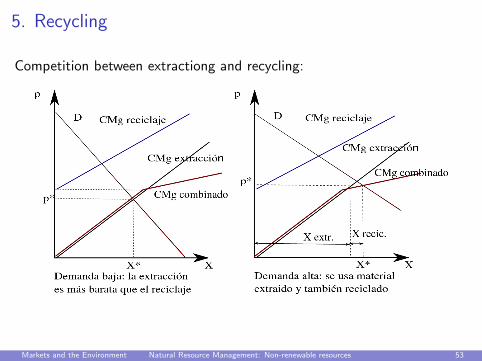
5. Recycling
Competition between extractiong and recycling:
Markets and the Environment Natural Resource Management: Non-renewable resources 53
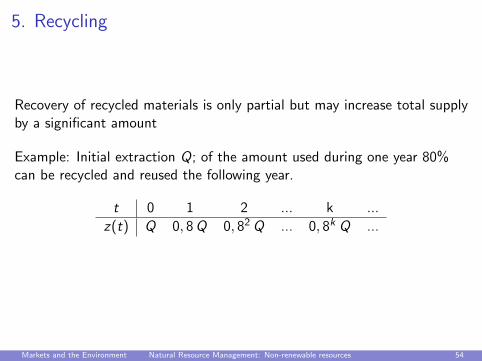
5. Recycling
Recovery of recycled materials is only partial but may increase total supplyby a significant amount
Example: Initial extraction Q; of the amount used during one year 80%can be recycled and reused the following year.
t 0 1 2 ... k ...
z(t) Q 0, 8Q 0, 82Q ... 0, 8k Q ...
Markets and the Environment Natural Resource Management: Non-renewable resources 54

5. Recycling
Total use:
Z =T∑i=0
z(t) = Q(1 + 0, 8 + 0, 82 + ...+ 0, 8T )
0, 8Z = Q(0, 8 + 0, 82 + 0, 83 + ...+ 0, 8T+1)
Z − 0, 8Z = Q(1− 0, 8T+1)
Z = Q1− 0, 8T+1
1− 0, 8
limT→∞
Z =Q
1− 0, 8= 5Q
limT→∞
Z =Q
1− recycling rate
Markets and the Environment Natural Resource Management: Non-renewable resources 55

5. Recycling
Consumer decisions:
Buy and throw away Buy and recycle
Price 100 100Marginal Benefit to consumer 160 160Net utility 60 60
Costs of final depositprivate 10 40environmental damage 40 0value of recycled material none 20
Net Benefitsprivate 50 20social 10 40
How can be consumers be given incentives for recycling?
Tax household waste
introduce deposit programs on recyclable containers
Markets and the Environment Natural Resource Management: Non-renewable resources 56
Natural Resource Management:Renewable resources (RR)
1 International Treaties
2 International Trade and the Environment
Markets and the Environment Natural Resource Management: Renewable resources 57

1. Renewable resources: concept
Renewable resources
Usage or consumption entails a reduction in the stock, but over time theresource stock regenerates itself.
renewable resource flowI e.g. solar energy (photovoltaic or thermal), windI usage does not lead to resource depletion
renewable resource stockI e.g. fisheries, forests, atmosphere, soilsI regeneration follows a biological, physical or chemical processI usage can lead to resource depletion
Markets and the Environment Natural Resource Management: Renewable resources 58
1. Renewable resources: Concept
Sustainable usage level: does not compromise the future availabilityof the renewable resource stock
Long-term problem: maximize social welfare
Problem of resource depletion: avoid definitive extinction
we use “bio-economic models”: it’s key to know the natural growthrate in order to decide on the rate of exploitation
typical cases:I fisheries (rapid growth)I forests (slow growth)
Markets and the Environment Natural Resource Management: Renewable resources 59
2. Growth and renewable resource use
Example: fisheries
Area where a population of fish (a particular species) resides andwhere several firms undertake fishing activities.
Mobile resource: difficult to assign property rights
Bio-economic model: Natural growth curve F (X )
Total growth of the stock: Xt+1 − Xt = F (X )− Y
“Carrying capacity” Xmax of the system: An equilibrium whereavailability of food and other natural factors limit further growth ofthe stock X
Sustainable catch/harvest: quantity caught in a period, Y= natural growth of the resource in this period, F (X )
Markets and the Environment Natural Resource Management: Renewable resources 60
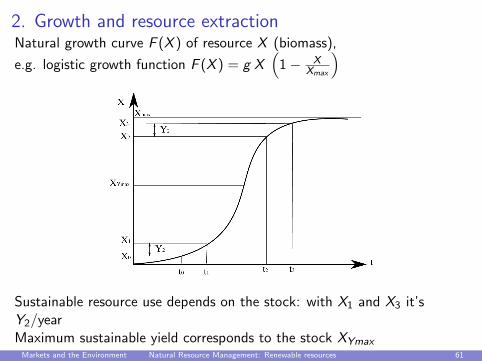
2. Growth and resource extractionNatural growth curve F (X ) of resource X (biomass),
e.g. logistic growth function F (X ) = g X(
1− XXmax
)
Sustainable resource use depends on the stock: with X1 and X3 it’sY2/yearMaximum sustainable yield corresponds to the stock XYmaxMarkets and the Environment Natural Resource Management: Renewable resources 61
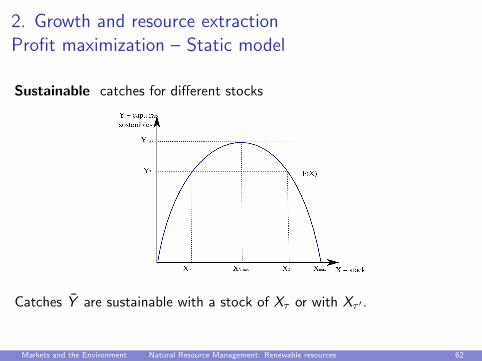
2. Growth and resource extractionProfit maximization – Static model
Sustainable catches for different stocks
Catches Y are sustainable with a stock of Xτ or with Xτ ′ .
Markets and the Environment Natural Resource Management: Renewable resources 62

2. Growth and resource extractionProfit maximization – Static model with a single resourceowner
What size of the resource stock maximizes the static profits (in a singleperiod), if it is extracted in a sustainable way?
⇒ maximize (revenue – cost) as a function of X
sustainable revenue?I sustainable catch Y = growth of the biomass as a function of the
stock F (X )→ Sustainable revenues I = p · Y
assumptions: perfect competition, p constant
cost of harvest Y ?I when the stock X is small, more effort is needed to extract Y (use
more trawlers, spend more time at sea, etc.)→ the cost of harvesting diminishes as X increases
Markets and the Environment Natural Resource Management: Renewable resources 63

2. Growth and resource extractionProfit maximization – Static model
Maximum profit at X ∗, where MR=MC.X ∗ different from the maximum sustainable yield with stock XYmax .
Markets and the Environment Natural Resource Management: Renewable resources 64

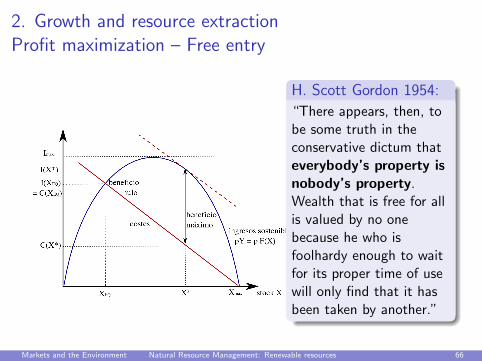
2. Growth and resource extractionProfit maximization – Free entry
Without owner of the resouce (ill-defined property rights) individualfishermen have no incentive to maximize social welfare
⇒ keep fishing as long as profits are positive :until XEQ < X ∗ where the profit becomes 0 as revenue exactly coversthe cost.
In the bio-economic equilibrium XEQ , there is over-exploitation of theresource compared to the socially efficient equilibrium X ∗
Although there is no extinction, the system is less stable and morevulnerable towards it, e.g. if the natural growth rate of the fishpopulation is over-estimated.
Markets and the Environment Natural Resource Management: Renewable resources 65
2. Growth and resource extractionProfit maximization – Free entry
H. Scott Gordon 1954:
“There appears, then, tobe some truth in theconservative dictum thateverybody’s property isnobody’s property.Wealth that is free for allis valued by no onebecause he who isfoolhardy enough to waitfor its proper time of usewill only find that it hasbeen taken by another.”
Markets and the Environment Natural Resource Management: Renewable resources 66

2. Growth and resource extractionProfit maximization – Negative externalities
Markets and the Environment Natural Resource Management: Renewable resources 67

2. Growth and resource extractionProfit maximization – Negative externalities
With negative externalities (e.g. disequilibrium in the food chain or famineof native people who subsist on the basis of the fish grounds. )
optimal catch at X ∗∗, equalizes social MC = MR
X ∗∗ > X ∗, private profits are smaller, social benefits are larger, andthe negative externality is smaller.
How to internalize the externalities in the production costs? answer:taxes, tradable catch quotas etc.
Markets and the Environment Natural Resource Management: Renewable resources 68

2. Growth and resource extractionProfit maximization – two-period model
Dynamic model: maximize the present value of profits (resource owner’sproblem with free entry, or social planner’s problem).Intertemporal consequences of increasing the catch?
increase catch today dYt > 0
⇒ diminish stock in the next period dXt+1 < 0
⇒ affects the speed of recovery of the resource F (X )
Markets and the Environment Natural Resource Management: Renewable resources 69
2. Growth and resource extractionProfit maximization – two-period model
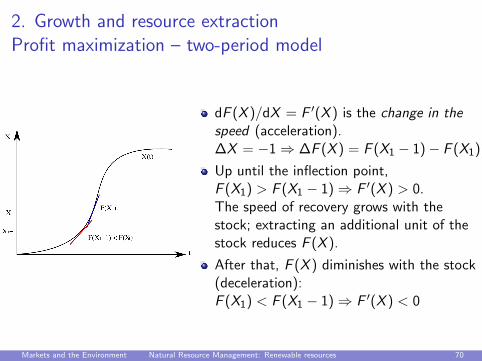
dF (X )/dX = F ′(X ) is the change in thespeed (acceleration).∆X = −1⇒ ∆F (X ) = F (X1 − 1)− F (X1)
Up until the inflection point,F (X1) > F (X1 − 1)⇒ F ′(X ) > 0.The speed of recovery grows with thestock; extracting an additional unit of thestock reduces F (X ).
After that, F (X ) diminishes with the stock(deceleration):F (X1) < F (X1 − 1)⇒ F ′(X ) < 0
Markets and the Environment Natural Resource Management: Renewable resources 70

2. Growth and resource extractionProfit maximization – two-period model
Two periods t0, t1, no extraction costs, all expressions in future values.Intertemporal consequences of increasing the catch in t0?
MR of catching an additional fish in t0: p0(1 + r)
MC of not catching that fish in t1 and foregone regeneration:p1 + p1F
′(X ) = p1 + p0F′(X ) + ∆pF ′(X ).
For ∆ p F ′ close to 0 → CMg ≈ p1 + p0F′(x)
Decision:I If MR> (<)MC ⇒ increase (decrease) the catch in t = 0I If MR = MC ⇒ indifferent about changes catches
⇒ for there to be a continuous supply in equilibrium, prices in the twoyears have to satisfy: p0(1 + r) = p1 + p0 F′(x)
Markets and the Environment Natural Resource Management: Renewable resources 71

2. Growth and resource extractionProfit maximization – two-period model
Using the equilibrium condition: p0(1 + r) = p1 + p0 F′(x) we can
calculate the following
Fundamental equation (two-period model)
Optimal exploitation of a renewable resource satisfies
∆p
p0+ F′(x) = r
Economic interpretation: Conservation of one unit of the renewableresource offers two returns:
the increase in the price of this unit
the change in the rate of regeneration of the stock
The sum must be equal to the return to the best alternative (interest rate)
Markets and the Environment Natural Resource Management: Renewable resources 72
2. Growth and resource extractionProfit maximization – dynamic model
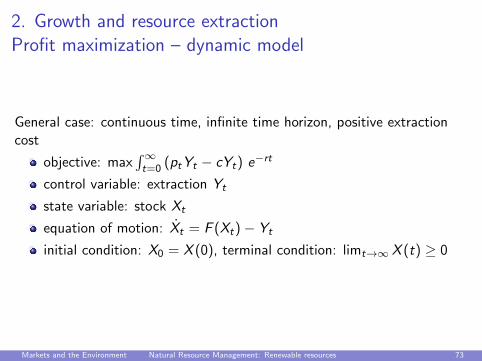
General case: continuous time, infinite time horizon, positive extractioncost
objective: max∫∞t=0 (ptYt − cYt) e−rt
control variable: extraction Yt
state variable: stock Xt
equation of motion: Xt = F (Xt)− Yt
initial condition: X0 = X (0), terminal condition: limt→∞ X (t) ≥ 0
Markets and the Environment Natural Resource Management: Renewable resources 73

2. Growth and resource extractionConsequences of the fundamental equation
Fundamental equation (Continuous-time model)
p
pt − c+ F ′(x) = r
The larger the price and the smaller the extraction cost,the smaller the first termIf r is constant, the resource owner requires a larger F ′(X )⇒ X ∗ is smaller
the larger the discount rate, the smaller will be X ∗
the larger F ′(X ), the smaller is X ∗.
Markets and the Environment Natural Resource Management: Renewable resources 74
3. Fishery policy in the European Union
The EU, like many other national governments, regulates the exploitationof fishing grounds because of two problems:
Over-fishing (and risk of extinction)
Excess capacity in the fishing fleet (excessive fixed cost)
Markets and the Environment Natural Resource Management: Renewable resources 75

3. Fishery policy in the European Union
Multi-year program with measures to mitigate...I ... overfishing: Total Admissible Catch (TAC);
admissible quantity that can be harvested of a given species in a givenarea in one ear
I ... excess effort: Total Admissible Effort (TAE);effort = capacity (size of the boat and engine) per time of activity
The TAC and TAE are subdivided in national quotas, and EUcountries can manage their quotas in different ways (subsidiarityprinciple)
Problem: TAC and TAE are political decisions, and do not necessarilycorrespond to bio-economic principles
Markets and the Environment Natural Resource Management: Renewable resources 76
3. Fishery policy
Other measures aimed at reducing overfishing and excess effort:
1 Regulation of utilized technology
2 Individual transferrable quotas (ITQ)
3 Taxation:raise the cost of effort to reduce the profit-maximizing effort level
Markets and the Environment Natural Resource Management: Renewable resources 77

3. Fishery policy
Regulation via taxation
Private benefits before and after taxes,Tax revenue = social welfare
Markets and the Environment Natural Resource Management: Renewable resources 78
4. Economic aspects of forest management
Special characteristics of forests (compared e.g. with fisheries):
Prolonged period of regeneration(depending on the species, environmental factors and humaninfluences)
multiple functions:I productive/commercial (plantations)I leisure/recreationI environmental
⇒ external effects due to its multiple functions
easier to control than fisheries because not a mobile resource
need land ⇒ opportunity cost
traditionally no partial extraction, all trees of forest were cut at thesame time
Markets and the Environment Natural Resource Management: Renewable resources 79

4. Economic aspects of forest managementForest growth:
Average product of the resource (by time period) X (t)/tMarginal product of the resource X ′(t)average product is maximized if X (t)/t = X ′(t)Maximum sustainable yield (MSY)
Markets and the Environment Natural Resource Management: Renewable resources 80
4. Economic aspects of forest management
Central question in forest management
determine the optimal timing for cutting the trees, the “optimalrotation time”
Two different criteria:
1 Optimal biological rotation time maximizes the average product
2 Optimal economic rotation time also takes into account the costs (ofplanting, maintaining, cutting and opportunity cost of land use) anddiscounting
Markets and the Environment Natural Resource Management: Renewable resources 81
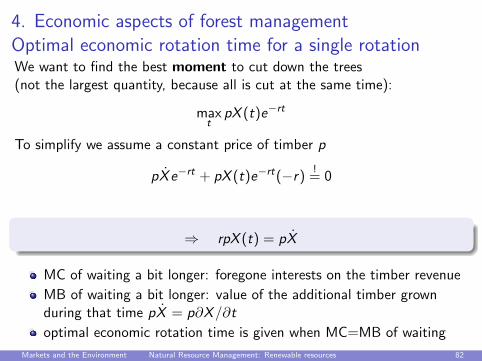
4. Economic aspects of forest managementOptimal economic rotation time for a single rotationWe want to find the best moment to cut down the trees(not the largest quantity, because all is cut at the same time):
maxt
pX (t)e−rt
To simplify we assume a constant price of timber p
pX e−rt + pX (t)e−rt(−r)!
= 0
⇒ rpX (t) = pX
MC of waiting a bit longer: foregone interests on the timber revenue
MB of waiting a bit longer: value of the additional timber grownduring that time pX = p∂X/∂t
optimal economic rotation time is given when MC=MB of waiting
Markets and the Environment Natural Resource Management: Renewable resources 82
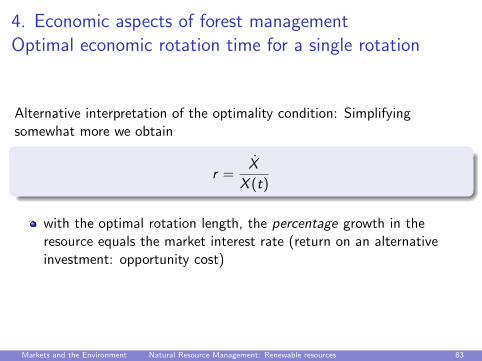
4. Economic aspects of forest managementOptimal economic rotation time for a single rotation
Alternative interpretation of the optimality condition: Simplifyingsomewhat more we obtain
r =X
X (t)
with the optimal rotation length, the percentage growth in theresource equals the market interest rate (return on an alternativeinvestment: opportunity cost)
Markets and the Environment Natural Resource Management: Renewable resources 83

4. Economic aspects of forest managementOptimal economic rotation length with an infinite series ofrotations
What to do when all trees were cut?
plant new trees or
sell the landmaximum price = present-discounted value of all future plantations
Delaying the harvest by one period also delays all following harvests (orthe sale of the land): using the land for one more period has anopportunity cost
Markets and the Environment Natural Resource Management: Renewable resources 84
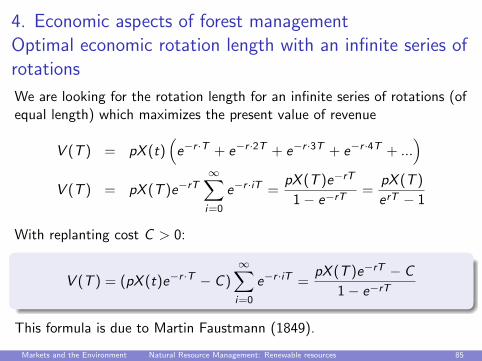
4. Economic aspects of forest managementOptimal economic rotation length with an infinite series ofrotations
We are looking for the rotation length for an infinite series of rotations (ofequal length) which maximizes the present value of revenue
V (T ) = pX (t)(e−r ·T + e−r ·2T + e−r ·3T + e−r ·4T + ...
)V (T ) = pX (T )e−rT
∞∑i=0
e−r ·iT =pX (T )e−rT
1− e−rT=
pX (T )
erT − 1
With replanting cost C > 0:
V (T ) = (pX (t)e−r ·T − C )∞∑i=0
e−r ·iT =pX (T )e−rT − C
1− e−rT
This formula is due to Martin Faustmann (1849).
Markets and the Environment Natural Resource Management: Renewable resources 85
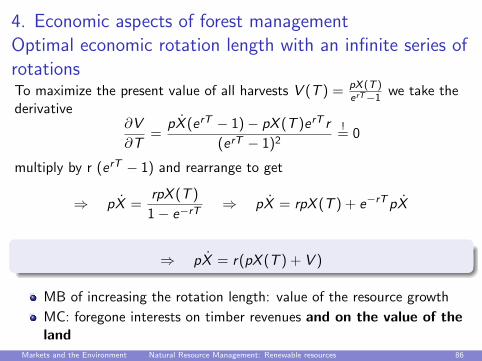
4. Economic aspects of forest managementOptimal economic rotation length with an infinite series ofrotationsTo maximize the present value of all harvests V (T ) = pX (T )
erT−1 we take thederivative
∂V
∂T=
pX (erT − 1)− pX (T )erT r
(erT − 1)2!
= 0
multiply by r (erT − 1) and rearrange to get
⇒ pX =rpX (T )
1− e−rT⇒ pX = rpX (T ) + e−rTpX
⇒ pX = r(pX (T ) + V )
MB of increasing the rotation length: value of the resource growth
MC: foregone interests on timber revenues and on the value of theland
Markets and the Environment Natural Resource Management: Renewable resources 86
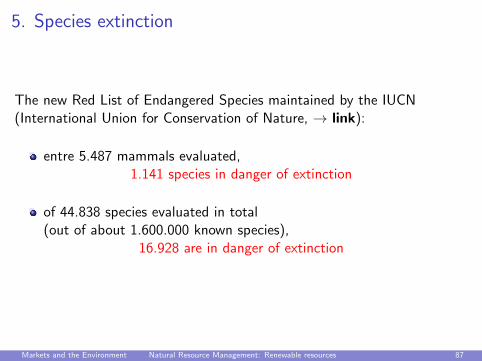
5. Species extinction
The new Red List of Endangered Species maintained by the IUCN(International Union for Conservation of Nature, → link):
entre 5.487 mammals evaluated,1.141 species in danger of extinction
of 44.838 species evaluated in total(out of about 1.600.000 known species),
16.928 are in danger of extinction
Markets and the Environment Natural Resource Management: Renewable resources 87
5. Species extinction
Renewable resources stock, if smaller than a minimum critical sizefaces the danger of extinction
These resources are at risk of extinction if the principle ofsustainability is not followed (extraction ≤ growth)
Extinction is irreversible
High discount rates threaten the survival of renewable resources,especially those that grow slowly
Markets and the Environment Natural Resource Management: Renewable resources 88

5. Species extinction
Economic arguments against species extinction:
Species generate direct benefits in terms of welfare.
Many present-day pharmaceuticals are derived from wild plants.
Wild plants are of critical importance for genetic diversity.
Living species fulfil many supportive functions for humanity.
Living species also serve as a basis for scientific research.
Markets and the Environment Natural Resource Management: Renewable resources 89

5. Species extinction
Economic drivers of species extinction
high resource prices
low extraction cost
low natural growth rates
high discount rates
open-access to the resource
high volatility in the natural growth rate
In many cases the extinction is a consequence not of direct exploitation ofa species but of the exploitation of and anthropogenic changes to itsnatural habitat.
⇒ Conflicting values: development versus conservation.
Markets and the Environment Natural Resource Management: Renewable resources 90

Tema 3Instruments for correcting
market failures
Markets and the Environment Instruments for correcting market failures: 91

Economics of Pollution
Anthropogenic environmental degradation:Inevitable by-product of many production processes and of theconsumption of many goods and services
What is the utility derivedfrom these goods and services?
←→ What is the cost of providingthis utility?
⇓Public policy
Determine the level of environmental quality that maximizes the differencebetween social welfare and social cost
Markets and the Environment Instruments for correcting market failures: 92
Economics of Pollution
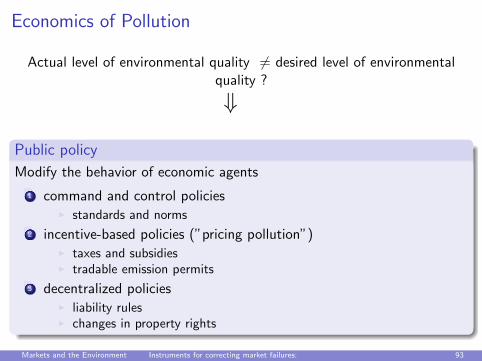
Actual level of environmental quality 6= desired level of environmentalquality ?
⇓
Public policy
Modify the behavior of economic agents
1 command and control policiesI standards and norms
2 incentive-based policies (”pricing pollution”)I taxes and subsidiesI tradable emission permits
3 decentralized policiesI liability rulesI changes in property rights
Markets and the Environment Instruments for correcting market failures: 93

Instruments for correctingmarket failures:
Optimal level pollution
Markets and the Environment Instruments for correcting market failures: Optimal level pollution 94
Optimal level pollution
Pollution is the archetypical negative externality
Pollution: Detrimental change in environmental quality
biological
chemical
acoustic
Remark: The use of natural resources causes many externalities. We lookat pollution as one example out of many.
Markets and the Environment Instruments for correcting market failures: Optimal level pollution 95

Optimal level pollution: Externalities
Externalities
An externality exists whenever the welfare of some agent, either a firm orhousehold, depends not only on his or her activities, but also on activitiesunder the control of some other agent who does not take into account theeffects of his actions on the other agent (they are external to his decisionproblem).
“Origin”: Economic activity, production or consumption
“Destination”: Third person not taken into account by the oneemitting the externality
Markets and the Environment Instruments for correcting market failures: Optimal level pollution 96

Optimal level pollution: Externalities
Externalities matter because they cause market failures
Agent causing the externality doesn’t take it into account, doesn’tpay or receive compensation for the cost or benefit caused by it.
⇒ Externality acts outside the market, its effect is not included in theprice system
⇒ Inefficient allocation of resources in the market equilibrium
⇒ correction needed in order to maximize social welfare
Markets and the Environment Instruments for correcting market failures: Optimal level pollution 97
Optimal level pollution: Externalities
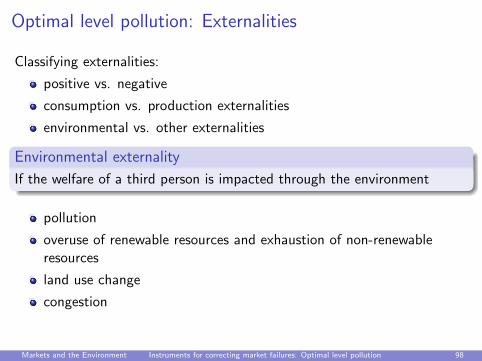
Classifying externalities:
positive vs. negative
consumption vs. production externalities
environmental vs. other externalities
Environmental externality
If the welfare of a third person is impacted through the environment
pollution
overuse of renewable resources and exhaustion of non-renewableresources
land use change
congestion
Markets and the Environment Instruments for correcting market failures: Optimal level pollution 98
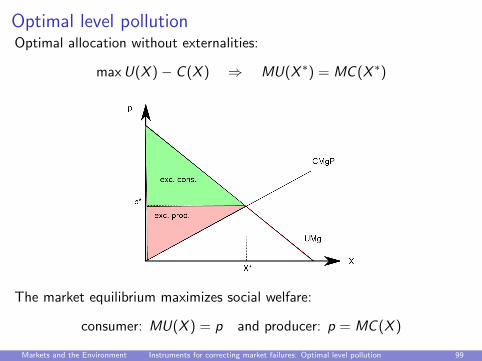
Optimal level pollutionOptimal allocation without externalities:
maxU(X )− C (X ) ⇒ MU(X ∗) = MC (X ∗)
The market equilibrium maximizes social welfare:
consumer: MU(X ) = p and producer: p = MC (X )
Markets and the Environment Instruments for correcting market failures: Optimal level pollution 99
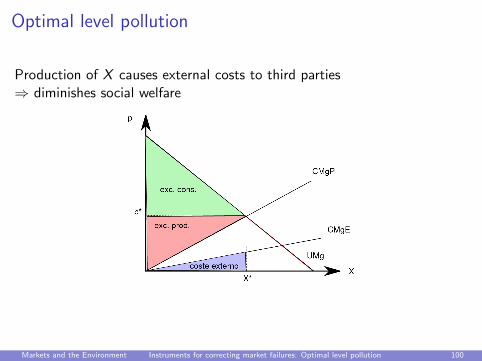
Optimal level pollution
Production of X causes external costs to third parties⇒ diminishes social welfare
Markets and the Environment Instruments for correcting market failures: Optimal level pollution 100
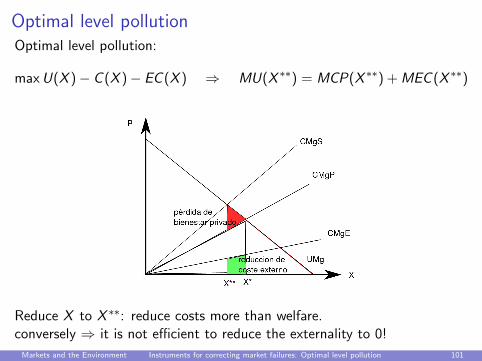
Optimal level pollutionOptimal level pollution:
maxU(X )− C (X )− EC (X ) ⇒ MU(X ∗∗) = MCP(X ∗∗) + MEC (X ∗∗)
Reduce X to X ∗∗: reduce costs more than welfare.conversely ⇒ it is not efficient to reduce the externality to 0!
Markets and the Environment Instruments for correcting market failures: Optimal level pollution 101

Instruments for correctingmarket failures:
Interventionist solutions
Markets and the Environment Instruments for correcting market failures: Interventionist solutions 102
Interventionist solutions
Recall: the problem is that part of the consequences of an economicactivity are external to the price system
Internalization
Correcting an inefficient allocation of resources generated by an externalityby inducing the emitter of the externality to take it into account whendeciding on the level of his/her activity
Different options for internalizing externalities:
Pigou: taxes (for negative externalities) and subsidies (for positiveexternalities)
Coase: market solutions (negotiation between agents who receivesthe externality and those who emit them) put a price on theexternality
Markets and the Environment Instruments for correcting market failures: Interventionist solutions 103

1. Pigouvian tax
Pigouvian tax levied on production process with externalities:
Markets and the Environment Instruments for correcting market failures: Interventionist solutions 104

1. Pigouvian taxPigouvian tax levied on production process with externalities:
Recall: optimal level of X requires
MU(X ∗∗) = MC (X ∗∗) + MEC (X ∗∗) = MSC (X ∗∗)
Private decisions with tax:1. Consumers: MU(X ) = pc2. Firms: max Π = (pc − t)X − C (X ) ⇒ pc − t = pv = MC (X )
MU(X ) = p y p = MC (X ) + t
Hence, private decisions will be optimal with a
Pigouvian tax
t = MEC (X ∗∗)
At the optimal level of pollution: Per unit tax = Marginal external cost(MEC)
Markets and the Environment Instruments for correcting market failures: Interventionist solutions 105

1. Pigouvian taxPigouvian tax: effect on welfare
without tax:
CS = A+B+C
PS = D+E+F
EC = -G-H
with tax:
CS = A
PS = F
tax revenue T = B+D
EC = -G
welfare change due to tax
loss = -C-E
gain = H = C+E+I
Social welfare increases by an amount equal to area I
Markets and the Environment Instruments for correcting market failures: Interventionist solutions 106

1. Pigouvian tax: Example
Externalities of road transport:
greenhouse gas emissions (global pollution)
air pollution (local pollution)
accidents, noise, congestion
externalities of car production
... and disposal of old cars
externalities of the construction of infrastructure
... and of its existence (disruption of biological habitats etc.)
Markets and the Environment Instruments for correcting market failures: Interventionist solutions 107
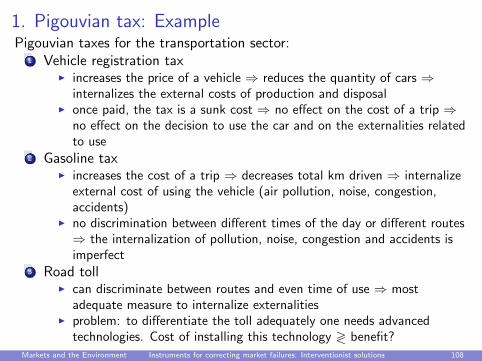
1. Pigouvian tax: ExamplePigouvian taxes for the transportation sector:
1 Vehicle registration taxI increases the price of a vehicle ⇒ reduces the quantity of cars ⇒
internalizes the external costs of production and disposalI once paid, the tax is a sunk cost ⇒ no effect on the cost of a trip ⇒
no effect on the decision to use the car and on the externalities relatedto use
2 Gasoline taxI increases the cost of a trip ⇒ decreases total km driven ⇒ internalize
external cost of using the vehicle (air pollution, noise, congestion,accidents)
I no discrimination between different times of the day or different routes⇒ the internalization of pollution, noise, congestion and accidents isimperfect
3 Road tollI can discriminate between routes and even time of use ⇒ most
adequate measure to internalize externalitiesI problem: to differentiate the toll adequately one needs advanced
technologies. Cost of installing this technology ≷ benefit?
Markets and the Environment Instruments for correcting market failures: Interventionist solutions 108

1. Pigouvian tax
In practice, the problem boils down to knowing
which activity creates the pollution
(part of) the marginal external cost function
MU (to calculate X ∗∗)
Example
Two estimations of MEC from emitting a ton of carbon:
Stern-Report (2006): US-$ 300 or more
W. Nordhaus (2007): US-$ 30, increasing up to US-$ 85 by year 2050
Discrepancy because of the uncertainty about the magnitude of theeffects, disagreement about the appropriate tax rate , ...
Markets and the Environment Instruments for correcting market failures: Interventionist solutions 109
1. Pigouvian tax: Use of the tax revenue
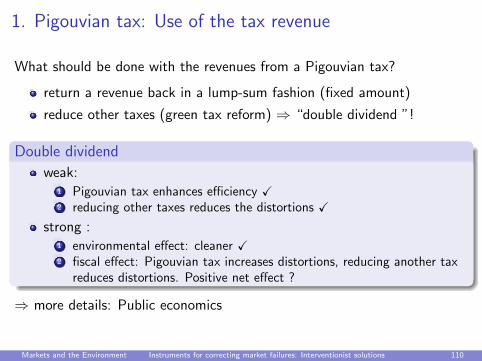
What should be done with the revenues from a Pigouvian tax?
return a revenue back in a lump-sum fashion (fixed amount)
reduce other taxes (green tax reform) ⇒ “double dividend ”!
Double dividend
weak:1 Pigouvian tax enhances efficiency X2 reducing other taxes reduces the distortions X
strong :1 environmental effect: cleaner X2 fiscal effect: Pigouvian tax increases distortions, reducing another tax
reduces distortions. Positive net effect ?
⇒ more details: Public economics
Markets and the Environment Instruments for correcting market failures: Interventionist solutions 110
2. Subsidies
Difficulties with the implementation of Pigouvian taxes:
calculate the correct values for t
opposition from interest groups that lose welfare
⇒ easier to use subsidies (when possible) instead of taxes
⇒ subsidize the reduction of polluting activity
Markets and the Environment Instruments for correcting market failures: Interventionist solutions 111
2. Subsidies
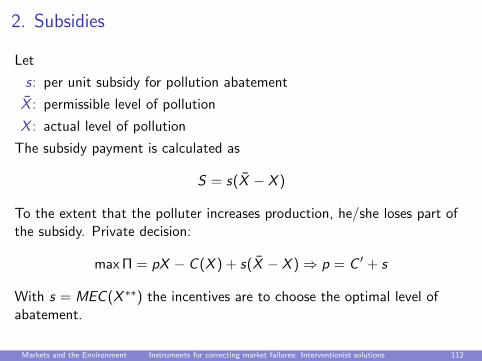
Let
s: per unit subsidy for pollution abatement
X : permissible level of pollution
X : actual level of pollution
The subsidy payment is calculated as
S = s(X − X )
To the extent that the polluter increases production, he/she loses part ofthe subsidy. Private decision:
max Π = pX − C (X ) + s(X − X )⇒ p = C ′ + s
With s = MEC (X ∗∗) the incentives are to choose the optimal level ofabatement.
Markets and the Environment Instruments for correcting market failures: Interventionist solutions 112
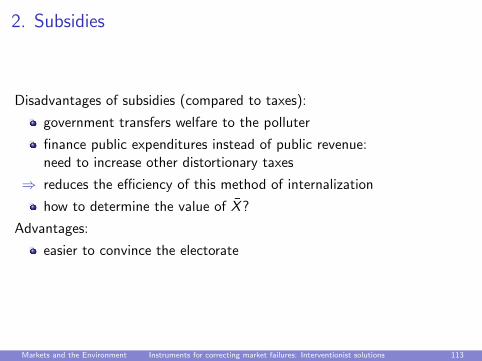
2. Subsidies
Disadvantages of subsidies (compared to taxes):
government transfers welfare to the polluter
finance public expenditures instead of public revenue:need to increase other distortionary taxes
⇒ reduces the efficiency of this method of internalization
how to determine the value of X?
Advantages:
easier to convince the electorate
Markets and the Environment Instruments for correcting market failures: Interventionist solutions 113

2. Subsidies: investment tax credits
Real Decreto 283/2001, March 16
Los sujetos pasivos podran deducir de la cuota ıntegra el 10% del importede las inversiones realizadas en elementos patrimoniales del inmovilizadomaterial destinadas a la proteccion del medio ambiente, consistentes eninstalaciones que tengan por objeto ciertas finalidades determinadas en lanorma
Real Decreto-Ley 2/2003, April 25
Gives incentives for investment into renewable resources by extending thededuction of 10% to corporate tax law.
Markets and the Environment Instruments for correcting market failures: Interventionist solutions 114

3. Environmental standards
Intention behind the Pigouvian tax: reduce X to the optimal level.This objective can be reached directly by using a
Standard
Maximum allowed concentration level of a pollutant,equivalent to fixing a maximum quantity Xmax of permissible emissions.If Xmax = X ∗∗, the level of pollution is optimal.
Practical examples:
(Non-transferable)pollution rights
Prohibit the circulation of vehicles with certain digits of the licensenumber on certain days (→ ‘hoy no circula’ program in Mexico DF,Beijing)
Markets and the Environment Instruments for correcting market failures: Interventionist solutions 115

3. Environmental standards
Effect on prices:
p = MC X < Xmax
p = MU para X = Xmax
p =∞ X > Xmax
Markets and the Environment Instruments for correcting market failures: Interventionist solutions 116

3. Comparison of Pigouvian Tax and StandardsUnder ideal conditions
Tax vs. Standard (basic model):
Static, partial-equilibrium analysis: effects on social welfare areequivalent
Difference between the distribution of welfare:I Tax generates revenue for the governmentI Standard increases revenue of polluter
⇒ Double dividend of the tax:its effect on social welfare is larger than that of the standard
In order to make both options equivalent, one would have to tradepollution rights
Markets and the Environment Instruments for correcting market failures: Interventionist solutions 117

3. Comparison of Pigouvian Tax and StandardsWith uncertainty
Tax vs. standard under uncertainty about costs and benefits:
Whether erring causes higher welfare loss with the tax or the standarddepends on parameters (elasticities of demand, supply and externalcost functions).
Markets and the Environment Instruments for correcting market failures: Interventionist solutions 118
3. Comparison of Pigouvian Tax and StandardsWith uncertainty
Case I - Moderate externality, inelastic demand
Markets and the Environment Instruments for correcting market failures: Interventionist solutions 119
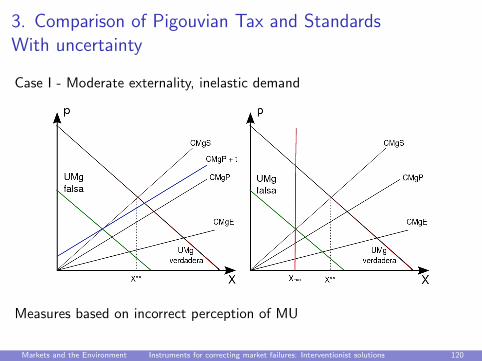
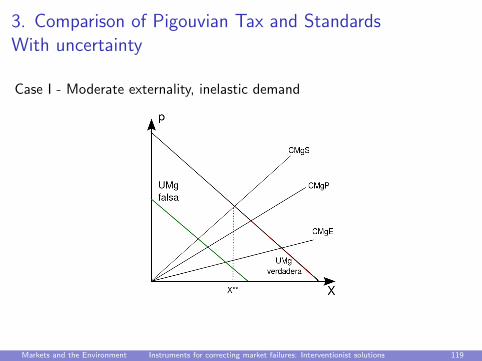
3. Comparison of Pigouvian Tax and StandardsWith uncertainty
Case I - Moderate externality, inelastic demand
Measures based on incorrect perception of MU
Markets and the Environment Instruments for correcting market failures: Interventionist solutions 120

3. Comparison of Pigouvian Tax and StandardsWith uncertainty
Case I - Moderate externality, inelastic demand
Here: smaller welfare loss with the tax
Markets and the Environment Instruments for correcting market failures: Interventionist solutions 121

3. Comparison of Pigouvian Tax and StandardsWith uncertainty
Case II - Strong externality, elastic demand
Markets and the Environment Instruments for correcting market failures: Interventionist solutions 122
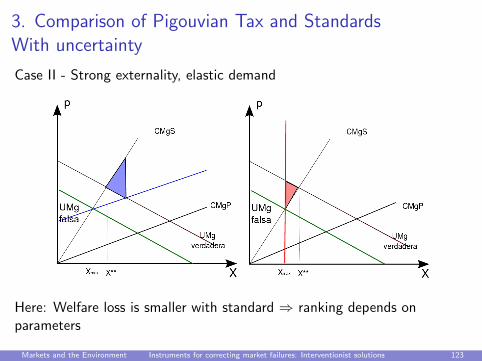
3. Comparison of Pigouvian Tax and StandardsWith uncertainty
Case II - Strong externality, elastic demand
Here: Welfare loss is smaller with standard ⇒ ranking depends onparameters
Markets and the Environment Instruments for correcting market failures: Interventionist solutions 123

3. Comparison of Pigouvian Tax and StandardsWith heterogeneous polluters
Tax vs. standard with different technologies to reduce emissions:
If pollution abatement cost Ci (R) differ between pollutants, the taxachieves the same total reduction R at lower costs than the standard.
Reference solution:
min∑i
Ci (Ri ) s.t.∑i
Ri = R
⇒ MCi (Ri ) = λ = MCj(Rj) ∀i , j
Markets and the Environment Instruments for correcting market failures: Interventionist solutions 124
3. Comparison of Pigouvian Tax and StandardsWith heterogeneous polluters
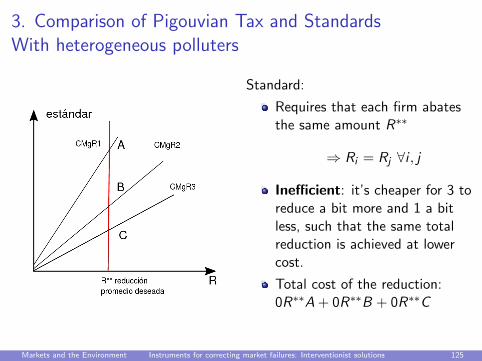
Standard:
Requires that each firm abatesthe same amount R∗∗
⇒ Ri = Rj ∀i , j
Inefficient: it’s cheaper for 3 toreduce a bit more and 1 a bitless, such that the same totalreduction is achieved at lowercost.
Total cost of the reduction:0R∗∗A + 0R∗∗B + 0R∗∗C
Markets and the Environment Instruments for correcting market failures: Interventionist solutions 125
3. Comparison of Pigouvian Tax and StandardsWith heterogeneous polluters
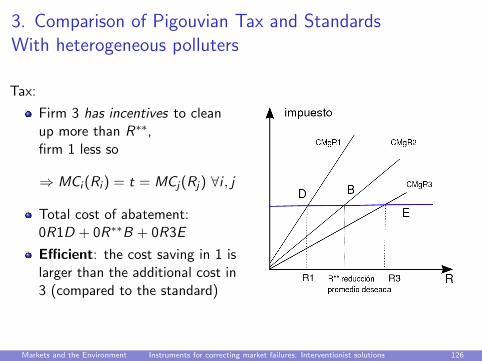
Tax:
Firm 3 has incentives to cleanup more than R∗∗,firm 1 less so
⇒ MCi (Ri ) = t = MCj(Rj) ∀i , j
Total cost of abatement:0R1D + 0R∗∗B + 0R3E
Efficient: the cost saving in 1 islarger than the additional cost in3 (compared to the standard)
Markets and the Environment Instruments for correcting market failures: Interventionist solutions 126
Instruments for correctingmarket failures:
Market-based instruments
Markets and the Environment Instruments for correcting market failures: Market-based instruments 127
1. The Coase Theorem
Idea: The agents can solve the externality problem without governmentintervention.
Your room mate is listening to loud music while you are trying to study.What are the alternatives to solve this conflict of interest?
Essential condition: property rights well-defined:one agent must have the right to use the environment(or prohibit its usage by someone else)⇒ negotiations = creating a market for the externality⇒ include the effect of the price system = internalization
⇒ efficient allocation
Markets and the Environment Instruments for correcting market failures: Market-based instruments 128
1. The Coase Theorem
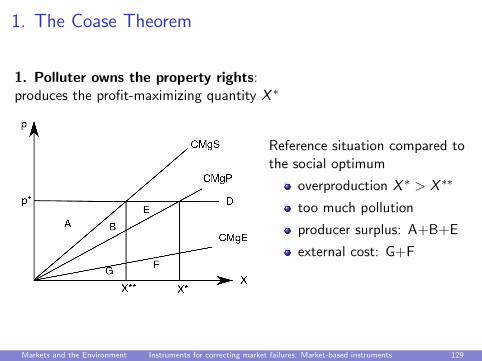
1. Polluter owns the property rights:produces the profit-maximizing quantity X ∗
Reference situation compared tothe social optimum
overproduction X ∗ > X ∗∗
too much pollution
producer surplus: A+B+E
external cost: G+F
Markets and the Environment Instruments for correcting market failures: Market-based instruments 129
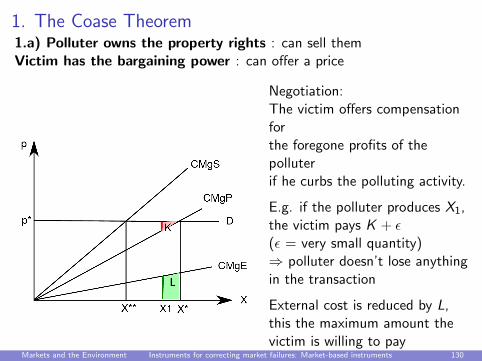
1. The Coase Theorem1.a) Polluter owns the property rights : can sell themVictim has the bargaining power : can offer a price
Negotiation:The victim offers compensationforthe foregone profits of thepolluterif he curbs the polluting activity.
E.g. if the polluter produces X1,the victim pays K + ε(ε = very small quantity)⇒ polluter doesn’t lose anythingin the transaction
External cost is reduced by L,this the maximum amount thevictim is willing to pay⇒ victim gains L− (K + ε)Markets and the Environment Instruments for correcting market failures: Market-based instruments 130

1. The Coase Theorem
1.a) Polluter owns the property rightsVictim has bargaining power
X1: to reduce pollution a bitmore ,the victim is willing to pay morethan necessary to convince thepolluter⇒ negotiate a lower X
X2: the victim is not willing topay what would be necessary tocurb the las unit of pollution⇒ won’t reduce X by this much
Markets and the Environment Instruments for correcting market failures: Market-based instruments 131
1. The Coase Theorem
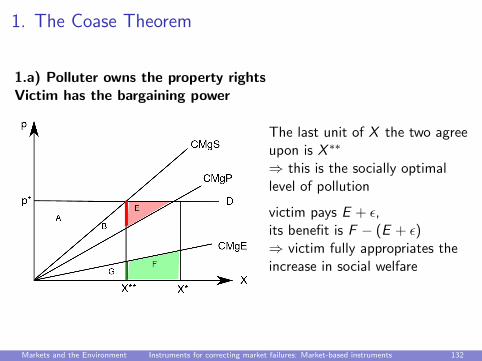
1.a) Polluter owns the property rightsVictim has the bargaining power
The last unit of X the two agreeupon is X ∗∗
⇒ this is the socially optimallevel of pollution
victim pays E + ε,its benefit is F − (E + ε)⇒ victim fully appropriates theincrease in social welfare
Markets and the Environment Instruments for correcting market failures: Market-based instruments 132

1. The Coase Theorem
1.b) Polluter owns the property rights and has the bargaining powerThe polluter offers to reduce X ifthe victim pays him the fullwelfare gains from the reduction.
Reduce X as long as it isbeneficial for the polluter.
Equilibrium: X ∗∗ = socialoptimum
Polluter receives a payment F,loses surplus E⇒ appropriates the increase inthe social welfare F-E
Markets and the Environment Instruments for correcting market failures: Market-based instruments 133
1. The Coase Theorem
1.c) It is also possible that
polluter and
victim
have part of the bargaining power.In this case the payment of the victim to the polluter is
more than E and
less than F
⇒ they share the increase in social welfare.
Markets and the Environment Instruments for correcting market failures: Market-based instruments 134

1. The Coase Theorem
The Coase Theorem
If
property rights are well-defined
and transaction and negotiation costs are negligible
then voluntary agreements between the economic agents lead to Paretoefficient allocations.This result does not depend on whether the property rights are with thepolluter or with the victim. This will only change the distribution of rents.
Let’s see what happens when the victim owns the property rights.
Markets and the Environment Instruments for correcting market failures: Market-based instruments 135
1. The Coase Theorem
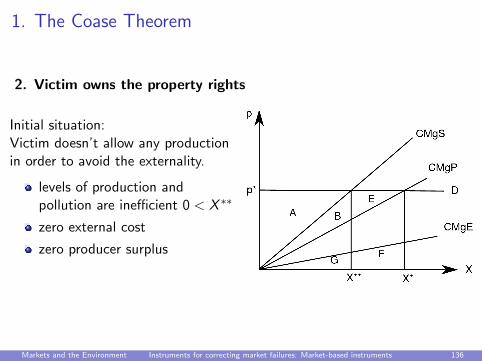
2. Victim owns the property rights
Initial situation:Victim doesn’t allow any productionin order to avoid the externality.
levels of production andpollution are inefficient 0 < X ∗∗
zero external cost
zero producer surplus
Markets and the Environment Instruments for correcting market failures: Market-based instruments 136
1. The Coase Theorem
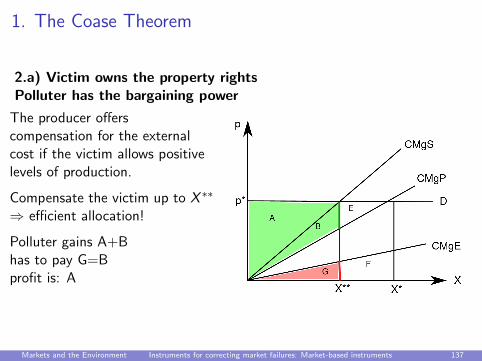
2.a) Victim owns the property rightsPolluter has the bargaining power
The producer offerscompensation for the externalcost if the victim allows positivelevels of production.
Compensate the victim up to X ∗∗
⇒ efficient allocation!
Polluter gains A+Bhas to pay G=Bprofit is: A
Markets and the Environment Instruments for correcting market failures: Market-based instruments 137

1. The Coase Theorem – Summary: Who pays?
Distributional consequences of the allocation of property rights:
Property rights determine who has to payI Polluter pays principleI Victim pays principle
The bargaining power determines how much to pay:whoever has it can appropriate the welfare increase
property bargaining powerrights victim polluter both
polluter victim pays E F between E and Fvictim polluter pays A+B G A and part of B=G
Markets and the Environment Instruments for correcting market failures: Market-based instruments 138
1. Coase theorem: transaction cost
Very important practical problem:Negotiations between all stakeholders can be difficult and costly toimplement.If the transaction costs are larger than the possible increase in socialwelfare → it’s better not to negotiate!
⇒ In this case, government intervention can be an alternative to reach thesocial optimum (provided that government failure doesn’t create a highercost...).
Markets and the Environment Instruments for correcting market failures: Market-based instruments 139
2. Tradable pollution rights
The markets for pollution rights are markets “created” for the allocation ofproperty rights.
The scope of the market in terms of
pollutants , e.g. CO2, SOx, NOx
firms or sectors
geography – local (California), continental (Europa) or even global(Kyoto Protocol)
is called the bubble.
Markets and the Environment Instruments for correcting market failures: Market-based instruments 140
2. Tradable pollution rights
Practical implementation:
establish a level of admissible pollution (the “cap” - like a standard)
create a permit for each unit of pollution
allocate permits to firms.I grandfathering : free permits (based on historical emissions)I benchmarking : free permits emissions of the most efficient plant
(based on historical emissions)I auctions: firms buy as many permits as they need in an auction
each permit entitles its holder to emit one unit of the pollutantI in order to emit more the firm must acquire additional permitsI if it emits less, it has a surplus of permits.
permits are tradable, they can be bought and sold in a market
their price is determined by demand and supply
Markets and the Environment Instruments for correcting market failures: Market-based instruments 141

2. Tradable pollution rights
Initial situation: Given theallocated permits both firms haveto reduce their emissions by R∗∗
Firm 1 would pay up toR**A for an additionalpermit so as abate less.
Firm 2 can reduce emissionsby an additional unit at costR**B; if it is paid more for apermit it can increase profitsby selling the permit andabating pollution.
⇒ firms will trade permits witheach other
Markets and the Environment Instruments for correcting market failures: Market-based instruments 142

2. Tradable pollution rights
If the permit price is p. e.g. p1:
Firm 1 demands a permits inorder to emit this additionalquantity
Firm 2 offers b permits:reducing this additionalquantity costs less than therevenue from the sale of thepermit
⇒ disequilibrium
Markets and the Environment Instruments for correcting market failures: Market-based instruments 143

2. Tradable pollution rights
Equilibrium: the price of permitsmust adjust until demand equalssupply
Each firm minimizes its cost ofabating and buying/sellingpermits:
minCi (Ri )− p · (Ri − R)
⇒ MCi (Ri ) = p = MCj(Rj) ∀i , j
equalizing marginal costs⇒ minimizes the social cost ofabatement
Markets and the Environment Instruments for correcting market failures: Market-based instruments 144

2. Tradable pollution rights
Advantages of tradable permits
1 cost minimization: the firms with the lowest abatement cost are doingmost of the abatement
2 flexibility: in order to change the level of pollution the regulator caneither sell additional permits to increase the amount of permits or buypermits in order to retire them
3 opportunity for the victims of pollution: can buy and destroy permits
4 precision: it’s easier to maintain a given level of environmental qualityby limiting the amount of pollution (as opposed to a tax thatregulates the price of pollution, not the quantity)
Disadvantages
Since the amount of permits is a political decision, tradable permitscan give worse results than taxes.
With free permit allocation, there is no revenue raising effect.
Markets and the Environment Instruments for correcting market failures: Market-based instruments 145

2. Tradable pollution rights
Real-world examples:
Clean Air Act in the USA: reduction of local pollution and of acid rain
Kyoto Protocol: reduction of greenhouse gas emissions
European Union Emissions Trading Scheme for CO2
other local systems underway (Australia, China, South Corea...)
Markets and the Environment Instruments for correcting market failures: Market-based instruments 146

EU Emissions Trading Scheme
Part of the EU strategy to meet the reduction target it assumed under theKyoto Protocol:Tradable permits for CO2 among firms
in place since 2005
applied in 27 EU member statesand (since 2008) in Norway, Iceland, and Liechtenstein
CO2 emissions from combustion installations and from certain energyintensive sectors.Covers approx. 50% of European emissions of CO2
does not cover emissions from household, transportation (25% ofemissions ), agriculture and other industrial sectors
does not cover greenhouse gases other than CO2
Markets and the Environment Instruments for correcting market failures: Market-based instruments 147
EU Emissions Trading Scheme
National Allocation Plans (NAP):Allocate permits to installations based on their historical emissions,taking into account early action, clean technologies, ... (don’t wantto punish early efforts to cut emissions).A small share of all permits are sold in auctions.
“European Allowance Unit” EUA gives the right to emit one ton ofCO2
Permits are bought and sold in different markets; the most importantone is the ECX (European Climate Exchange) in London
Prices fluctuate a lot, currently at e 8
Fee for emitting without a permit: e 100 + permit price
Markets and the Environment Instruments for correcting market failures: Market-based instruments 148

EU Emissions Trading Scheme
Price of one EUA
Source: Deutsche Emissionshandelsstelle 2009
Markets and the Environment Instruments for correcting market failures: Market-based instruments 149

Auction price of one EUA
Legend
Settlement Price Auction Price Volume EEX Volume OTC
European Energy Exchange: EU Emission Allowances Chart | Spot http://www.eex.com/en/Market Data/Trading Data/Emission Rights/EU Emission Allowances | S...
1 of 1 10/29/2012 9:26 AM
Source: European Carbon Exchange 2012
Markets and the Environment Instruments for correcting market failures: Market-based instruments 150
EU Emissions Trading Scheme
Permit trade is subdivided in phases. Permits from phase I cannot becarried over to phase II (hence the price jump)
Phase I 2005-2007: total number of permits was too generous ⇒prices fell in 2006
Phase II 2008-2012: corresponds to the compliance period under theKyoto Protocol.Prices fell by 5,7% a year.
Phase III 2013-2020: it is planned to ...I reduce the total number of permitsI include more GHG gases and more sectors (e.g. airlines)I sell most permits in auctions
Markets and the Environment Instruments for correcting market failures: Market-based instruments 151
Topic 4Valuation of Natural Resources
Markets and the Environment Valuation of Natural Resources: 152

IntroductionWhy is it important to know the value of natural resources, or the value ofan improvement or deterioration of an environmental good?
Example
To take a decision on whether to make a development project or not, wehave to estimate:
Bd benefits from development
Cd costs of development
Bp benefits of preserving the environment and of not developing the area
Si Bd > (Cd + Bp)⇒ undertake the project
Si Bd < (Cd + Bp)⇒ not undertake the project
Bd and Cd are relatively easy to measure: market inputs and outputs withobservable prices. The problem is to estimate Bp.
Another example: Estimating the value of an externality ⇒ determine thepreferred state of nature and the efficient amount of interventions.Markets and the Environment Valuation of Natural Resources: 153

Introduction
Economic Value of a good:
willingness to pay, reflecting people’s preferences
= price·quantity + consumer surplus
per unit: value of the inverse-demand curve for this unit
marginal value (of the last unit) = price
This is not about the objective value of nature, but about economicagents’ preferences!
Markets and the Environment Valuation of Natural Resources: 154

IntroductionProblem: not all goods are traded in (perfect) markets ⇒ although theydon’t have a price, they may have economic value:
value
use value
direct, with marketsdirect, with imperfect/inexistent marketsindirect
non-use value
option value (from future use)quasi-option value (from possible future use)of existence (intrinsic value)
Exercise
How would you classify the following examples?
fresh air
medicinal plants still unknown
landscape
animal species with no commercial value
Markets and the Environment Valuation of Natural Resources: 155
Introduction
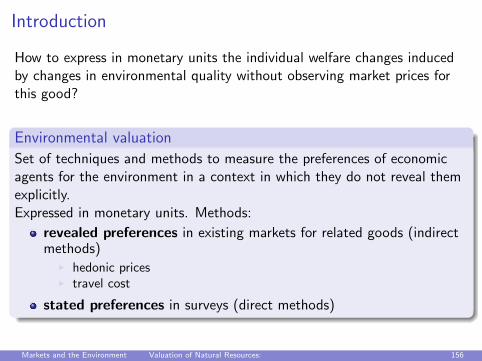
How to express in monetary units the individual welfare changes inducedby changes in environmental quality without observing market prices forthis good?
Environmental valuation
Set of techniques and methods to measure the preferences of economicagents for the environment in a context in which they do not reveal themexplicitly.Expressed in monetary units. Methods:
revealed preferences in existing markets for related goods (indirectmethods)
I hedonic pricesI travel cost
stated preferences in surveys (direct methods)
Markets and the Environment Valuation of Natural Resources: 156

Valuation of Natural Resources:Revealed Preferences
Markets and the Environment Valuation of Natural Resources: Revealed Preferences 157

1. Hedonic Price
Hedonic Price: Idea
How does environmental quality affect the price of complementary goodsfor which markets exist?
Find two identical goods, except for one feature (environmental quality).
∆P = ∆ value of this characteristic
Example
Consider two identical apartments, except for the fact that one is lessnoisy than the other.Rent difference ⇒ household’s willingness to pay for having less noise permonth.
Social value from noise reduction: household’s value times the amount ofhouseholds in the affected area.
Markets and the Environment Valuation of Natural Resources: Revealed Preferences 158

1. Hedonic Price
Difficulty: to find two goods that meet the requirements (identical in allbut their environmental quality).
Example
One apartment is noisier because it is located on a major street (ALSO:better access to public transportation, more pollution, less attractiveviews) or because it is in a shopping area (ALSO: many entertainmentsupply) ⇒ apartments differ not only in the noise but also in terms ofother amenities.And usually not only the environment is different, but also the apartmentsdiffer in more criteria (area, height, heating, ...)
We look for a method to decompose the value of different characteristics:estimate hedonic prices.
Markets and the Environment Valuation of Natural Resources: Revealed Preferences 159
1. Hedonic Price
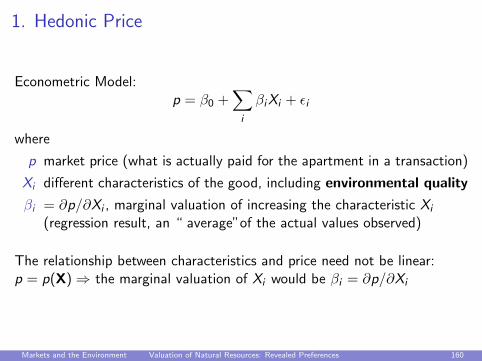
Econometric Model:p = β0 +
∑i
βiXi + εi
where
p market price (what is actually paid for the apartment in a transaction)
Xi different characteristics of the good, including environmental quality
βi = ∂p/∂Xi , marginal valuation of increasing the characteristic Xi
(regression result, an “ average”of the actual values observed)
The relationship between characteristics and price need not be linear:p = p(X)⇒ the marginal valuation of Xi would be βi = ∂p/∂Xi
Markets and the Environment Valuation of Natural Resources: Revealed Preferences 160

1. Hedonic price
Exercise
The regression of the rental price of apartments in an area has resulted inthe following expression:
p = 400 + 150 hab− 6 years− 30 polu− 3 noise− 10 dist metro
“polu” is the number of days for which pollution is above a critical level,“noise”is the number of hours per month with more than 50 decibels.
By how much would the rent of a flat increase if we declared one daya month as “car-free day”, reducing “polu” by 1 and “noise” by 4?
The area has a total of 200 apartments. By how much would externalcosts decrease with the introduction of the “car-free day”, and who isbenefiting after rents have been adjusted?
What other welfare changes should be considered in determiningwhether a measure is efficient?
Markets and the Environment Valuation of Natural Resources: Revealed Preferences 161

1. Hedonic price
Other examples of applications of the hedonic price method:
differences in job characteristics → wage gaps.
food prices (regular food vis-a-vis ecologic food;regular tuna vis-a-vis “dolphin-safe”; fair-trade coffee vis-a-vis regularcoffee)
computers (while the value of better models increases, the prices arealmost constant – hedonic prices of a base year can adjust currentexpenditures to the quality increase)
Markets and the Environment Valuation of Natural Resources: Revealed Preferences 162
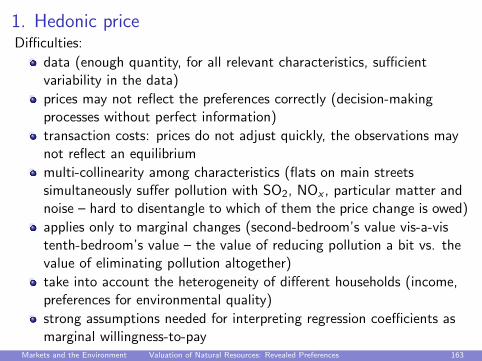
1. Hedonic priceDifficulties:
data (enough quantity, for all relevant characteristics, sufficientvariability in the data)
prices may not reflect the preferences correctly (decision-makingprocesses without perfect information)
transaction costs: prices do not adjust quickly, the observations maynot reflect an equilibrium
multi-collinearity among characteristics (flats on main streetssimultaneously suffer pollution with SO2, NOx , particular matter andnoise – hard to disentangle to which of them the price change is owed)
applies only to marginal changes (second-bedroom’s value vis-a-vistenth-bedroom’s value – the value of reducing pollution a bit vs. thevalue of eliminating pollution altogether)
take into account the heterogeneity of different households (income,preferences for environmental quality)
strong assumptions needed for interpreting regression coefficients asmarginal willingness-to-pay
Markets and the Environment Valuation of Natural Resources: Revealed Preferences 163

2. Travel Cost
Travel Cost: Idea
Estimate the demand curve for a natural area using the data on costsincurred by visitors traveling there.Recreational value of the natural area: the consumer surplus.
Total cost of visiting a natural park:
1 monetary cost from traveling(fuel etc.)
2 value of travel time (opportunitycost)
3 park-entrance cost
1 and 2 increase with distance
Markets and the Environment Valuation of Natural Resources: Revealed Preferences 164
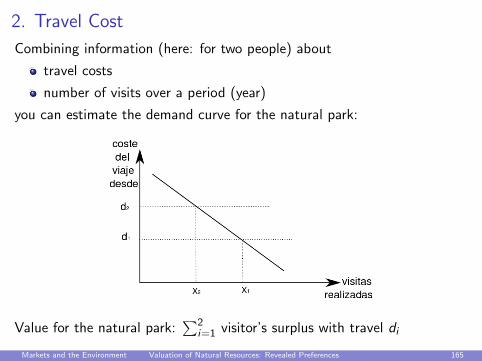
2. Travel Cost
Combining information (here: for two people) about
travel costs
number of visits over a period (year)
you can estimate the demand curve for the natural park:
Value for the natural park:∑2
i=1 visitor’s surplus with travel di
Markets and the Environment Valuation of Natural Resources: Revealed Preferences 165

2. Travel Cost: Individual demand
Get the individual demand for the services provided by the site for eachindividual based on the cost of accessing it and its own characteristics.
# visits = β0 + β1c +∑i
βiXi
Possible variables in vector Xi :
Membership to environmental associations
Local knowledge
Knowledge of alternative sites
Time spent at site
Socio-economic characteristics of the individual
Markets and the Environment Valuation of Natural Resources: Revealed Preferences 166

2. Travel Cost: Demand for home area
Get the average propensity (number of visits divided by population) tovisit the place from different geographical areas h which differ in the costof access.
% visits = β0 + β1c +∑i
βiXi
⇒ average demand in terms of the travel cost c
Possible variables in vector Xi :
socioeconomic characteristics of population in area h
site characteristics compared to alternative destinations
Calculate the value of the natural area:∑h
average surplus from the area h · population of area h
Markets and the Environment Valuation of Natural Resources: Revealed Preferences 167

Valuation of Natural Resources:Stated Preferences
Markets and the Environment Valuation of Natural Resources: Stated Preferences 168

Contingent Valuation
Contingent Valuation: Idea
When there is no market, create a virtual market.
direct method: survey
advantage: it can be used to measure non-use values
How much are you willing to ...
1 ... pay for an environmental improvement?(compensatory variation CV gives you the same utility as after thechange)
2 ... accept for not receiving that improvement?(equivalent variation EV gives you the same utility as before thechange)
3 ... pay for avoiding an environmental damage? (EV)
4 ... being compensated for tolerating that damage? (CV)
Markets and the Environment Valuation of Natural Resources: Stated Preferences 169
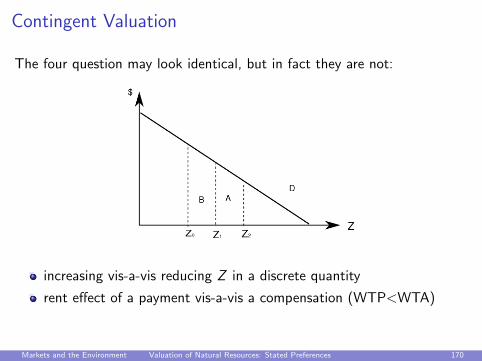
Contingent Valuation
The four question may look identical, but in fact they are not:
increasing vis-a-vis reducing Z in a discrete quantity
rent effect of a payment vis-a-vis a compensation (WTP<WTA)
Markets and the Environment Valuation of Natural Resources: Stated Preferences 170

Contingent Valuation
Markets and the Environment Valuation of Natural Resources: Stated Preferences 171

Contingent Valuation
The utility of an individual with income Y depends on the level of good Xwith price P, and on an environmental (non-market) good Z :
u(X ,Z ) = u(X (P,Y ),Z ) = v(P,Y ,Z )
The individual compares (indirect) utility before the environmentalimprovement with hypothetical utility thereafter (from Z1 to Z2) plus apayment A :
v1 = v(P,Y ,Z1) vs. v2 = v(P,Y − A,Z2)
v1 > v2 ⇒ reject: he would not pay A for the environmentalimprovement, A >WTP
v1 < v2 ⇒ accept: he would pay A, A <WTP
Markets and the Environment Valuation of Natural Resources: Stated Preferences 172

Contingent Valuation⇒ the maximum willingness-to-pay (WTP) is given by
v(P,Y ,Z1) = v(P,Y −WTP,Z2)
WTP depends on P,Y ,Z1,Z2 (observables) and preferences v (privateinformation, non-observable)
Empirical model:Random variable WTP = WTP(P,Y ,Z1,Z2, ε), with some distribution(normal, logistic, ...) in population (density curve):
Markets and the Environment Valuation of Natural Resources: Stated Preferences 173

Contingent Valuation
We want to learn the probability of acceptancePr{accept} = Pr{WTP ≥ A} for different payments A
First Step: Pr{reject} = Pr{WTP(·) < A} (cumulative density):
Markets and the Environment Valuation of Natural Resources: Stated Preferences 174
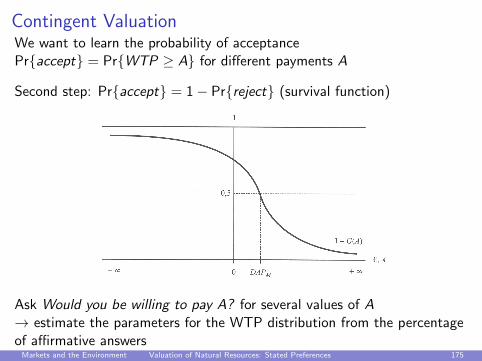
Contingent ValuationWe want to learn the probability of acceptancePr{accept} = Pr{WTP ≥ A} for different payments A
Second step: Pr{accept} = 1− Pr{reject} (survival function)
Ask Would you be willing to pay A? for several values of A→ estimate the parameters for the WTP distribution from the percentageof affirmative answersMarkets and the Environment Valuation of Natural Resources: Stated Preferences 175

Contingent Valuation
Example:Acceptance probability and demand curve / surplus
source: Riera et al. 2005, p. 162-3
Markets and the Environment Valuation of Natural Resources: Stated Preferences 176

Contingent Valuation in practiceSurvey design
The survey can be obtained through:
personal interviews
telephone interviews
mail interviews
e-mail interviews
laboratory experiments
⇒ important aspects: representativeness and costs
Markets and the Environment Valuation of Natural Resources: Stated Preferences 177

Contingent Valuation in practiceSurvey design
Important:Specify the context and the proposed change very specifically!
Some question formats:
open: the interviewer waits for an answerI how much would you pay for...?I problem: to many “no-answers”
closed: the interviewer suggests a limited number of answers tochoose from
I dichotomous/binary: Would you pay X, or not?I auction: the interviewer gives some number and adjusts it up or down
until the interviewee ask for no further adjustmentsI multiple: the interviewer asks the interviewee to choose a number from
a table with several numbers
Markets and the Environment Valuation of Natural Resources: Stated Preferences 178

Contingent Valuation in practiceSurvey design
Possible bias in the survey: the response may be influenced by ...
... the information given by the interviewer if it is not neutral
... what the interviewee believes is the “right” answer to please theinterviewer
... the belief of influencing the final decision by overstating WTP
... the initial question, influencing the perception of the followingquestions
... purely hypothetical situation: no consequences on mistakes
⇒ Try to avoid these problems when designing the survey, not whenanalyzing the results
Markets and the Environment Valuation of Natural Resources: Stated Preferences 179

Topic 5International aspects and multilateral
environmental agreements
Markets and the Environment International aspects and multilateral environmental agreements: 180

International Treaties
Many uses of natural resources have trans-border impacts
sulfur emissions in a country → acid rain in neighboring countries
pollution of rivers → affects downstream
greenhouse gases are emitted mainly in developed countries → moreserious consequences occur in developing countries
Currently there is no supranational institution responsible for these issuesand capable of coercing countries to take action (like a nationalgovernment would do regulating private companies) ⇒ (voluntary)cooperation is needed to correct these externalities
Markets and the Environment International aspects and multilateral environmental agreements: International Treaties181

International Treaties
Some examples of international environmental cooperation:
Climate and atmosphereI Ozone layer: CFC ban, Montreal Convention 1987I Climate change: reducing greenhouse gas emissions, Kyoto Treaty 1997
BiodiversityI Whales: Convention for fishing regulation 1946I Endangered Species of Wild Fauna and Flora: restrictions to trade
(CITES) 1975
Sustainable Development: Agenda 21
Desertification: United Nations Agreement 1996
Rivers and Seas: Several agreements for local and/or globalprotection and/or global
Waste: Rules for the export of dangerous wastes, Basel Convention1989
Treaty to limit nuclear tests 1963
Markets and the Environment International aspects and multilateral environmental agreements: International Treaties182

International Treaties
These treaties/agreements have been difficult to negotiate. One maydoubt whether they implement the first-best solutions.
What incentives do countries have to cooperate in the mitigation ofenvironmental damage by signing and complying with an international
treaty?
To answer this question we will use game theory:Analysis of the strategic interaction between several countries. Whenmaking decisions (rational decisions), each country has in mind whateveryone else does.
Markets and the Environment International aspects and multilateral environmental agreements: International Treaties183

Game Theory – some basic concepts
Strategy
A set of rules on how to react at any given moment and under any givencircumstances throughout the interaction.
Dominant Strategy
A strategy that gives a better (or at least not worse) result than theoutcome of any other strategy, whatever the actions taken by the otherplayers.
Nash Equilibrium
A combination of actions such that no actor can improve his outcomeunilaterally by changing his behavior (given the strategies adopted byothers.)It is a ‘non-cooperative’ equilibrium concept.
Markets and the Environment International aspects and multilateral environmental agreements: International Treaties184

International Treaties: Two countries
Example: Contamination in two countries, each country benefits from lesstotal pollution (2 units if only one country reduces it, 4 units if both dothat), but it also incurs costs (slower growth, 3 units) of reducing its ownemissions.
A B reduce no reduce
reduce 1,1 -1,2no reduce 2,-1 0,0
Exercise
Identify the Pareto optimum
Identify the Nash equilibrium. Explain why there is only oneequilibrium here.
Markets and the Environment International aspects and multilateral environmental agreements: International Treaties185

International Treaties: Two countries
Problem: Voluntary participation (non-cooperative game), deviations fromagreements cannot be punished ⇒ Prisoner’s Dilemma
A binding treaty (cooperative solution) may resolve the dilemma in thecase of two countries!
Options:
to sign the treaty (voluntary) and to reduce (compulsory after signing)
not to sign the treatyI and to reduce (voluntarily)I and not reduce
Exercise
Use the payment from previous slide. Given that the treaty will only enterinto force if both parties sign it, determine equilibriums and payments ofthis new game.
Markets and the Environment International aspects and multilateral environmental agreements: International Treaties186

International Treaties: Many countries
Problem: a binding treaty cannot always solve the inefficiency ofequilibrium.
With more than two countries and voluntary participation (but binding),the free riding problem arises:
some sign the treaty and reduce, because it is individually optimal
others neither sign nor reduce, but benefit from other’s reductions
Markets and the Environment International aspects and multilateral environmental agreements: International Treaties187

International Treaties: Many countries
Exercise
There are 5 symmetrical countries, that initially emit a toxic unit each.Reducing the emission has a private cost, but the total benefits fromreductions are publicly achieved. As each country can reduce a unit, totalreduction is R = number of countries that reduce. Private net benefits ofa country that continues polluting (cont) and of one that reduces pollution(reduced) are
Bcont = 10R y B redu = −3 + 8R
Fill in the table and determine the Nash equilibrium and the Paretooptimum.
R 0 1 2 3 4 5
Bcont –B redu –∑
B
Markets and the Environment International aspects and multilateral environmental agreements: International Treaties188
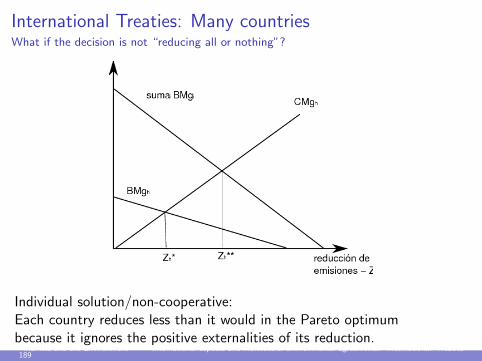
International Treaties: Many countriesWhat if the decision is not “reducing all or nothing”?
Individual solution/non-cooperative:Each country reduces less than it would in the Pareto optimumbecause it ignores the positive externalities of its reduction.
Markets and the Environment International aspects and multilateral environmental agreements: International Treaties189
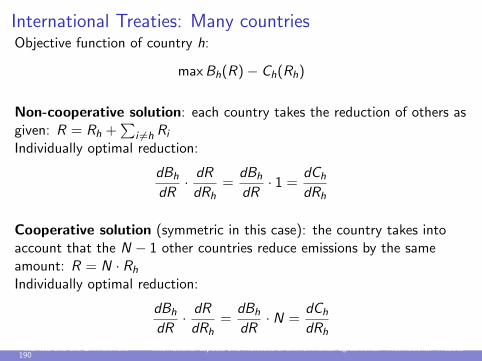
International Treaties: Many countriesObjective function of country h:
maxBh(R)− Ch(Rh)
Non-cooperative solution: each country takes the reduction of others asgiven: R = Rh +
∑i 6=h Ri
Individually optimal reduction:
dBh
dR· dRdRh
=dBh
dR· 1 =
dCh
dRh
Cooperative solution (symmetric in this case): the country takes intoaccount that the N − 1 other countries reduce emissions by the sameamount: R = N · Rh
Individually optimal reduction:
dBh
dR· dRdRh
=dBh
dR· N =
dCh
dRh
Markets and the Environment International aspects and multilateral environmental agreements: International Treaties190

International trade and the environment:Small open economy
Paradox
In the context of international trade in goods, more environmentalregulation in one country could lead to more pollution globally.
Explanation: Substitution of (relatively dirty) imports for (relatively clean)domestic production ⇒ More emissions from production andtransportation
Markets and the Environment International aspects and multilateral environmental agreements: International Trade andthe Environment 191
International trade and the environment:Small open economy
Variations of the model:
if technology abroad is cleaner than at home⇒ global emissions fall
if the regulated sector has an important share in the trade balance⇒ reduction of exports / increase in imports depreciates the domesticcurrency⇒ imports become more expensive with respect to exports,mitigating the contraction in the trade balance
if the other countries introduce the same environmental regulation(“harmonized pollution tax”)⇒ global effect same as with a pollution tax in a single country (cf.chapter 3)
Markets and the Environment International aspects and multilateral environmental agreements: International Trade andthe Environment 192

International trade and the environment:Unilateral tax
Country A unilaterally imposes an environmental tax to reduce domesticpollution emissions ZA .The external cost depends on global emissions
CE (Z ) = CE (ZA + ZM)
Case 1: Emissions result from the production of a non-tradablegood (protected or not transportable)→ lower domestic production is not replaced by foreign production:dZ = dZA, ZM constant
CMgE (ZA) =dCE
dZ
∂Z
∂ZA=∂CE
∂Z· 1
Markets and the Environment International aspects and multilateral environmental agreements: International Trade andthe Environment 193

International trade and the environment:Unilateral tax
Unilateral tax reduces the environmental externality by an amount that isoptimal from the p.o.v. of the individual country.
Markets and the Environment International aspects and multilateral environmental agreements: International Trade andthe Environment 194
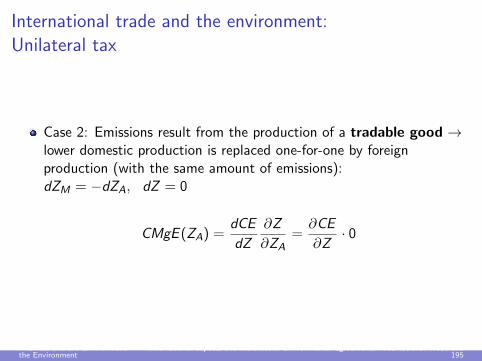
International trade and the environment:Unilateral tax
Case 2: Emissions result from the production of a tradable good →lower domestic production is replaced one-for-one by foreignproduction (with the same amount of emissions):dZM = −dZA, dZ = 0
CMgE (ZA) =dCE
dZ
∂Z
∂ZA=∂CE
∂Z· 0
Markets and the Environment International aspects and multilateral environmental agreements: International Trade andthe Environment 195
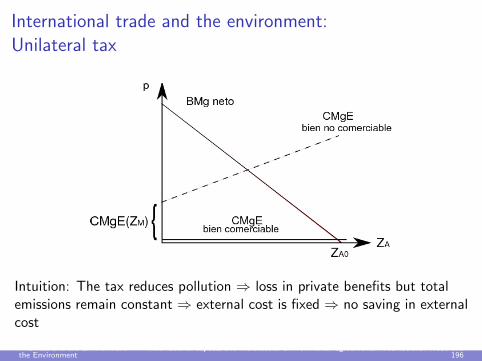
International trade and the environment:Unilateral tax
Intuition: The tax reduces pollution ⇒ loss in private benefits but totalemissions remain constant ⇒ external cost is fixed ⇒ no saving in externalcost
Markets and the Environment International aspects and multilateral environmental agreements: International Trade andthe Environment 196

Comercio internacional y medio ambiente:Unilateral tax
Case 3: The reduction in domestic production is replaced partially byimports ;Alternative interpretation: imports replace production one-for-one butthey are produced with a cleaner technology:dZ = dZA + dZM = (1− k)dZA where 0 < k < 1
CMgE (ZA) =dCE
dZ
∂Z
∂ZA=∂CE
∂Z· (1− k)
Markets and the Environment International aspects and multilateral environmental agreements: International Trade andthe Environment 197

International trade and the environment:Unilateral tax
Markets and the Environment International aspects and multilateral environmental agreements: International Trade andthe Environment 198
International trade and the environment
Is there a trade-off between internacional trade and environmentalprotection?
Unilateral environmental regulation (=in one country only) can affect thatcountry’s trade volumen in various ways:
lower competitiveness as exporter ⇒↓domestic production is substituted by imports (foreign producers ordomestic producers who relocate to foreign countries) ⇒↑barriers to imports: “green protectionism”, “Technological barriers totrade”(can also serve as a pretext for protectionism) ⇒↓if regulation provides producers of clean products with a larger marketthat makes production profitable (increasing returns to scale) ⇒↑stimulate growth and competitiveness (Porter hypothesis) ⇒↑
Markets and the Environment International aspects and multilateral environmental agreements: International Trade andthe Environment 199

International trade and the environment
Economic integration affects the environment and the conservation ofnatural resources:
“scale effect”: growth, more production, more transportation ⇒↓“composition effect”: further specialization according to comparativeadvantage→ redistribution of emissions across countries ⇒l?(Pathological case: production of dirty goods shifts to “pollutionhavens” in the South where environmental standards are low.)
“technique effect”: growing incomes increase the demand crecientes,aumenta la for environmental goods and may induce a structuralchange towards less polluting sectors (from industry towards services);technology transfer helps diffusion of clean technology; morecompetition induces firms to increase their efficiency ⇒↑“race to the bottom” of environmental standards in order to attractmore investment ⇒↓
Markets and the Environment International aspects and multilateral environmental agreements: International Trade andthe Environment 200
International trade and the environment: the WTO
The principal objective of the WTO is free trade. WTO
is worried about possible negative effects of environmental policy onfree trade,
trusts that free trade will have positive effects on the environment
However, there are exceptions to the GATT rules (General Agreement onTariffs and Trade; prohibition of import quotas, non-discrimination,reciprocity) that allow the protection of the environment
The WTO seeks to prevent that such exceptions are abused to disguiseillegal protectionism:
only allows measures that are necessary and scientifically proven toachieve the objective of environmental regulation.
such measures must not violate the principle of non-discrimination
Markets and the Environment International aspects and multilateral environmental agreements: International Trade andthe Environment 201

International trade and the environment: the WTO
Preamble of the Marrakesh Accord 1994 (founding the WTO)
Recognizing that their relations in the field of trade and economicendeavour should be conducted with a view to raising standards of living,ensuring full employment and a large and steadily growing volume of realincome and effective demand, and expanding the production of and tradein goods and services, while allowing for the optimal use of the world’sresources in accordance with the objective of sustainabledevelopment, seeking both to protect and preserve the environmentand to enhance the means for doing so in a manner consistent with theirrespective needs and concerns at different levels of economic development,...
Markets and the Environment International aspects and multilateral environmental agreements: International Trade andthe Environment 202

International trade and the environment: the WTO
Article XX of the GATT
Subject to the requirement that such measures are not applied in amanner which would constitute a means of arbitrary or unjustifiablediscrimination between countries where the same conditions prevail, or adisguised restriction on international trade, nothing in this Agreement shallbe construed to prevent the adoption or enforcement by any contractingparty of measures: ...
(b) necessary to protect human, animal or plant life or health;...
(g) relating to the conservation of exhaustible natural resources ifsuch measures are made effective in conjunction with restrictions ondomestic production or consumption. ...
Markets and the Environment International aspects and multilateral environmental agreements: International Trade andthe Environment 203