martinez garzon, p., kwiatek, g., sone, h., bohnhoff, m...
TRANSCRIPT

Originally published as:
Martinez Garzon, P., Kwiatek, G., Sone, H., Bohnhoff, M., Dresen, G., Hartline, C. (2014): Spatiotemporal changes, faulting regimes, and source parameters of induced seismicity: A case study from The Geysers geothermal field. - Journal of Geophysical Research, 119, 11, p. 8378-8396.
DOI: http://doi.org/10.1002/2014JB011385

Spatiotemporal changes, faulting regimes, and sourceparameters of induced seismicity: A case studyfrom The Geysers geothermal fieldPatricia Martínez-Garzón1, Grzegorz Kwiatek1, Hiroki Sone1, Marco Bohnhoff1,2, Georg Dresen1,3,and Craig Hartline4
1Helmholtz-Centre Potsdam GFZ German Research Centre for Geosciences, Potsdam, Germany, 2Institute of GeologicalSciences, Free University Berlin, Berlin, Germany, 3Institute of Earth and Environmental Sciences, University of Potsdam,Potsdam, Germany, 4Calpine Corporation, Middletown, California, USA
Abstract The spatiotemporal, kinematic, and source characteristics of induced seismicity occurring atdifferent fluid injection rates are investigated to determine the predominant physical mechanisms responsiblefor induced seismicity at the northwestern part of The Geysers geothermal field, California. We analyze arelocated hypocenter catalog from a seismicity cluster where significant variations of the stress tensor orientationwere previously observed to correlate with injection rates. We find that these stress tensor orientation changesmay be related to increased pore pressure and the corresponding changes in poroelastic stresses at reservoirdepth. Seismic events during peak injections tend to occur at greater distances from the injection well,preferentially trending parallel to themaximumhorizontal stress direction. In contrast, at lower injection rates theseismicity tends to align in a different direction which suggests the presence of a local fault. During peakinjection intervals, the relative contribution of strike-slip faulting mechanisms increases. Furthermore, increasesin fluid injection rates also coincide with a decrease in b values. Our observations suggest that regardless of theinjection stage, most of the induced seismicity results from thermal fracturing of the reservoir rock. However,during peak injection intervals, the increase in pore pressure may likewise be responsible for the inducedseismicity. By estimating the thermal and hydraulic diffusivities of the reservoir, we confirm that the characteristicdiffusion length for pore pressure is much greater than the corresponding length scale for temperature and alsomore consistent with the spatial extent of seismicity observed during different injection rates.
1. Introduction
The mitigation of Induced Seismicity (IS) caused by fluid injection into geo-reservoirs has recently becomea topic of increasing concern when considering efficient and sustainable energy production [e.g., Ellsworth,2013]. Reservoir stimulation is a common practice in geothermal energy projects as well as in production ofconventional and unconventional hydrocarbons (e.g., shale gas). However, it involves the injection of largeamounts of fluids frequently resulting in increased seismic activity and nonnegligible seismic hazard in thesurrounding areas [Dost and Haak, 2007;McGarr, 2014]. An improved understanding of the physical processesgoverning IS and their relation to geomechanical reservoir conditions (e.g., stress, pore fluid pressure)and hydraulic parameters (e.g., injection rates) is of practical importance for reservoir operators and localcommunities [Majer et al., 2007; Evans et al., 2012].
The mechanisms for occurrence of IS seismicity in geo-reservoirs undergoing fluid injection have beeninvestigated from both field observations and theoretical studies. Pore pressure increase due to fluid injectionreducing effective stresses may reactivate shearing on small preexisting faults and fractures favorably orientedwith respect of the stress field and trigger microseismic events [e.g.,Majer et al., 2007]. The fluid propagates awayfrom the injection well through the rock matrix or along conductive fractures. Frequently, fluid-injection inducedseismicity clusters form an ellipsoidal shape that is preferentially elongated along the orientation of themaximum horizontal stress (e.g., Soultz-sous-Forêts, France) [Cuenot et al., 2006]. Shapiro et al. [1999, 2003]explained this to reflect an anisotropic hydraulic diffusivity. Schoenball et al. [2010] showed from numericalstudies that anisotropy of the stress field may also result in an ellipsoidal shape of the seismicity cloud. Porepressure and stress tensor are coupled in such a way that poroelastic stress changes may even modify the localtectonic faulting regime [Altmann et al., 2014]. Additionally, natural geothermal reservoirs or EnhancedGeothermal Systems (EGS) are developed in high-temperature environments. Here thermoelastic stresses
MARTÍNEZ-GARZÓN ET AL. ©2014. American Geophysical Union. All Rights Reserved. 8378
PUBLICATIONSJournal of Geophysical Research: Solid Earth
RESEARCH ARTICLE10.1002/2014JB011385
Key Points:• Geothermal reservoir characterizationfrommicroseismicity and geomechanics
• Systematic relation between injectionrates and seismic parameters
• Thermal and pore pressure effects arethe mechanisms driving the seismicity
Correspondence to:P. Martínez-Garzón,[email protected]
Citation:Martínez-Garzón, P., G. Kwiatek, H. Sone,M. Bohnhoff, G. Dresen, and C. Hartline(2014), Spatiotemporal changes,faulting regimes, and source parametersof induced seismicity: A case studyfrom The Geysers geothermal field,J. Geophys. Res. Solid Earth, 119,8378–8396, doi:10.1002/2014JB011385.
Received 13 JUN 2014Accepted 13 OCT 2014Accepted article online 17 OCT 2014Published online 25 NOV 2014

induced by the injection of cool water in the high-temperature reservoir rock are considered a prominent causeinducing seismicity, especially near the injection wells and the steam-producing fractures [e.g., Segall andFitzgerald, 1998; Rutqvist et al., 2013]. Due to cooling, the reservoir rock experiences contractional strain perturbingthe stress field and thus inducing microseismicity. This mechanism has been proposed to be dominant at TheGeysers geothermal field (California, USA), where recent thermal, mechanical, and hydraulic modeling of an EGShave suggested that the microseismicity was governedmainly by thermoelastic effects from the reservoir coolingaround the injection well plus small poroelastic stress changes [Rutqvist et al., 2013]. While poroelastic andthermoelastic effects likely occur concurrently, the temporal and spatial extent at which thesemechanisms governthe induced seismicity in geothermal reservoirs needs to be further investigated from field data.
Advanced IS waveform processing techniques allow identifying the active reservoir fracture network andmonitoring geomechanical processes occurring in a reservoir due to fluid injection. In particular, the double-difference relocation of IS hypocenters may help revealing in small-scale patterns of the spatiotemporaldistribution of seismicity [Waldhauser and Ellsworth, 2000]. The method allows tracing potential migration ofseismic events in the vicinity of the well during injection and after shut-in [e.g., Kwiatek et al., 2013, 2014;Albaric et al., 2014]. The spatiotemporal evolution of IS has been described using observed triggering andback-fronts of the seismicity [Shapiro et al., 2002; Parotidis et al., 2004]. Furthermore, calculation of seismicsource mechanisms combined with stress inversion provides information on the orientation and relativemagnitudes of principal stresses in a reservoir and the potential seismic hazard associated with stimulation[e.g., Schoenball et al., 2014]. Analyses of faulting kinematics have been performed for an EGS, e.g., atSoultz-sous-Forêts, France by Cuenot et al. [2006]. They found that most of the IS events likely represent normalfaulting mechanisms, while the occurrence of strike-slip events was limited to the deepest part of thestimulated volume, illustrating the spatially heterogeneous nature of faulting style within a stimulated volume.Additional information on seismic faulting processes is provided by analysis of earthquake source parametersand statistical attributes of earthquake populations, for example, Gutenberg-Richter magnitude-frequencydistribution. Bachmann et al. [2012] reported a decrease of b values with distance from the injection well at theDeep Heat Mining project in Basel/Switzerland. Also, an increase of the static stress drop with distance from theinjection well has been reported for the same site [Goertz-Allmann et al., 2011] as well as for the BerlínGeothermal field, El Salvador [Kwiatek et al., 2014].
The motivation for the analysis presented here originated from a previous study ofMartínez-Garzón et al. [2013]who observed significant rotations in the orientation of principal stresses in response to changes in the fluidinjection rates at The Geysers geothermal field, California. From inversion of focal mechanisms it was observedthat the vertical principal stress (the σ1 axis) tilted toward the NE/SW by approximately 20° when injection rateswere at their peak level (peak injection). The stress rotations were initially interpreted to be caused either byreactivation of preexisting fractures with a more transtensional component or due to potential tensile openingof new fractures. Although further analysis was necessary to determine the exact physical mechanism, thestudy demonstrated the close relation between reservoir stress state and fluid injection rate.
In this study, we analyze potential local short-term effects of peak-fluid injections on the sourcecharacteristics of microseismicity induced during two injection periods at the same site as presented inMartínez-Garzón et al. [2013] in order to gain insights on the physical mechanisms leading to the occurrenceof seismicity. First, we create an improved seismicity catalog by relocating the seismicity and calculate thecorresponding fault plane solutions. Then, we investigate potential variations in the faulting kinematics,spatiotemporal distribution of hypocenters, temporal changes in b values, maximum earthquake magnitude,static stress drop, and relative stress magnitudes from the induced seismicity. The obtained results suggestthat different physical mechanisms of IS can operate at different temporal and spatial scales dependingon the fluid injection rate. To support our findings, we estimate the reservoir permeability, hydraulic andthermal diffusivities, and stress magnitudes. The results presented here aim at improving reservoircharacterization and understanding the physics governing stimulation-induced seismicity.
2. The Geysers Geothermal Field
The Geysers (TG) geothermal field in Northern California, USA, is the largest producing geothermal field inthe world with approximately 330 active steam production wells and 60 active water injection wells[Brophy et al., 2010]. This vapor-dominated reservoir has been producing since the 1960s, achieving
Journal of Geophysical Research: Solid Earth 10.1002/2014JB011385
MARTÍNEZ-GARZÓN ET AL. ©2014. American Geophysical Union. All Rights Reserved. 8379

maximum production in 1987. Since then, the reservoir production has been slowly declining [Gunasekeraet al., 2003; Majer and Peterson, 2007]. The decay was caused primarily by the decrease in reservoirpressure, along with some cooling of the reservoir [Mossop and Segall, 1997]. To stabilize the reservoirpressure and preserve the steam production, large volumes of fluid have been injected with theconstruction of pipelines supplying treated waste water from Lake County since 1997 and SonomaCounty since 2003 [Majer and Peterson, 2007; Majer et al., 2007]. Associated with the reservoir pressuredecline, GPS surveys indicate surface subsidence above the reservoir at a rate of approximately 5 cm/yrduring the years 1977–1996 [Mossop and Segall, 1997].
The Geysers geothermal field exists within a complex assemblage of Franciscan rocks (200 to 80Ma in age)representing the ancient Farallon plate subduction complex. These Franciscan rocks consist primarily ofgreywacke forming part of a complex assemblage of intensely deformed, faulted, and sheared metamorphicrocks. A transition from subduction to right-lateral strike-slip faulting began about 30Ma ago as the spreadingcenter between the Pacific Plate (to the west) and the Farallon Plate (to the east) was subducted beneath theNorth American continent. Since this transition, right-lateral strike-slip motion along the broader San AndreasFault Zone system accommodates the relative motion between the Pacific Plate and North American Plate[DeCourten, 2008]. The right-lateral strike-slip motion of nearly parallel faults at progressively slower rates to theeast resulted in the transtensional tectonic environment between the (now inactive) Macaama and Collayomifaults associated with the development of The Geysers geothermal system. Here approximately 1.1Ma ago, a760°C granitic intrusion (the “Felsite”) resulted in contact metamorphism and fracturing of the Franciscancomplex at depth. Magmatic and hydrothermal gases, reacting with deeply circulating ground water withdissolved silica, formed the reservoir caprock. More recently (~0.25Ma) the initial approximately 300°C liquid-dominated geothermal reservoir developed into the modern (preproduction) 240°C/3.5MPa vapor-dominatedGeysers geothermal reservoir with renewed heating by additional magmatic intrusions, some possibly as recentas 0.01Ma [Hulen et al., 1997a, 1997b; Moore et al., 2000].
The low-permeability, highly fractured reservoir rocks (greywacke) have a low total porosity of about 1–2%[Barker et al., 1992], reservoir temperatures of approximately 240°C at 2 km depth [García et al., 2012], andtemperatures exceeding 350°C in the northwest Geysers at depths below ~2.75 km (high-temperature zone,Jeanne et al. [2014]). At TG, water is injected into the reservoir to prevent reservoir depletion. In this process,relatively cool surface water falls freely into the “injection” well resulting in significant volume reduction as thereservoir steam condenses. This causes negative gauge pressure at the wellhead, in contrast to active surfacepumping commonly performed for reservoir stimulation with injection at elevated wellhead pressures.
The induced seismicity occurring throughout the geothermal field has been attributed to bothwater injection andsteam production [Eberhart-Phillips and Oppenheimer, 1984; Oppenheimer, 1986; Foulger et al., 1997]. Since a denselocal seismic network was deployed in 2003, approximately 4000 seismic events per year with magnitudesbetween 1.0 and 4.5 have been observed. Within The Geysers, estimations from focal mechanisms of seismicity onthe local maximumhorizontal stress (SHMax) are generally consistent with the NNE-SSW trending orientation of theregional geological structures [Oppenheimer, 1986; Provost and Houston, 2003], suggesting that the tectonicstresses in the region are much larger than the local stress perturbations induced by geothermal activities. Recentresults from Altmann et al. [2013] suggest that tectonic loading contributes little within the reservoir compared tothe pore pressure diffusion on timescales of several years.
Different physical processes have been proposed to explain the occurrence of IS [Allis, 1982; Majer et al., 2007].Thermal fracturing of the hot reservoir rocks due to the local and rapid contraction during relatively cool waterinjection is considered to be a prominent mechanism producing microseismicity [Segall and Fitzgerald, 1998;Rutqvist et al., 2013]. Additionally, changes in the pore pressure from both fluid injection and/or reservoirdepletion may lead to perturbation of effective stresses in the reservoir resulting in seismic activity. Lastly,induced seismicity due to geochemical alteration of the rocks during cooling has also been proposed [Allis, 1982].
Progressive reservoir depletion has been proposed based on declining steam production in conjunction withsubsidence at the surface [Gunasekera et al., 2003; Vasco et al., 2013]. However, most of the NW part of the fieldwas practically not exploited until 2007. To recharge the reservoir and reduce noncondensable gasconcentrations, some water injection projects were established resulting in induced seismicity. Analysis of faultplane solutions of seismicity occurring in the NWGeysers shows a consistent N/NE orientation for themaximumhorizontal stress, indicating a combined normal and strike-slip faulting regime [Boyle and Zoback, 2014].
Journal of Geophysical Research: Solid Earth 10.1002/2014JB011385
MARTÍNEZ-GARZÓN ET AL. ©2014. American Geophysical Union. All Rights Reserved. 8380

Additionally, source parametersestimation of microearthquakes (M< 3)in this part of the field revealed averagestress drops of 11MPa, which iscomparable to the stress drops of naturaltectonic earthquakes occurring in thearea [Viegas and Hutchings, 2011].
3. Data andMethodology Used
We analyzed the seismic data from themost prominent and spatially isolatedcluster of IS in the northwestern part ofTG (Figure 1a). There, injection of waterinto the reservoir through the well Prati-9started in November 2007. In April 2010, asecond injection well (Prati-29) startedalso to inject water in the vicinity of thearea of investigation. In this well, twotrajectories were drilled, and it is unclearwhether the fluid flows through bothtrajectories or along a preferential one.Until December 2011, no productionoccurred through the nearest producerwell, Prati-25. A clear correlation betweenthe monthly seismicity rate and thevolume of water injected from both wellswas observed (Figure 1b).
In the following analyses, we focused onthe interpretation of time intervalsframing the two injection cyclesenclosing the most prominent peaks offluid injection into the reservoir andinducing large number of seismicevents. Seismicity from each cycle wasdivided into three subsets (stages)preceding, containing, and followingthe peak injection. Cycle 1 wascomposed of seismic activity framing
the peak injection at well Prati-9, reaching a maximum flow rate of 0.24Mm3 per month. During Cycle 2,both wells Prati-9 and Prati-29 were active. Summing the injection volumes from both, a maximuminjection rate of 0.32Mm3 per month was reached. Since water injection at TG follows a seasonal tendency,the peak injection usually occurred during the winter months. Note that the analyzed cycles do not contain
any shut-in periods when theinjection was stopped. The analyzedtime intervals used in each stage aresummarized in Table 1. The 1 yearperiod between the two analyzedcycles was not further interpretedbecause there were not enoughseismic events observed during thisperiod to conduct reliable statisticalanalyses as described below.
Figure 1. (a) Map views of seismicity for The Geysers geothermal fieldbetween 2007 and 2012 (locations from NCEDC). Location of TG in NorthAmerica (top left). TG map view of the entire reservoir (bottom left). Thedashed square is enlarged within the main map. Depth of the seismicity iscolor scaled. The trajectory of particular wells is plotted in blue. The ana-lyzed cluster in this study appears within the black rectangle in the mainfigure. Brown lines are faults mapped by U.S. Geological Survey. (b) Monthlynumber of events and daily injection data for the wells Prati-9 and Prati-29between November 2007 and December 2012. Red rectangles frame thetwo injection cycles that will be here interpreted in detail.
Table 1. Time Intervals and Number of Events Used in Each Stage of theAnalyzed Injection Cycles
Stage Time Interval Number of Events
Cycle 1 Before 8 April to 8 September 24During 8 October to 9 February 59After 9 March to 9 September 30
Cycle 2 Before 10 June to 10 October 60During 10 November to 11 April 207After 11 May to 11 October 65
Journal of Geophysical Research: Solid Earth 10.1002/2014JB011385
MARTÍNEZ-GARZÓN ET AL. ©2014. American Geophysical Union. All Rights Reserved. 8381

We initially used absolute hypocenter locations and focal mechanisms available from the catalogs of NorthernCalifornia Earthquake Data Center (NCEDC). Approximately 1150 seismic events with moment magnitude Mw
ranging between 1.0 and 3.3 were detected and located at the selected cluster of IS in the northwestern partof the field (Figure 1) during the time period between September 2007 and July 2012. Those hypocenters weredetermined using the HYPOINVERSE method [Klein, 2002] using a local 1-D gradient velocity model [Eberhart-Phillips and Oppenheimer, 1984]. To locate the events, seismic data from both local and regional stations wereused. Given the good azimuthal coverage of the seismic network and the large number of stations, the reportedaverage horizontal and vertical location uncertainty was in the order of 200m and 300m, respectively.
For the selected cluster of seismicity, 973 focal mechanisms were available in the NCEDC catalog during theanalyzed time period. They were calculated with FPFIT [Reasenberg and Oppenheimer, 1985] softwareusing on average more than 30 first-motion polarities per event. Daily injection rates were provided byCalpine Corporation.
We first investigated potential differences of the seismicity patterns during different stages of the injectioncycle (before/during/after peak injections). As the original catalog did not display any particular spatialfeatures (cf. Figure 1), we applied the double-difference earthquake relocation method to improve theprecision of spatial offsets between the individual earthquake hypocenters [Waldhauser and Ellsworth, 2000].The same velocity model as for the absolute location catalog was used. The double-difference methodallowed improving the internal precision of the relative hypocentral locations down to 40m. A total numberof 770 events were successfully relocated. Our distribution of relocated hypocenters resolved the seismicitypatterns similarly to the relocated catalog provided by Waldhauser and Schaff [2008].
Second, we recalculated the focal mechanisms with the FPFIT software based on the relocated hypocentercatalog and using all first-motion polarities available. The new focal mechanism catalog was categorizedinto strike-slip, normal, and thrust events based on the relative orientation of P/T/B axes (i.e., which of the axiswas closer to the vertical).
We then traced the evolution of various kinematic, spatial, and source characteristics of IS with time toinvestigate their response to changes in injection rates:
1. Monthly distribution of the earthquake faulting types using all recalculated focal mechanisms.2. Cumulative seismic moment release from the beginning of the analyzed period, separately for the three
faulting types. The moment magnitude was recalculated from coda duration magnitude using theMw-Md
relation estimated for TG [Edwards and Douglas, 2013] and converted to seismic moment using a standardrelationship [Hanks and Kanamori, 1979].
3. Temporal evolution of the Gutenberg-Richter b values. This was calculated using the goodness of fitmethod [Wiemer and Wyss, 2000] for different moving time windows containing 55, 65, and 75 events,respectively. The values for the moving windows were selected tomaximize the number of events at fixedresolution to visualize potential changes during peak injection intervals.
4. Temporal evolution of the relative stress magnitude R ¼ σ1�σ2σ1�σ3
from the stress inversion technique. Thestress inversion was performed using the MSATSI package [Martínez-Garzón et al., 2014], which is anupdated version of SATSI [Hardebeck and Michael, 2006]. Stress inversion was performed using movingwindows containing 55 events with a step size of 10. It should be noted that R is the parameter with thelargest uncertainty for the stress inversion technique irrespective of the performed 95% confidenceinterval uncertainty assessment.
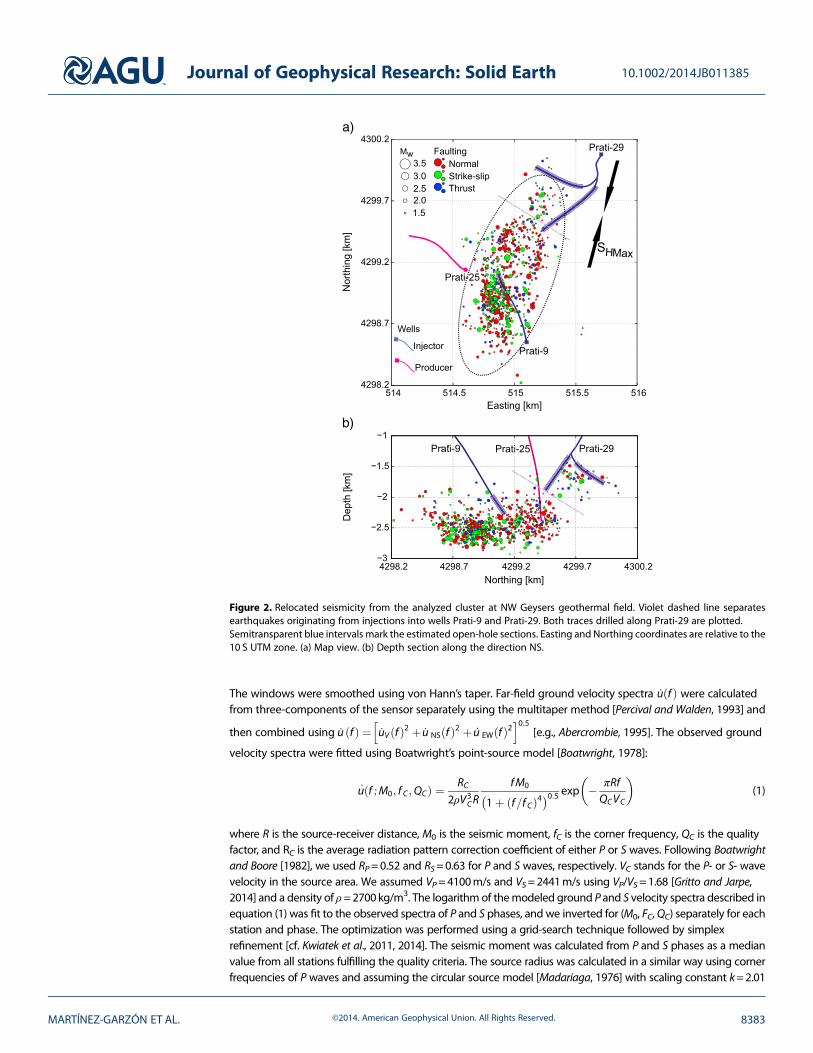
5. Temporal changes in the average hypocentral and epicentral distances of the seismicity from the bottomof the well Prati-9. The data were subdivided in moving windows as described for the stress inversion.Here we excluded those seismic events that seemed to be related to the injection into the nearby well(Prati-29, see Figure 2). The criteria to remove those events were based on time and proximity to the openhole from Prati-29 (see limiting line in Figure 2). Note that since a temporal criterion is also used, eventsclose to Prati-29 might be included if they occurred before injection into the well started.
6. Evolution of the average static stress drop with time released by seismic events from different faultingtypes. The static stress drops were calculated following a slightly modified spectral fitting method[Kwiatek et al., 2011, 2014]. The original three-component waveforms from stations located <20 km fromthe seismicity were initially filtered using a 1Hz high-pass filter. Waveforms were analyzed with a windowlength of 0.40 s with additional 0.10 s period prior to either P or S wave onsets, respectively.
Journal of Geophysical Research: Solid Earth 10.1002/2014JB011385
MARTÍNEZ-GARZÓN ET AL. ©2014. American Geophysical Union. All Rights Reserved. 8382
The windows were smoothed using von Hann’s taper. Far-field ground velocity spectra u̇ fð Þ were calculatedfrom three-components of the sensor separately using the multitaper method [Percival and Walden, 1993] and
then combined using u̇ fð Þ ¼ u̇V fð Þ2 þ u̇ NS fð Þ2 þ u̇ EW fð Þ2h i0:5
[e.g., Abercrombie, 1995]. The observed ground
velocity spectra were fitted using Boatwright’s point-source model [Boatwright, 1978]:
u̇ f ;M0; f C;QCð Þ ¼ RC2ρV3
CR
fM0
1þ f=f Cð Þ4� �0:5 exp � πRfQCVC
� �(1)
where R is the source-receiver distance, M0 is the seismic moment, fC is the corner frequency, QC is the qualityfactor, and RC is the average radiation pattern correction coefficient of either P or S waves. Following Boatwrightand Boore [1982], we used RP=0.52 and RS=0.63 for P and S waves, respectively. VC stands for the P- or S- wavevelocity in the source area. We assumed VP=4100m/s and VS=2441m/s using VP/VS=1.68 [Gritto and Jarpe,2014] and a density of ρ=2700kg/m3. The logarithm of themodeled ground P and S velocity spectra described inequation (1) was fit to the observed spectra of P and S phases, and we inverted for (M0, FC, QC) separately for eachstation and phase. The optimization was performed using a grid-search technique followed by simplexrefinement [cf. Kwiatek et al., 2011, 2014]. The seismic moment was calculated from P and S phases as a medianvalue from all stations fulfilling the quality criteria. The source radius was calculated in a similar way using cornerfrequencies of P waves and assuming the circular source model [Madariaga, 1976] with scaling constant k=2.01
Figure 2. Relocated seismicity from the analyzed cluster at NW Geysers geothermal field. Violet dashed line separatesearthquakes originating from injections into wells Prati-9 and Prati-29. Both traces drilled along Prati-29 are plotted.Semitransparent blue intervals mark the estimated open-hole sections. Easting and Northing coordinates are relative to the10 S UTM zone. (a) Map view. (b) Depth section along the direction NS.
Journal of Geophysical Research: Solid Earth 10.1002/2014JB011385
MARTÍNEZ-GARZÓN ET AL. ©2014. American Geophysical Union. All Rights Reserved. 8383

and a constant rupture velocity of VR=0.9VS.Finally, the static stress drop was calculatedfollowing Eshelby’s formula [Eshelby, 1957]:
ΔσD ¼ 716
M0r�30 (2)
4. Results
The relocated hypocenter catalog andcorresponding fault plane solutions allowidentifying distinct spatial and temporal patternsof the seismicity not visible in the original catalog(Figure 2). Seismic events form an ellipsoid locatedbelow the open-hole section of Prati-9. The longaxis of the seismicity cluster is oriented NNE/SSWparallel to the orientation of SHMax. There is asignificantly smaller shallow subcluster ofseismicity around the open-hole section ofwell Prati-29.
The most common faulting mechanism is normalfaulting, while a substantial number of events also
display strike-slip faulting. Many of the strike-slip events form an elongated but diffuse zone in the NNW-SSEdirection with one of the nodal planes typically aligned in similar direction (Figure 3). The existence of this NNW-SSE trending alignment of strike-slip faulting events (and one of their nodal planes) suggests the reactivation ofa potential fault or a network of small faults at the base of the field that was previously unknown. The alignmentof the strike-slip events and inferred fault(s) forms an angle of ~40° with respect to the orientation of SHMax.
Figure 3. Map view of the focal mechanisms of the 100 strike-slipseismic events with the lowest focal mechanism solution misfit.
Figure 4. Snapshots of the spatial distribution of the seismicity during the different stages of both analyzed injectioncycles. Symbol size represents the magnitude and symbol color represents the faulting style.
Journal of Geophysical Research: Solid Earth 10.1002/2014JB011385
MARTÍNEZ-GARZÓN ET AL. ©2014. American Geophysical Union. All Rights Reserved. 8384

Many normal faulting events are alsolocated within this alignment, includingthe largest event from the analyzedcluster (Mw 3.3). Thrust events are sparseand evenly distributed throughout thewhole cloud of IS.
In the following, we focus on potentialvariations of faulting kinematics andsource parameters in relation to peakinjections during both injection cycles.The spatial distribution of the seismicitybefore, during, and after peak injectionsreveals a distinct temporal evolution(Figure 4). For Cycle 1 (Figures 4a–4c),prior to and after the peak injection theseismicity was located mainly toward thesouth of the open-hole section of Prati-9around the mentioned NNW-SSEalignment. In contrast, during the peakinjection we observe a significantincrease in seismic events extendingNNE and SSW from the injection point,aligned with the orientation of SHMax
[Oppenheimer, 1986; Provost andHouston, 2003]. Spatial evolution ofseismicity during Cycle 2 follows ananalogous behavior, although someseismicity also occurs close to theinjection well Prati-29. For both injection
cycles, we also observe that some of the larger strike-slip events occur at a greater distance from theinjection point during the peak injection, especially during Cycle 1.
The diversity of the fault plane solutions is displayed in Figure 5 showing ternary Frohlich diagrams plottedfor each stage [Frohlich, 1991; Bohnhoff et al., 2004]. The dominant faulting style is normal faulting, inaccordance with the local stress field [Boyle and Zoback, 2014]. However, a substantial part of the calculatedfocal mechanisms display mixed mode faulting. In particular, many events with mixed normal/strike-slipfaulting behavior are observed, especially during peak injections. Note that many of the largest events fromthe analyzed cluster display pure strike-slip or very large strike-slip components. Especially for Cycle 2, many
of the normal faulting events have small magnitudes (Md~1). During peak injections, the number of purestrike-slip (with some thrust faulting) events also increases. On average Cycle 1 displays fewer events thanCycle 2 but with larger magnitudes. Cycle 2 contains a larger amount of smaller events with a mixednormal/strike-slip faulting style. However, during the peak injection of Cycle 1, a larger number of smallevents were excluded in the relocation process.
For both original and relocated catalogs, the total number of seismic events per month is well-correlated with the injection rates (Figures 6a–6b). The number of events from each faulting typeduring different injection stages is summarized in Table 2. During high injection rates an increase in thenumber of normal faulting events is observed (Figure 6b). The number of strike-slip and thrust events alsoincreases, but to a lesser extent. Interestingly, the percentage of normal faulting events is decreasing byapproximately 20% at the time of peak injections. In consequence, the percentage of strike-slip and/or thrustfaulting increases (Figure 6b). Still, particularly for Cycle 1, the number of relocated events is small and thismight weaken the performed statistic on these events. During Cycle 2, the number of thrust faulting events andstrike-slip events increased in similar proportion. However, during Cycle 1, the increase in strike-slip events islarger than the number of thrust events.
Figure 5. Ternary diagrams [Frohlich, 1991] for each of the stages ofboth analyzed injection cycles. Symbol size is scaled by with magni-tudes. The angular lines mark 50° dip. Green: strike slip, red: normalfaulting, and blue: thrust faulting.
Journal of Geophysical Research: Solid Earth 10.1002/2014JB011385
MARTÍNEZ-GARZÓN ET AL. ©2014. American Geophysical Union. All Rights Reserved. 8385

The cumulative seismic moment released by normal faulting and strike-slip events increased during peakinjections (Figure 6c). This is mainly due to the larger maximum magnitudes observed for the normal andstrike-slip events at these injection stages (see maximum magnitudes in Figure 6c) and less importantly, tothe larger number of seismic events at these times. In July 2010 the seismic moment release by normalfaulting events reaches a maximum, mainly because of a singleMw 3.3 normal faulting event which occurredtwo months after injection started at Prati-29.
During both analyzed injection cycles, a short-term b value decrease is observed coinciding with peakinjections (Figure 6d). In addition, a general trend toward decreasing b values is observed for Cycle 2.This trend is robust and independent of the size of the moving windows utilized to estimate the b value.
We also study variations of the relative stress magnitude R (R value) with time and injection history. Overall,the variations in the R value show some correlation with the injection rates and reflect a changing stress statein the reservoir when increased volumes of water are injected. During peak injection intervals, the relativestress magnitude increased slightly (Figure 7b). Although these changes are within statistical uncertainties,
Figure 6. Temporal evolution of injection rates and seismic characteristics (Part II). Cycle 1 and Cycle 2. (a) Daily injectionrates from Prati-9 and Prati-29 andmonthly seismicity rate (original catalog). (b) Monthly number of events of each faultingtype and percentage of each faulting style (relocated catalog). NF: normal faulting, SS: strike slip, and TF: thrust faulting.(c) Cumulative seismic moment (solid lines) and monthly maximum magnitude (dots) for each faulting type. Color isencoded as in Figure 6b). (d) b values for moving windows with a specific number of events.
Journal of Geophysical Research: Solid Earth 10.1002/2014JB011385
MARTÍNEZ-GARZÓN ET AL. ©2014. American Geophysical Union. All Rights Reserved. 8386

they do correlate well with observedchanges in principal stressorientation [Martínez-Garzón et al.,2013]. Additionally, the averageR value for the Cycle 1 (0.65) is higherthan the average value for Cycle2 (0.3). Thus, a steady decrease of R isobserved between the two injectioncycles. The average hypocentral and
epicentral distances between the seismic events and the injection well Prati-9 also increase during peakinjections (Figure 7c), particularly during Cycle 1 (Table 3).
During the first peak injection (Cycle 1), we observe a decrease in the average static stress drop of normal faultingevents, and a slight increase in the stress drops of strike-slip events. (Figure 7d). The average static stress drop fromthrust faulting events remains almost constant during Cycle 1. In contrast, during Cycle 2 no significant change inthe average stress drop for any fault mechanism is observed.
Table 2. Number of Events From Each Faulting Style During Each Injection Stage
Stage Normal Strike Slip Thrust
Cycle 1 Before 10 6 4During 30 20 9After 15 13 2
Cycle 2 Before 36 16 8During 126 50 31After 35 25 5
Figure 7. Temporal evolution of injection rates and seismic characteristics (Part II). Cycle 1 and Cycle 2. (a) Daily injectionrates from Prati-9 and Prati-29 and monthly seismicity rate (original catalog). (b) Relative stress magnitude R (black line).Vertical lines represent 95% confidence intervals. (c) Hypocentral and epicentral distances from the well Prati-9. (d) Timeevolution of average static stress drop from each faulting style. NF: normal faulting, SS: strike slip, and TF: thrust faulting.
Journal of Geophysical Research: Solid Earth 10.1002/2014JB011385
MARTÍNEZ-GARZÓN ET AL. ©2014. American Geophysical Union. All Rights Reserved. 8387

5. Discussion
Analysis of the seismicity cluster inthe NW Geysers geothermal fieldprovides an excellent opportunity togain additional insight in themechanics governing IS associatedwith fluid injection. This relativelyisolated seismicity cluster isespecially interesting given the longinjection history that includes several
different injection cycles, abundant seismic activity, and a clear correlation between the injection rates andinduced seismicity.
Recently, significant changes were observed in the stress field orientation during peaks of fluid injection intothe reservoir [Martínez-Garzón et al., 2013]. The current study aims to understand the physical mechanismsgoverning the perturbation of the local stress field and the resulting changes in seismic response. Thestress rotations were slightly more pronounced for the first peak injection (Cycle 1) at Prati-9. The observedchanges in seismicity parameters described in the previous section follow a similar trend, being generallystronger during Cycle 1 than during Cycle 2. This may be attributed to the fact that Cycle 1 was the first majorinjection in this area, while Cycle 2 occurred after several subsequent injection cycles. Other factors alsomight have played a role, e.g., the split of the injection volume into two wells (Prati-9 and Prati-29).
5.1. Thermoelastic Versus Poroelastic Stress Perturbations
A potential explanation for observed temporal and spatial changes of the seismic characteristics during peakinjection intervals may include an interplay of different physical mechanisms inducing seismicity. Rutqvistet al. [2013] recently suggested that thermal effects related to the injection of relatively cool water into thehot reservoir at depth may result in seismicity during the entire injection cycle (i.e., before/during/after peakinjections). Thermoelastic stress perturbation is expected to promote fracturing and increase the perme-ability of reservoir rocks, given that a network of secondary cracks oriented perpendicular to the mainfracture direction is introduced [Ghassemi, 2012]. Therefore, abundant microseismicity is likely to be observedin response to thermal contraction close to the well where cool surface water is injected (Figure 8). If the heatis transferred dominantly by conduction, no preferential direction is expected in the development of theseismic cloud induced by thermal fracturing. In contrast, if the heat transport was also assisted by advectionof the relative hot pore fluid, anisotropy on the microseismicity distribution around the well may occurcaused by preferential orientation of conductive fractures.
In addition, an injection-related increase in reservoir pore pressure may reactivate favorably oriented fractureswithin an existing network during peak injection periods. At TG, porosity of the rock matrix is only few percent,which suggests that fluid transport dominantly occurs along larger fractures rather than by flow through thematrix. However, at the spatial scale of interest in our study (few kilometers), it is expected that a largepopulation of fractures exist at various length scales and orientation which allows us to view the reservoireffectively as a porous medium. Considering a laterally infinite, isotropic, porous, and linearly elastic reservoirthat deforms uniaxially in the vertical direction, the change in horizontal stresses from fluid pressure changeunder constant vertical stress may be expressed as [see Brown et al., 1994]:
ΔSHMax;hmin ¼ α1� 2ν1� ν
Δp; (3)
where SHMax,hmin and SV are the horizontal and vertical stresses at reservoir depth, respectively, ν is Poisson’sratio, and α is Biot’s coefficient. Poroelastic changes of the reservoir stress state are often claimed to causefaulting, fracturing, and even changes in the stress regime resulting from production activities inhydrocarbon and geothermal reservoirs [Segall et al., 1994; Altmann et al., 2014].
Thermal and pore pressure effects may operate concurrently at different temporal and length scales dependingon the diffusivity of heat and pore pressure, which are governed by the thermal and transport properties ofthe reservoir. Below, we estimate the relative contributions of pore pressure and thermal effects duringinjection on the prevailing stress field and their respective roles for inducing faulting and seismicity (Figure 8).
Table 3. Average Hypocentral and Epicentral Distances Measured From theBottom of the Well Prati-9 for Each Stage and Cycle
Stage 3-D Distance (m) 2-D Distance (m)
Cycle 1 Before 339 233During 477 374After 408 260
Cycle 2 Before 400 300During 450 360After 370 235
Journal of Geophysical Research: Solid Earth 10.1002/2014JB011385
MARTÍNEZ-GARZÓN ET AL. ©2014. American Geophysical Union. All Rights Reserved. 8388

Thermal fracturing caused by relatively cool fluidinjection is assumed to be the primary causeresponsible for IS at TG based on a series ofmodeling studies and research conducted by thefield operator (Calpine Corporation) [e.g., Majeret al., 2007; Rutqvist et al., 2013]. In thenorthwestern part of TG, relatively cool water atapproximately surface temperature (≈20–25°C) isinjected into the reservoir. According to apressure-temperature log performed in the wellPrati-9 in December 2011, the water temperatureat the bottom of the well was approximately 76°C.The injected water is heated rapidly by thesurrounding rocks of the reservoir (240°C at thewell Prati-9) [García et al., 2012]. Consideringthese temperatures, the thermally inducedchanges in the circumferential stress ΔσT directlyat the wellbore may be estimated using [Stephensand Voight, 1982]:
ΔσT ¼ � αLEΔT1� ν
; (4)
where αLis the coefficient of linear thermalexpansion of the reservoir rock, E is the Youngmodulus of the reservoir rock, ΔT is the differencein temperature between the reservoir rock andthe water, and ν is the Poisson’s ratio. If weassume αL=1 � 10� 5K� 1 [Segall and Fitzgerald,1998], E= 12 � 109Pa, ν= 0.25, and the abovetemperatures difference, we estimate a thermallyinduced tensile stress magnitude of approximately�26MPa from strong thermal contraction at thewellbore wall, although the induced stresschanges attenuate very rapidly with distance. Also,at the depth of the seismicity cluster studied here,the temperature is expected to increase stronglywith depth, reaching 340°C only a few hundredmeters deeper. Therefore, our estimate of thethermal stress induced at the borehole isconsidered conservative.
At TG, the pore pressure at reservoir depth is subhydrostatic. The height of the water column filled inside thewell remains mostly within the reservoir limits, (<1 km from the bottom of the well). However, the increase inthe injection rate closely correlates with migration of IS suggesting that pore pressure changes may alsoinfluence seismic activity (Figure 1b). Also, the spatial extent of the seismic cloud suggests that seismicity isinduced by pore pressure changes at larger distance to the well.
We estimate the pore pressure at the Prati-9 injection well by analyzing the pressure record observed duringan injectivity test conducted in December 2011. During this test, sustained injection rates of 2725m3/d(representative for the time periods before and after peak injections), 4933m3/d, and 8231m3/d(representative for peak injections) resulted in pressures of approximately 2.75MPa, 3.17MPa, and 3.79MPa,respectively, for a tool suspended at a measured depth of 2682m. With a total measured depth of 3053mfor Prati-9, this indicates total water column heights of approximately 668m at 2725m3/d, 712m at4933m3/d, and 779m at 8231m3/d and corresponding total bottomhole pressures of approximately6.20MPa, 6.60MPa, and 7.23MPa, respectively.
Figure 8. Schematic diagram depicting physical mechanismsresponsible for IS at the selected cluster of seismicity fromThe Geysers. (a) Map view and (b) depth view. Thermoelasticeffect occurs near the injection well. The thermoelastic stressperturbation is initially assumed to result from isotropic heatconduction, and it may appear ellipsoidal if heat is transportedby advection through an anisotropic fracture network (see textfor details). The pore pressure diffuses further from the wellthrough the main fracture network aligned with SHMax.
Journal of Geophysical Research: Solid Earth 10.1002/2014JB011385
MARTÍNEZ-GARZÓN ET AL. ©2014. American Geophysical Union. All Rights Reserved. 8389
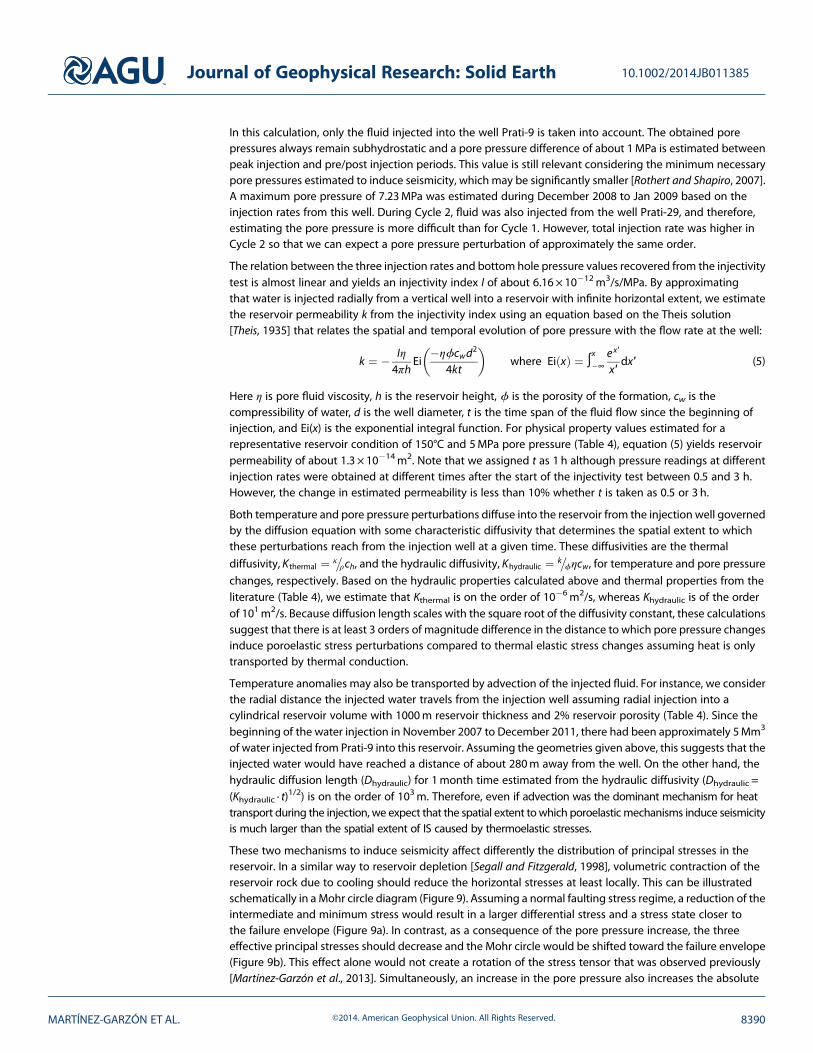
In this calculation, only the fluid injected into the well Prati-9 is taken into account. The obtained porepressures always remain subhydrostatic and a pore pressure difference of about 1MPa is estimated betweenpeak injection and pre/post injection periods. This value is still relevant considering the minimum necessarypore pressures estimated to induce seismicity, which may be significantly smaller [Rothert and Shapiro, 2007].A maximum pore pressure of 7.23MPa was estimated during December 2008 to Jan 2009 based on theinjection rates from this well. During Cycle 2, fluid was also injected from the well Prati-29, and therefore,estimating the pore pressure is more difficult than for Cycle 1. However, total injection rate was higher inCycle 2 so that we can expect a pore pressure perturbation of approximately the same order.
The relation between the three injection rates and bottom hole pressure values recovered from the injectivitytest is almost linear and yields an injectivity index I of about 6.16 × 10�12m3/s/MPa. By approximatingthat water is injected radially from a vertical well into a reservoir with infinite horizontal extent, we estimatethe reservoir permeability k from the injectivity index using an equation based on the Theis solution[Theis, 1935] that relates the spatial and temporal evolution of pore pressure with the flow rate at the well:
k ¼ � Iη4πh
Ei�ηϕcwd
2
4kt
� �where Ei xð Þ ¼ ∫
x
�∞ex′
x′dx′ (5)
Here η is pore fluid viscosity, h is the reservoir height, ϕ is the porosity of the formation, cw is thecompressibility of water, d is the well diameter, t is the time span of the fluid flow since the beginning ofinjection, and Ei(x) is the exponential integral function. For physical property values estimated for arepresentative reservoir condition of 150°C and 5MPa pore pressure (Table 4), equation (5) yields reservoirpermeability of about 1.3 × 10�14m2. Note that we assigned t as 1 h although pressure readings at differentinjection rates were obtained at different times after the start of the injectivity test between 0.5 and 3 h.However, the change in estimated permeability is less than 10% whether t is taken as 0.5 or 3 h.
Both temperature and pore pressure perturbations diffuse into the reservoir from the injection well governedby the diffusion equation with some characteristic diffusivity that determines the spatial extent to whichthese perturbations reach from the injection well at a given time. These diffusivities are the thermal
diffusivity, K thermal ¼ κρch�
, and the hydraulic diffusivity, Khydraulic ¼ kϕηcw�
, for temperature and pore pressure
changes, respectively. Based on the hydraulic properties calculated above and thermal properties from theliterature (Table 4), we estimate that Kthermal is on the order of 10�6m2/s, whereas Khydraulic is of the orderof 101m2/s. Because diffusion length scales with the square root of the diffusivity constant, these calculationssuggest that there is at least 3 orders of magnitude difference in the distance to which pore pressure changesinduce poroelastic stress perturbations compared to thermal elastic stress changes assuming heat is onlytransported by thermal conduction.
Temperature anomalies may also be transported by advection of the injected fluid. For instance, we considerthe radial distance the injected water travels from the injection well assuming radial injection into acylindrical reservoir volume with 1000m reservoir thickness and 2% reservoir porosity (Table 4). Since thebeginning of the water injection in November 2007 to December 2011, there had been approximately 5Mm3
of water injected from Prati-9 into this reservoir. Assuming the geometries given above, this suggests that theinjected water would have reached a distance of about 280m away from the well. On the other hand, thehydraulic diffusion length (Dhydraulic) for 1month time estimated from the hydraulic diffusivity (Dhydraulic =(Khydraulic · t)
1/2) is on the order of 103m. Therefore, even if advection was the dominant mechanism for heattransport during the injection, we expect that the spatial extent towhich poroelasticmechanisms induce seismicityis much larger than the spatial extent of IS caused by thermoelastic stresses.
These two mechanisms to induce seismicity affect differently the distribution of principal stresses in thereservoir. In a similar way to reservoir depletion [Segall and Fitzgerald, 1998], volumetric contraction of thereservoir rock due to cooling should reduce the horizontal stresses at least locally. This can be illustratedschematically in a Mohr circle diagram (Figure 9). Assuming a normal faulting stress regime, a reduction of theintermediate and minimum stress would result in a larger differential stress and a stress state closer tothe failure envelope (Figure 9a). In contrast, as a consequence of the pore pressure increase, the threeeffective principal stresses should decrease and the Mohr circle would be shifted toward the failure envelope(Figure 9b). This effect alone would not create a rotation of the stress tensor that was observed previously[Martínez-Garzón et al., 2013]. Simultaneously, an increase in the pore pressure also increases the absolute
Journal of Geophysical Research: Solid Earth 10.1002/2014JB011385
MARTÍNEZ-GARZÓN ET AL. ©2014. American Geophysical Union. All Rights Reserved. 8390

value of the horizontal stresses (equation (3)). The combined effect of both poroelastic stress andpore pressure changes from fluid injection result in shifting the Mohr circle toward the failure criteria.Assuming isotropic expansion of the pore pressure away from the well, radial horizontal effective stresscomponents will experience less reduction than the tangential horizontal effective stress components[Altmann et al., 2014]. In a normal faulting environment, this results in larger differential stresses along theSHMax direction [Schoenball et al., 2010; Altmann et al., 2014] promoting preferentially oriented shear failureand seismic activity.
The conclusions of this study usingobserved seismicity are in generalagreement with geomechanicalmodeling of an Enhanced GeothermalSystem (EGS) system locatedapproximately 1 km to the west [Rutqvistet al., 2013]. The authors concluded thatthe EGS-induced seismicity was primarilydue to thermal contraction, with asecondary contribution from reservoirsteam pressure changes.
In our study, the influence of reservoirdepletion is not considered because noproduction was being performed duringthe analyzed times in the area. However,reservoir depletion is also expected toaffect the seismicity at TG on larger timeand spatial scales.
5.2. Hypocenter Distribution andFaulting Mechanism
The spatial pattern of relocatedseismicity (Figures 2 and 4) reflects theregional stress field in that the first-orderellipsoidal shape of the seismic cloudhas the long axis subparallel to SHMax.This orientation is consistent with boththe regional stress field and with thedirection of preferred fault planesstudied in a seismicity cluster nearby[Boyle and Zoback, 2014]. This suggeststhat the regional stress field generallydominates the spatial distribution of theIS during the analyzed time period. The
Figure 9. Conceptual illustration of the variation of the principal stresseson the Mohr circle. Normal faulting is assumed. (a) Changes in differentialand mean stress due to the thermoelastic effects. (b) Changes in circledifferential and mean stress from poroelastic effects (see text for details).
Table 4. Physical Properties and Reservoir Parameters Used for Estimation of Diffusivities
Property Given Value Reference
Water dynamic viscosity, η 0.171 Batzle and Wang [1992]Porosity, ϕ 2% Barker et al. [1992]Water compressibility, cw 5. 10�4 MPa Batzle and Wang [1992]Reservoir height, h 1000m Calpine CorporationBorehole radius, r 10.80 cm Calpine CorporationTime span (during injectivity test), t 1 hRock density, ρ 2700 kg/m3
Thermal conductivity, κ 3.2W/m/°C Rutqvist et al. [2013]Specific heat capacity, ch 1000 J/kg/°C Rutqvist et al. [2013]
Journal of Geophysical Research: Solid Earth 10.1002/2014JB011385
MARTÍNEZ-GARZÓN ET AL. ©2014. American Geophysical Union. All Rights Reserved. 8391

alignment of seismicity with SHMax has also been observed in other geothermal projects, as in Soultz-sous-Forêts [Cuenot et al., 2006; Cornet et al., 2007]. For Soultz-sous-Forêts, it has been suggested that theelongated shape of the seismic cloud may be related to activation of a fault network and fluid pathwayspreferentially aligned parallel to SHMax. Alternatively, numerical modeling of poroelastic stress changes fromfluid injection indicates increased differential stresses promoting failure dominantly parallel to the SHMax
direction [Schoenball et al., 2010]. Both effects may be responsible for the observed ellipsoidal shape of theseismicity cluster.
It has been suggested previously that the migration of IS triggering front away from the injection well iscontrolled by hydraulic diffusion in the reservoir [Shapiro et al., 2002]. The gradual evolution of the triggeringfront with time after shut-in has been observed in several field studies [Shapiro et al., 2002; Bachmann et al.,2011; Albaric et al., 2014]. However, here we observe a short-term correlation between ongoing fluid injectionand the occurrence of seismicity at some distance to the well that was not previously noted. Note also thatthe seismicity collapses toward the injection point once the flow rate of the injected water has decreased(pulsation of the seismic cloud). This behavior is conceptually different from that of the back front of theseismicity as described by Parotidis et al. [2004]. These authors stated that no seismic event is expected tooccur close to the injection point once the injection has stopped. In this study, we are not expecting toobserve a back-front since there is no shut-in. Our observations are in better agreement with an almostinstantaneous or at least rapid poroelastic perturbation of the stress field caused by the injection.
5.3. b Values and Static Stress Drop
The observed decrease in b values during peak injections may be interpreted as the result of increasedcontribution by strike-slip and thrust faulting events with larger magnitudes on average. Analyzing seismiccatalogs of California and Japan, Schorlemmer et al. [2005] observed that b values depend on faulting regime,with the largest b values found for normal faulting, intermediate b values for strike-slip faulting, and the lowestb values for thrust faulting. Given that stresses in a thrust faulting regime are expected to be higher than in anormal faulting regime, the authors suggested that b values depend inversely to the differential stress andmaybe used as a stress meter. We find that during peak injection, the relative contribution of strike-slip and thrustfaulting events slightly increases and simultaneously b values decrease. This may suggest that during peakinjection and along the maximum stress direction, horizontal stresses increased as predicted by numericalmodeling [Schoenball et al., 2010]. Our findings cannot be directly compared to the results found for the BaselDeep Heat Mining Project, where a decrease in the b values occurred between the injection period and thepostinjection period [Bachmann et al., 2011]. Note that there are some differences between the Basel Deep HeatMining Project (or the EGS at Soultz-sous-Forêts) and our case study at The Geysers, the most important onesbeing the lower pore pressure at the reservoir level and the longer timescale of the injection at The Geysers.However, the physical mechanisms governing seismicity induced by fluid injection should be comparable.At TG, we also observe a change of the dominant faulting regime, which at the Basel site remains to be strikeslip [Terakawa et al., 2012].
The observed small variations of the stress drop observed during Cycle 1 in the normal faulting and strike-slipevents are not significant to allow for conclusions. Additionally, the fact that they only occur during Cycle 1complicates their interpretation. Results showing that the stress drop associated with thrust faulting islarger than that associated with normal faulting have been reported for a number of previous studies[e.g., Cocco and Rovelli, 1989; McGarr and Fletcher, 2002], but it is not always seen.
5.4. Stress Magnitudes
To estimate effective stress magnitudes at reservoir depth, we used the calculated pore pressures andinformation from a density log (available online at the Department of Conservation State of California).
Assuming an average density of the greywacke reservoir rock ρg= 2700 kg/m3, the vertical stress iscalculated from
SV ¼ ρggz (6)
where g is the gravitational acceleration and z is the average depth. For an average depth of 2.4 km for theanalyzed seismicity, taking into account the elevation of the well Prati-9 (663m) and assuming a normalfaulting stress regime, a value of SV= S1 = 78 MPa is obtained.
Journal of Geophysical Research: Solid Earth 10.1002/2014JB011385
MARTÍNEZ-GARZÓN ET AL. ©2014. American Geophysical Union. All Rights Reserved. 8392

We assume that maximum stresses in the reservoir are limited by critically stressed faults that are close tofailure. This is supported by the observation of IS occurring with small pore pressure perturbations (~1MPa).For frictional equilibrium of optimally oriented faults the ratio between maximum and minimum effectivestress assuming normal faulting stress regime is limited by [Jaeger and Cook, 1971]:
SV � pShmin � p
¼ffiffiffiffiffiffiffiffiffiffiffiffiffiffiμ2 þ 1
pþ μ
h i2(7)
where μ is the friction coefficient. Assuming a value of μ= 0.85 [Byerlee, 1978], and a minimum pore pressureof p= 6 MPa for the periods before and after peak injections, we estimate a lower boundary for theminimumhorizontal stress Shmin = 21 MPa for the time period before the peak injection.
To estimate a corresponding lower boundary for the intermediate stress, SHMax, we use the relative stressmagnitude R estimated from stress inversion. A representative R value for Cycle 1 is R= 0.65 and theintermediate stress can be estimated from
R ¼ σ1 � σ2σ1 � σ3
: (8)
The resulting intermediate stress is SHMax = 41 MPa before peak injection. Therefore, the initial effectivestress magnitudes for the time period before the peak injection (assuming a pore pressure of 6MPa) wouldbe about σV=72 MPa, σHMax = 35 MPa, σhmin = 15 MPa.
During the first peak injection, the pore pressure increases approximately Δp=1 MPa with respect to theprevious injection stage. Additionally, the horizontal stresses in radial direction from the injection well willincrease during the peak injection according to equation (3). Assuming a Poisson’s ratio of ν= 0.25 and amaximum Biot coefficient of α= 1, we obtain a maximum increase of the horizontal stresses of ΔSHMax,
hmin = 0.7 MPa.
Note that, by taking into account the value of the thermal stresses estimated at the wellbore, the effectivestresses in direct proximity to the wellbore wall are reduced such that σhmin would exceed reported tensilestrength for greywacke sandstone (8–12MPa) [Holub et al., 2009], although the spatial extent of thethermoelastic stresses is time dependent and it would be hard to quantify.
6. Conclusions
In this study, we analyzed spatiotemporal changes, faulting regimes, and source parameters of inducedseismicity associated with two fluid injection cycles performed in the northwestern part of The Geysersgeothermal field, California. Both injection cycles included a peak injection interval and periods of moderateinjection rates before and afterwards. We created an improved hypocenter catalog by relocating a total of770 induced seismic events and also calculated their fault plane solutions.
From aligned strike-slip events we suggest the presence of a previously unknown local fault in the vicinity ofthis injection area, which is favorably oriented with respect to the regional stress field. Depending on the sizeof the fault, this observation may have further implications for the local seismic hazard.
The spatiotemporal distribution of the seismicity, faulting kinematics, b values, relative stress magnitude anddistance from the injection well all show substantial changes during the times of peak-fluid injection withrespect to the times before and afterward. Most of these quantities reflect the change in the reservoir state ofstress during periods of enhanced injection rates, in agreement with previously observed changes in thestress field orientation during peaks of fluid injection. During the peak injection intervals the absolutenumber of normal faulting events increased but the relative number of strike-slip and thrust faulting eventsalso increased slightly (~15%). A decrease in b values simultaneous with the increase in relative amount ofstrike-slip and thrust events at peak injection rates has been observed. Additionally, the average distanceof the seismicity from the injection well is seen to increase significantly during the peak injections, suggestinga change in the spatial scale of the hypocenter cloud while the long axis of the ellipsoid is subparallelwith SHMax.
Our results suggest that fluid injectionmay induce thermoelastic and poroelastic effects that change the localstress field in a reservoir on different time and spatial scales. These local stress changes possibly govern IS
Journal of Geophysical Research: Solid Earth 10.1002/2014JB011385
MARTÍNEZ-GARZÓN ET AL. ©2014. American Geophysical Union. All Rights Reserved. 8393

mainly by activating a network of critically stressed faults. At TG, the high reservoir temperature (>240°C)and the large temperature difference with the injected fluid induces high thermal stresses at the wellborewall (~� 26MPa) that significantly exceed the induced difference in pore pressure ΔP=1 MPa. This suggeststhat near the well thermoelastic effects dominate over poroelastic stress changes regardless of the injectionstage. However, at some distance to the well and during the peak-fluid injections, pore pressure diffusionlikely dominates causing the observed seismicity as suggested by calculating characteristic length scales ofthermal and pore pressure effects, regardless of the mechanisms for heat transport.
ReferencesAbercrombie, R. E. (1995), Earthquake source scaling relationships from�1 to 5 ML using seismograms recorded at 2.5-km depth, J. Geophys.
Res., 100, 24,015–24,036, doi:10.1029/95JB02397.Albaric, J., V. Oye, N. Langet, M. Hasting, I. Lecomte, K. Iranpour, M. Messeiller, and P. Reid (2014), Monitoring of induced seismicity during the
first geothermal reservoir stimulation at Paralana, Australia, Geothermics, doi:10.1016/j.geothermics.2013.10.013.Allis, R. G. (1982), Mechanism of induced seismicity at The Geysers Geothermal Reservoir, California, Geophys. Res. Lett., 9, 629–632,
doi:10.1029/GL009i006p00629.Altmann, J. B., O. Heidbach, and R. Gritto (2013), Relative importance of processes leading to stress changes in The Geysers Geothermal area,
in Proceedings of the Thirty-Eight Workshop on Geothermal Reservoir Engineering, Stanford Univ., Stanford, Calif., 11–13 Feb., SGP-TR-198.[Available at https://pangea.stanford.edu/ERE/db/IGAstandard/record_detail.php?id=18981.]
Altmann, J. B., B. I. R. Müller, T. M. Müller, O. Heidbach, M. R. P. Tingay, and A. Weißhardt (2014), Pore pressure stress coupling in 3D andconsequences for reservoir stress states and fault reactivation, Geothermics, doi:10.1016/j.geothermics.2014.01.004.
Bachmann, C. E., S. Wiemer, J. Woessner, and S. Hainzl (2011), Statistical analysis of the induced Basel 2006 earthquake sequence:Introducing a probability-based monitoring approach for Enhanced Geothermal Systems, Geophys. J. Int., 186(2), 793–807, doi:10.1111/j.1365-246X.2011.05068.x.
Bachmann, C. E., S. Wiemer, B. P. Goertz-Allmann, and J. Woessner (2012), Influence of pore-pressure on the event-size distribution ofinduced earthquakes, Geophys. Res. Lett., 39, L09302, doi:10.1029/2012GL051480.
Barker, B. J., M. S. Gulati, M. A. Bryan, and K. L. Reidel (1992), Geysers reservoir performance, Monogr. Geysers Geotherm. Field Spec. Rep., 17,(Geothermal Research Council), 167–178.
Batzle, M., and Z. Wang (1992), Seismic properties of pore fluids, Geophysics, 57(11), 1396–1408.Boatwright, J. (1978), Detailed spectral analysis of two small New York State earthquakes, Bull. Seismol. Soc. Am., 68, 1131–1177.Boatwright, J., and D. M. Boore (1982), Analysis of the ground accelerations radiated by the 1980 Livermore Valley earthquakes for directivity
and dynamic source characteristics, Bull. Seismol. Soc. Am., 72(6A), 1843–1865.Bohnhoff, M., S. Baisch, and H.-P. Harjes (2004), Fault mechanisms of induced seismicity at the superdeep German Continental Deep Drilling
Program (KTB) borehole and their relation to fault structure and stress field, J. Geophys. Res., 109, B02309, doi:10.1029/2003JB002528.Boyle, K., and M. Zoback (2014), The Stress State of the Northwest Geysers, California Geothermal Field, and Implications for Fault-Controlled
Fluid Flow, Bull. Seismol. Soc. Am., doi:10.1785/0120130284.Brophy, P., M. J. Lippmann, P. F. Dobson, and B. Poux (2010), The Geysers geothermal field: Update 1990–2010, Geothermal Resour., Council,
Spec. Rep.Brown, K. M., B. Bekins, B. Clennell, D. Dewhurst, and G. Westbrook (1994), Heterogeneous hydrofracture development and accretionary fault
dynamics, Geology, 22(3), 259–262, doi:10.1130/0091-7613(1994)022<0259:HHDAAF>2.3.CO;2.Byerlee, J. (1978), Friction of rocks, Pure Appl. Geophys., 116(4–5), 615–626, doi:10.1007/BF00876528.Cocco, M., and A. Rovelli (1989), Evidence for the variation of stress drop between normal and thrust faulting earthquakes in Italy, J. Geophys.
Res., 94, 9399–9416, doi:10.1029/JB094iB07p09399.Cornet, F. H., T. Bérard, and S. Bourouis (2007), How close to failure is a granite rock mass at a 5 km depth?, Int. J. Rock Mech. Min. Sci., 44(1),
47–66, doi:10.1016/j.ijrmms.2006.04.008.Cuenot, N., J. Charléty, L. Dorbath, and H. Haessler (2006), Faulting mechanisms and stress regime at the European HDR site of Soultz-
sous-Forêts, France, Geothermics, 35(5–6), 561–575, doi:10.1016/j.geothermics.2006.11.007.DeCourten, F. (2008), Geology of Northern California, 48 pp. [Available at http://www.cengage.com/custom/regional_geology.bak/data/
DeCourten_0495763829_LowRes_New.pdf.]Dost, B., and H. K. Haak (2007), Natural and induced seismicity, in Geology of the Netherlands, edited by T. E. Wong, D. A. J. Batjes, and J. de Jager,
pp. 223–239, Royal Netherlands Academy of Arts and Sciences, Amsterdam.Eberhart-Phillips, D., and D. H. Oppenheimer (1984), Induced seismicity in The Geysers geothermal area, California, J. Geophys. Res., 89,
1191–1207, doi:10.1029/JB089iB02p01191.Edwards, B., and J. Douglas (2013), Magnitude scaling of induced earthquakes, Geothermics, doi:10.1016/j.geothermics.2013.09.012.Ellsworth, W. L. (2013), Injection-induced earthquakes, Science, 341(6142), 1225942, doi:10.1126/science.1225942.Eshelby, J. D. (1957), The determination of the elastic field of an ellipsoidal inclusion, and related problems, Proc. R. Soc. London, Ser. A,
241(1226), 376–396, doi:10.1098/rspa.1957.0133.Evans, K. F., A. Zappone, T. Kraft, N. Deichmann, and F. Moia (2012), A survey of the induced seismic responses to fluid injection in geothermal
and CO2 reservoirs in Europe, Geothermics, 41, 30–54, doi:10.1016/j.geothermics.2011.08.002.Foulger, G. R., C. C. Grant, A. Ross, and B. R. Julian (1997), Industrially induced changes in Earth structure at The Geysers Geothermal Area,
California, Geophys. Res. Lett., 24, 135–137, doi:10.1029/96GL03152.Frohlich, C. (1991), Display and quantitative assessment of distributions of earthquake focal mechanisms, Geophys. J. Int., 144, 300–308.García, J., M. Walters, J. Beall, C. Hartline, A. Pingol, S. Pistone, and M. Wright (2012), Overview of the north-western Geysers EGS
demonstration project, in Proceedings Thirty-Seventh Workshop Geothermal Reservoir Engineering, Stanford Univ., Stanford, Calif., 30 Jan.–1Feb., SGP-TR-194.
Ghassemi, A. (2012), A review of some rock mechanics issues in geothermal reservoir development, Geotech. Geol. Eng., 30(3), 647–664,doi:10.1007/s10706-012-9508-3.
Goertz-Allmann, B. P., A. Goertz, and S. Wiemer (2011), Stress drop variations of induced earthquakes at the Basel geothermal site, Geophys.Res. Lett., 38, L09308, doi:10.1029/2011GL047498.
AcknowledgmentsWe acknowledge funding within theHelmholtz-Alberta Initiative and from theHelmholtz Association in the frameworkof the Young Investigators Group “Frommicroseismicity to large earthquakes.”We thank the Northern CaliforniaEarthquake Data Center (NCEDC),Lawrence Berkeley National Laboratory,and David Oppenheimer for providingthe seismic data catalogs. We thankCalpine Corporation for high-resolutionhydraulic data and additional relevantinformation related to The Geysersgeothermal field. We thank Luca Urpi forearly discussions and Martin Schoenballfor providing a ternary plot code. Wefinally thank the reviewers MartinSchoenball and Danielle Sumy for manyuseful comments that substantiallyimproved the manuscript.
Journal of Geophysical Research: Solid Earth 10.1002/2014JB011385
MARTÍNEZ-GARZÓN ET AL. ©2014. American Geophysical Union. All Rights Reserved. 8394

Gritto, R., and S. P. Jarpe (2014), Temporal variations of Vp/Vs-ratio at The Geysers geothermal field, USA, Geothermics, 1–8,doi:10.1016/j.geothermics.2014.01.012.
Gunasekera, R. C., G. R. Foulger, and B. R. Julian (2003), Reservoir depletion at The Geysers geothermal area, California, shown by four-dimensionalseismic tomography, J. Geophys. Res., 108(B3), 2134, doi:10.1029/2001JB000638.
Hanks, T. C., and H. Kanamori (1979), A moment magnitude scale, J. Geophys. Res., 84, 2348–2350, doi:10.1029/JB084iB05p02348.Hardebeck, J. L., and A. J. Michael (2006), Damped regional-scale stress inversions: Methodology and examples for southern California and
the Coalinga aftershock sequence, J. Geophys. Res., 111, B11310, doi:10.1029/2005JB004144.Holub, K., P. Konečný Jr., and J. Knejzlík (2009), Investigation of the mechanical and physical properties of greywacke specimens, Int. J. Rock
Mech. Min. Sci., 46(1), 188–193, doi:10.1016/j.ijrmms.2008.02.011.Hulen, J. B., J. C. Quick, and J. N. Moore (1997a), Converging evidence for fluid overpressures at peak temperatures in the pre-vapor
dominated Geysers Hydrothermal system, Geotherm. Reseour. Council Trans., 21, 623–628.Hulen, J. B., M. T. Heizler, J. A. Stimac, J. N. Moore, and J. C. Quick (1997b), New Constraints on the Timing and Magmatism, Volcanism and the
Onset of the Vapor Dominated Conditions at The Geysers Steam Field, California, pp. 75–82, Stanford Univ., Stanford, Calif.Jaeger, J., and N. G. Cook (1971), Fundamentals of Rock Mechanics.Jeanne, P., J. Rutqvist, D. Vasco, J. Garcia, P. F. Dobson, M. Walters, C. Hartline, and A. Borgia (2014), A 3D hydrogeological and geomechanical
model of an Enhanced Geothermal System at The Geysers, California, Geothermics, 51, 240–252, doi:10.1016/j.geothermics.2014.01.013.Klein, F. (2002), User’s guide to HYPOINVERSE-2000, a Fortran Program to Solve for Earthquake Locations and Magnitudes, U.S. Geol. Surv.
Open File Rep., 2–171.Kwiatek, G., K. Plenkers, and G. Dresen (2011), Source parameters of picoseismicity recorded at Mponeng deep gold mine, South Africa:
Implications for scaling relations, Bull. Seismol. Soc. Am., 101(6), 2592–2608, doi:10.1785/0120110094.Kwiatek, G., M. Bohnhoff, P. Martínez-Garzón, F. Bulut, and G. Dresen (2013), High resolution reservoir characterization using induced
seismicity and state of the art waveform processing techniques, First Break, 31(7), 81–88.Kwiatek, G., F. Bulut, M. Bohnhoff, and G. Dresen (2014), High-resolution analysis of seismicity induced at Berlín geothermal field, El Salvador,
Geothermics, doi:10.1016/j.geothermics.2013.09.008.Madariaga, R. (1976), Dynamics of an expanding circular fault, Bull. Seismol. Soc. Am., 66, 639–666.Majer, E. L., and J. E. Peterson (2007), The impact of injection on seismicity at The Geysers, California Geothermal Field, Int. J. Rock Mech. Min.
Sci., 44(8), 1079–1090, doi:10.1016/j.ijrmms.2007.07.023.Majer, E. L., R. Baria, M. Stark, S. Oates, J. Bommer, B. Smith, and H. Asanuma (2007), Induced seismicity associated with Enhanced Geothermal
Systems, Geothermics, 36(3), 185–222, doi:10.1016/j.geothermics.2007.03.003.Martínez-Garzón, P., M. Bohnhoff, G. Kwiatek, and G. Dresen (2013), Stress tensor changes related to fluid injection at The Geysers
geothermal field, California, Geophys. Res. Lett., 40, 2596–2691, doi:10.1002/grl.50438.Martínez-Garzón, P., G. Kwiatek, M. Ickrath, and P. Bohnhoff (2014), MSATSI: A MATLAB package for stress inversion combining solid classic
methodology, a new simplified user-handling and a visualization tool, Seismol. Res. Lett., 85, 4, doi:10.1785/0220130189.McGarr, A. (2014), Maximum magnitude earthquakes induced by fluid injection, J. Geophys. Res. Solid Earth, 119, 1008–1019, doi:10.1002/
2013JB010597.McGarr, A., and J. B. Fletcher (2002), Mapping apparent stress and energy radiation over fault zones of major earthquakes, Bull. Seismol. Soc.
Am., 92(5), 1633–1646, doi:10.1785/0120010129.Moore, J. N., M. C. Adams, and A. J. Anderson (2000), The fluid inclusion and mineralogical record of the transition from liquid to vapor-
dominated conditions in the Geysers geothermal system, Econ. Geol., 95.Mossop, A., and P. Segall (1997), Subsidence at The Geysers geothermal field, N. California from a comparison of GPS and leveling surveys,
Geophys. Res. Lett., 24, 1839–1842, doi:10.1029/97GL51792.Oppenheimer, D. H. (1986), Extensional tectonics at The Geysers geothermal area, California, J. Geophys. Res., 91, 11,463–11,476,
doi:10.1029/JB091iB11p11463.Parotidis, M., S. A. Shapiro, and E. Rothert (2004), Back front of seismicity induced after termination of borehole fluid injection, Geophys. Res.
Lett., 31, L02612, doi:10.1029/2003GL018987.Percival, D. B., and A. T. Walden (1993), Spectral Analysis for Physical Applications: Multitaper and Conventional Univariate Techniques,
Cambridge Univ. Press., Cambridge, U. K.Provost, A.-S., and H. Houston (2003), Stress orientations in northern and central California: Evidence for the evolution of frictional strength
along the San Andreas plate boundary system, J. Geophys. Res., 108(B3), 2175, doi:10.1029/2001JB001123.Reasenberg, P., and D. Oppenheimer (1985), FPFIT, FPPLOT and FPPAGE: Fortran computer programs for calculating and displaying
earthquake fault-plane solutions, U.S. Geol. Surv. Open File Rep., 85–739.Rothert, E., and S. A. Shapiro (2007), Statistics of fracture strength and fluid-induced microseismicity, J. Geophys. Res., 112, B04309,
doi:10.1029/2005JB003959.Rutqvist, J., P. F. Dobson, J. Garcia, C. Hartline, P. Jeanne, C. M. Oldenburg, D. W. Vasco, and M. Walters (2013), The Northwest Geysers
EGS Demonstration Project, California: Pre-stimulation modeling and interpretation of the stimulation, Math. Geosci., 1–27,doi:10.1007/s11004-013-9493-y.
Schoenball, M., T. M. Müller, B. I. R. Müller, and O. Heidbach (2010), Fluid-induced microseismicity in pre-stressed rock masses, Geophys. J. Int.,180(2), 813–819, doi:10.1111/j.1365-246X.2009.04443.x.
Schoenball, M., L. Dorbath, E. Gaucher, J. Florian Wellmann, and T. Kohl (2014), Change of stress regime during geothermal reservoir sti-mulation, Geophys. Res. Lett., 41, 1163–1170, doi:10.1002/2013GL058514.
Segall, P., and S. D. Fitzgerald (1998), A note on induced stress changes in hydrocarbon and geothermal reservoirs, Tectonophysics, 289(1–3),117–128, doi:10.1016/S0040-1951(97)00311-9.
Segall, P., J.-R. Grasso, and A. Mossop (1994), Poroelastic stressing and induced seismicity near the Lacq gas field, southwestern France,J. Geophys. Res., 99, 15,423–15,438, doi:10.1029/94JB00989.
Shapiro, S. A., P. Audigane, and J.-J. Royer (1999), Large-scale in situ permeability tensor of rocks from induced microseismicity, Geophys.J. Int., 137(1), 207–213, doi:10.1046/j.1365-246x.1999.00781.x.
Shapiro, S. A., E. Rothert, V. Rath, and J. Rindschwentner (2002), Characterization of fluid transport properties of reservoirs using inducedmicroseismicity, Geophysics, 67(1), 212–220, doi:10.1190/1.1451597.
Shapiro, S. A., R. Patzig, E. Rothert, and J. Rindschwentner (2003), Triggering of seismicity by pore-pressure perturbations: Permeability-related signatures of the phenomenon, Pure Appl. Geophys., 160(5–6), 1051–1066, doi:10.1007/PL00012560.
Stephens, G., and B. Voight (1982), Hydraulic fracturing theory for conditions of thermal stress, Int. J. Rock Mech. Min. Sci. Geomech. Abstr.,19(6), 279–284, doi:10.1016/0148-9062(82)91364-X.
Journal of Geophysical Research: Solid Earth 10.1002/2014JB011385
MARTÍNEZ-GARZÓN ET AL. ©2014. American Geophysical Union. All Rights Reserved. 8395

Terakawa, T., S. A. Miller, and N. Deichmann (2012), High fluid pressure and triggered earthquakes in the enhanced geothermal system inBasel, Switzerland, J. Geophys. Res., 117, B07305, doi:10.1029/2011JB008980.
Theis, C. V. (1935), The relation between the lowering of the piezometric surface and the rate and duration of discharge of a well usingground-water storage, Transactions, 16, 519–524.
Vasco, D. W., J. Rutqvist, A. Ferretti, A. Rucci, F. Bellotti, P. Dobson, C. Oldenburg, J. Garcia, M. Walters, and C. Hartline (2013), Monitoringdeformation at The Geysers Geothermal Field, California using C-band and X-band interferometric synthetic aperture radar, Geophys. Res.Lett., 40, 2567–2572, doi:10.1002/grl.50314.
Viegas, G., and L. Hutchings (2011), Characterization of induced seismicity near an injection well at the Northwest Geysers geothermal field,California. Geothermal Resources Council Transactions, 35.
Waldhauser, F., and W. L. Ellsworth (2000), A double-difference earthquake location algorithm: Method and application to the NorthernHayward Fault, California, Bull. Seismol. Soc. Am., 90(6), 1353–1368, doi:10.1785/0120000006.
Waldhauser, F., and D. P. Schaff (2008), Large-scale relocation of two decades of Northern California seismicity using cross-correlation anddouble-difference methods, J. Geophys. Res., 113, B08311, doi:10.1029/2007JB005479.
Wiemer, S., and M. Wyss (2000), Minimum magnitude of completeness in earthquake catalogs: Examples from Alaska, the Western UnitedStates & Japan, Bull. Seismol. Soc. Am., 90, 859–869.
Journal of Geophysical Research: Solid Earth 10.1002/2014JB011385
MARTÍNEZ-GARZÓN ET AL. ©2014. American Geophysical Union. All Rights Reserved. 8396