by david r. bohnhoff, ph.d., p.e. professor, biological ...tristatepc.com/pc wisconsin test data...
TRANSCRIPT

Engineering Design Manual for
Series 6300, 6400, 8300, 8400 Perma-Columns
by David R. Bohnhoff, Ph.D., P.E.
Professor, Biological Systems Engineering University of Wisconsin-Madison
Ver101404

Perma-Column Engineering Design Manual…………………………………………………………………….Page 1
Table of Contents
Abstract ........................................................................................................................................ 3
Disclaimer .................................................................................................................................... 3
1. Perma Column Dimensions and Material Properties ............................................................. 4
2. Design Overview.................................................................................................................... 5
2.1 Design Philosophies: Strength Design vs. Allowable Stress Design ........................... 5
2.2 Governing Equations..................................................................................................... 6
2.3 Load Combinations and Load Factors .......................................................................... 7
3. Strength Properties of the Reinforced Concrete..................................................................... 8
3.1 Bending Strength Under Just Flexural Load (No Axially Applied Loads)................... 9
3.2 Axial Load Strength Under Zero Eccentricity (No Flexural Load) ............................ 10
3.3. Strength Under Combined Bending & Axial Compressive Loads ............................. 11
3.4 Shear Strength ............................................................................................................. 17
3.5 Comparison With Wood Strength Values................................................................... 19
4. Strength Properties of Steel Bracket ................................................................................... 22
4.1 Bending Strength......................................................................................................... 22
4.2 Shear Strength ............................................................................................................. 22
5. Stiffness of the Reinforced Concrete .................................................................................. 23
5.1 Concrete Modulus of Elasticity................................................................................... 23
5.2 Reinforced Concrete Moment of Inertia ..................................................................... 23
6. Rotational Stiffness of Steel Bracket-to-Wood Connection ................................................ 26
6.1 Fastener Slip Modulus................................................................................................. 26
6.2 Rotational Stiffness ..................................................................................................... 27
6.3 Connection Modeling.................................................................................................. 27
Appendix A: Column Bending Tests ......................................................................................... 29
A.1 Introduction, Test Methods and Equipment ................................................................ 29
A.2 Results ......................................................................................................................... 29
A.3 Comparisons................................................................................................................ 32
A.4 References ................................................................................................................... 33

Perma-Column Engineering Design Manual…………………………………………………………………….Page 2
Appendix B: Bracket Bending Tests .......................................................................................... 34
B.1 Test Methods and Equipment...................................................................................... 34
B.2 Results ......................................................................................................................... 35
B.3 Discussion ................................................................................................................... 38
Appendix C: Shear Tests............................................................................................................ 40
C.1 Test Methods and Equipment...................................................................................... 40
C.2 Results ......................................................................................................................... 41
C.3 Comparisons................................................................................................................ 41
C.4 Concrete Compressive Strength .................................................................................. 43
Appendix D: Steel Bracket-to-Wood Connection Tests ............................................................ 44
D.1 Overview ..................................................................................................................... 44
D.2 Wood Properties .......................................................................................................... 45
D.3 Connection Test Methods and Equipment .................................................................. 47
D.4 Results ......................................................................................................................... 48
D.5 Fastener Shear Strength and Load-Slip Relationships ................................................ 53
D.6 References ................................................................................................................... 56

Perma-Column Engineering Design Manual…………………………………………………………………….Page 3
Abstract Elements of a Perma-Column, like elements of any structural component or system, must be checked to ensure that loads applied to the building do not overload the column. In the case of a Perma-Column, three items must be checked for structural adequacy: the reinforced concrete portion, the steel bracket, and the connection between the steel bracket and a wood post. In the following document, design values for the reinforced concrete portion and steel bracket are presented. Disclaimer Engineers using the Perma-Columns design values presented in this document must make sure that they are applicable to the condition in question. This document does not address load cases involving tension, bi-axial bending, torsion, or magnified moments as defined in ACI 318.

Perma-Column Engineering Design Manual…………………………………………………………………….Page 4
1. Perma Column Dimensions and Material Properties Perma-column dimensions are graphical defined in Figure 1.1 and numerically compiled in Table 1.1. All dimensions identified in figure 1.1 except s5 remain fixed along the entire length of a Perma-column. This change does not impact axial, shear, or strong axis bending properties.
Figure 1.1. Variable definitions for Perma-columns. Table 1.1: Perma Column Cross-Sectional Dimensions and Material Properties
Variable Symbol Units PC6300 PC6400 PC8300 PC8400
Overall Concrete Width b in. 5.38 6.88 5.38 6.88 Overall Concrete Depth h in. 5.44 5.44 7.19 7.19 Depth to Top Steel d' in. 1.50 1.50 1.56 1.56 Depth to Bottom Steel d in. 3.94 3.94 5.62 5.62 Width of Steel Bracket s1 in. 5.00 5.00 7.00 7.00 Top & Bottom Steel Spacing s2 in. 2.44 2.44 4.06 4.06 Steel Distance to Bracket Edge s3 in. 1.28 1.28 1.47 1.47 Area of Top Steel As' in.2 0.40 0.40 0.62 0.62 Area of Bottom Steel As in.2 0.40 0.40 0.62 0.62 Steel Yield Strength fy lbf/in.2 60000 60000 60000 60000 Concrete Compressive Strength fc' lbf/in.2 10000 10000 10000 10000 Steel Modulus of Elasticity Es lbf/in.2 29000000 29000000 29000000 29000000
American Concrete Institute (ACI) specifications for concrete protection of steel reinforcement require that where precast concrete components will be exposed to earth or weather, a minimum concrete cover of 1.25 inches is required on all steel reinforcement (ACI 318 Section 7.7.2). Nominal concrete cover on steel in all Perma-Columns is 1.25 inches.
h
b
s2
s3
s3
s1
d’d
h
b
top steel
bottom steel
s5
h
b
s2
s3
s3
s1
d’d
h
b
top steel
bottom steel
s5
Perma-Column Engineering Design Manual…………………………………………………………………….Page 5
2. Design Overview One of the primary tasks of the design engineer is to ensure that structural components are not overloaded. This is a fairly systematic process that involves three major steps: establishment of design loads, structural analysis and component selection.
During the first step – establishment of design loads – the engineer must estimate the actual maximum loads (a.k.a. extreme loads) that could be applied to the structure during its design life. These estimated loads are more generally known as nominal loads, but may also be referred to as service loads, working loads or unfactored loads. Common load categories include: dead, earthquake, fluid, soil, live, roof live, rain, snow, self-straining and wind. Note that in addition to estimating these loads, an engineer must select the various combination(s) of these loads that will be applied to the structure during the structural analysis phase.
Structural analysis, which is the second step in a design process, involves determining the forces induced in structural components when loads are applied to the structure. The simplicity of many structures enables engineers to limit most analyses to what is occurring within a given plane of the structure. Referred to as a two-dimensional analysis, such an investigation typically provides the engineer with the axial force, bending moment and shear force at every point of each component lying within the plane of interest.
The third and final step in the design process is to check that the axial force, bending moment and shear forces induced in each component do not exceed allowable values. Where the allowable strength of a component is exceeded, the component must be replaced with one that is more substantial, or other changes must be made to the structure to reduce the forces induced in the component. Regardless of which route is taken, the structure must typically be reanalyzed once changes are made to one or more components.
Critically important in the design process is to ensure that there is a sufficient margin of safety built into the design. Exactly how safety is “built” into the design process depends on the overall design philosophy utilized (strength design versus allowable stress design) as discussed in the following section.
During the design process a Perma-Column would be analyzed as three separate components: a reinforced concrete base, a steel attaching bracket, and a steel-to-wood post connection system. Because each of these three elements involves a different combination of materials, three different design specifications actually apply. Specifically, American Concrete Institute (ACI) specifications control the design on the reinforced concrete base, both ACI and American Institute of Steel Construction (AISC) apply to the steel bracket design, and American Wood and Paper Association (AWPA) specifications apply to the steel-to-wood post connection system.
2.1 Design Philosophies: Strength Design vs. Allowable Stress Design Two fundamentally different design procedures are available to determine if a structural component is strong enough to withstand the loads to which it will be subjected: allowable stress design and strength design. As previously mentioned, these two design philosophies primarily differ in how they account for uncertainties in design. In other words, they differ in how they include a factor of safety in structural calculations.
Perma-Column Engineering Design Manual…………………………………………………………………….Page 6
From a safety perspective, it is important to understand that many uncertainties surround structural design. For example, in practice the magnitude of extreme loads may vary from predicted values and simplifying assumptions made during structural analyses may be highly inaccurate. Additionally, the same analyses may have ignored complex and/or critical interactions between components/systems as well as critical loads and/or load combinations to which the structure is subjected. Also, actual material strengths and dimensions of components used in construction may differ measurably from those assumed during design, and construction oversights may have resulted in critical components being omitted and/or incorrectly installed.
In allowable stress design (ASD), stresses induced in members by nominal (a.k.a. unfactored) loads must not exceed published allowable stresses for the component in question. Safety is accounted for by publishing allowable stress values that are a fraction of the stresses that would result in a failure of the component. In strength design, nominal loads are increased by load factors, and the forces induced in structural components by these factored loads can not exceed published ultimate component strengths that have been reduced by resistance factors. It follows that safety in strength design is accounted for in the load factors and in the resistance factors. To this end, strength design is also referred to as load and resistance factor design (LRFD).
Up until the later 1950’s, all wood, steel, and reinforced concrete components were designed using ASD. Traditionally, this design philosophy was referred to as working stress design by the American Concrete Institute (ACI). During the late 1950’s, ACI introduced the strength design method as an alternative to their working stress design. During the 1980’s, the steel industry followed the concrete industry and developed a strength design methodology which was referred to as LRFD for steel construction. The wood industry followed suit, developing an LRFD or strength design procedure for wood construction in the mid 1990s. However, unlike the concrete and steel industries, the wood industry has been relatively slow to embrace LRFD; that is, the size of virtually all wood members is still determined used ASD procedures.
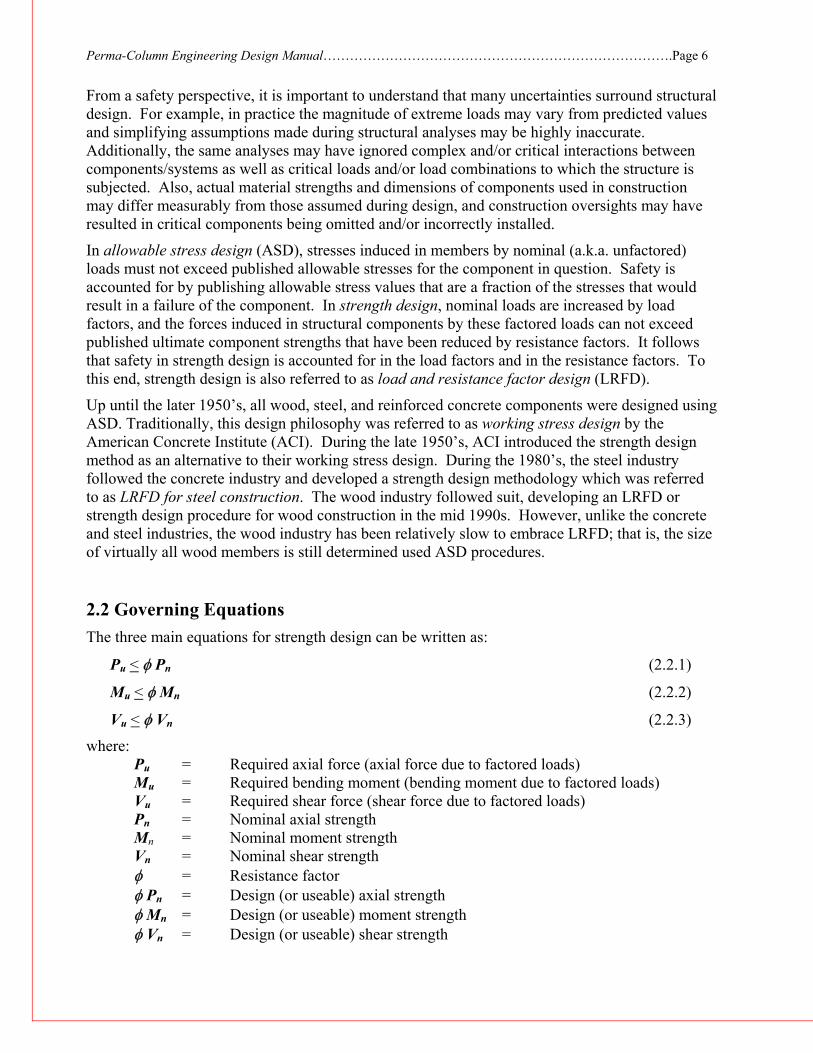
2.2 Governing Equations The three main equations for strength design can be written as:
Pu < φ Pn (2.2.1)
Mu < φ Mn (2.2.2)
Vu < φ Vn (2.2.3)
where: Pu = Required axial force (axial force due to factored loads) Mu = Required bending moment (bending moment due to factored loads) Vu = Required shear force (shear force due to factored loads) Pn = Nominal axial strength Mn = Nominal moment strength Vn = Nominal shear strength φ = Resistance factor
φ Pn = Design (or useable) axial strength φ Mn = Design (or useable) moment strength φ Vn = Design (or useable) shear strength

Perma-Column Engineering Design Manual…………………………………………………………………….Page 7
Strength design is recommended when checking the adequacy of the reinforced concrete section and steel attachment bracket of a Perma-Column. Note that in order to do this, design strength values φPn, φMn, and φVn must be established for the reinforced concrete section and the steel attachment bracket of each Perma-Column series. This is done in Sections 3 and 4, respectively. 2.2 Load Combinations and Load Factors The resistance factors used in strength design depend on and/or dictate the load factors and corresponding load combinations used during structural analysis to obtain the required strength values (e.g., Vu, Mu, Pu). To use the resistance factors outlined in following sections for strength design will require use of the following ANSI/ASCE 7 load combinations.
1.4·(D + F) (2.2.1)
1.2·(D + F + T)+ 1.6·(L + H)+ 0.5·(Lr or S or R) (2.2.2)
1.2·D + 1.6·(Lr or S or R) + (x·L or 0.8·W) (2.2.3)
1.2·D + 1.6·W + x·L + 0.5·(Lr or S or R) (2.2.4)
1.2·D + 1.0·E + x·L + 0.2·S (2.2.5)
0.9·D + (1.0·E or 1.6·W) + 1.6H (2.2.6)
D = Dead Load E = Earthquake Load F = Fluid Load H = Soil Load L = Live Load Lr = Roof Live Load R = Rain Load S = Snow Load T = Self-Straining Load W = Wind Load x = 1.0 for garages, areas of public occupancy, and values of L greater than 100 lbf/ft2. When
L is less than or equal to 100 lbf/ft2, set x equal to 0.5.
Perma-Column Engineering Design Manual…………………………………………………………………….Page 8
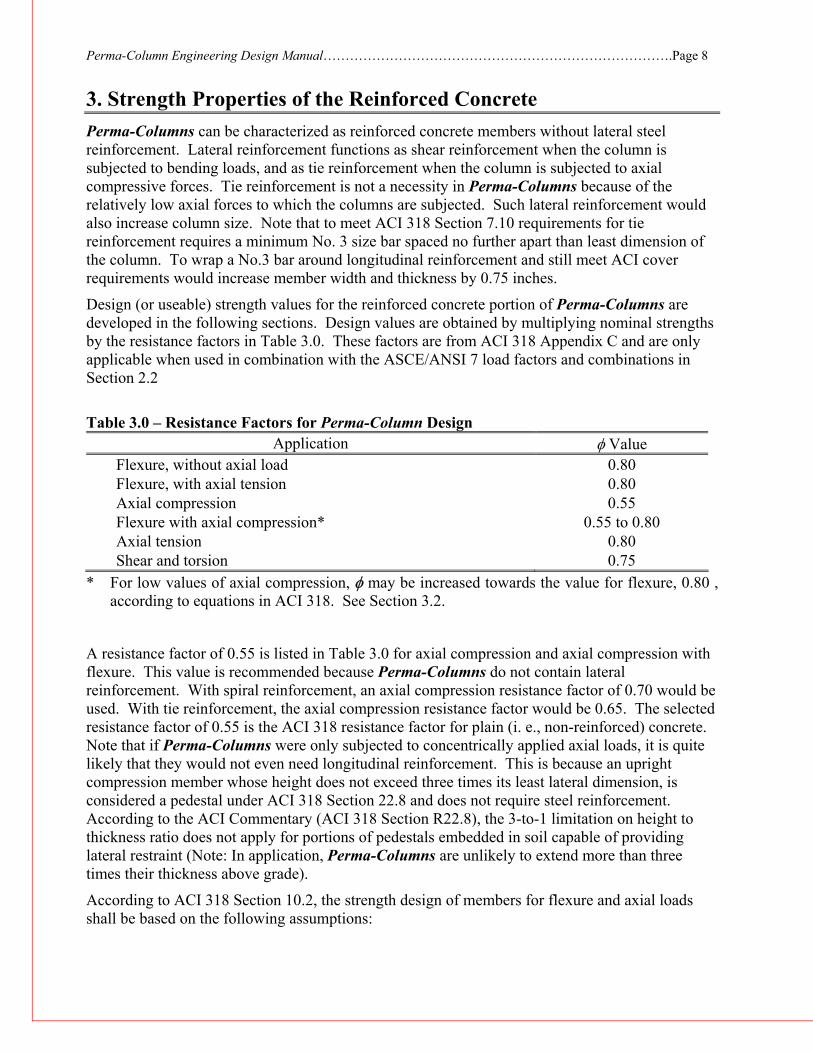
3. Strength Properties of the Reinforced Concrete Perma-Columns can be characterized as reinforced concrete members without lateral steel reinforcement. Lateral reinforcement functions as shear reinforcement when the column is subjected to bending loads, and as tie reinforcement when the column is subjected to axial compressive forces. Tie reinforcement is not a necessity in Perma-Columns because of the relatively low axial forces to which the columns are subjected. Such lateral reinforcement would also increase column size. Note that to meet ACI 318 Section 7.10 requirements for tie reinforcement requires a minimum No. 3 size bar spaced no further apart than least dimension of the column. To wrap a No.3 bar around longitudinal reinforcement and still meet ACI cover requirements would increase member width and thickness by 0.75 inches.
Design (or useable) strength values for the reinforced concrete portion of Perma-Columns are developed in the following sections. Design values are obtained by multiplying nominal strengths by the resistance factors in Table 3.0. These factors are from ACI 318 Appendix C and are only applicable when used in combination with the ASCE/ANSI 7 load factors and combinations in Section 2.2
Table 3.0 – Resistance Factors for Perma-Column Design
Application φ Value Flexure, without axial load 0.80 Flexure, with axial tension 0.80 Axial compression 0.55 Flexure with axial compression* 0.55 to 0.80 Axial tension 0.80 Shear and torsion 0.75
* For low values of axial compression, φ may be increased towards the value for flexure, 0.80 , according to equations in ACI 318. See Section 3.2.
A resistance factor of 0.55 is listed in Table 3.0 for axial compression and axial compression with flexure. This value is recommended because Perma-Columns do not contain lateral reinforcement. With spiral reinforcement, an axial compression resistance factor of 0.70 would be used. With tie reinforcement, the axial compression resistance factor would be 0.65. The selected resistance factor of 0.55 is the ACI 318 resistance factor for plain (i. e., non-reinforced) concrete. Note that if Perma-Columns were only subjected to concentrically applied axial loads, it is quite likely that they would not even need longitudinal reinforcement. This is because an upright compression member whose height does not exceed three times its least lateral dimension, is considered a pedestal under ACI 318 Section 22.8 and does not require steel reinforcement. According to the ACI Commentary (ACI 318 Section R22.8), the 3-to-1 limitation on height to thickness ratio does not apply for portions of pedestals embedded in soil capable of providing lateral restraint (Note: In application, Perma-Columns are unlikely to extend more than three times their thickness above grade).
According to ACI 318 Section 10.2, the strength design of members for flexure and axial loads shall be based on the following assumptions:

Perma-Column Engineering Design Manual…………………………………………………………………….Page 9
1. Member strength is based on satisfying applicable conditions of equilibrium and compatibility of strains.
2. Strain in reinforcement and concrete is directly proportional to the distance from the neutral axis.
3. Maximum usable strain εcu at extreme concrete compression fiber is equal to 0.003
4. Stress in reinforcement below specified yield strength fy is equal to Es times the steel strain.
5. Tensile strength of concrete shall be neglected in axial and flexural calculations.
6. The relationship between concrete compressive stress distribution and concrete strain when nominal strength is reached may be taken as an equivalent rectangular stress distribution, wherein a concrete stress intensity of 0.85 fc’ is assumed to be uniformly distributed over an equivalent compressive zone bounded by the edges of the cross section and a straight line located parallel to the neutral axis at a distance a = β1 c from the fiber of maximum compressive strain. The distance c from the fiber of maximum strain to the neutral axis is measured in a direction perpendicular to that axis. The value of β1 is 0.85 for fc’ values less than or equal to 4000 psi and 0.65 for fc’ values greater than or equal to 8000 psi. Linearly interpolation is used to obtain β1 for fc’ values between 4000 and 8000 psi.
3.1 Bending Strength Under Just Flexural Load (No Axially Applied Loads) Based on the previous assumptions, the following equations can be written for conditions at failure (εcu = 0.003 and bottom steel yielding) of a Perma-Column subjected to flexure alone. Variables and designated values for each Perma-Column series are given in Tables 1.1 and 3.1:
εs(top) = 0.003 (d’ – c)/c (3.1.1)
C = β1 c b 0.85 fc’ (3.1.2)
T(top) = As’ Es εs(top) but no greater than fy As’ (3.1.3)
T(bottom) = As fy (3.1.4)
C = T(top) + T(bottom) (3.1.5)
Equation 3.1.1 for strain in the top steel returns a negative value when the top steel is located above the neutral axis (i.e., d’ < c). When this is the case, T(top) will have a negative value in all remaining calculations.
Substituting equation 3.1.1 into equation 3.1.3, and then substituting equations 3.1.2, 3.1.3 and 3.1.4 into equation 3.1.5 yields the following equation;
β1 c b 0.85 fc’ = As’ Es 0.003 (d’ – c)/c + As fy (3.1.6)
which can be rewritten as:
c2[β1 b 0.85 fc’/(As’ fy)] + c [(0.003 Es/fy) – As/As’] – 0.003 d’ Es/fy = 0 (3.1.7)
With the exception of the distance to the neutral axis c, all variables in equations 3.1.6 and 3.1.7 are known. Consequently, c can be determined directly using the quadratic equation. Once this is done, the nominal moment strength Mn is calculated using the following equation. Note that Mn = Mo when the member is subjected to flexure alone.
Perma-Column Engineering Design Manual…………………………………………………………………….Page 10
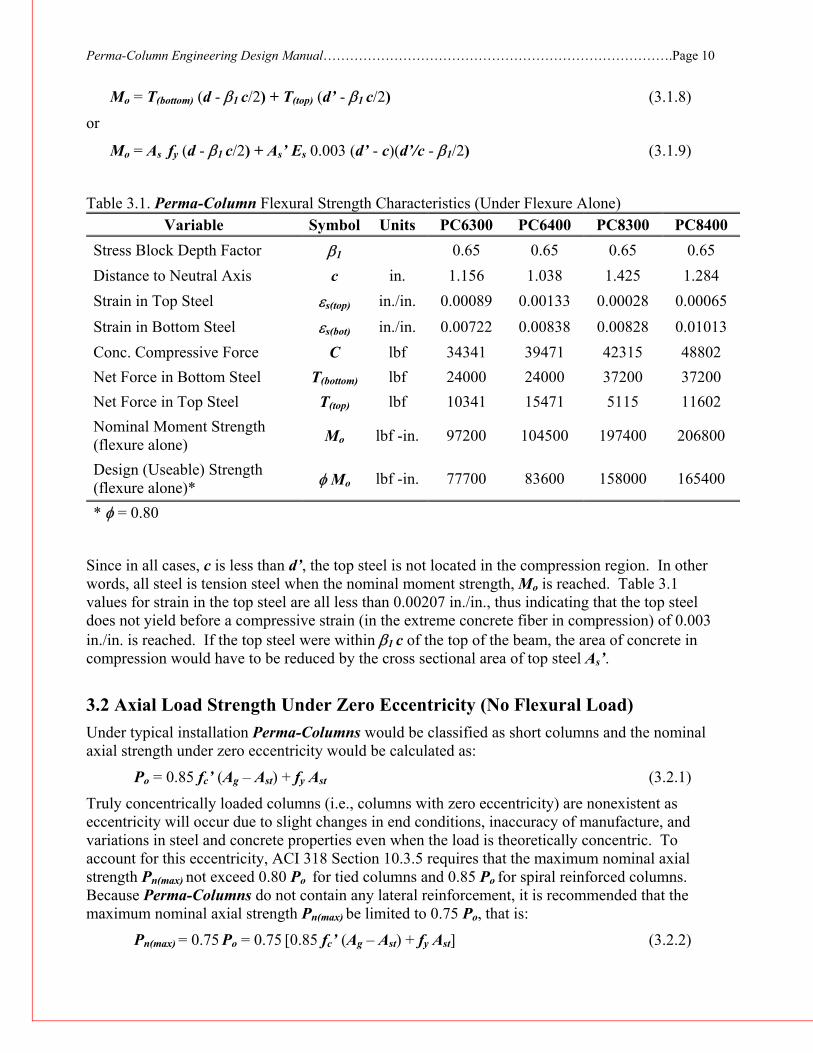
Mo = T(bottom) (d - β1 c/2) + T(top) (d’ - β1 c/2) (3.1.8)
or
Mo = As fy (d - β1 c/2) + As’ Es 0.003 (d’ - c)(d’/c - β1/2) (3.1.9)
Table 3.1. Perma-Column Flexural Strength Characteristics (Under Flexure Alone) Variable Symbol Units PC6300 PC6400 PC8300 PC8400
Stress Block Depth Factor β1 0.65 0.65 0.65 0.65 Distance to Neutral Axis c in. 1.156 1.038 1.425 1.284 Strain in Top Steel εs(top) in./in. 0.00089 0.00133 0.00028 0.00065 Strain in Bottom Steel εs(bot) in./in. 0.00722 0.00838 0.00828 0.01013 Conc. Compressive Force C lbf 34341 39471 42315 48802 Net Force in Bottom Steel T(bottom) lbf 24000 24000 37200 37200 Net Force in Top Steel T(top) lbf 10341 15471 5115 11602 Nominal Moment Strength (flexure alone) Mo lbf -in. 97200 104500 197400 206800
Design (Useable) Strength (flexure alone)* φ Mo lbf -in. 77700 83600 158000 165400
* φ = 0.80
Since in all cases, c is less than d’, the top steel is not located in the compression region. In other words, all steel is tension steel when the nominal moment strength, Mo is reached. Table 3.1 values for strain in the top steel are all less than 0.00207 in./in., thus indicating that the top steel does not yield before a compressive strain (in the extreme concrete fiber in compression) of 0.003 in./in. is reached. If the top steel were within β1 c of the top of the beam, the area of concrete in compression would have to be reduced by the cross sectional area of top steel As’.
3.2 Axial Load Strength Under Zero Eccentricity (No Flexural Load) Under typical installation Perma-Columns would be classified as short columns and the nominal axial strength under zero eccentricity would be calculated as:
Po = 0.85 fc’ (Ag – Ast) + fy Ast (3.2.1)
Truly concentrically loaded columns (i.e., columns with zero eccentricity) are nonexistent as eccentricity will occur due to slight changes in end conditions, inaccuracy of manufacture, and variations in steel and concrete properties even when the load is theoretically concentric. To account for this eccentricity, ACI 318 Section 10.3.5 requires that the maximum nominal axial strength Pn(max) not exceed 0.80 Po for tied columns and 0.85 Po for spiral reinforced columns. Because Perma-Columns do not contain any lateral reinforcement, it is recommended that the maximum nominal axial strength Pn(max) be limited to 0.75 Po, that is:
Pn(max) = 0.75 Po = 0.75 [0.85 fc’ (Ag – Ast) + fy Ast] (3.2.2)

Perma-Column Engineering Design Manual…………………………………………………………………….Page 11
The 0.75 Po limit on Pn(max) is equivalent to an eccentricity of 0.120 h for a typical Perma-Column. A 0.80 Po limit on Pn(max) would be equivalent to an eccentricity of around 0.093 h for a typical Perma-Column. As a rule of thumb, it is good to assume an eccentricity of at least 0.1h when designing columns similar in size to Perma-Columns.
Pn(max) values for Perma-columns, as calculated using equation 3.2.2 are tabulated in Table 3.2
Table 3.2. Perma Column Axial Strength Characteristics (Under Pure Axial Loads) Variable Symbol Units PC6300 PC6400 PC8300 PC8400
Total Steel Area Ast sq inch 0.80 0.80 1.24 1.24 Gross Cross-Section Area Ag sq inch 29.23 37.41 38.63 49.45 Steel Yield Strength fy lbf/in.2 60000 60000 60000 60000 Concrete Comp. Strength fc' lbf/in.2 10000 10000 10000 10000 Nominal Axial Load Strength at Zero Eccentricity Po Lbf 289600 359200 392200 484200
Maximum Nominal Axial Load Strength Pn(max) Lbf 217200 269400 294200 363100
Maximum Design (Useable) Axial Load Strength* φ Pn(max) Lbf 119500 148200 161800 199700
* φ = 0.55
3.3. Strength Under Combined Bending & Axial Compressive Loads Seldom, if ever, will a Perma-Column be subjected to a pure axial or a pure bending load. Consequently, allowable axial load/bending moment interactions outlined in this section will typically apply.
The addition of an axial compressive load to a reinforced concrete component that is under a pure bending load will, up to a certain point, increase the amount of bending load to which the concrete member can be subjected (see Figure 3.3.1). This is not the case with a wood, steel, or plain concrete member. This phenomenon results from the fact that the bending strength of a reinforced concrete component under a pure bending load is limited by yielding of tension steel, and the addition of a compressive load: (1) reduces the tensile strain in the tension steel, and (2) increases the area of concrete in compression.
Perma-Column Engineering Design Manual…………………………………………………………………….Page 12
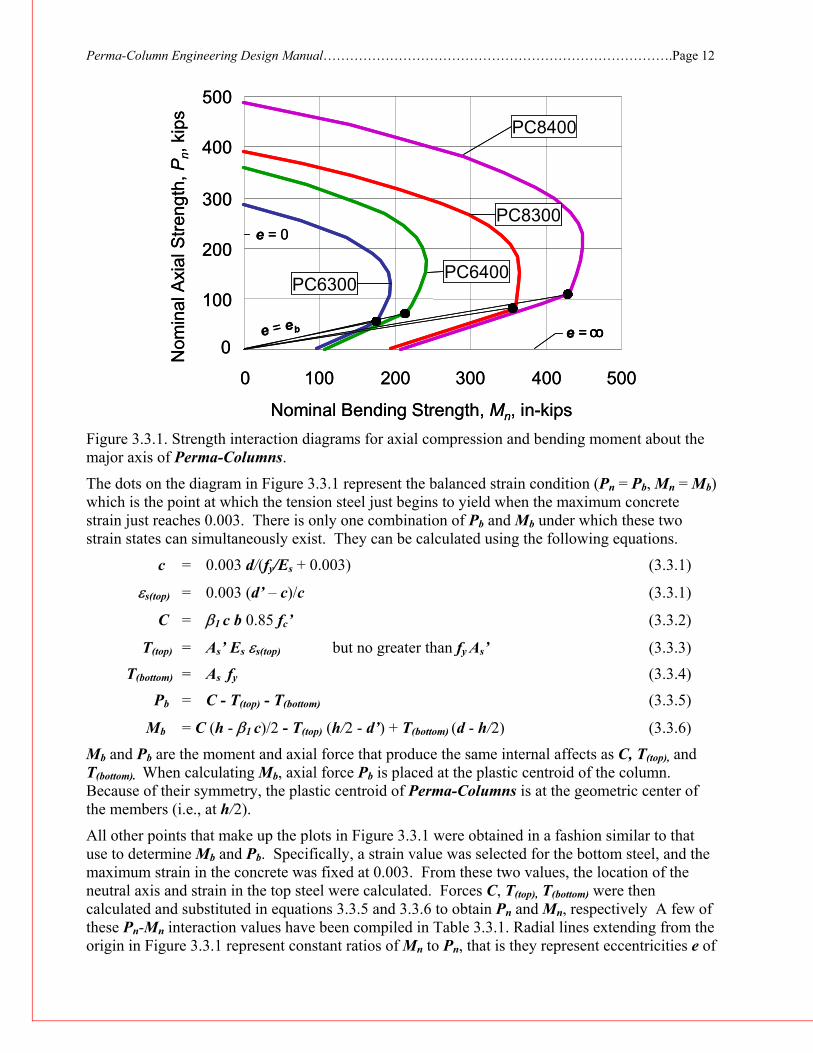
Figure 3.3.1. Strength interaction diagrams for axial compression and bending moment about the major axis of Perma-Columns.
The dots on the diagram in Figure 3.3.1 represent the balanced strain condition (Pn = Pb, Mn = Mb) which is the point at which the tension steel just begins to yield when the maximum concrete strain just reaches 0.003. There is only one combination of Pb and Mb under which these two strain states can simultaneously exist. They can be calculated using the following equations.
c = 0.003 d/(fy/Es + 0.003) (3.3.1)
εs(top) = 0.003 (d’ – c)/c (3.3.1)
C = β1 c b 0.85 fc’ (3.3.2)
T(top) = As’ Es εs(top) but no greater than fy As’ (3.3.3)
T(bottom) = As fy (3.3.4)
Pb = C - T(top) - T(bottom) (3.3.5)
Mb = C (h - β1 c)/2 - T(top) (h/2 - d’) + T(bottom) (d - h/2) (3.3.6)
Mb and Pb are the moment and axial force that produce the same internal affects as C, T(top), and T(bottom). When calculating Mb, axial force Pb is placed at the plastic centroid of the column. Because of their symmetry, the plastic centroid of Perma-Columns is at the geometric center of the members (i.e., at h/2).
All other points that make up the plots in Figure 3.3.1 were obtained in a fashion similar to that use to determine Mb and Pb. Specifically, a strain value was selected for the bottom steel, and the maximum strain in the concrete was fixed at 0.003. From these two values, the location of the neutral axis and strain in the top steel were calculated. Forces C, T(top), T(bottom) were then calculated and substituted in equations 3.3.5 and 3.3.6 to obtain Pn and Mn, respectively A few of these Pn-Mn interaction values have been compiled in Table 3.3.1. Radial lines extending from the origin in Figure 3.3.1 represent constant ratios of Mn to Pn, that is they represent eccentricities e of
0 100 200 300 400 500
Nominal Bending Strength, Mn, in-kips
Nom
inal
Axi
al S
treng
th,P
n, ki
ps
0
100
200
300
400
500
PC8400
PC6300PC6400
PC8300
e = eb
e = 0
e = oo
0 100 200 300 400 500
Nominal Bending Strength, Mn, in-kips
Nom
inal
Axi
al S
treng
th,P
n, ki
ps
0
100
200
300
400
500
PC8400
PC6300PC6400
PC8300
e = eb
e = 0
e = ooe = oooo

Perma-Column Engineering Design Manual…………………………………………………………………….Page 13
the load Pn from the plastic centroid of the columns. It follows, as shown in figure 3.3.1, that the vertical axis represent e = 0 and the horizontal axis represents e = ∞.
Table 3.3.1 Axial Compression and Bending Strength Interaction Values Nominal Bending Strength, Mn, kips-inches Nominal Axial
Strength, Pn, kips PC6300 PC6400 PC8300 PC8400 0 97.2 104.4 197.5 206.8 20 127.9 136.2 243.1 253.6 40 157.2 167.3 287.3 299.5 60 175.3 196.3 324.4 343.6 80 181.0 214.1 360.7 380.6 100 186.0 221.7 370.0 417.4 120 189.3 228.5 371.6 439.9 140 189.8 233.7 372.8 444.4 160 186.4 236.6 372.7 448.5 180 177.1 236.4 369.7 451.6 200 160.9 232.5 361.3 453.2 220 131.4 223.5 349.2 452.3 240 101.1 208.6 332.7 446.4 260 63.3 188.3 311.0 437.2 280 17.8 155.6 283.6 424.3 300 123.3 250.0 407.2 320 85.1 194.7 385.5 340 40.7 146.5 359.0 360 91.2 327.3 380 28.9 288.4 400 232.2 440 128.2 480 9.1
Design strength values are compiled in Table 3.3.2 and graphically displayed in Figure 3.3.2. These values were obtained by reducing nominal strength values in Table 3.3.1 by appropriate resistance factors. While a resistance factor of 0.80 is applicable to all bending values, the axial resistance factor of 0.55 can be increased to 0.80 (i.e., the resistance factor for bending) as φ Pn decreases from 0.1 fc’ Ag to zero.
To check the adequacy of a design, first divide the moment due to factored load Mu, by the compression axial force due to factored load, Pu, to obtain the eccentricity due to factored loads. Next, find the eccentricity (in the far right column of Table 3.3.2) and associated φa Pn and φb Mn values that correspond to the calculated eccentricity. The design in question is adequate in compression and bending as long as the φa Pn value exceeds Pu and the φb Mn value exceeds Mu.

Perma-Column Engineering Design Manual…………………………………………………………………….Page 14
Table 3.3.2 Axial Compression and Bending Strength Design Values
Notable Points Pn kips φa
φa Pn kips
Mn kips-inch
φb Mn kips-inches
Eccentricity, e, inches
PC6300 0.0 0.80 0.0 97.2 77.8 ∞ 20.0 0.71 14.1 127.9 102.3 7.25 40.0 0.61 24.5 157.2 125.8 5.14
φa Pn = 0.1 fc’ Ag 53.1 0.55 29.2 172.1 137.7 4.71 Balanced Condition 54.5 0.55 30.0 173.6 138.9 4.64
60.0 0.55 33.0 175.3 140.3 4.25 80.0 0.55 44.0 181.0 144.8 3.29 100.0 0.55 55.0 186.0 148.8 2.71 120.0 0.55 66.0 189.3 151.4 2.29 140.0 0.55 77.0 189.8 151.8 1.97 160.0 0.55 88.0 186.4 149.1 1.69 180.0 0.55 99.0 177.1 141.7 1.43 200.0 0.55 110.0 160.9 128.7 1.17
Max. Axial Strength 217.2 0.55 119.5 135.5 108.4 0.91 PC6400
0.0 0.80 0.0 104.4 83.6 ∞ 20.0 0.73 14.5 136.2 108.9 7.50 40.0 0.65 26.1 167.3 133.8 5.12 60.0 0.58 34.8 196.3 157.0 4.52
φa Pn = 0.1 fc’ Ag 68.0 0.55 37.4 205.1 164.1 4.39 Balanced Condition 73.8 0.55 40.6 211.5 169.2 4.17
80.0 0.55 44.0 214.1 171.3 3.89 100.0 0.55 55.0 221.7 177.3 3.22 120.0 0.55 66.0 228.5 182.8 2.77 140.0 0.55 77.0 233.7 187.0 2.43 160.0 0.55 88.0 236.6 189.3 2.15 180.0 0.55 99.0 236.4 189.2 1.91 200.0 0.55 110.0 232.5 186.0 1.69 220.0 0.55 121.0 223.5 178.8 1.48 240.0 0.55 132.0 208.6 166.9 1.26 260.0 0.55 143.0 188.3 150.7 1.05
Max. Axial Strength 269.4 0.55 148.2 173.0 138.4 0.93

Perma-Column Engineering Design Manual…………………………………………………………………….Page 15
Table 3.3.2 Axial Compression and Bending Strength Design Values, cont.
Notable Points Pn kips φa
φa Pn kips
Mn kips-inch
φb Mn kips-inches
Eccentricity, e, inches
PC8300 0.0 0.80 0.0 197.5 158.0 20.0 0.73 14.6 243.1 194.5 13.34 40.0 0.66 26.3 287.3 229.8 8.74 60.0 0.59 35.2 324.4 259.5 7.37
φa Pn = 0.1 fc’ Ag 70.2 0.55 38.6 342.9 274.4 7.10 80.0 0.55 44.0 360.7 288.5 6.56
Balanced Condition 85.3 0.55 46.9 368.5 294.8 6.29 100.0 0.55 55.0 370.0 296.0 5.38 120.0 0.55 66.0 371.6 297.3 4.50 140.0 0.55 77.0 372.8 298.2 3.87
160.0 0.55 88.0 372.7 298.1 3.39 180.0 0.55 99.0 369.7 295.7 2.99
200.0 0.55 110.0 361.3 289.0 2.63 220.0 0.55 121.0 349.2 279.4 2.31 240.0 0.55 132.0 332.7 266.1 2.02 260.0 0.55 143.0 311.0 248.8 1.74 280.0 0.55 154.0 283.6 226.9 1.47
Max. Axial Strength 294.2 0.55 161.8 259.8 207.8 1.28 PC8400
0.0 0.80 0.0 206.8 165.4 20.0 0.74 14.9 253.6 202.9 13.63 40.0 0.69 27.6 299.5 239.6 8.70 60.0 0.63 38.0 343.6 274.9 7.24 80.0 0.58 46.2 380.6 304.5 6.59
φa Pn = 0.1 fc’ Ag 89.9 0.55 49.5 398.8 319.1 6.45 100.0 0.55 55.0 417.4 333.9 6.07
Balanced Condition 112.8 0.55 62.0 437.8 350.2 5.64 120.0 0.55 66.0 439.9 351.9 5.33 140.0 0.55 77.0 444.4 355.5 4.62 160.0 0.55 88.0 448.5 358.8 4.08 180.0 0.55 99.0 451.6 361.3 3.65 200.0 0.55 110.0 453.2 362.6 3.30 220.0 0.55 121.0 452.3 361.8 2.99 240.0 0.55 132.0 446.4 357.1 2.71 260.0 0.55 143.0 437.2 349.8 2.45 280.0 0.55 154.0 424.3 339.5 2.20 300.0 0.55 165.0 407.2 325.7 1.97 320.0 0.55 176.0 385.5 308.4 1.75 340.0 0.55 187.0 359.0 287.2 1.54 360.0 0.55 198.0 327.3 261.8 1.32
Max. Axial Strength 363.1 0.55 199.7 321.2 256.9 1.29

Perma-Column Engineering Design Manual…………………………………………………………………….Page 16
Figure 3.3.2. Design bending and axial strength interaction values for Perma-Columns.
0
50
100
150
200
250
0 100 200 300 400
Design Bending Strength, φ Mn , kip-inches
Des
ign
Axi
al S
tren
gth,
φP n
,kip
sPC6300
PC6400
PC8300
PC8400
0
50
100
150
200
250
0 100 200 300 400
Design Bending Strength, φ Mn , kip-inches
Des
ign
Axi
al S
tren
gth,
φP n
,kip
sPC6300
PC6400
PC8300
PC8400

Perma-Column Engineering Design Manual…………………………………………………………………….Page 17
3.4 Shear Strength The nominal shear strength of a reinforced concrete component, Vn, is equal to the sum of the shear strength provided by the concrete, Vc, and the shear strength provided by shear reinforcement, Vs, that is, Vn = Vc + Vs. Because they do not contain shear reinforcement, Vn = Vc for a Perma-Column. It should be noted that ACI 318 Section 11.5.5.1 restricts Vn to Vc/2 for most components that do not contain reinforcement. The increase from Vn = Vc/2 to Vn = Vc is allowed for Perma-Columns because their overall depth is less than 10 inches.
For members subjected to shear and flexure only, Vc can be taken as the greater of:
Vc = 2.0 b d (fc’)1/2 (3.4.1) or
Vc = 1.9 b d (fc’)1/2 + 2500 As d Vu/Mu (3.4.2)
but not greater than:
Vc = 3.5 b d (fc’)1/2 (3.4.3) or
Vc = 1.9 b d (fc’)1/2 + 2500 As (3.4.4)
Where (fc’)1/2 shall not be taken to be greater than 100 lbf/in2. Note that equation 3.4.4 limits the ratio of d Vu/Mu in equation 3.4.2 to unity. Perma-Column design shear strength values (φ Vn) calculated using equations 3.4.1 through 3.4.4 are compiled in Table 3.4.1. Note that in all cases, equation 3.3.4 and not equation 3.4.3 controls the maximum design shear strength.
Table 3.4.1 Shear Strength Design Values (Without Increases From Axial Compressive Forces)
PC6300 PC6400 PC8300 PC8400 Vn=Vc φ Vn* Vn=Vc φ Vn* Vn=Vc φ Vn* Vn=Vc φ Vn*
lbf lbf lbf lbf lbf lbf lbf lbf Minimum from Equation 3.4.1 4236 3177 5421 4066 6042 4531 7733 5800
Maximum from Equation 3.4.4 5024 3768 6150 4613 7289 5467 8896 6672
Mu/Vu, in. 4 5009 3757 6135 4602 7917 5938 9524 7143 5 4812 3609 5938 4454 7482 5611 9089 6816 6 4680 3510 5807 4355 7191 5393 8798 6599 8 4516 3387 5643 4232 6828 5121 8435 6327 10 4418 3313 5544 4158 6611 4958 8218 6163 12 4352 3264 5479 4109 6465 4849 8072 6054 14 4305 3229 5432 4074 6362 4771 7969 5977 16 4270 3202 ** ** 6284 4713 7891 5918 20 ** ** ** ** 6175 4631 7782 5837 24 ** ** ** ** 6102 4577 ** ** V
alue
from
Equ
atio
n 3.
4.2
28 ** ** ** ** 6051 4538 ** ** *φ = 0.75 for shear ** Minimum value from equation 3.4.1 is greater
Perma-Column Engineering Design Manual…………………………………………………………………….Page 18
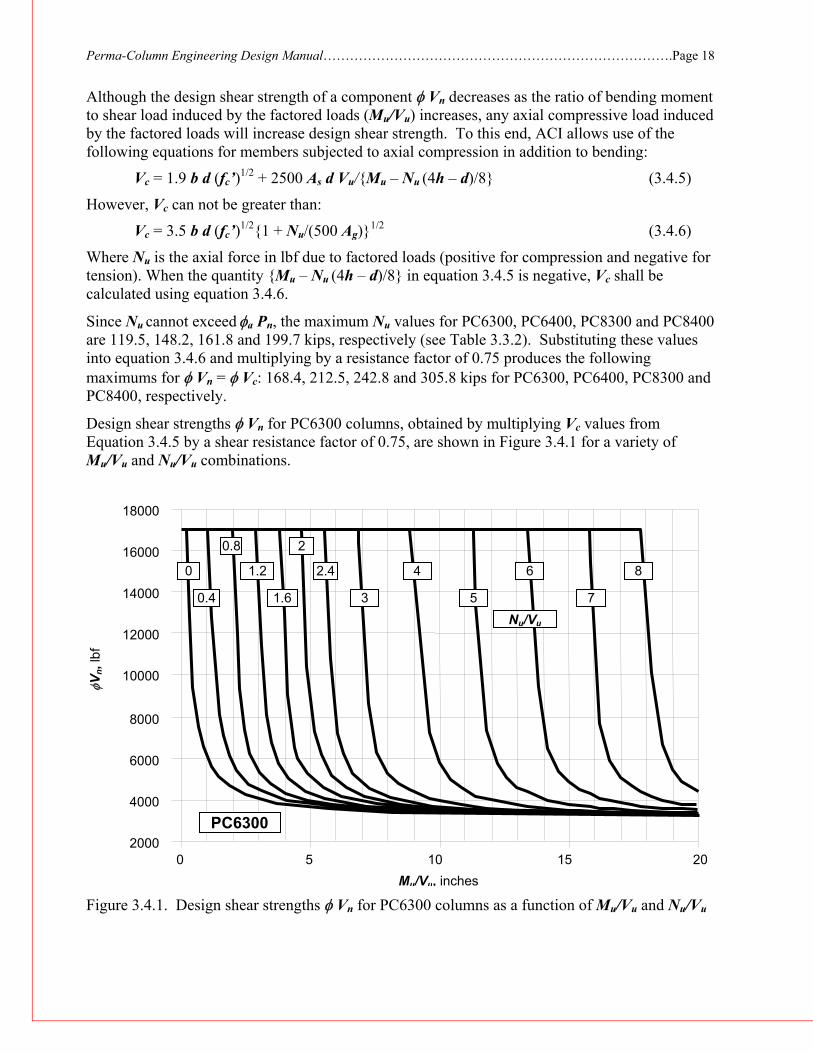
Although the design shear strength of a component φ Vn decreases as the ratio of bending moment to shear load induced by the factored loads (Mu/Vu) increases, any axial compressive load induced by the factored loads will increase design shear strength. To this end, ACI allows use of the following equations for members subjected to axial compression in addition to bending:
Vc = 1.9 b d (fc’)1/2 + 2500 As d Vu/{Mu – Nu (4h – d)/8} (3.4.5)
However, Vc can not be greater than:
Vc = 3.5 b d (fc’)1/2{1 + Nu/(500 Ag)}1/2 (3.4.6)
Where Nu is the axial force in lbf due to factored loads (positive for compression and negative for tension). When the quantity {Mu – Nu (4h – d)/8} in equation 3.4.5 is negative, Vc shall be calculated using equation 3.4.6.
Since Nu cannot exceed φa Pn, the maximum Nu values for PC6300, PC6400, PC8300 and PC8400 are 119.5, 148.2, 161.8 and 199.7 kips, respectively (see Table 3.3.2). Substituting these values into equation 3.4.6 and multiplying by a resistance factor of 0.75 produces the following maximums for φ Vn = φ Vc: 168.4, 212.5, 242.8 and 305.8 kips for PC6300, PC6400, PC8300 and PC8400, respectively.
Design shear strengths φ Vn for PC6300 columns, obtained by multiplying Vc values from Equation 3.4.5 by a shear resistance factor of 0.75, are shown in Figure 3.4.1 for a variety of Mu/Vu and Nu/Vu combinations.
Figure 3.4.1. Design shear strengths φ Vn for PC6300 columns as a function of Mu/Vu and Nu/Vu
2000
4000
6000
8000
10000
12000
14000
16000
18000
0 5 10 15 20Mu/Vu, inches
φVn,
lbf
8
Nu/Vu 7
6
5
4
3
2.4
2
1.6
1.2
0.8
0.4
0
PC6300
Perma-Column Engineering Design Manual…………………………………………………………………….Page 19
3.5 Comparison With Wood Strength Values A common question is how do Perma-Column design strength values compare with those of the laminated wood posts they replace or to which they are attached? Prior to making some of these comparisons, the following points should be understood.
1. Wood strengths are dependent upon the duration of the applied load. The amount of load a wood component can sustain decreases the longer the load acts upon the structure. There is no time dependent reduction in the amount of load a reinforced concrete component can sustain.
2. Magnitude of bending moment applicable to a reinforced concrete component increases as axial compressive load is applied to the component. Conversely, the magnitude of bending moment that can be applied to a wood member decreases as an axial compressive load is applied to the component.
3. The magnitude of shear force to which a reinforced concrete component can be subjected increases as an axial compressive load is applied to the component, but decreases as the bending moment in the member increases. The design shear strength of a wood member is not measurably affected by the axial or bending forces acting on the member.
4. Wood design values must be reduced when wood is used in a moist environment. After initial curing, concrete design strengths are not affected by changes in the moisture content of the surrounding environment.
Table 3.5.1 contains load and resistance factor design (LRFD) values for mechanically-laminated posts fabricated from No. 1 Southern Yellow Pine and used where the wood moisture content will exceed 19% for extended time periods. No. 1 Southern Yellow Pine is a common visual grade for laminated posts. Note that any post that would be used in place of a Perma-Column would have to be designed for higher moisture contents. Also, like the concrete design strengths established in previous sections, the LRFD values for wood in Table 3.5.1 must be used in conjunction with the load combinations and load factors in Section 2.2.
Figure 3.5.1 contains a graphical comparison of maximum allowed axial and bending moment induced by wind loads for Perma-Columns and No.1 Southern Yellow Pine posts. Values for the Perma-Columns are the same as those shown in Figure 3.3.2. Note that the axes have been retitled with φPn replaced by Pu (i.e., Pu < φ Pn) and φMn replaced by Mu. The relationships between Pu and Mu for the wood posts were calculated using the following design equation for wood members under combined bending and axial compressive loads.
Pu Mm λ φc P’
2
+ λ φb M’
< 1.0 (3.5.1)
where:
Pu = Axial compressive force due to factored loads λ φc P’ = Design resistance for axial compression from Table 3.5.1 Mm = Factored moment, including any magnification for second-order effects = Mu for short columns λ φb M’ = Adjusted moment resistance from Table 3.5.1

Perma-Column Engineering Design Manual…………………………………………………………………….Page 20
Table 3.5.1 Properties of Mechanically-Laminated No. 1 Southern Yellow Pine Columns* Variable Description Symbol Unit
Physical Characteristics Number of Plys 3 4 3 4
Nominal Ply Size in. x in. 2x6 2x6 2x8 2x8 Cross-Sectional Area A in.2 24.75 33.00 32.63 43.50
Section Modulus S in.3 22.69 30.25 39.42 52.56 Tabulated Reference Strength Values
Shear Fv kips/in.2 0.26 0.26 0.26 0.26 Flexure Fb kips/in.2 4.19 4.19 3.81 3.81
Axial Compression Fc kips/in.2 4.20 4.20 3.96 3.96 Applicable Adjustment Factors
Wet Service Factor - Shear CM 0.97 0.97 0.97 0.97 Wet Service Factor - Flexure CM 0.85 0.85 0.85 0.85
Wet Service Factor - Axial Comp. CM 0.80 0.80 0.80 0.80 Shear Stress Factor** CH 1.95 1.95 1.95 1.95
Load Sharing Factor*** Cr 1.35 1.35 1.40 1.40 Adjusted Reference Strength Values
Shear (Fv CM CH ) Fv’ kips/in.2 0.49 0.49 0.49 0.49 Flexure (Fb CM Cr ) Fb’ kips/in.2 4.81 4.81 4.53 4.53
Axial Compression (Fb CM) Fc’ kips/in.2 3.36 3.36 3.17 3.17 Adjusted Resistance Values
Shear (Fv’ A/1.5) V’ kips 8.11 10.82 10.70 14.26 Moment (Fb’ S) M’ kips-in. 109.1 145.4 178.7 238.3
Axial Compression (Fc’ A) P’ kips 83.2 110.9 103.4 137.8 Resistance and Time Effect Factors
Resistance Factor – Shear φv 0.75 0.75 0.75 0.75 Resistance Factor – Bending φb 0.85 0.85 0.85 0.85
Resistance Factor – Axial Comp. φc 0.90 0.90 0.90 0.90 Time Effect Factor – Wind Load λw 1.0 1.0 1.0 1.0 Time Effect Factor – Snow Load λs 0.8 0.8 0.8 0.8
Design Resistance Values Under Wind Loading Shear λw φv V’ kips 6.09 8.11 8.02 10.70
Moment λw φb M’ kips-in. 92.7 123.6 151.9 202.6 Axial Compression λw φc P’ kips 74.8 99.8 93.0 124.0
Design Resistance Values Under Snow Loading Shear λs φv V’ kips 4.87 6.49 6.42 8.56
Moment λs φb M’ kips-in. 74.2 98.9 121.5 162.1 Axial Compression λs φc P’ kips 59.9 79.8 74.4 99.2
* From AF&PA 1996 Edition of Load and Resistance Factor Design Manual For Engineered Wood Construction. Assumes columns with full lateral bracing and only major axis bending
** Based on changes incorporated in 2001 Edition of Allowable Stress Design Manual for Engineering Wood Construction (AF&PA, 2001).
*** From ASAE EP559

Perma-Column Engineering Design Manual…………………………………………………………………….Page 21
Figure 3.5.1. Interaction diagrams for maximum allowed axial and bending moment induced by wind loads for Perma-Columns and No.1 Southern Yellow Pine posts.
Table 3.5.2 Comparison of Perma-Column and Wood Post Shear Strengths
Variable Description Units 3-ply 2x6
4-ply 2x6
3-ply 2x8
4-ply 2x8
LRFD Design Shear Strength for No.1 SP (Wind Load) kips 6.09 8.11 8.02 10.70
PC6300 PC6400 PC8300 PC8400ACI Design Shear Strength (No Bending) kips 3.77 4.61 5.47 6.67
Average Maximum Test Shear kips 10.55 11.08 16.36 19.02 Average Maximum Test Shear x 0.55 kips 5.80 6.09 9.00 10.46
Table 3.5.2 contains Perma-Column and No.1 Southern Yellow Pine design shear strength values. As evidenced from the table, the American Forest & Paper Association (AF&PA) LRFD values for the wood posts exceed the ACI design shear values for the Perma-Columns by an average 55%. However, as evidenced from actual bending test data (Appendix C), the Perma-Column design shear values are extremely conservative. When a conservative resistance factor of 0.55 is applied to the Perma-Column test values, there is essentially no difference between the design shear strengths of the No.1 SP posts and the Perma-Columns.
0
50
100
150
200
250
0 100 200 300 400Mu, inch-kips
P u, k
ips
PC8400
PC8300PC6400
PC6300
3 ply 2x64 ply 2x63 ply 2x84 ply 2x8
0
50
100
150
200
250
0 100 200 300 400Mu, inch-kips
P u, k
ips
PC8400
PC8300PC6400
PC6300
3 ply 2x64 ply 2x63 ply 2x84 ply 2x8
3 ply 2x64 ply 2x63 ply 2x84 ply 2x8

Perma-Column Engineering Design Manual…………………………………………………………………….Page 22
4. Strength Properties of the Steel Bracket Using published procedures to determine design values for Perma-Column components is a straight forward process with two exceptions, that being the determination of design values for the shear and bending strength of the steel bracket-to-concrete connection. Because of the complex geometry and interaction between steel and concrete at the steel bracket-to-concrete connection, neither ACI or AISC (American Institute of Steel Construction) design procedures can be applied. To this end, engineers are required to rely on laboratory tests that have been specially designed to isolate the shear strength and bending strength of the joint.
4.1 Bending Strength Bending strength of the steel bracket, or more specifically, the steel bracket-to-concrete connection, was determined by laboratory testing. Test procedures, equipment and results are presented in Appendix B along with a brief discussion.
Translating test values to design strengths requires (1) a selection of a nominal bending strength, Mn, and (2) application of a resistance factor for bending φb. Selection of a nominal bending strength is complicated issue that requires additional investigation. Because of the ductility of the connection, one may want to assign a limit state of 0.02 or 0.03 radians to the connection. Nominal bending strength would then be the bending strength associated with the selected rotation. This is not an uncommon approach for steel connections characterized by larger deformations. With a nominal bending strength so defined, a bending resistance factor of 0.90 would be appropriate.
4.2 Shear Strength All shear related failures associated with the shear tests described in Appendix C occurred on “non-bracketed” ends of test specimens. This means that the shear strength of a steel bracket-to-concrete connection is at least as great as that for the reinforced concrete base. This is not surprising since the steel bracket functions much like shear reinforcing in that it ties longitudinal reinforcing together. Consequently, as long as the reinforced concrete portion of a Perma-Column is shown to adequately handle applied shear forces, there is no need to check the shear capacity of the steel bracket-to-concrete column connection.

Perma-Column Engineering Design Manual…………………………………………………………………….Page 23
5. Stiffness of the Reinforced Concrete Calculation of a structural component’s bending deflections requires knowledge of the flexural rigidity of the component. For components manufactured from a single, homogenous material (e.g. steel) and possessing a constant cross-section, flexural rigidity is simply equal to the product of the modulus of elasticity of the material and the moment of inertia associated with the component’s cross-section.
Calculation of the flexural rigidity of a reinforced concrete component is not as straight forward as that for most wood or steel components for two primary reasons. First, a reinforced concrete member consists of two materials (concrete and steel) each with a different modulus of elasticity. Second, the cross-sectional moment of inertia of a reinforced concrete component changes rapidly once a tension crack forms in the concrete. Because tension cracking is directly related to the applied bending moment, and applied bending moment generally varies significantly along a component, cracking (and hence effective moment of inertia) will vary along the length of the component.
To simplify flexural rigidity calculations for reinforced concrete components, the component is treated as a solid “non-reinforced” concrete component. For cracked cross-sections, this requires transformation of the cross-sectional area of reinforcing steel to an equivalent cross-sectional area of concrete. When reinforced concrete components are treated as solid concrete components, the modulus of elasticity assigned to the member is the modulus of elasticity for the concrete.
5.1 Concrete Modulus of Elasticity ACI 8.5.1 states that the modulus of elasticity for concrete, Ec, for normal weight concrete shall be calculated as 57,000(fc’)0.5 where fc’ is the specified concrete strength in lbf/in2. Given an fc’ of 10,000 lbf/in2 this equates to a Ec for Perma-Columns of 5,700,000 lbf/in2.
5.2 Reinforced Concrete Moment of Inertia ACI 9.5.2.3 states that immediate deflections shall be calculated using Ec and an effective moment of inertia, Ie, that is calculated using the following formula, but is not greater than Ig.
Ie = (Mcr/Ma)3 Ig + [ 1 - (Mcr/Ma)3 ] Icr (5.2.1)
where:
Ie = Effective moment of inertia for deflection calculations, in4 Icr = Moment of inertia of cracked section transformed to concrete, in4 Ig = Moment of inertia of gross concrete section about centroidal axis, neglecting
reinforcement, in4 Ma = Maximum moment in member at stage deflection is computed, in-lbf Mcr = Cracking moment, in-lbf = fr Ig /yt fr = Modulus of rupture of concrete, lbf/in2
= 7.5(fc’)0.5 for normal weight concrete = 750 lbf/in2 for Perma-Columns yt = Distance from centroidal axis of gross section neglecting reinforcement, to extreme
fiber in tension, inches

Perma-Column Engineering Design Manual…………………………………………………………………….Page 24
Effective moment of inertia values calculated using equation 5.2.1 are compiled in Table 5.1 and have been plotted in Figure 5.2.1.
Table 5.2.1: Perma Column Moment of Inertia Values
Variable Symbol Units PC6300 PC6400 PC8300 PC8400
Overall Concrete Width b in. 5.38 6.88 5.38 6.88 Overall Concrete Depth h in. 5.44 5.44 7.19 7.19 Gross Moment of Inertia Ig in.4 72.2 92.3 166.6 213.1 Depth to Centroidal Axis yt in. 2.72 2.72 3.60 3.60 Cracking Moment Mcr in-lbf 19900 25450 34770 44460 Ratio of Steel to Concrete MOE Es/Ec 5.09 5.09 5.09 5.09 Distance to Neutral Axis c in. 1.156 1.038 1.425 1.284 Cracked Moment of Inertia Ic in.4 18.8 20.1 59.0 62.5
Actual Bending Moment, Ma,
in-lbf PC6300 PC6400 PC8300 PC8400
0 72.2 92.3 166.6 213.1 15000 72.2 92.3 166.6 213.1 20000 71.4 92.3 166.6 213.1 25000 45.7 92.3 166.6 213.1 30000 34.4 64.2 166.6 213.1 35000 28.6 47.9 164.5 213.1 40000 25.4 38.7 129.7 213.1 45000 23.4 33.2 108.6 207.7 50000 22.2 29.6 95.2 168.4 60000 20.7 25.6 79.9 123.8 70000 20.0 23.6 72.2 101.1 80000 19.6 22.4 67.8 88.3 90000 19.4 21.7 65.2 80.7
100000 21.3 63.5 75.7 105000 21.1 62.9 73.9 110000 62.4 72.4 120000 61.6 70.2 130000 61.1 68.5 140000 60.6 67.3 150000 60.3 66.4 160000 60.1 65.7 170000 59.9 65.2 180000 59.8 64.8 190000 59.7 64.4
Effective Bending Moment, Ie, in.4
200000 64.2

Perma-Column Engineering Design Manual…………………………………………………………………….Page 25
Figure 5.2.1. Effective moment of inertia for strong axis bending of Perma-Columns as a function of actual bending moment.
Although the actual bending moment (and hence effective moment of inertia) varies along the length of a member, Equation 5.2.1 assumes that the effective moment of inertia used in modeling will be fixed for the entire length (i.e., span) of the member. The specific Ie to use for such modeling should be that calculated using Equation 5.2.1 with Ma, set equal to the maximum actual bending moment for the entire span. ACI 9.5.2.4 recommends using the bending moment located at the midspan of simple and continuous spans, and the bending moment located at the support for cantilevers.
Equation 5.2.1 is based on the work of Dan E. Branson (“Instantaneous and Time-Dependent Deflections of Simple and Continuous Reinforced Beams,” Part 1, Report No. 7 Alabama Highway Research Report, Bureau of Public Roads, August 1963). For engineers wishing to recognize the continuous variation of the moment of inertia with span, Branson proposed using the fourth power instead of the third power in Equation 5.2.1. In this case, Mcr and Ma would be the cracking and applied moment, respectively, at each segment along the span.
0
50
100
150
200
250
0 50000 100000 150000 200000
Bending Moment, in-lbf
Mom
ent o
f Ine
rtia
, in4
PC6300
PC6400
PC8300
PC8400
0
50
100
150
200
250
0 50000 100000 150000 200000
Bending Moment, in-lbf
Mom
ent o
f Ine
rtia
, in4
PC6300
PC6400
PC8300
PC8400
PC6300
PC6400
PC8300
PC8400

Perma-Column Engineering Design Manual…………………………………………………………………….Page 26
6. Rotational Stiffness of Steel Bracket-to-Wood Connection The moment-rotational relationship (a.k.a. rotational stiffness) of the steel bracket-to-wood connection can be estimated once the shear load-slip relationship (a.k.a. the slip modulus) of the individual fasteners has been established and the geometry of the fastener pattern has been specified.
6.1 Fastener Slip Modulus The slip modulus of a fastener is the ratio of (1) the shear load transferred by the fastener, and (2) the slip between the two components being connected by the fastener (a.k.a. interlayer slip). While the relationship between fastener shear load and interlayer slip is non-linear (especially near ultimate load), it is sufficiently linear at lower loads to justify use of a fixed value for most structural analyses.
Based on Perma-Column steel bracket-to-wood connection testing reported in Appendix D, a slip modulus of 85,500 lbf/inch is recommended for a 0.5-inch diameter SAE grade 5 bolt in double shear. Similarly, a slip modulus of 28,700 lbf/inch is recommended for a 0.25-inch diameter Simpson Strong-Drive® wood screw in single shear. These values should be relatively accurate for any steel bracket-to-wood connection featuring lumber with a specific gravity near 0.50.
Figure 6.1.1. Rotation between wood post and steel bracket under a pure bending moment when two identical fastener groups are spaced a distance, s.
FF
Mθ
s
Centroid of Group A Centroid of Group B
s/2s/2
FF
Mθ
s
Centroid of Group A Centroid of Group B
s/2s/2

Perma-Column Engineering Design Manual…………………………………………………………………….Page 27
Figure 6.1.1 illustrates the rotation between a Perma-Column steel bracket and post under a pure bending moment, M. Each of the small boxes in Figure 6.1.1 represents an individual fastener or a small group of closely spaced fasteners. When there is a small group of fasteners, it is advantageous to assign a slip modulus to the entire group. This is simply accomplished by summing the slip modulus values of the individual fasteners comprising the group. For example, if the group contains one 0.5-inch diameter bolt in double shear and two SDS screws in single shear, the slip modulus for the group would equal 85,500 plus 2 x 287,000 or 142,900 lbf/inch.
6.2. Rotational Stiffness The rotational stiffness of a connection is the ratio of applied moment, M, to rotation, θ, as defined in Figure 6.1.1. To obtain a relationship between M and θ, use is made of the fact that the distance from the center of joint rotation to a fastener or fastener group, s/2, when multiplied by rotation, θ, is equal to the interlayer slip of the fastener or fastener group, ∆. Interlayer slip is in turn equal to the shear force applied to the fastener or fastener group, F, divided by the slip modulus, k. Finally, shear force, F, when multiplied by the fastener spacing, s, is equal to the applied bending moment, M. In equation form ∆ = θ s/2 (6.2.1) k = F/ ∆ (6.2.2) M = F s (6.2.3)
From these equations the following relationship for rotation stiffness can be obtained.
M/θ = k s2/2 (6.2.4)
Where: M = Applied bending moment θ = Joint rotation k = Slip modulus for a fastener or fastener group s = Spacing between fasteners or fastener groups
6.3 Connection Modeling Adequate assessment of the impact of joint behavior on structural load distribution requires proper modeling of the moment-rotational relationship. This a very straight forward process when the structural analysis program incorporates special joint elements that enable designers to simply enter the rotational stiffness as calculated using equation 6.2.4.
When special joint elements are not available, a designer can model the joint using a simple beam or frame element. The flexural rigidity, EI, that must be assigned to this element is given as:
EI = k s2 Le / 2 (6.3.1)
Where: EI = Product of the modulus of elasticity and moment of inertia assigned to the modeling
element k = Slip modulus for a fastener or fastener group s = Spacing between fasteners or fastener groups (see Figure 6.1.1) Le = Length of the modeling element
Perma-Column Engineering Design Manual…………………………………………………………………….Page 28
Output from the structural analyses will include the bending moment, M. By dividing this bending moment by the spacing between the fastener groups, s, the force F on each group is obtained. If there is more than one fastener in the group, it is important to realize that this force F is divided among the individual fasteners in accordance with their individual slip modulus. In equation form:
Fi = M ki / (s k) (6.3.2)
Fi = F ki / k (6.3.3)
Where: Fi = Shear force on fastener i where i is one fastener within a group of fasteners F = Total shear force acting on fastener group ki = Slip modulus of fastener i k = Slip modulus for fastener group

Perma-Column Engineering Design Manual…………………………………………………………………….Page 29
Appendix A: Column Bending Tests A.1 Introduction, Test Methods and Equipment Several Perma-Columns where loaded to failure in bending to validate ACI design values. These Perma-Columns were supported and loaded as shown in Figure A.1. The spacing of 48 inches between supports was selected to provide sufficient bearing at supports while also providing a shear span to effective beam depth ratio that would push the bending strength limits of the columns during test. In this particular case, the shear span is equal to 24 inches – the distance between a support and the load point. With an effective depth of 3.97 inches, the shear span to depth ratio (a/d ratio) for PC6300 and PC6400 series columns is 6.04. The effective depth of 5.53 inches for PC8300 and PC8400 columns results in an a/d ratio of 4.34.
Figure A.1. Bending test set-up for Perma-Columns.
Beams with an a/d ratio greater than 6 fall under the general category of long beams. Beams with an a/d ratio between about 2.5 and 6 fall under the general category of intermediate length beams. Long beams typically fail in flexure. Failure begins with yielding of the tension reinforcement and ends by crushing of the concrete at the point of maximum bending moment. In addition to nearly vertical flexural cracks near the point of maximum bending moment, prior to failure slightly inclined cracks may be present between the support and region of maximum bending moment (Wang and Salmon, 1985). For intermediate length beams, vertical cracks form first, followed by inclined flexure-shear cracks. At the sudden occurrence of a flexure-shear crack, a beam is not able to redistribute load and additional load can generally not be sustained. The load corresponding to the point at which the flexure-shear crack forms represents the shear strength of the beam (Wang and Salmon, 1985).
Columns were loaded using a Tinius Olson Universal Compression-Tension Testing Machine. Load-head rate was fixed at 0.2 inches/minute. Applied load and load-head movement were recorded at 0.5 second intervals using a Campbell Scientific CR23X datalogger.
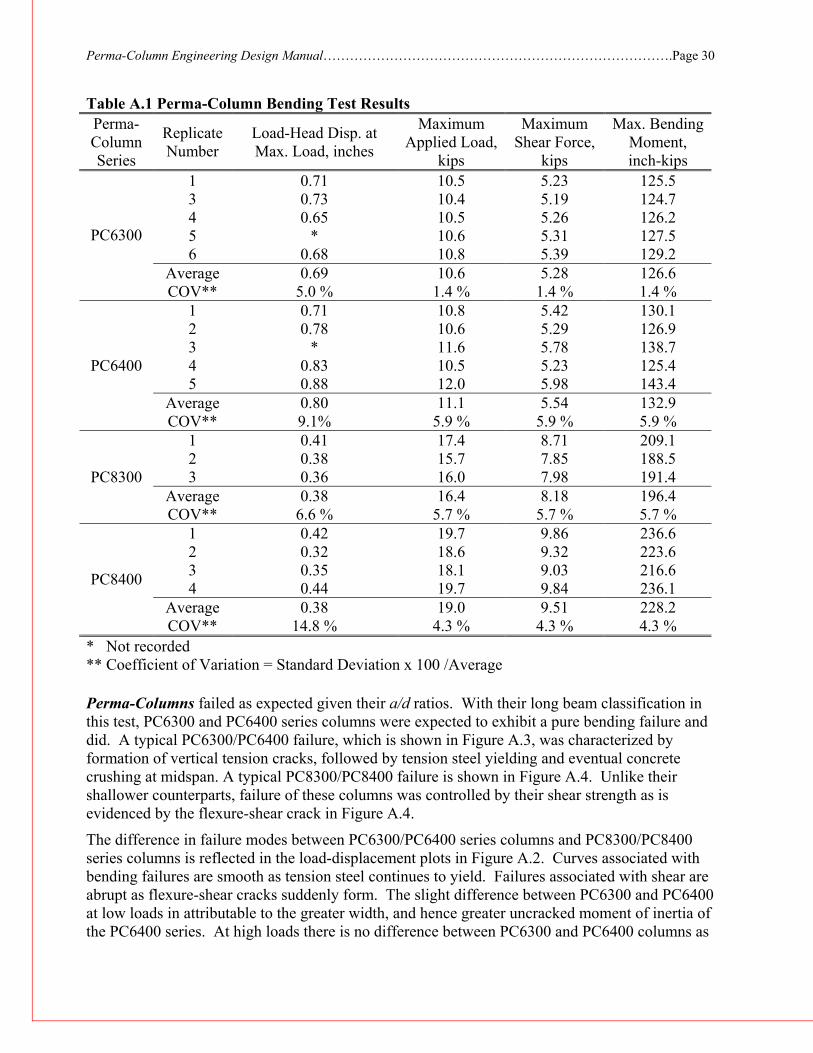
A.2 Results Table A.1 contains the load-head displacement, maximum applied load, maximum shear load (i.e., ½ total applied load) and corresponding maximum bending moment at the point of maximum load for each test specimen. Figure A.2 contains a plot of midspan displacement versus shear/bending moment for each Perma-Column series. Data for each curve in this figure was obtained by averaging load-displacement data for all specimens tested of that particular series.
24 in. 24 in.
Perma-Column Engineering Design Manual…………………………………………………………………….Page 30
Table A.1 Perma-Column Bending Test Results Perma-Column Series
Replicate Number
Load-Head Disp. at Max. Load, inches
Maximum Applied Load,
kips
Maximum Shear Force,
kips
Max. Bending Moment, inch-kips
1 0.71 10.5 5.23 125.5 3 0.73 10.4 5.19 124.7 4 0.65 10.5 5.26 126.2 5 * 10.6 5.31 127.5 6 0.68 10.8 5.39 129.2
Average 0.69 10.6 5.28 126.6
PC6300
COV** 5.0 % 1.4 % 1.4 % 1.4 % 1 0.71 10.8 5.42 130.1 2 0.78 10.6 5.29 126.9 3 * 11.6 5.78 138.7 4 0.83 10.5 5.23 125.4 5 0.88 12.0 5.98 143.4
Average 0.80 11.1 5.54 132.9
PC6400
COV** 9.1% 5.9 % 5.9 % 5.9 % 1 0.41 17.4 8.71 209.1 2 0.38 15.7 7.85 188.5 3 0.36 16.0 7.98 191.4
Average 0.38 16.4 8.18 196.4 PC8300
COV** 6.6 % 5.7 % 5.7 % 5.7 % 1 0.42 19.7 9.86 236.6 2 0.32 18.6 9.32 223.6 3 0.35 18.1 9.03 216.6 4 0.44 19.7 9.84 236.1
Average 0.38 19.0 9.51 228.2
PC8400
COV** 14.8 % 4.3 % 4.3 % 4.3 % * Not recorded ** Coefficient of Variation = Standard Deviation x 100 /Average
Perma-Columns failed as expected given their a/d ratios. With their long beam classification in this test, PC6300 and PC6400 series columns were expected to exhibit a pure bending failure and did. A typical PC6300/PC6400 failure, which is shown in Figure A.3, was characterized by formation of vertical tension cracks, followed by tension steel yielding and eventual concrete crushing at midspan. A typical PC8300/PC8400 failure is shown in Figure A.4. Unlike their shallower counterparts, failure of these columns was controlled by their shear strength as is evidenced by the flexure-shear crack in Figure A.4.
The difference in failure modes between PC6300/PC6400 series columns and PC8300/PC8400 series columns is reflected in the load-displacement plots in Figure A.2. Curves associated with bending failures are smooth as tension steel continues to yield. Failures associated with shear are abrupt as flexure-shear cracks suddenly form. The slight difference between PC6300 and PC6400 at low loads in attributable to the greater width, and hence greater uncracked moment of inertia of the PC6400 series. At high loads there is no difference between PC6300 and PC6400 columns as

Perma-Column Engineering Design Manual…………………………………………………………………….Page 31
their behavior near failure is due to the relative location and cross-sectional area of tension steel which is identical in both series. In the case of PC8300 and PC8400 columns, concrete cross-sectional area (which is greater in PC8400) controls strength and stiffness right up to failure.
Figure A.2. Average load-head displacement versus shear force/midspan bending moment.
Figure A.3. Bending failure mode characteristic of all PC6300 and PC6400 series columns.
0
50
100
150
200
250
0 0.2 0.4 0.6 0.8 1.0
Load Head Displacement, inches
Ben
ding
Mom
ent,
inch
-kip
s
PC8300
PC8400
0
4.2
8.3
12.5
16.7
20.8
Shea
r For
ce, k
ips
PC6300
PC6400
0
50
100
150
200
250
0
50
100
150
200
250
0 0.2 0.4 0.6 0.8 1.0
Load Head Displacement, inches
Ben
ding
Mom
ent,
inch
-kip
s
PC8300
PC8400
0
4.2
8.3
12.5
16.7
20.8
0
4.2
8.3
12.5
16.7
20.8
Shea
r For
ce, k
ips
PC6300
PC6400

Perma-Column Engineering Design Manual…………………………………………………………………….Page 32
Figure A.4. Shear failure mode characteristic of all PC8300 and PC8400 series columns.
A.3 Comparisons Table A.2 compares bending test results with ACI nominal shear and bending moment strength values (Vn and Mn values, respectively).
Table A.2 Comparison of Test Results With ACI Nominal Strengths
Perma-Column Series
Property Average Test Maximum
ACI Nominal Strength
Ratio, Test/ACI
Test Underestimates
Maximum Strength?
Shear, kips 5.28 4.24* 1.25 Yes PC6300 Bending Moment, inch-kips 126.6 97.2 1.30 No Shear, kips 5.54 5.42* 1.02 Yes PC6400 Bending Moment, inch-kips 132.9 104.5 1.27 No Shear, kips 8.18 6.10* 1.34 No PC8300 Bending Moment, inch-kips 196.4 197.4 1.00 Yes Shear, kips 9.51 7.73* 1.23 No PC8400 Bending Moment, inch-kips 228.2 206.8 1.10 Yes
* From Table 3.4.1 Mu/Vu = 24 inches
In all cases, actual assembly strength surpassed ACI nominal values, even in those cases where the average test maximum was not associated with the cause of failure. For example, tests of PC8300 and PC8400 columns ended when the shear capacity of the assemblies was reached; consequently,
Perma-Column Engineering Design Manual…………………………………………………………………….Page 33
the associated bending moments listed in Tables A.1 and A.2 are less than the actual bending capacity of the assemblies.
It is clearly evident from Table A.2 that ACI nominal shear strengths underestimate the actual shear strength of the assemblies by at least 20%. This can be partly attributed to the quality of the concrete used in the manufacture of Perma-Columns.
A.4 References Wang and Salmon. 1985. Reinforced Concrete Design. 4th Edition. Harper & Row Publishers. New York, New York.

Perma-Column Engineering Design Manual…………………………………………………………………….Page 34
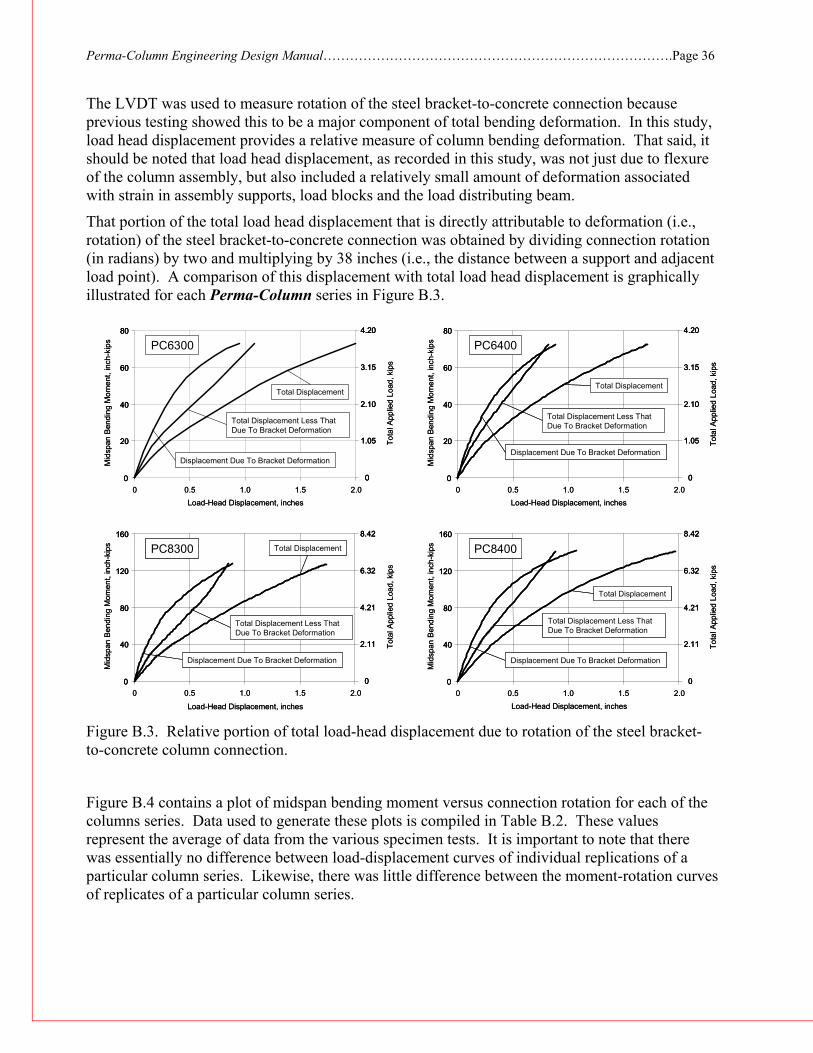
Appendix B: Bracket Bending Tests B.1 Test Methods and Equipment Several Perma-Columns where loaded to failure in bending to determine the flexural strength and stiffness of the steel bracket-to-concrete column connection. The 1/3 point loading arrangement shown in Figures B.1 and B.2 was used with the interface between the steel bracket and the concrete located in the center of the shear-free, constant-moment region (i.e., the region between the two load points).
Figure B.1. Bending test set-up for Perma-Column steel bracket-to-concrete column connection.
Figure B.2. Bending test set-up for Perma-Column steel bracket-to-concrete column connection showing LVDT used to measure joint rotation.
38 in. 38 in. 38 in.
57in. 57 in. 3 in.3 in.
P/2 P/2
38 in. 38 in. 38 in.
57in. 57 in. 3 in.3 in.
P/2 P/2

Perma-Column Engineering Design Manual…………………………………………………………………….Page 35
Loads were applied using a Tinius Olson Universal Compression-Tension Testing Machine as shown in Figure B.2. Load-head rate was fixed at 0.6 inches/minute. A linear variable differential transformer (LVDT) attached as shown in Figure B.2 was used to measure bending rotation between the concrete column and steel bracket. The core of the LVDT was placed on the edge of the bracket at a location 12 inches from concrete-to-steel bracket interface. Applied load, load-head movement, and displacements measured with the LVDT were recorded at 0.5 second intervals using a Campbell Scientific CR23X datalogger.
Six specimens each of Series PC6300 and PC8400, and four specimens each of PC6400 and PC8300 were tested. Replicates 5 and 6 of PC8400 where fabricated with #4 rebar instead of the standard #5 rebar used in these assemblies.
B.2 Results Table B.1 contains the maximum applied load and corresponding load-head displacement, end shear (i.e., ½ total applied load) and bending moment for each test specimen.
Table B.1 Perma-Column Bracket Bending Test Results PC6300 PC6400 PC8300 PC8400*
Max. Load
Load Head Disp.
Max. Load
Load Head Disp.
Max. Load
Load Head Disp.
Max. Load
Load Head Disp.
Rep.
kips inches kips inches kips inches kips inches 1 5.26 4.27 5.44 4.64 8.74 3.20 10.94 4.46 2 4.83 3.61 5.28 4.35 8.37 2.65 10.61 4.33 3 4.76 3.42 5.57 5.17 9.41 4.05 7.94 2.79 4 4.56 3.12 5.53 4.06 8.84 4.36 7.40 2.68 5 5.10 3.86 8.79 6 5.04 3.89 8.38 3.85
Max. End
Shear
Max. Bending Moment
Max. End
Shear
Max. Bending Moment
Max. End
Shear
Max. Bending Moment
Max. End
Shear
Max. Bending Moment Rep.
kips in.-kips kips in.-kips kips in.-kips kips in.-kips 1 2.63 99.8 2.72 103.3 4.37 166.1 5.47 207.9 2 2.42 91.8 2.64 100.4 4.18 158.9 5.31 201.6 3 2.38 90.5 2.79 105.9 4.71 178.8 3.97 150.9 4 2.28 86.6 2.77 105.1 4.42 168.0 3.70 140.7 5 2.55 97.0 4.40 167.0 6 2.52 95.8 4.19 159.3
Average 2.46 93.58 2.73 103.66 4.42 167.96 4.51 171.22 Std Dev 0.127 4.844 0.064 2.436 0.217 8.228 0.723 27.468
COV 0.052 0.052 0.024 0.024 0.049 0.049 0.160 0.160 5% E.L.** 85.6 99.6 154.4 126.0 * Specimens 5 and 6 fabricated with #4 rebar. ** 5% E. L. = 5% Exclusion limit assuming normal distribution = Mean – Std Dev (1.645)
Perma-Column Engineering Design Manual…………………………………………………………………….Page 36
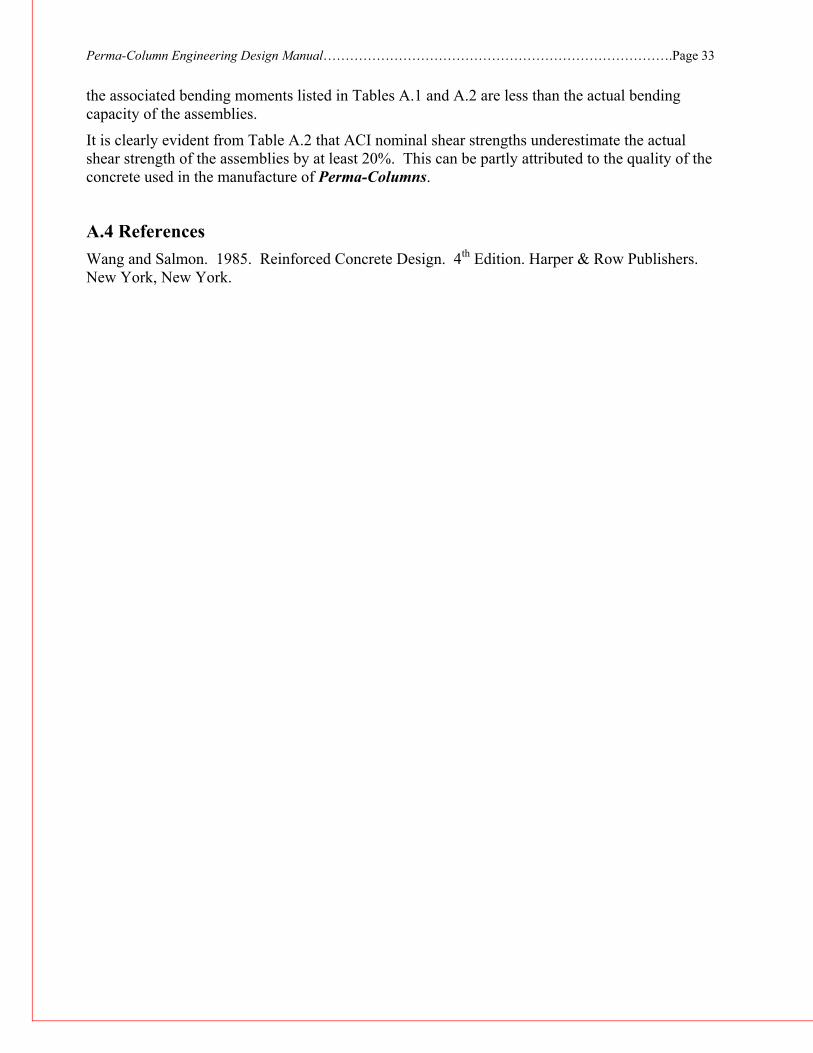
The LVDT was used to measure rotation of the steel bracket-to-concrete connection because previous testing showed this to be a major component of total bending deformation. In this study, load head displacement provides a relative measure of column bending deformation. That said, it should be noted that load head displacement, as recorded in this study, was not just due to flexure of the column assembly, but also included a relatively small amount of deformation associated with strain in assembly supports, load blocks and the load distributing beam.
That portion of the total load head displacement that is directly attributable to deformation (i.e., rotation) of the steel bracket-to-concrete connection was obtained by dividing connection rotation (in radians) by two and multiplying by 38 inches (i.e., the distance between a support and adjacent load point). A comparison of this displacement with total load head displacement is graphically illustrated for each Perma-Column series in Figure B.3.
Figure B.3. Relative portion of total load-head displacement due to rotation of the steel bracket-to-concrete column connection.
Figure B.4 contains a plot of midspan bending moment versus connection rotation for each of the columns series. Data used to generate these plots is compiled in Table B.2. These values represent the average of data from the various specimen tests. It is important to note that there was essentially no difference between load-displacement curves of individual replications of a particular column series. Likewise, there was little difference between the moment-rotation curves of replicates of a particular column series.
0
20
40
60
80
0 0.5 1.0 1.5 2.0
Mid
span
Ben
ding
Mom
ent,
inch
-kip
s
Load-Head Displacement, inches
0
1.05
2.10
3.15
4.20
Tota
l App
lied
Load
, kip
s
Displacement Due To Bracket Deformation
Total Displacement Less That Due To Bracket Deformation
Total Displacement
PC6300
0
20
40
60
80
0
20
40
60
80
0 0.5 1.0 1.5 2.0
Mid
span
Ben
ding
Mom
ent,
inch
-kip
s
Load-Head Displacement, inches
0
1.05
2.10
3.15
4.20
0
1.05
2.10
3.15
4.20
Tota
l App
lied
Load
, kip
s
Displacement Due To Bracket Deformation
Total Displacement Less That Due To Bracket Deformation
Total Displacement
PC6300
0
20
40
60
80
0 0.5 1.0 1.5 2.0
Mid
span
Ben
ding
Mom
ent,
inch
-kip
s
Load-Head Displacement, inches
0
1.05
2.10
3.15
4.20
Tota
l App
lied
Load
, kip
s
Displacement Due To Bracket Deformation
Total Displacement Less That Due To Bracket Deformation
PC6400
Total Displacement
0
20
40
60
80
0
20
40
60
80
0 0.5 1.0 1.5 2.0
Mid
span
Ben
ding
Mom
ent,
inch
-kip
s
Load-Head Displacement, inches
0
1.05
2.10
3.15
4.20
0
1.05
2.10
3.15
4.20
Tota
l App
lied
Load
, kip
s
Displacement Due To Bracket Deformation
Total Displacement Less That Due To Bracket Deformation
PC6400
Total Displacement
0
40
80
120
160
0 0.5 1.0 1.5 2.0
Mid
span
Bend
ing
Mom
ent,
inch
-kip
s
Load-Head Displacement, inches
0
2.11
4.21
6.32
8.42
Tota
l App
lied
Load
, kip
s
Total Displacement Less That Due To Bracket Deformation
PC8300 Total Displacement
Displacement Due To Bracket Deformation
0
40
80
120
160
0
40
80
120
160
0 0.5 1.0 1.5 2.0
Mid
span
Bend
ing
Mom
ent,
inch
-kip
s
Load-Head Displacement, inches
0
2.11
4.21
6.32
8.42
0
2.11
4.21
6.32
8.42
Tota
l App
lied
Load
, kip
s
Total Displacement Less That Due To Bracket Deformation
PC8300 Total Displacement
Displacement Due To Bracket Deformation
0
40
80
120
160
0 0.5 1.0 1.5 2.0
Mid
span
Ben
ding
Mom
ent,
inch
-kip
s
Load-Head Displacement, inches
0
2.11
4.21
6.32
8.42
Tota
l App
lied
Load
, kip
s
Total Displacement Less That Due To Bracket Deformation
PC8400
Total Displacement
Displacement Due To Bracket Deformation
0
40
80
120
160
0
40
80
120
160
0 0.5 1.0 1.5 2.0
Mid
span
Ben
ding
Mom
ent,
inch
-kip
s
Load-Head Displacement, inches
0
2.11
4.21
6.32
8.42
0
2.11
4.21
6.32
8.42
Tota
l App
lied
Load
, kip
s
Total Displacement Less That Due To Bracket Deformation
PC8400
Total Displacement
Displacement Due To Bracket Deformation

Perma-Column Engineering Design Manual…………………………………………………………………….Page 37
Figure B.4. Joint rotation versus bending moment for steel bracket-to-concrete connection. Plotted from data compiled in Table B.2.
Table B.2. Joint Rotation Vs. Bending Moment for Steel Bracket-to-Concrete Connections PC6300 PC6400 PC8300 PC8400
Rotation Moment Rotation Moment Rotation Moment Rotation Moment radians in.-kips radians in.-kips radians in.-kips radians in.-kips 0.00203 7.0 0.00233 8.1 0.00185 12.9 0.00198 12.2 0.00465 15.0 0.00508 17.2 0.00400 28.9 0.00446 28.5 0.00700 20.9 0.00780 23.8 0.00610 39.6 0.00694 42.0 0.00900 25.7 0.01025 29.9 0.00810 48.7 0.00916 54.1 0.01115 30.3 0.01278 35.3 0.01043 57.7 0.01184 64.7 0.01320 35.0 0.01550 40.5 0.01295 67.1 0.01420 74.0 0.01540 39.4 0.01850 45.0 0.01573 75.6 0.01712 83.5 0.01778 43.9 0.02153 49.6 0.01873 83.2 0.02030 92.2 0.02040 48.1 0.02478 52.8 0.02238 90.3 0.02374 99.8 0.02305 51.6 0.02833 57.2 0.02638 97.2 0.02732 107.3 0.02613 55.5 0.03195 61.1 0.03048 104.6 0.03122 113.8 0.02948 58.9 0.03590 64.7 0.03475 111.5 0.03526 119.4 0.03303 62.1 0.04015 67.9 0.03920 117.9 0.03954 125.3 0.03683 65.2 0.04470 70.9 0.04370 123.9 0.04408 130.4 0.04073 67.8 0.04874 135.1 0.04523 70.4 0.05364 138.9
0
40
80
120
160
0 0.01 0.02 0.03 0.04 0.05
Ben
ding
Mom
ent,
inch
-kip
s
Rotation, radians
PC8400
PC8300
PC6400
PC6300
0
40
80
120
160
0 0.01 0.02 0.03 0.04 0.05
Ben
ding
Mom
ent,
inch
-kip
s
Rotation, radians
PC8400
PC8300
PC6400
PC6300

Perma-Column Engineering Design Manual…………………………………………………………………….Page 38
PC6300 and PC6400 assemblies failed due to concrete crushing that was preceded by significant yielding of tension side steel (see Figure B.5). While most PC8300 and PC8400 failed in a similar fashion, a couple failed (e.g., PC8400 replicates 3 and 4) when high stress concentrations due to excessive deformation resulted in a fracture of the tension steel-to-steel bracket interface as shown in Figure B.6.
Figure B.5. Typical bending failure mode for steel bracket-to-concrete connection.
Figure B.6. Fracture of tension steel rebar connection in PC8400 replicate 4.
B.3 Discussion Table B.3 contains a comparison of mean bracket bending strengths to (1) bending strength values for the reinforced concrete sections from test (Appendix A), and (2) calculated ACI nominal bending strength values from Section 3.1. The more realistic comparisons are those for series PC6300 and PC6400 because the failure mode associated with maximum bracket bending strength was the same as that for the reinforced column tests (Appendix A), that is, failure in both cases

Perma-Column Engineering Design Manual…………………………………………………………………….Page 39
resulted from concrete crushing after significant yielding of tension steel. As the footnote in Table B.3 points out, comparisons of maximum bracket bending strengths for PC8300 and PC8400 with bending strengths from Appendix A are not as meaningful as strengths reported in Appendix A for those series was controlled by shear (and not bending) strength.
Table B.3. Comparison of Bracket Bending Strength to Column Bending Strength Values Variable PC6300 PC6400 PC8300 PC8400
Mean Bending Strength, inch-kips 93.6 103.7 168.0 171.2 Ratio of Mean Bending Strength to Reinforced Concrete Bending Strength As Determined By Test 73.9% 78.0% 85.5%* 75.0%*
Ratio of Mean Bending Strength to ACI Reinforced Concrete Nominal Bending Strength 96.3% 99.2% 85.1% 82.8%
* Percentages inflated because bending strength values from Appendix A for PC8300 and PC8400 are not maximum bending strengths as maximum load was limited by shear strength.
Figure B.7. Relationship between maximum applied load and load-head displacement.
The maximum load values and associated load-head displacements listed in Table B.1 have been plotted in Figure B.7. This figure shows that higher maximum loads are associated with higher displacements at failure. This is logical since load continues to increase as tension steel yields and displacement increases.
The plots in Figure B.3 illustrate that deformation in the joint area accounts for an increasing percentage of total load-head displacement as load increases. At approximately 75% of maximum load, joint rotation accounts for the bulk of the load-head displacement. This is due to the formation of a plastic hinge in the joint region.
The switch from #5 to a #4 rebar in replicates 5 and 6 of the PC8400 series appears to have had a significant affect on joint bending strength when these two replicates are compared to PC8400 replicates 1 and 2 which had similar failure modes. This is expected as joint bending strength is directly related to tension steel cross-sectional area.
0
1
2
3
4
5
6
0 2 4 6 8 10 12
Maximum Applied Load, kips
Load
-Hea
d D
ispl
acem
ent A
t M
axim
um L
oad,
inch
es
PC6300PC6400PC8300PC8400
0
1
2
3
4
5
6
0
1
2
3
4
5
6
0 2 4 6 8 10 120 2 4 6 8 10 12
Maximum Applied Load, kips
Load
-Hea
d D
ispl
acem
ent A
t M
axim
um L
oad,
inch
es
PC6300PC6400PC8300PC8400
PC6300PC6400PC8300PC8400
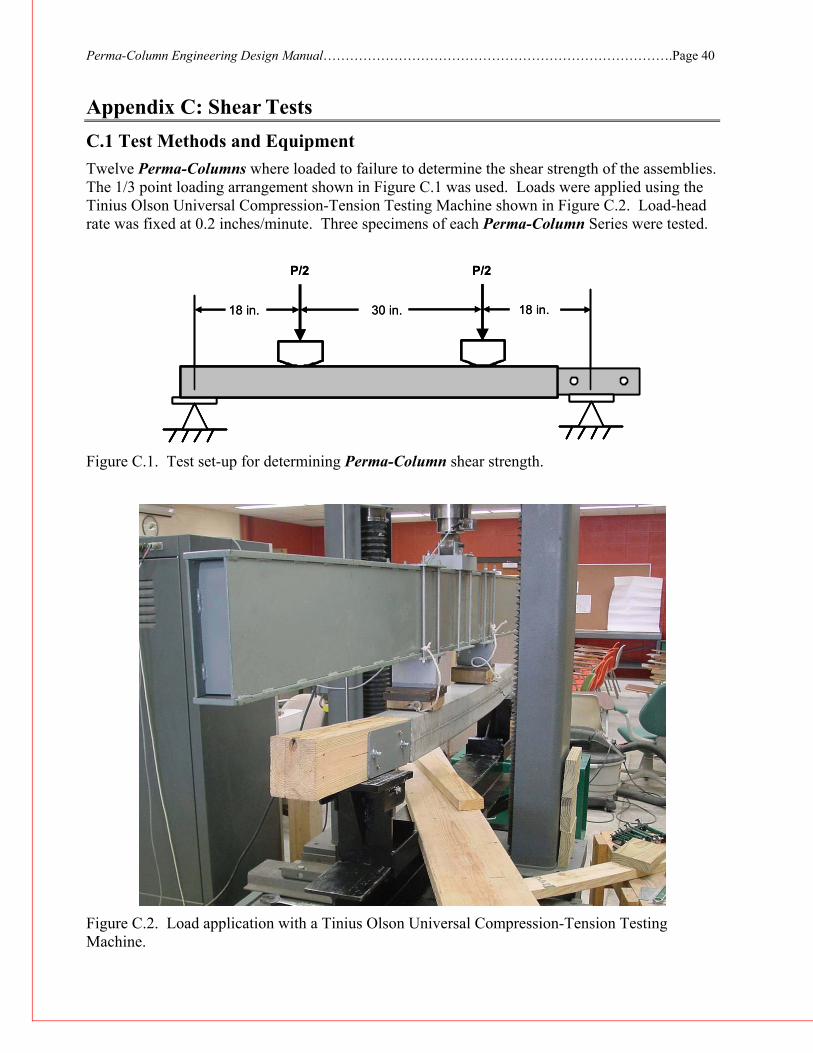
Perma-Column Engineering Design Manual…………………………………………………………………….Page 40
Appendix C: Shear Tests C.1 Test Methods and Equipment Twelve Perma-Columns where loaded to failure to determine the shear strength of the assemblies. The 1/3 point loading arrangement shown in Figure C.1 was used. Loads were applied using the Tinius Olson Universal Compression-Tension Testing Machine shown in Figure C.2. Load-head rate was fixed at 0.2 inches/minute. Three specimens of each Perma-Column Series were tested.
Figure C.1. Test set-up for determining Perma-Column shear strength.
Figure C.2. Load application with a Tinius Olson Universal Compression-Tension Testing Machine.
18 in. 30 in. 18 in.
P/2 P/2
18 in. 30 in. 18 in.
P/2 P/2

Perma-Column Engineering Design Manual…………………………………………………………………….Page 41
The 18 inch distance between beam support and beam load point results in a a/d ratio of 4.6 for the PC6300 and PC6400 Perma-Columns, and a/d ratio of 3.2 for the PC8300 and PC8400 Perma-Columns. As noted in Appendix A, beams with an a/d ratio between about 2.5 and 6 fall under the general category of intermediate length beams. For intermediate length beams, vertical cracks form first, followed by inclined flexure-shear cracks. At the sudden occurrence of a flexure-shear crack, a beam is not able to redistribute load and additional load can generally not be sustained. The load corresponding to the point at which the flexure-shear crack forms represents the shear strength of the beam (Wang and Salmon, 1985).
C.2 Results Table C.1 contains the maximum end shear (i.e., ½ total applied load) and the maximum bending moment for each test specimen.
Table C.1 Perma-Column Shear Test Results PC6300 PC6400 PC8300 PC8400
Max. Shear Force
Max. Bending Moment
Max. Shear Force
Max. Bending Moment
Max. Shear Force
Max. Bending Moment
Max. Shear Force
Max. Bending Moment
Rep.
kips in.-kips kips in.-kips kips in.-kips kips in.-kips 1 6.14 110.5 5.86 105.6 12.58 226.4 13.74 247.3 2 5.65 101.8 6.43* 115.7* 13.93 250.8 13.93* 250.7* 3 6.12 110.1 6.01 108.2 12.97 233.5 13.59* 244.6*
Average 5.97 107.5 6.10 109.8 13.16 236.9 13.75 247.5 Std Dev 0.27 4.9 0.29 5.2 0.70 12.6 0.17 3.0 COV, % 4.59 4.78 5.30 1.23
* Bending related failure at bracket end of specimen
There were two distinctly different failure modes associated with the tests. Nine of the twelve specimens exhibited a shear failure on the “non-bracketed” end of the specimen as shown in the top and middle pictures in Figure C.3. Maximum load in the other three specimens (one PC8300 and two PC8400) was limited by a bending related failure of the steel bracket-to-concrete column connection. This failure mode is shown in the bottom photograph in Figure C.3.
C.3 Comparisons Table C.2 contains a comparison of test results with ACI nominal strengths. Because this test was structured to determine the shear strength of the assemblies, the tests should not underestimate maximum shear strengths (as was the case with the bending tests reported in Appendix A). However, because of the two bending related failures associated with PC8400 specimens, it could be argued that the test results still underestimate the average maximum shear strength of the PC8400 assemblies. It is for this reason that the word “maybe” appears in the far right column of the Table C.2.
The test-to-ACI shear strength ratios of 2.12 and 1.76 in Table C.2 demonstrate that the average maximum shear strength values for the PC8300 and PC8400 Series Perma-Columns are significantly greater than the ACI nominal strengths. These ratios are also measurably greater than the test-to-ACI shear strength ratios of 1.34 and 1.23 reported for the same column series in Appendix A.
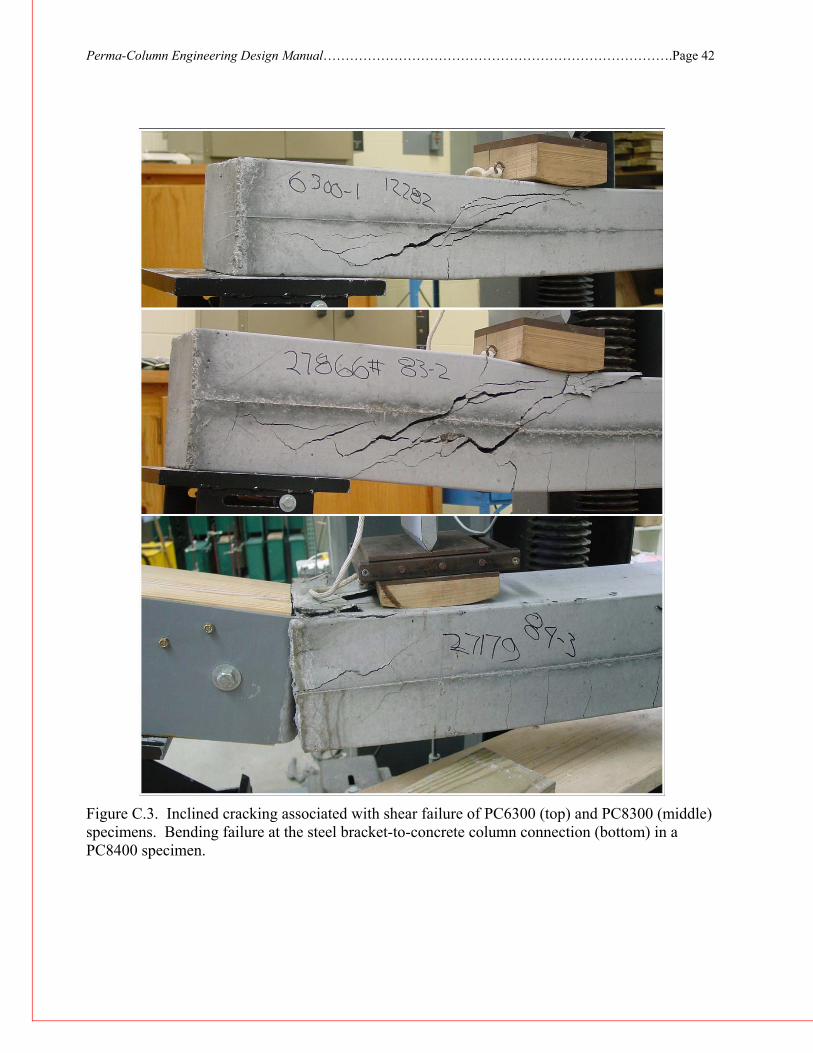
Perma-Column Engineering Design Manual…………………………………………………………………….Page 42
Figure C.3. Inclined cracking associated with shear failure of PC6300 (top) and PC8300 (middle) specimens. Bending failure at the steel bracket-to-concrete column connection (bottom) in a PC8400 specimen.
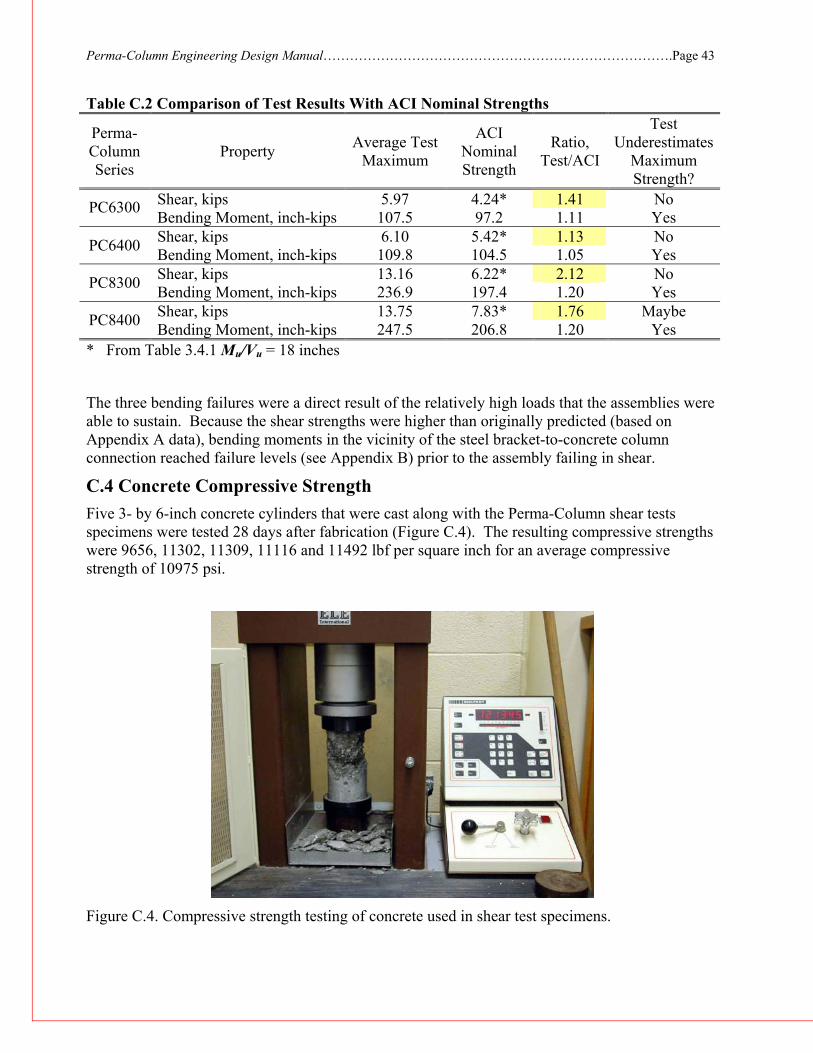
Perma-Column Engineering Design Manual…………………………………………………………………….Page 43
Table C.2 Comparison of Test Results With ACI Nominal Strengths
Perma-Column Series
Property Average Test Maximum
ACI Nominal Strength
Ratio, Test/ACI
Test Underestimates
Maximum Strength?
Shear, kips 5.97 4.24* 1.41 No PC6300 Bending Moment, inch-kips 107.5 97.2 1.11 Yes Shear, kips 6.10 5.42* 1.13 No PC6400 Bending Moment, inch-kips 109.8 104.5 1.05 Yes Shear, kips 13.16 6.22* 2.12 No PC8300 Bending Moment, inch-kips 236.9 197.4 1.20 Yes Shear, kips 13.75 7.83* 1.76 Maybe PC8400 Bending Moment, inch-kips 247.5 206.8 1.20 Yes
* From Table 3.4.1 Mu/Vu = 18 inches
The three bending failures were a direct result of the relatively high loads that the assemblies were able to sustain. Because the shear strengths were higher than originally predicted (based on Appendix A data), bending moments in the vicinity of the steel bracket-to-concrete column connection reached failure levels (see Appendix B) prior to the assembly failing in shear.
C.4 Concrete Compressive Strength Five 3- by 6-inch concrete cylinders that were cast along with the Perma-Column shear tests specimens were tested 28 days after fabrication (Figure C.4). The resulting compressive strengths were 9656, 11302, 11309, 11116 and 11492 lbf per square inch for an average compressive strength of 10975 psi.
Figure C.4. Compressive strength testing of concrete used in shear test specimens.

Perma-Column Engineering Design Manual…………………………………………………………………….Page 44
Appendix D: Steel Bracket-to-Wood Connection Tests D.1 Overview A series of tests were conducted to examine the performance of three different steel bracket-to-wood connections. These tests were conducted for two primary purposes. First, there was interest in determining the relative strength of (1) connections made with two 0.5- by 5.0-inch SAE grade 5 bolts, (2) connections made with twelve 0.25- by 3.0-inch Simpson Strong-Drive® wood screws (a.k.a. SDS screws), and (3) connections featuring two 0.5- by 5.0-inch bolts and four of the 0.25-inch diameter SDS screws. These three connection types are herein referred to as the bolt, screw, and combo connections, respectively. The second objective of these tests was to determine bending moment-rotation relationships for the connections. The three different connections were made using the steel bracket design shown in Figure D.1. This bracket was designed so that (1) two identical bent plates could be welded together to form a single bracket, and (2) bolt holes, but not screw holes, would line up after the bent plates were welded together. There were six 0.25-inch diameter and two 0.50-inch diameter holes in each plate. The relative arrangement of 0.25-inch diameter holes A, B and C was identical on both ends of the plate. The white dots in Figure D.1 show the location of holes on the backside of the bracket after two identical bent plates were welded together.
Figure D.1. Dimensions and hole pattern for steel bracket used in connection tests. The four SDS screws used in the “combo” connection tests were located in holes labeled with an “A” in Figure D.1.
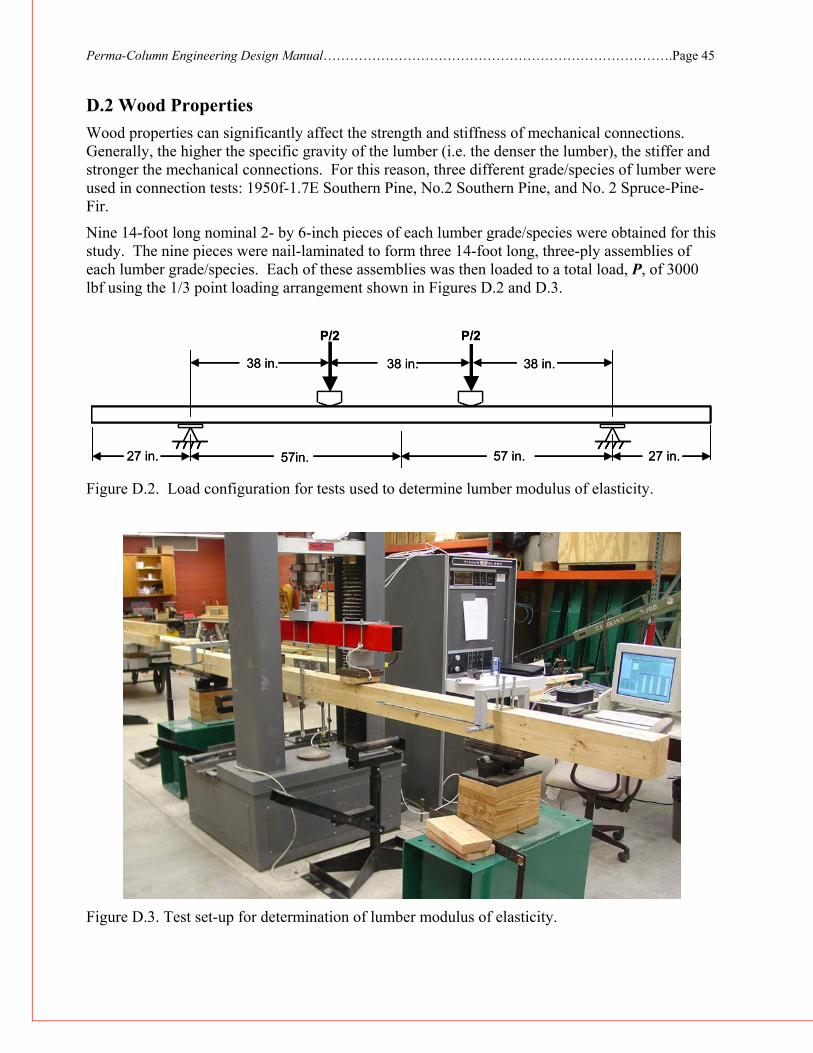
Perma-Column Engineering Design Manual…………………………………………………………………….Page 45
D.2 Wood Properties Wood properties can significantly affect the strength and stiffness of mechanical connections. Generally, the higher the specific gravity of the lumber (i.e. the denser the lumber), the stiffer and stronger the mechanical connections. For this reason, three different grade/species of lumber were used in connection tests: 1950f-1.7E Southern Pine, No.2 Southern Pine, and No. 2 Spruce-Pine-Fir.
Nine 14-foot long nominal 2- by 6-inch pieces of each lumber grade/species were obtained for this study. The nine pieces were nail-laminated to form three 14-foot long, three-ply assemblies of each lumber grade/species. Each of these assemblies was then loaded to a total load, P, of 3000 lbf using the 1/3 point loading arrangement shown in Figures D.2 and D.3.
Figure D.2. Load configuration for tests used to determine lumber modulus of elasticity.
Figure D.3. Test set-up for determination of lumber modulus of elasticity.
38 in. 38 in. 38 in.
57in. 57 in. 27 in.27 in.
P/2 P/2
38 in. 38 in. 38 in.
57in. 57 in. 27 in.27 in.
P/2 P/2
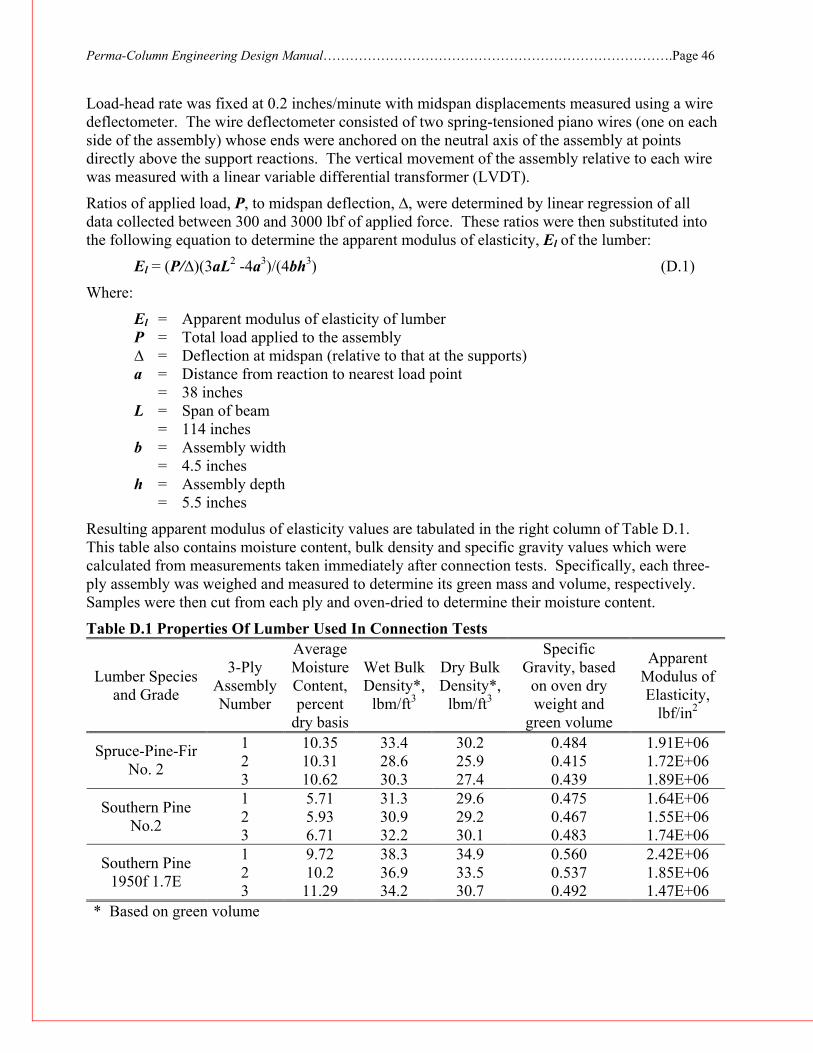
Perma-Column Engineering Design Manual…………………………………………………………………….Page 46
Load-head rate was fixed at 0.2 inches/minute with midspan displacements measured using a wire deflectometer. The wire deflectometer consisted of two spring-tensioned piano wires (one on each side of the assembly) whose ends were anchored on the neutral axis of the assembly at points directly above the support reactions. The vertical movement of the assembly relative to each wire was measured with a linear variable differential transformer (LVDT).
Ratios of applied load, P, to midspan deflection, ∆, were determined by linear regression of all data collected between 300 and 3000 lbf of applied force. These ratios were then substituted into the following equation to determine the apparent modulus of elasticity, El of the lumber:
El = (P/∆)(3aL2 -4a3)/(4bh3) (D.1)
Where:
El = Apparent modulus of elasticity of lumber P = Total load applied to the assembly ∆ = Deflection at midspan (relative to that at the supports) a = Distance from reaction to nearest load point = 38 inches L = Span of beam = 114 inches b = Assembly width = 4.5 inches h = Assembly depth = 5.5 inches
Resulting apparent modulus of elasticity values are tabulated in the right column of Table D.1. This table also contains moisture content, bulk density and specific gravity values which were calculated from measurements taken immediately after connection tests. Specifically, each three-ply assembly was weighed and measured to determine its green mass and volume, respectively. Samples were then cut from each ply and oven-dried to determine their moisture content.
Table D.1 Properties Of Lumber Used In Connection Tests
Lumber Species and Grade
3-Ply Assembly Number
Average Moisture Content, percent
dry basis
Wet Bulk Density*,
lbm/ft3
Dry Bulk Density*,
lbm/ft3
Specific Gravity, based
on oven dry weight and
green volume
Apparent Modulus of Elasticity,
lbf/in2
1 10.35 33.4 30.2 0.484 1.91E+06 2 10.31 28.6 25.9 0.415 1.72E+06 Spruce-Pine-Fir
No. 2 3 10.62 30.3 27.4 0.439 1.89E+06 1 5.71 31.3 29.6 0.475 1.64E+06 2 5.93 30.9 29.2 0.467 1.55E+06 Southern Pine
No.2 3 6.71 32.2 30.1 0.483 1.74E+06 1 9.72 38.3 34.9 0.560 2.42E+06 2 10.2 36.9 33.5 0.537 1.85E+06 Southern Pine
1950f 1.7E 3 11.29 34.2 30.7 0.492 1.47E+06 * Based on green volume

Perma-Column Engineering Design Manual…………………………………………………………………….Page 47
D.3 Connection Test Methods and Equipment Each 3-ply assembly was cut at midspan and then spliced back together with a pair of steel brackets that had been welded together using special steel splice plates. These specimens were then loaded to failure using the 1/3 point loading arrangement shown in Figures D.4 and D.5. Load-head rate was fixed at 0.2 inches/minute. The same wire deflectometers used to measure the midspan deflection in the MOE tests (see Figure D.3) were used to monitor the vertical displacement of the center of the steel bracket.
Figure D.4. Load configuration for tests used to determine lumber modulus of elasticity.
Figure D.5. Bolted connection prior to testing showing placement of wire deflectometers (left) and combo connection (connection with bolts and SDS screws) at maximum load (right).
Each 3-ply nail-laminated assembly was used for two connection tests. This was accomplished by removing the fasteners and steel bracket after the first test, and joining together (with a new steel bracket and fasteners) what were the two extreme ends of the bolted assembly during the first test. Using the same 3-ply nail-laminated assembly in two different connection tests resulted in better accounting of differences in connection behavior resulting from changes in lumber properties. The experimental design for these connection tests is summarized in Table D.2. This table
38 in. 38 in. 38 in.
57in. 57 in. 27 in.27 in.
P/2 P/2
38 in. 38 in. 38 in.
57in. 57 in. 27 in.27 in.
P/2 P/2
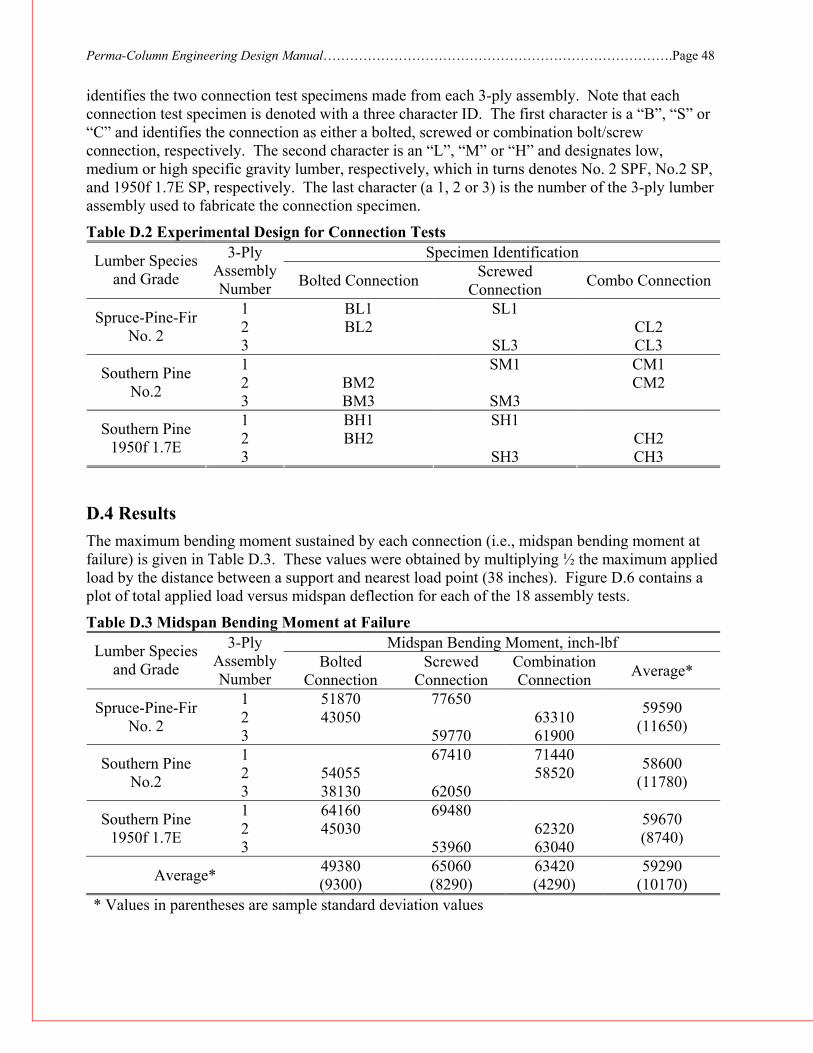
Perma-Column Engineering Design Manual…………………………………………………………………….Page 48
identifies the two connection test specimens made from each 3-ply assembly. Note that each connection test specimen is denoted with a three character ID. The first character is a “B”, “S” or “C” and identifies the connection as either a bolted, screwed or combination bolt/screw connection, respectively. The second character is an “L”, “M” or “H” and designates low, medium or high specific gravity lumber, respectively, which in turns denotes No. 2 SPF, No.2 SP, and 1950f 1.7E SP, respectively. The last character (a 1, 2 or 3) is the number of the 3-ply lumber assembly used to fabricate the connection specimen.
Table D.2 Experimental Design for Connection Tests Specimen Identification Lumber Species
and Grade
3-Ply Assembly Number Bolted Connection Screwed
Connection Combo Connection
1 BL1 SL1 2 BL2 CL2 Spruce-Pine-Fir
No. 2 3 SL3 CL3 1 SM1 CM1 2 BM2 CM2 Southern Pine
No.2 3 BM3 SM3 1 BH1 SH1 2 BH2 CH2 Southern Pine
1950f 1.7E 3 SH3 CH3
D.4 Results The maximum bending moment sustained by each connection (i.e., midspan bending moment at failure) is given in Table D.3. These values were obtained by multiplying ½ the maximum applied load by the distance between a support and nearest load point (38 inches). Figure D.6 contains a plot of total applied load versus midspan deflection for each of the 18 assembly tests.
Table D.3 Midspan Bending Moment at Failure Midspan Bending Moment, inch-lbf Lumber Species
and Grade
3-Ply Assembly Number
Bolted Connection
Screwed Connection
Combination Connection Average*
1 51870 77650 2 43050 63310 Spruce-Pine-Fir
No. 2 3 59770 61900
59590 (11650)
1 67410 71440 2 54055 58520 Southern Pine
No.2 3 38130 62050
58600 (11780)
1 64160 69480 2 45030 62320 Southern Pine
1950f 1.7E 3 53960 63040
59670 (8740)
Average* 49380 (9300)
65060 (8290)
63420 (4290)
59290 (10170)
* Values in parentheses are sample standard deviation values
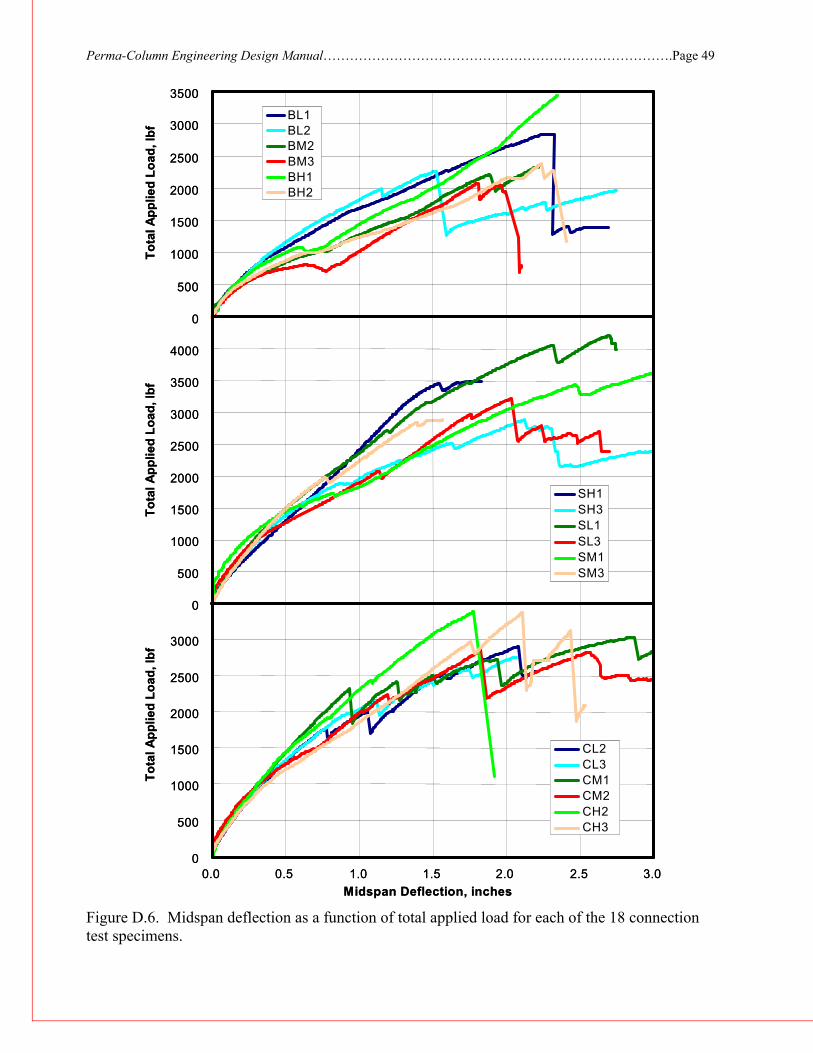
Perma-Column Engineering Design Manual…………………………………………………………………….Page 49
Figure D.6. Midspan deflection as a function of total applied load for each of the 18 connection test specimens.
0
500
1000
1500
2000
2500
3000
3500
4000
0
500
1000
1500
2000
2500
3000
3500
Tota
l App
lied
Load
, lbf
Tota
l App
lied
Load
, lbf
0
500
1000
1500
2000
2500
3000
0.0 0.5 1.0 1.5 2.0 2.5 3.0Midspan Deflection, inches
Tota
l App
lied
Load
, lbf
CL2CL3CM1CM2CH2CH3
SH1SH3SL1SL3SM1SM3
BL1BL2BM2BM3BH1BH2
0
500
1000
1500
2000
2500
3000
3500
4000
0
500
1000
1500
2000
2500
3000
3500
Tota
l App
lied
Load
, lbf
Tota
l App
lied
Load
, lbf
0
500
1000
1500
2000
2500
3000
0.0 0.5 1.0 1.5 2.0 2.5 3.0Midspan Deflection, inches
Tota
l App
lied
Load
, lbf
CL2CL3CM1CM2CH2CH3
CL2CL3CM1CM2CH2CH3
SH1SH3SL1SL3SM1SM3
SH1SH3SL1SL3SM1SM3
BL1BL2BM2BM3BH1BH2
BL1BL2BM2BM3BH1BH2
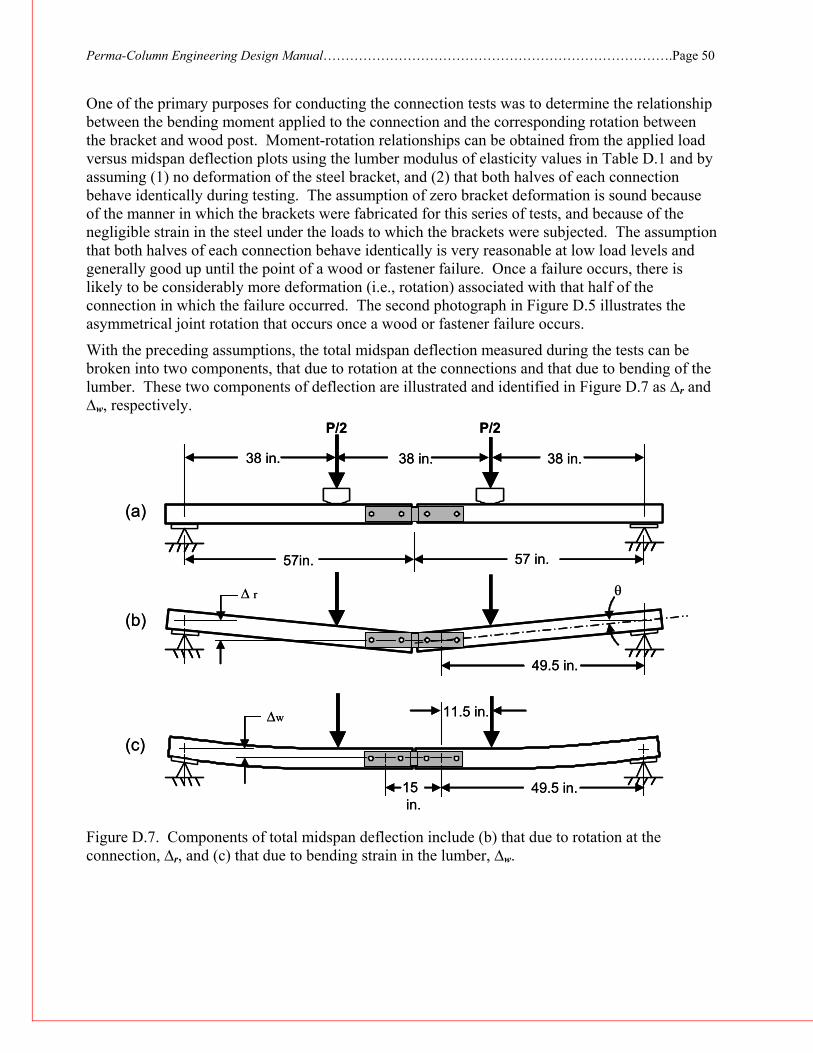
Perma-Column Engineering Design Manual…………………………………………………………………….Page 50
One of the primary purposes for conducting the connection tests was to determine the relationship between the bending moment applied to the connection and the corresponding rotation between the bracket and wood post. Moment-rotation relationships can be obtained from the applied load versus midspan deflection plots using the lumber modulus of elasticity values in Table D.1 and by assuming (1) no deformation of the steel bracket, and (2) that both halves of each connection behave identically during testing. The assumption of zero bracket deformation is sound because of the manner in which the brackets were fabricated for this series of tests, and because of the negligible strain in the steel under the loads to which the brackets were subjected. The assumption that both halves of each connection behave identically is very reasonable at low load levels and generally good up until the point of a wood or fastener failure. Once a failure occurs, there is likely to be considerably more deformation (i.e., rotation) associated with that half of the connection in which the failure occurred. The second photograph in Figure D.5 illustrates the asymmetrical joint rotation that occurs once a wood or fastener failure occurs.
With the preceding assumptions, the total midspan deflection measured during the tests can be broken into two components, that due to rotation at the connections and that due to bending of the lumber. These two components of deflection are illustrated and identified in Figure D.7 as ∆r and ∆w, respectively.
Figure D.7. Components of total midspan deflection include (b) that due to rotation at the connection, ∆r, and (c) that due to bending strain in the lumber, ∆w.
38 in. 38 in. 38 in.
57in. 57 in.
P/2 P/2
49.5 in.
∆ r θ
49.5 in.
∆w
15in.
11.5 in.
(a)
(b)
(c)
38 in. 38 in. 38 in.
57in. 57 in.
P/2 P/2
49.5 in.
∆ r θ
49.5 in.
∆w
15in.
11.5 in.
(a)
(b)
(c)
Perma-Column Engineering Design Manual…………………………………………………………………….Page 51
The two components of total midspan displacement are calculated as:
∆r = θ D (D.2)
∆w = (P/ El)(3aLe2 -4a3)/(4bh3) (D.3)
Where:
∆r = Midpsan deflection due to joint rotation θ = Joint rotation D = Distance from support to center of joint rotation = 49.5 inches ∆w = Midspan deflection due to bending of wood posts El = Apparent modulus of elasticity of lumber P = Total load applied to the assembly a = Distance from reaction to nearest load point = 38 inches Le = Effective bending span of 3-ply assembly (total assembly length minus effective
length of steel bracket) = 99 inches (114 inches – 15 inches) b = Assembly width = 4.5 inches h = Assembly depth = 5.5 inches
Because the joint region is in a shear-free region, the center of rotation between each half of the steel bracket and the corresponding section of the 3-ply assembly will be located at the centroid of the fastener pattern. These centroids are 7.5 inches from the midspan of the test specimens, or distance D of 49.5 inches from each support.
Joint rotation, θ, can be calculated be rearranging equation D.2 and equating ∆r to the difference between total midspan deflection, ∆t, and ∆w. In equation form:
θ = [∆t - (P/ El)(3aLe2 - 4a3)/(4bh3)]/D (D.4)
Equation D.4 was used to convert total applied load versus total midspan deflection data to bending moment versus joint rotation data. A portion of this data is compiled in Table D.4 for each test specimen. Average values for each of the three connection types are also compile in Table D.4 and have been plotted in Figure D.8.
Lumber specific gravity values are also tabulated in Table D.4. To determine if specific gravity had a measurable impact on joint stiffness, the specific gravity values were plotted against the bending moment at a rotation of 0.002 (Figure D.9). This plot does not show a strong relationship between specific gravity and joint stiffness for any of the connection types. This was expected given (1) the small range in specific gravity values, and (2) the high variability in joint stiffness (as indicated by the relatively high COV values in Table D.4).

Perma-Column Engineering Design Manual…………………………………………………………………….Page 52
Table D.4 Joint Bending Moment-Rotation Data Bending Moment, inch-lbf for Rotation in Radians of Specimen
ID
Lumber Specific Gravity 0.001 0.002 0.003 0.004 0.005 0.006 0.007 0.008 0.010 0.020
SL1 0.484 8416 14992 19381 22759 26081 29052 31639 34026 38654 60083 SL3 0.439 6026 11581 15925 18662 20867 22566 23849 25291 28042 41689 SM1 0.475 12405 17590 20746 23136 25508 27130 28384 29231 31162 43050 SM3 0.483 7782 13953 18936 23672 27464 30597 33194 35692 36320 54621 SH1 0.560 3879 7923 11272 14102 16941 19726 22524 25224 31090 60535 SH3 0.492 7496 14128 19287 22849 26038 28353 30457 32141 35251 44749
Average 0.489 7667 13361 17591 20863 23817 26237 28341 30268 33420 50788 COV (%)* 8.1 36.9 24.6 19.8 18.1 17.0 16.0 15.2 14.7 11.9 17.1
BL1 0.484 4089 8338 11783 15392 18285 20495 22398 24444 28039 39222 BL2 0.415 3532 7065 10233 13401 15820 17613 19152 20764 23759 35702 BM2 0.467 2327 4653 6980 9241 11024 12606 13937 15269 17348 27172 BM3 0.483 2370 4739 7109 9567 11131 12341 13147 13784 14657 22535 BH1 0.560 3948 7825 10803 12920 14659 16264 17456 18677 20647 31153 BH2 0.537 2629 5257 8005 9990 11710 13231 14544 15630 17889 24888
Average 0.491 3149 6313 9152 11752 13772 15425 16772 18095 20390 30112 COV (%)* 10.5 25.5 25.8 22.4 21.4 21.6 21.2 21.3 22.2 23.9 21.5
CL2 0.415 5752 10965 15049 18534 22002 24945 27455 29914 33499 42313 CL3 0.439 6210 11732 15523 18638 21519 24248 26623 28580 32679 42823 CM1 0.475 5079 10405 14857 19140 23073 26904 30359 33572 39541 42506 CM2 0.467 8363 13995 17333 19855 22059 24041 25692 26904 29049 45205 CH2 0.537 7931 13098 17224 21350 25014 27937 30271 32252 36478 57196 CH3 0.492 6261 11966 15807 18774 21225 22965 24347 26095 29691 48319
Average 0.471 6599 12027 15966 19382 22482 25173 27458 29553 33490 46394 COV (%)* 9.0 19.4 11.1 6.7 5.6 6.2 7.5 8.9 10.0 12.0 12.4 COV (coefficient of variation) in % = 100(Standard Deviation of Values)/(Average of Values)
Figure D.8. Average joint bending moment-rotation curves for the three connection types.
0
10000
20000
30000
40000
50000
60000
0.000 0.005 0.010 0.015 0.020 0.025 0.030
Joint Rotation, radians
Ben
ding
Mom
ent,
in-lb
f
Bolts
Screws
Combo
0
10000
20000
30000
40000
50000
60000
0.000 0.005 0.010 0.015 0.020 0.025 0.030
Joint Rotation, radians
Ben
ding
Mom
ent,
in-lb
f
Bolts
Screws
Combo
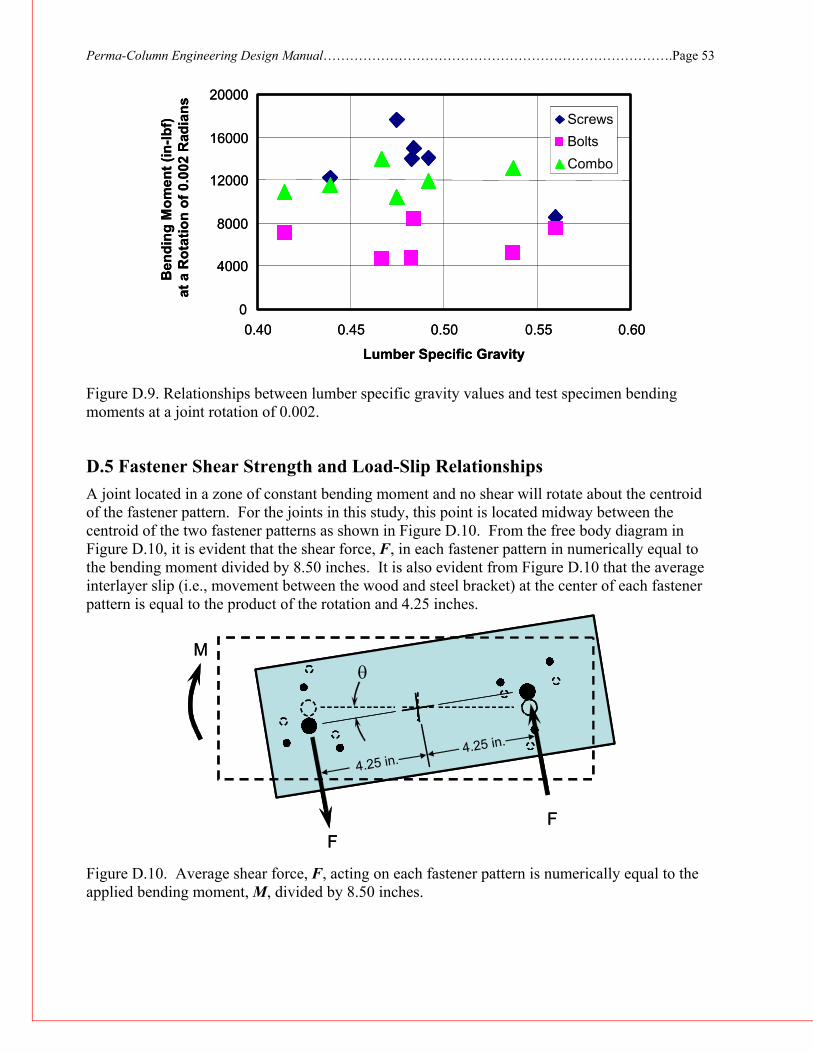
Perma-Column Engineering Design Manual…………………………………………………………………….Page 53
Figure D.9. Relationships between lumber specific gravity values and test specimen bending moments at a joint rotation of 0.002.
D.5 Fastener Shear Strength and Load-Slip Relationships A joint located in a zone of constant bending moment and no shear will rotate about the centroid of the fastener pattern. For the joints in this study, this point is located midway between the centroid of the two fastener patterns as shown in Figure D.10. From the free body diagram in Figure D.10, it is evident that the shear force, F, in each fastener pattern in numerically equal to the bending moment divided by 8.50 inches. It is also evident from Figure D.10 that the average interlayer slip (i.e., movement between the wood and steel bracket) at the center of each fastener pattern is equal to the product of the rotation and 4.25 inches.
Figure D.10. Average shear force, F, acting on each fastener pattern is numerically equal to the applied bending moment, M, divided by 8.50 inches.
0
4000
8000
12000
16000
20000
0.40 0.45 0.50 0.55 0.60
Lumber Specific Gravity
Ben
ding
Mom
ent (
in-lb
f)at
a R
otat
ion
of 0
.002
Rad
ians
ScrewsBoltsCombo
0
4000
8000
12000
16000
20000
0.40 0.45 0.50 0.55 0.60
Lumber Specific Gravity
Ben
ding
Mom
ent (
in-lb
f)at
a R
otat
ion
of 0
.002
Rad
ians
ScrewsBoltsCombo
ScrewsBoltsCombo
FF
M
4.25 in.
θ
4.25 in.
FF
M
4.25 in.
θ
4.25 in.
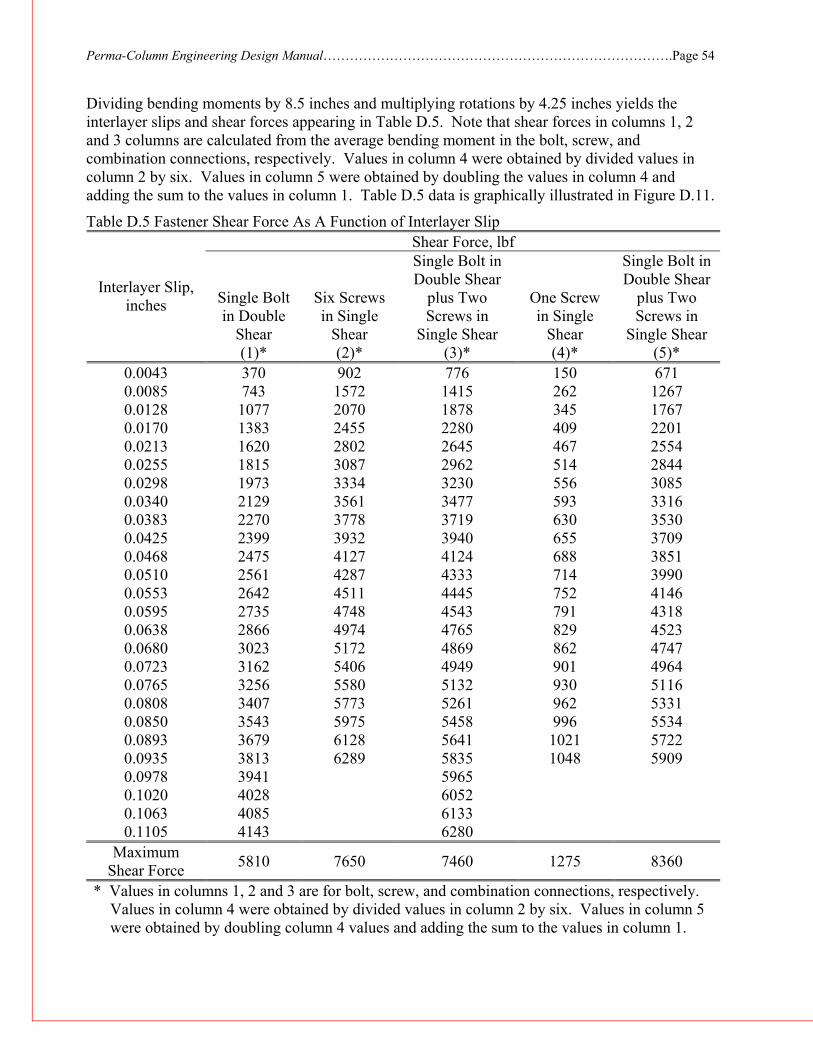
Perma-Column Engineering Design Manual…………………………………………………………………….Page 54
Dividing bending moments by 8.5 inches and multiplying rotations by 4.25 inches yields the interlayer slips and shear forces appearing in Table D.5. Note that shear forces in columns 1, 2 and 3 columns are calculated from the average bending moment in the bolt, screw, and combination connections, respectively. Values in column 4 were obtained by divided values in column 2 by six. Values in column 5 were obtained by doubling the values in column 4 and adding the sum to the values in column 1. Table D.5 data is graphically illustrated in Figure D.11.
Table D.5 Fastener Shear Force As A Function of Interlayer Slip Shear Force, lbf
Single Bolt in Double
Shear
Six Screws in Single
Shear
Single Bolt in Double Shear
plus Two Screws in
Single Shear
One Screw in Single
Shear
Single Bolt in Double Shear
plus Two Screws in
Single Shear
Interlayer Slip, inches
(1)* (2)* (3)* (4)* (5)* 0.0043 370 902 776 150 671 0.0085 743 1572 1415 262 1267 0.0128 1077 2070 1878 345 1767 0.0170 1383 2455 2280 409 2201 0.0213 1620 2802 2645 467 2554 0.0255 1815 3087 2962 514 2844 0.0298 1973 3334 3230 556 3085 0.0340 2129 3561 3477 593 3316 0.0383 2270 3778 3719 630 3530 0.0425 2399 3932 3940 655 3709 0.0468 2475 4127 4124 688 3851 0.0510 2561 4287 4333 714 3990 0.0553 2642 4511 4445 752 4146 0.0595 2735 4748 4543 791 4318 0.0638 2866 4974 4765 829 4523 0.0680 3023 5172 4869 862 4747 0.0723 3162 5406 4949 901 4964 0.0765 3256 5580 5132 930 5116 0.0808 3407 5773 5261 962 5331 0.0850 3543 5975 5458 996 5534 0.0893 3679 6128 5641 1021 5722 0.0935 3813 6289 5835 1048 5909 0.0978 3941 5965 0.1020 4028 6052 0.1063 4085 6133 0.1105 4143 6280
Maximum Shear Force 5810 7650 7460 1275 8360
* Values in columns 1, 2 and 3 are for bolt, screw, and combination connections, respectively. Values in column 4 were obtained by divided values in column 2 by six. Values in column 5 were obtained by doubling column 4 values and adding the sum to the values in column 1.

Perma-Column Engineering Design Manual…………………………………………………………………….Page 55
Figure D.11. Graphically display of shear force – interlayer slip data from Table D.5. Numbers in label boxes correspond to Table D.5 column numbers.
The data in Table D.5 and plot in Figure D.11 demonstrate that the stiffness of a connection comprised of a combination of bolts and screws can be predicted using stiffness data for a single bolt plus stiffness data for a single screw.
Since being able to predict connection stiffness is fundamental to modeling connections, least-square linear regression was used to determine the initial slope of the shear-load versus interlayer slip relationship for a single bolt in double shear (column 1 of Table D.5) and for a single screw in single shear (column 4 of Table D.5). Only data points up to a slip of 0.013 inches were used in the regressions. These analyses provided the following interlayer shear stiffness values:
Interlayer Shear Stiffness Values
0.5-inch diameter SAE grade 5 bolt in double shear = 85,500 lbf/inch
0.25- by 3.0-inch Simpson Strong-Drive® wood screw in single shear = 28,700 lbf/inch
The Wood Handbook (FPL, 1999) recommends an interlayer shear stiffness in lbf/inch for bolts or lag screws in wood-to-metal connections of 270,000 D1.5 where D is the fastener diameter in inches. This equation yields 95,460 lbf/inch for a 0.5-inch diameter fastener and 33,750 lbf/inch for a 0.25 inch diameter fastener. These values are surprisingly close to those determined via regression analysis given the fact that such values are highly influenced by wood and fastener material properties, and in this study, by friction between the wood and steel brackets.
Table D.5 shows average ultimate shear strengths of 5810 lbf for the 0.5-inch diameter SAE grade 5 bolt in double shear, and 1275 lbf for the 0.25- by 3.0-inch Simpson Strong-Drive® wood screw in single shear. These values compare with calculated 10-minute (CD = 1.6) NDS allowable stress design (ASD) values of approximately 1950 lbf (1220 lbf x CD = 1.6) for the SAE grade 5 bolt and
0
1000
2000
3000
4000
5000
6000
7000
0.00 0.02 0.04 0.06 0.08 0.10 0.12Interlayer Slip, inches
Shea
r For
ce, l
bf2. Screw Connections
5. Combo Predicted
0.14
1. Bolt Connections
4. Single Screw
3. Combo Connections
0
1000
2000
3000
4000
5000
6000
7000
0.00 0.02 0.04 0.06 0.08 0.10 0.12Interlayer Slip, inches
Shea
r For
ce, l
bf2. Screw Connections
5. Combo Predicted
0.14
1. Bolt Connections
4. Single Screw
3. Combo Connections

Perma-Column Engineering Design Manual…………………………………………………………………….Page 56
approximately 450 lbf (280 lbf x CD = 1.6) for the SDS screw. The calculated NDS values are approximately 35% of the average ultimate shear strengths.
The 10-minute NDS ASD value of 450 calculated for the SDS screw is based on a shank diameter of 0.242 inches and a bending yield strength of 164,000 lbf/in2. This 10-minute value is less than the normal load duration (CD = 1.0) value of 470 lbf published by Simpson for the SDS screw when it is used to connect minimum 14 gage steel to Southern Pine or Douglas Fir. According to Mr. Aram Khachadourian of Simpson Strong-Tie Company, Inc., Simpson arrived at their higher design value by laboratory testing specimens in accordance with ASTM D1761. They then determined connection yield strengths by the 5% diameter offset method (using a root diameter of 0.185 inches), and divided this yield strength by a KD = 10D + 0.5 = 2.35 to obtain the normal load duration (i.e., 10 year) design value (in this case, the KD value includes the safety factor and adjustment for load duration). This value was lower than the alternative method of dividing the mean ultimate load by a factor of safety of 2.0 and a load duration factor of 1.6. Using the same 0.185 inch diameter as Simpson produces a 5% diameter offset value of 545 lbf (Figure D.12) and a corresponding normal load duration value of 230 lbf for the SDS screw fasteners in this study. This value is less than half of that reported by Simpson. Note that dividing the mean ultimate load of 1275 lbf by a safety factor of 2.0 and load duration factor of 1.6 produces a normal load duration design value of 400 lbf which is much closer to Simpson’s design value of 470 lbf.
Figure D.12. Determination of the 5% diameter offset values for an SDS screw.
D.6 References
Forest Products Laboratory. 1999. Wood handbook--Wood as an engineering material. Gen. Tech. Rep. FPL-GTR-113. Madison, WI: U.S. Department of Agriculture, Forest Service, Forest Products Laboratory. 463 p.
0
100
200
300
400
500
600
700
800
0.00 0.01 0.02 0.03 0.04
Interlayer Slip, inches
Shea
r For
ce, l
bf
590 lbf545 lbf
5% Diameter Offset for Diameter = 0.185 inches
5% Diameter Offset for Diameter = 0.242 inches
0
100
200
300
400
500
600
700
800
0.00 0.01 0.02 0.03 0.04
Interlayer Slip, inches
Shea
r For
ce, l
bf
590 lbf545 lbf
5% Diameter Offset for Diameter = 0.185 inches
5% Diameter Offset for Diameter = 0.242 inches