marui groupco., ltd...accounts receivable and others -¥0.5 billion provision for loss on interes...
TRANSCRIPT
F i n a n c i a l R e s u l t s B r i e f i n g f o r t h eF i s c a l Ye a r E n d e d M a r c h 3 1 , 2 0 2 0a n d F u t u r e O u t l o o k
M a y 2 8 , 2 0 2 0
M A R U I G R O U P CO . , LT D

Today’s Agenda
1
2
3
Overview of Performance for the Fiscal YearEnded March 31, 2020
H i rotsugu K atoD i recto r, Managi ng Execu t ive Of f i cer, Ch i ef Fi nanci al Of f i cer,General Manager, Investo r Rel at ions D epart m ent , MA R UI GR OUP CO. , LTD
Dealing with the COVID-19 Crisis
Hi ro shi A oiPresi dent and Representative D i rector,MA R UI GR OUP CO., LTD .
Future Developments
H i ro shi A oiPresi dent and Representative D i rector,MA R UI GR OUP CO., LTD .

1Over view of Performance for the Fiscal Year Ended March 31, 2020
H i r o t s u g u K a t oD i r e c t o r, M a n a g i n g E x e c u t i v e O f f i c e r, C h i e f F i n a n c i a l O f f i c e r,G e n e ra l M a n a g e r, I n v e s t o r R e l a t i o n s D e p a r t m e n t , M A R U I G R O U P C O . , LT D

4
H i g h l i g h ts i n t h e F i s ca l Yea r E n d e d M a rc h 3 1 , 2 0 2 0
1. Important KPIs of medium-term-management-plan, which is
EPS, ROE and ROIC, unachieved the targets due to the COVID-19
2. Consolidated operating income increased 2% year on year
to ¥41.9 billion for 11th consecutive year
The negative impact of the COVID-19 was ¥1.3billion
3. Retailing segment operating income decreased 12% year on year
FinTech segment operating income increased 10% year on year
4. Annual dividends increase ¥1 to ¥50 for 8th consecutive year

5
C o n s o l i d ate d Pe r fo r m a n ce
・The 3 KPIs unachieved the targets. ROE exceeded Capital costs and ROIC exceeded WACC

6
Operating income ROIC
FY2019 FY2020 FY2020Y O Yc h a n g e
Y O Yd i f f e r e n c e
V S .target
YOYchange
B i l l i o n so f y e n
B i l l i o n s o f y e n % B i l l i o n s
o f y e nB i l l i o n s
o f y e n %
Retailing 11.4 10.0 88 -1.4 -1.5 3.4 -0.4
FinTech 35.0 38.4 110 +3.4 -0.6 4.6 +0.4
Eliminations/Corporate -5.3 -6.5 - -1.2 0 - -
Consolidated 41.2 41.9 102 +0.8 -2.1 3.7 +0.0
S eg m e n t I n co m e
・Retailing segment operating income decreased 12% for the first decrease in the three fiscal yearsdue to the COVID-19 negative impact of ¥1.5 billionFinTech segment operating income increased for 8th consecutive year
7
FinTech+¥0.2 billion
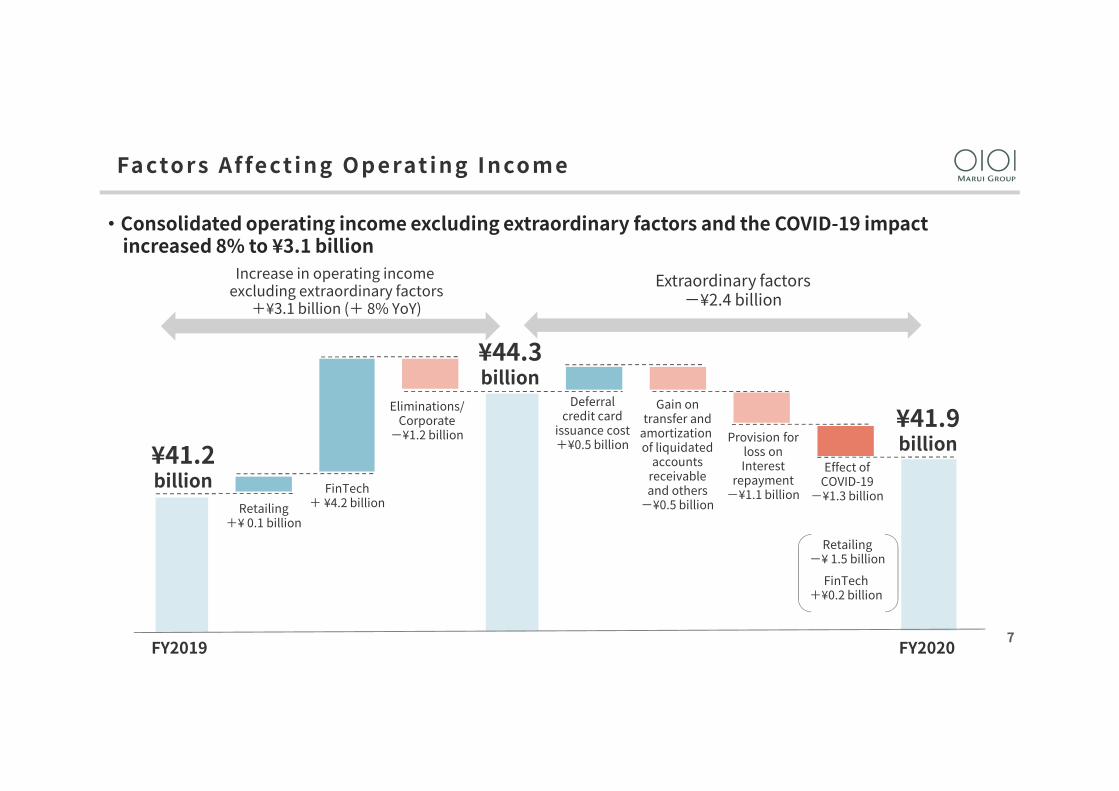
Fa cto rs Af fe ct i n g O p e rat i n g I n co m e
FY2019 FY2020
¥41.2billion
¥44.3billion
¥41.9billion
Retailing+¥ 0.1 billion
FinTech+ ¥4.2 billion
Eliminations/Corporate
-¥1.2 billion
Gain ontransfer and
amortization of liquidated
accountsreceivableand others
-¥0.5 billion
Provision forloss onInterest
repayment-¥1.1 billion
Retailing-¥ 1.5 billion
Effect ofCOVID-19
-¥1.3 billion
Deferralcredit card
issuance cost+¥0.5 billion
Increase in operating income excluding extraordinary factors
+¥3.1 billion (+ 8% YoY)
Extraordinary factors-¥2.4 billion
・Consolidated operating income excluding extraordinary factors and the COVID-19 impactincreased 8% to ¥3.1 billion

8FY2019 FY2020
Fa cto rs Af fe ct i n g Reta i l i n g S eg m e n t I n co m e
¥11.4billion
¥10.0billion
Consignmentsales floorsand others
- ¥0.1 billion
Incomeimprovements
from transition to fixed-term rental
contractsand others
+¥ 1.4 billion
E-Commerce-¥0.9 billion Platform
-¥0.3 billion
Effect ofCOVID-19
-¥1.5 billion
・Income improvements from transition to fixed-term rental contracts contributed, butRetailing segment income decreased ¥1.4 billion due to poor performance of consignment sales floors and EC, and the COVID-19 impact
9
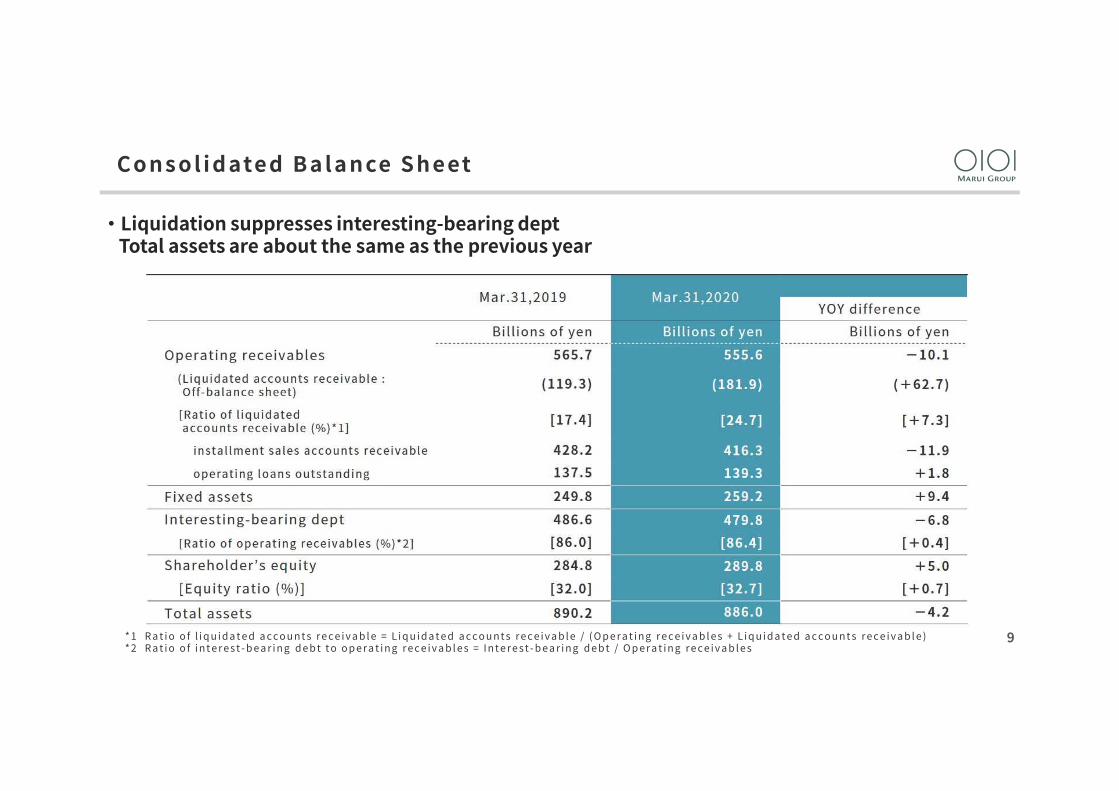
C o n s o l i d ate d B a l a n ce S h e et
* 1 R a t i o o f l i q u i d a t e d a c c o u n t s r e c e i v a b l e = L i q u i d a t e d a c c o u n t s r e c e i v a b l e / ( O p e r a t i n g r e c e i v a b l e s + L i q u i d a t e d a c c o u n t s r e c e i v a b l e )* 2 R a t i o o f i n t e r e s t - b e a r i n g d e b t t o o p e r a t i n g r e c e i v a b l e s = I n t e r e s t - b e a r i n g d e b t / O p e r a t i n g r e c e i v a b l e s
・Liquidation suppresses interesting-bearing dept Total assets are about the same as the previous year
10
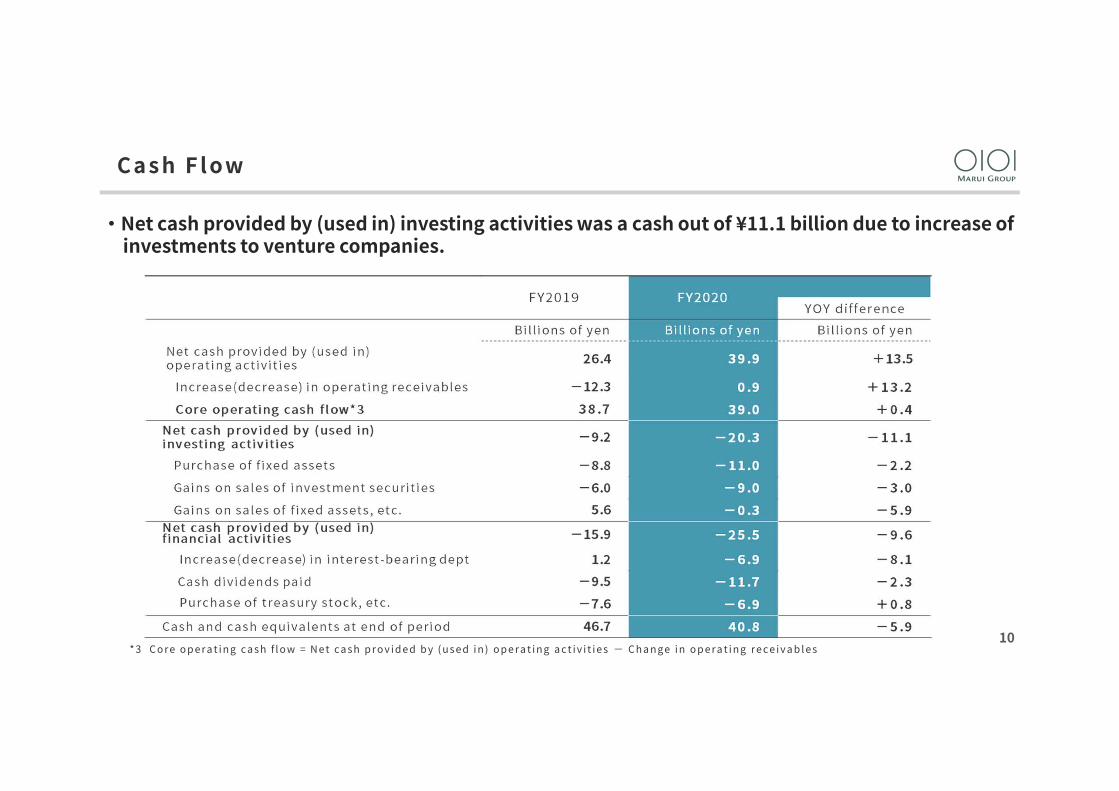
C a s h F l ow
* 3 C o r e o p e r a t i n g c a s h f l o w = N e t c a s h p r o v i d e d b y ( u s e d i n ) o p e r a t i n g a c t i v i t i e s - C h a n g e i n o p e r a t i n g r e c e i v a b l e s
・Net cash provided by (used in) investing activities was a cash out of ¥11.1 billion due to increase of investments to venture companies.

11
Recurring Gross Profit Contracted FutureRecurring Gross Profit
FY2019 FY2020 FromFY2021YOY
ch angeYOY
d iffe re nceVS. Re cu rring
gross p rofi t
Bi l l ions of ye n
Bi l l ions of ye n % Bil l ions
of ye nBi l l ions
of ye n %
Retailing 41.1 42.6 104 +1.5 81.4 191
FinTech 81.5 88.5 109 +6.9 268.7 304
Total 122.7 131.1 107 +8.4 350.0 267
Composition withingross profit(%) 62.9 65.3 - +2.4
L i fet i m e Va l u e M a n a ge m e n t I n d i cato r
・Recurring gross profit increased 7% to ¥131.1 billionThe ratio of recurring gross profit to consolidated gross profit increased to 65%

12
0
20
40
60
FY13 FY14 FY15 FY16 FY17 FY18 FY19 FY20 FY21 FY22 FY23 FY24
31%
41% 41% 42% 43%
Consolidated payout ratio
・Dividends increase¥1 to ¥50 for 8th consecutive year (Forecast was ¥57), marking record high for 4th consecutive year
3 33 8
4 9
(yen)
2 21 9
p l a n t o i n c r e a s e
d i v i d e n d s
¥15.0 billion Share buybacks
EPS ¥58.9 ¥70.7 ¥80.2 ¥93.2 ¥116.0 ¥117.6
about 55%
Total return ratio 125.3% 227.5% 147.5% 112.3% 69.9% 70.1%
■Dividends per Share
¥35.0 billion ¥20.7 billion ¥15.0 billion ¥0.7 billion ¥0.7 billion
¥51( F o r e c a s t )¥50
S h a re h o l d e r Ret u r n s

2Dealing with the COVID-19 Crisis
H i r o s h i A o iP r e s i d e n t a n d R e p r e s e n t a t i v e D i r e c t o r, M A R U I G R O U P C O . , LT D .

14
Request by the Government ResponseRetailing
transaction volume
YoY change
EPOS Card transactionsYoY change
March 27th Request for leaveby the Government
5th All Marui and Modi stores started short-time operations
28th Some stores closed on weekends65% 102%
April 7th Emergency Declaration18th All stores temporarily closed
(Only food floors in 8 stores opened for shorthours)
27% 82%
May 14th~ Partial cancellation 14th~ Some stores reopened ― ―
June 1st All stores reopened ― ―
・Fi nTe ch s e gme nt pe rformance was l owe r than pl anne d pe rformance i n Apri l
As a re s ul t , more cas h funds re mai ne d at hand
*provisional value
■Status of Store Operations
■Cash Flow Status
O v e r v i ew
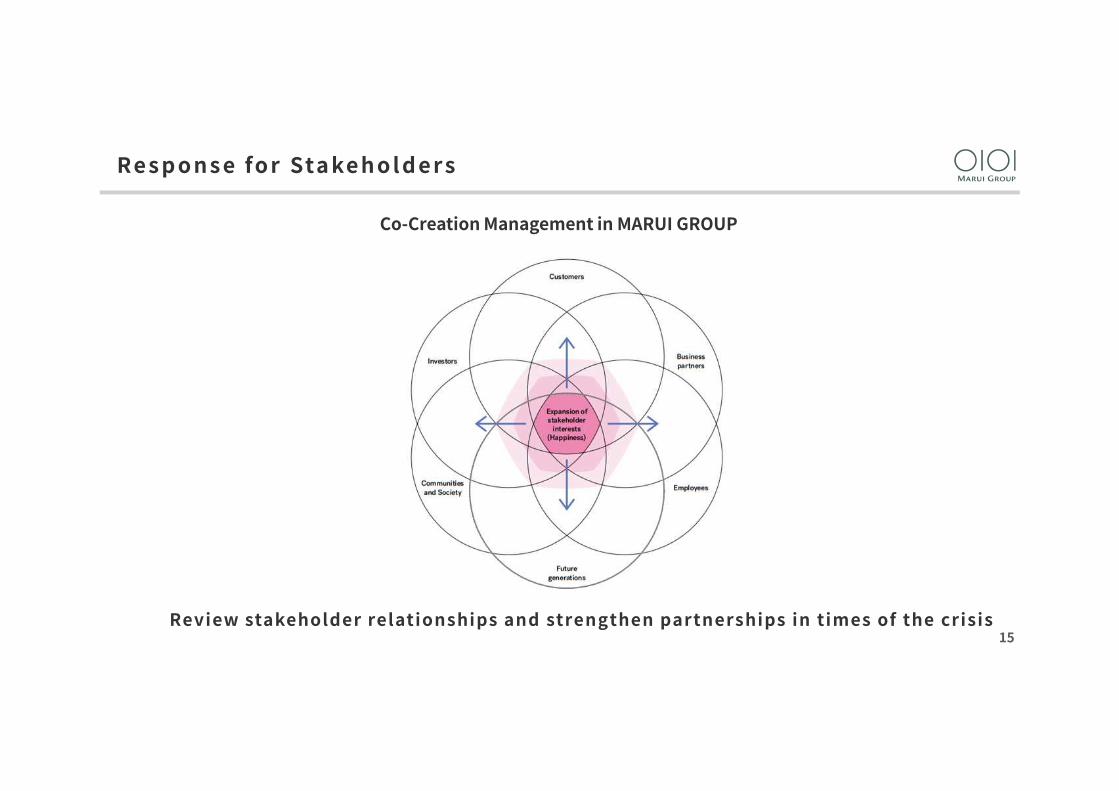
15Review stakeholder relationships and strengthen partnerships in times of the crisis
Co-Creation Management in MARUI GROUP
Re s p o n s e fo r Sta ke h o l d e rs

16
10
20
30
19.4 19.5 19.6 19.7 19.8 19.9 19.1 19.11 19.12 20.1 20.2 20.3 20.4
・Inquiries about credit card payment temporarily increased in April but decreased in May
・No serious change in payment status
・Guide to customer “Housing security benefits” of the Government for Inquiries about credit cardpayment for rent
・Demand for funds decreased due to refraining from going out
101% 103%98%
77%
53%
40%
50%
60%
70%
80%
90%
100%
110%
1月 20.2 20.3 20.4 20.5
Payment Status Usage status
■Year-on-Year change in Cash Advances
Average 247000
24.7 24.5
19.3 20.1(Until the 20th)
■Number of customers not eligible for direct debit
(ten thousand)
20.3
(%)
100
50
20.4
Re s p o n s e fo r Sta ke h o l d e rs : Cu sto m e rs

17
27%
40%
66%
カテゴリ 1 カテゴリ 3Results for April,2020
Results for March, 2020
Targets for FY21
Store staff Head office staffApprox. 1,900
Logistics department and call center Approx. 1,200
Approx. 2,200
20
40
・Special leaves after temporary suspension of businessin principle.The salary is fully compensated
(Application for “Employment adjustment subsidy”)
・In the essential departments for business continuity, creating a safe work environment thorough center decentralization and prevention of droplet infection, etc.
・2200 mobile PCs already deployed by March
・Telework become familiar rapidly afterthe emergency situationNew ways of working promoted withprevention of infection
■Telework rate
Re s p o n s e fo r Sta ke h o l d e rs : E m p l oye e s

18
Strengthening partnerships to overcome the COVID-19
(1) Full exemption of all rent and common service fees for our business partnersduring suspension of business.
(2) Elimination of minimum guaranteed sales of consignment sales contract business partners for 6months
(3) Return of 1 month or 2 months security deposit to rent upon request*Applicable to business partners who deposit for more than 6 months
(4) 6months grace for payment of May-July upon request
< Contents>
Announced April 24, expected to cost approximately ¥5.0 billion by end of May
Re s p o n s e fo r Sta ke h o l d e rs : B u s i n e s s Pa r t n e rs
19
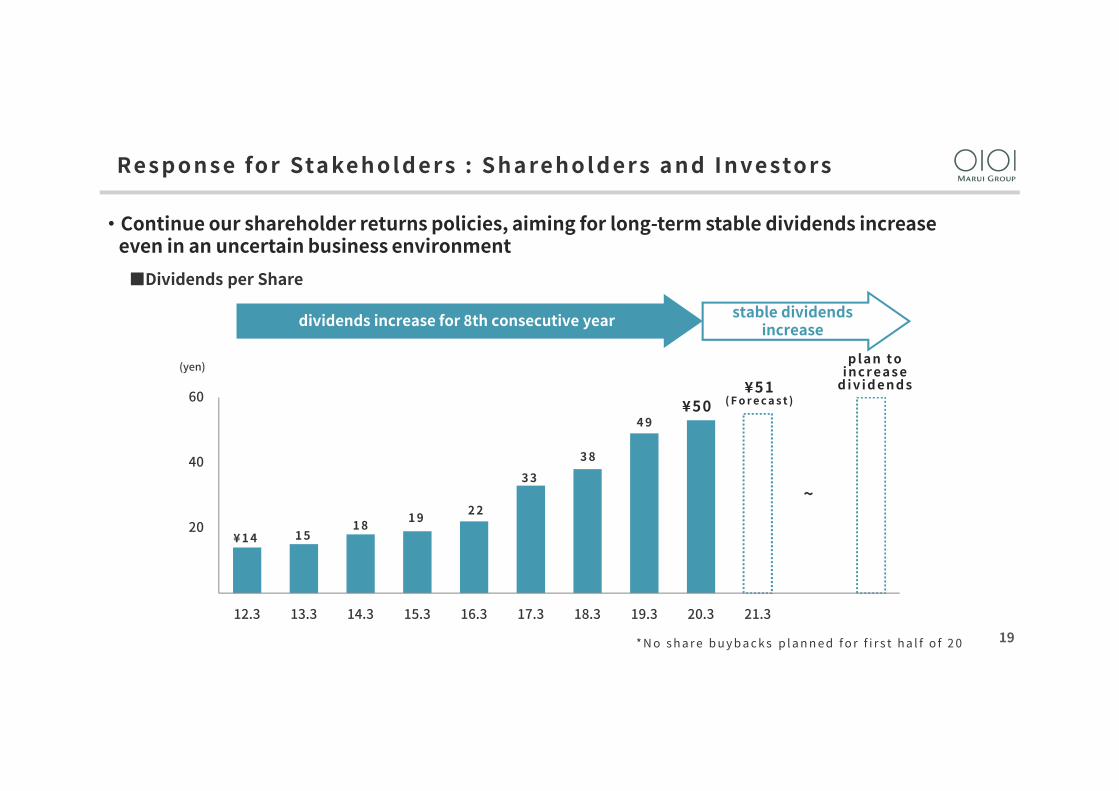
・Continue our shareholder returns policies, aiming for long-term stable dividends increaseeven in an uncertain business environment
0
20
40
60
12.3 13.3 14.3 15.3 16.3 17.3 18.3 19.3 20.3 21.3
3 3
3 8
4 9
(yen)
2 21 9
dividends increase for 8th consecutive year
1 81 5¥ 1 4
stable dividendsincrease
~
* N o s h a r e b u y b a c k s p l a n n e d f o r f i r s t h a l f o f 2 0
■Dividends per Share
p l a n t o i n c r e a s e
d i v i d e n d s¥51( F o r e c a s t )¥50
Re s p o n s e fo r Sta ke h o l d e rs : S h a re h o l d e rs a n d I n v e sto rs

20
Segment Operatingincome Main factorsOperating
revenue SG & A expenses
Retailing -¥1.5 billion -¥2.2 billion -¥0.7 billion・Store closure・Cancellation of sale for cardholders
FinTech +¥0.2 billion -¥0.7 billion -¥0.9 billion・Decreased usage in Marui and
members stores・Decrease in new card issuance
Impact of the COVID-19 in FY2020
・Retailing segment operating income decreased ¥1.5 billion.FinTech segment operating income increased ¥0.2 billion due to SG & A expenses decrease.
■Impact on Operating Income

21
Card shopping transaction Affiliate commissions Point cost (70%)
Revolving and installment payments receivable Financial charges
Recruiting new members
Card issuance costs(advance investment)
*Time lag in the effect
①
②
③
・Due to our unique profit structure, the profit impact of a decrease in transaction is limited.
P rof i t st r u ct u re of F i nTe c h S eg m e n t
22
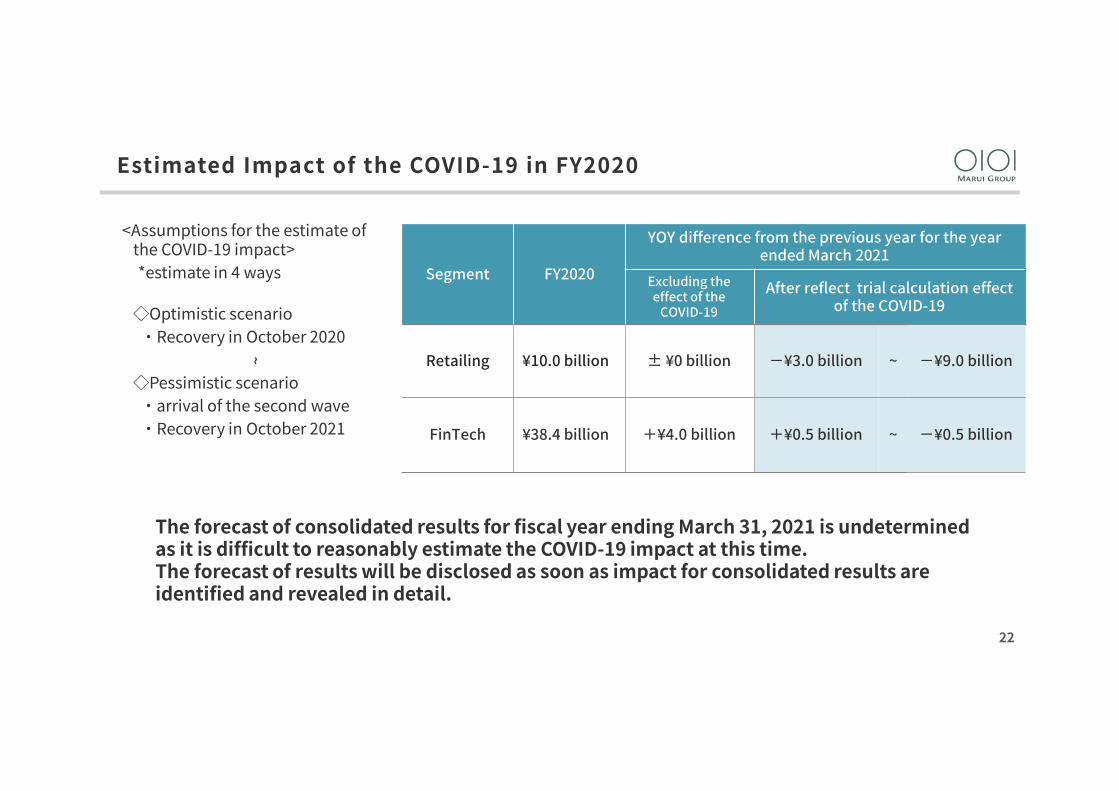
Estimated Impact of the COVID-19 in FY2020
The forecast of consolidated results for fiscal year ending March 31, 2021 is undetermined as it is difficult to reasonably estimate the COVID-19 impact at this time. The forecast of results will be disclosed as soon as impact for consolidated results are identified and revealed in detail.
~
Segment FY2020
YOY difference from the previous year for the year ended March 2021
Excluding the effect of the
COVID-19
After reflect trial calculation effect of the COVID-19
Retailing ¥10.0 billion ± ¥0 billion -¥3.0 billion ~ -¥9.0 billion
FinTech ¥38.4 billion +¥4.0 billion +¥0.5 billion ~ -¥0.5 billion
<Assumptions for the estimate of the COVID-19 impact>*estimate in 4 ways
◇Optimistic scenario・Recovery in October 2020
◇Pessimistic scenario・arrival of the second wave・Recovery in October 2021
Progress of Medium-Term Management Plan

24
EPS Target130.0 yen
3.1 3.3 3.7 3.7%
6.77.6
9.1 8.8%
80.293.2
116.0 ¥117.6
0
50
100
150
FY17 FY18 FY19 FY20 FY21
・It was smooth until the COVID-19 crisis, but it is expected to be difficult to achieve key KPI targetsin the fiscal year ending March 21, the final year of the medium-term management plan.
ROE target10%
ROIC target4%
(yen)
Progress of KPIs

25
Apr. 2016 Apr. 2021
Current medium-term management plan
Next medium-term management plan
・The current medium-term management plan will end as scheduled in the fiscal year ending March,2021.
・The next medium-term management plan will be launched in the fiscal year ending March,2022.
・ Key KPIs Targets are aimed to achieve early in the next medium-term management plan.
P o s t p o n e m e n t o f k e y K P I s a c h i e v e m e n t
Outlook for the Future
3Future Developments
H i r o s h i A o iP r e s i d e n t a n d R e p r e s e n t a t i v e D i r e c t o r, M A R U I G R O U P C O . , LT D .
ー I n co r p o ra t i n g s h a r e h o l d e r s a n d i n v e sto r s f e e d ba c k ー
27
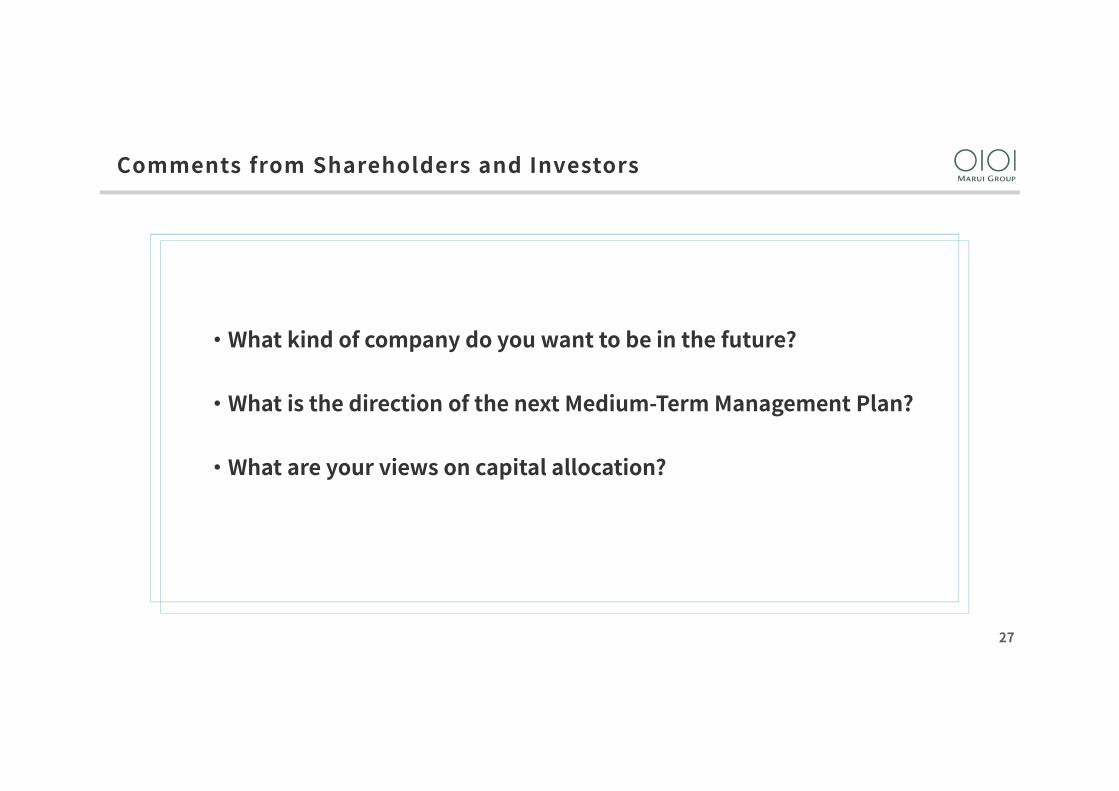
・What kind of company do you want to be in the future?
・What is the direction of the next Medium-Term Management Plan?
・What are your views on capital allocation?
Comments from Shareholders and Investors

28
USA United Kingdom
*Cited by “CAPTALISM WITHOUT CAPITAL The Rise of the Intangible Economy” by Jonathan Haskel / Stian Westlake/ translated by Hiroki Yamagata/ Toyo Keizai Inc.
■Percentage of Output
Tangible asset
Tangible asset
Intangible asset Intangible asset
Long-Term Shift from Tangible to Intangible Investments

29
0.5
1.2
1.6
0.4
系列 1 系列 2
(double)
Five years from 1995 10 years from 2001
USA
United Kingdom
1.0
Japan
Italy
*Created by our company from “The Role of Intangible Investment on Economic Growth in Japan“,Tsutomu MIYAGAWA et al. (2015) RIETI Policy Discussion Papers
■Intangible Investment Ratio (Intangible and Tangible Investments)
Long-Term Shift from Tangible to Intangible Investments
30
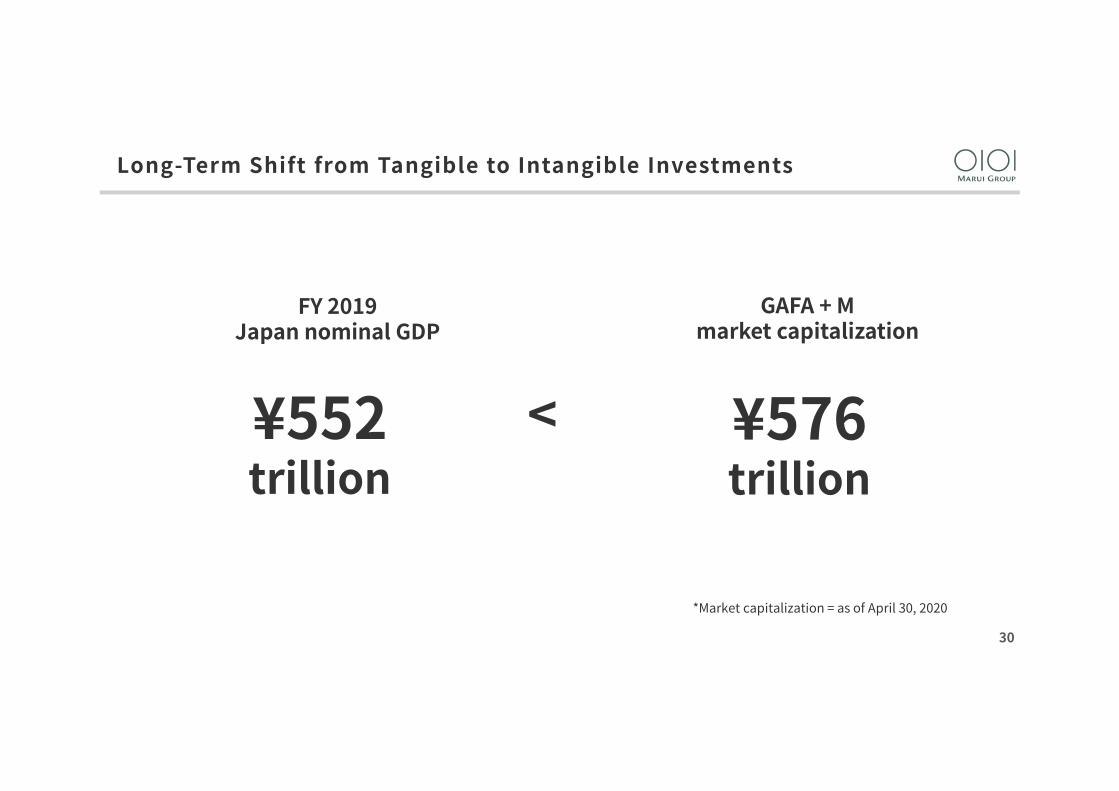
*Market capitalization = as of April 30, 2020
<
GAFA + Mmarket capitalization
¥576 trillion
FY 2019Japan nominal GDP
¥552 trillion
Long-Term Shift from Tangible to Intangible Investments
31
1,000
2,000
3,000
4,000
5,000
6,000
7,00092
.1
93.1
94.1
95.1
96.1
97.1
98.1
99.1
00.1
01.1
02.1
03.1
04.3
05.3
06.3
07.3
08.3
09.3
10.3
11.3
12.3
13.3
14.3
15.3
16.3
17.3
18.3
19.3
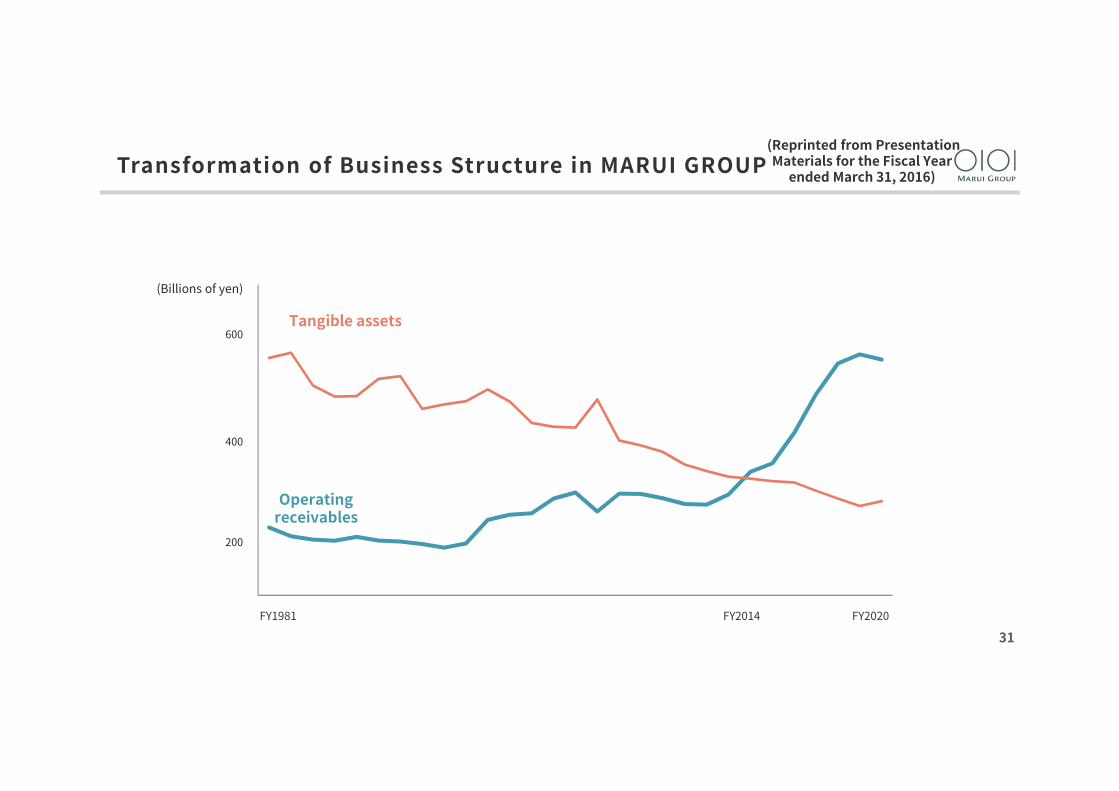
20.3FY1981 FY2020FY2014
Tangible assets
Operating receivables
(Billions of yen)
(Reprinted from Presentation Materials for the Fiscal Year
ended March 31, 2016)
400
600
200
Transformation of Business Structure in MARUI GROUP
32
0
50
100
150
200
250
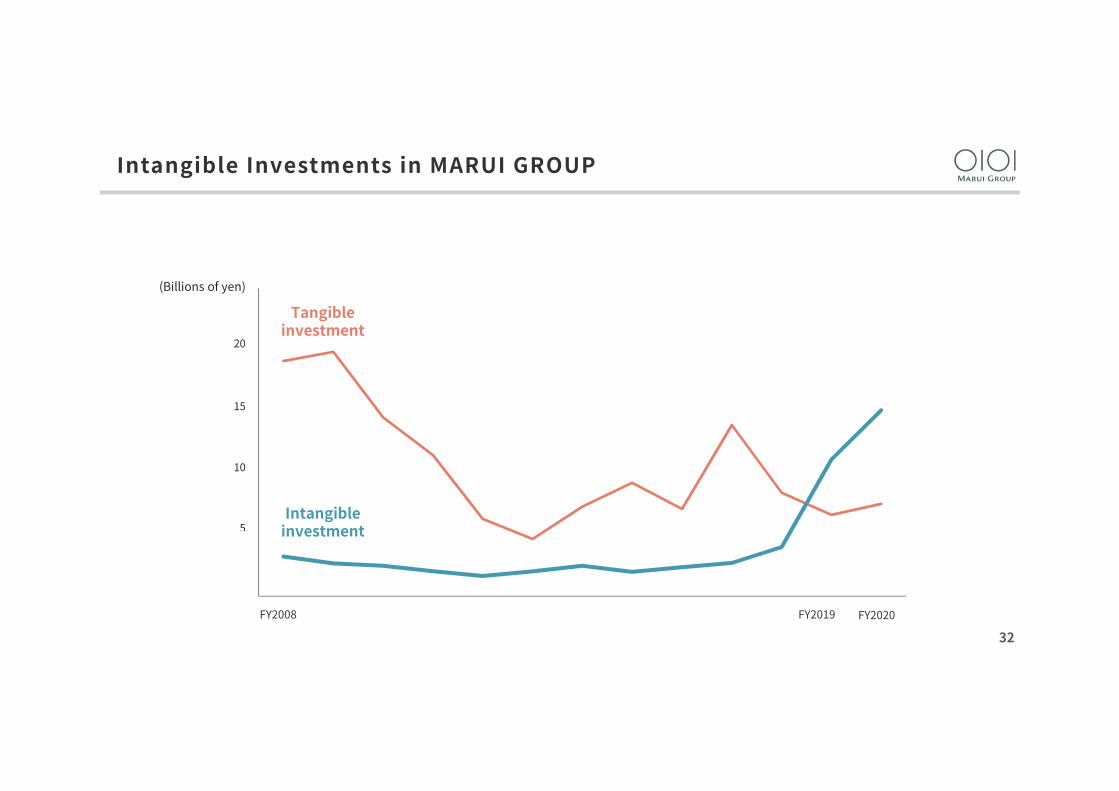
FY2019FY2008 FY2020
Tangible investment
Intangible investment
(Billions of yen)
20
15
10
5
Intangible Investments in MARUI GROUP

33
New businesses
Human resources and research and development
Store investment
Software
92 75
17 32
3 32
88
15.3 20.3
Tangible investment
0.8 x
Intangible investment
7.6 x
0.2 x
Intangible investment ratio( I n t a n g i b l e i n v e s t m e n t s / T a n g i b l e i n v e s t m e n t s )
2.0 x
FY2015 FY2020
Breakdown of Investment Destinations

34
Yearly
230 cases(1 launch every 2 days)
cost40%
Reduction
ROI310%
Investment ¥3.2 billionReturn¥10 billion
In-house software development
Status of Software Investment
35
0.0%0
10
20
30
40
50
15.3 16.3 17.3 18.3 19.3 20.3
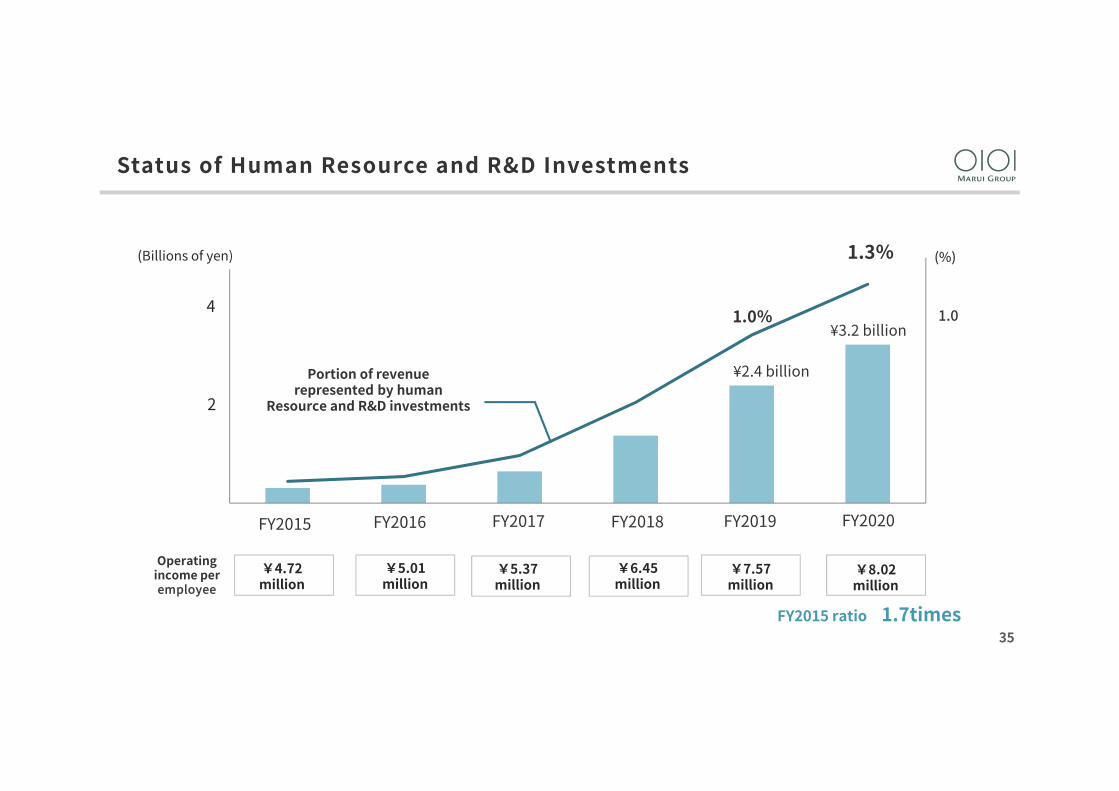
¥2.4 billion
32億円
Operating income peremployee
¥8.02 million
Portion of revenuerepresented by human
Resource and R&D investments
1.3%
1.0% 1.0
(Billions of yen) (%)
FY2015 ratio 1.7times
FY2015 FY2016 FY2017 FY2018 FY2019 FY2020
¥3.2 billion4
2
¥7.57million
¥6.45million
¥5.37million
¥5.01million
¥4.72million
Status of Human Resource and R&D Investments

36
*Comparison of stock prices at the time of investment and the latest funding
Over 1.1 times
1 x ~
Less than 1 times
■ Status of 20 investee companies■ Status of FY2020
IRR 34%
Venture companies ¥7.1 billion
Fund ¥5.1 billion
Total. ¥15.7 billion*IRR: Calculated using latest procurement price or listed stock priceassumed to be sold at the end of each company’s fiscal year.
7.5 x
September 20, 2019
October 25, 2019
4.5 x
IPO
IPO
tsumiki Securities ¥1.9 billion
D2C & Co. ¥1.6 billion
14 companies
4 companies
(As of May 21, 2020)
Status of New Business Investments

37
Retailing - driven Credit (FinTech) -driven Retailing× FinTech ×Co-Creation investment
From 2019From 2006From in 1931 (Establishment)
Labor-intensive type Capital-intensive type Knowledge creation type
Fixed Assets
Tangible investment
Financial Assets
(Stock buyback)
Intangible assets
Intangible investment
Business model
Assets
Investment
Direction to be Addressed in the Future

38
Create a new business model based on the Trinity combining Retailing and FinTech with "Co-Creation Investment Business"
Creation of New Business Model

39
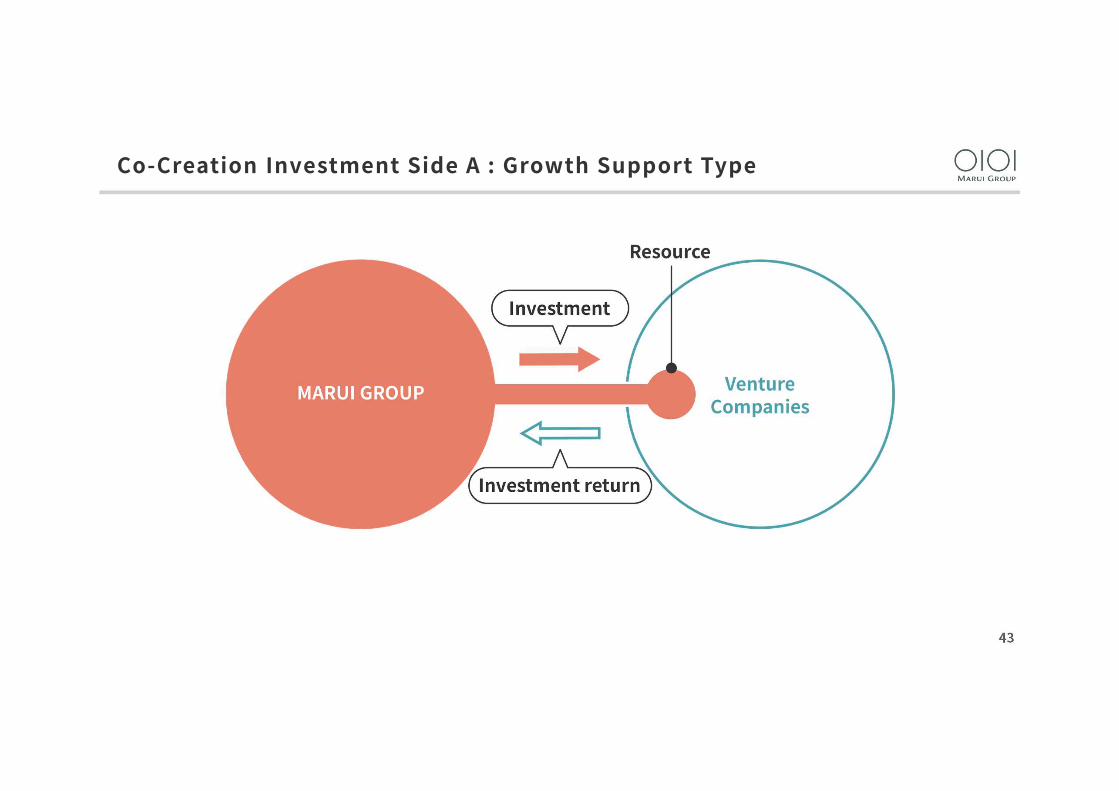
Co-Creation Investment Side A : Growth Support Type

40
Co-Creation Investment Side A : Growth Support Type

41
Co-Creation Investment Side A : Growth Support Type

42
Co-Creation Investment Side A : Growth Support Type
43
Co-Creation Investment Side A : Growth Support Type

44
Co-Creation Investment Side A : Growth Support Type
45
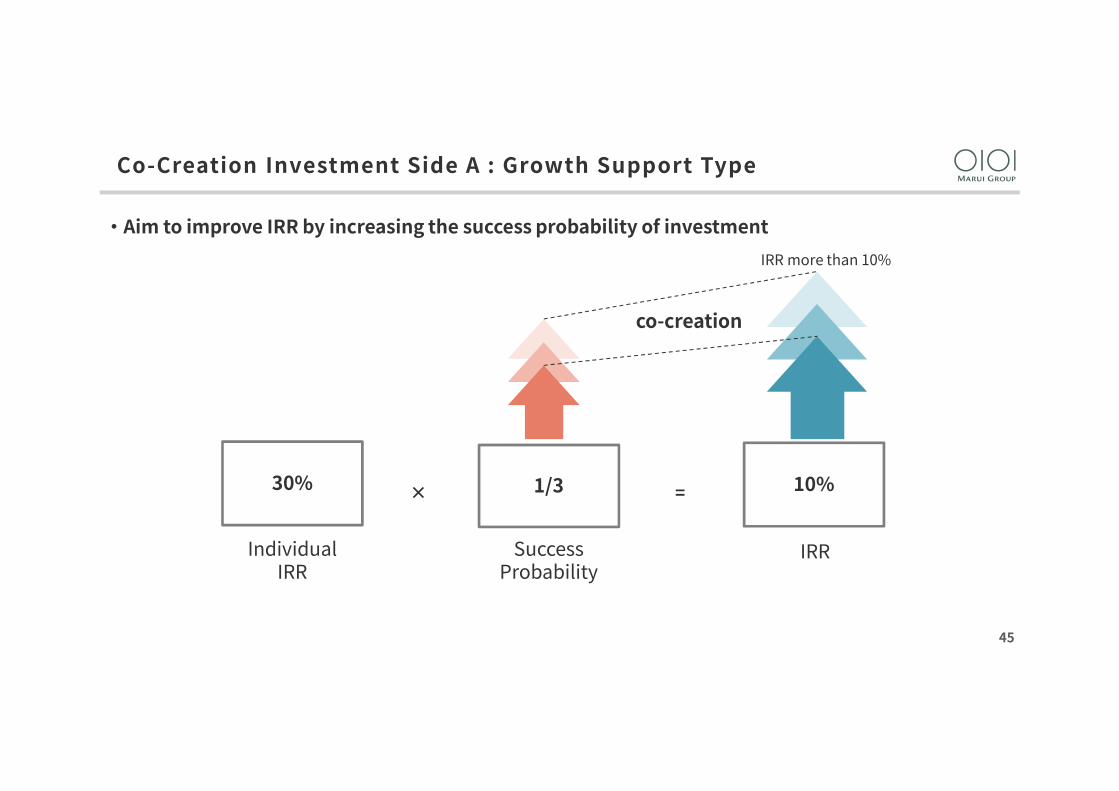
Individual IRR
SuccessProbability
30% × =1/3 10%
IRR
・Aim to improve IRR by increasing the success probability of investment
co-creation
IRR more than 10%
Co-Creation Investment Side A : Growth Support Type
46
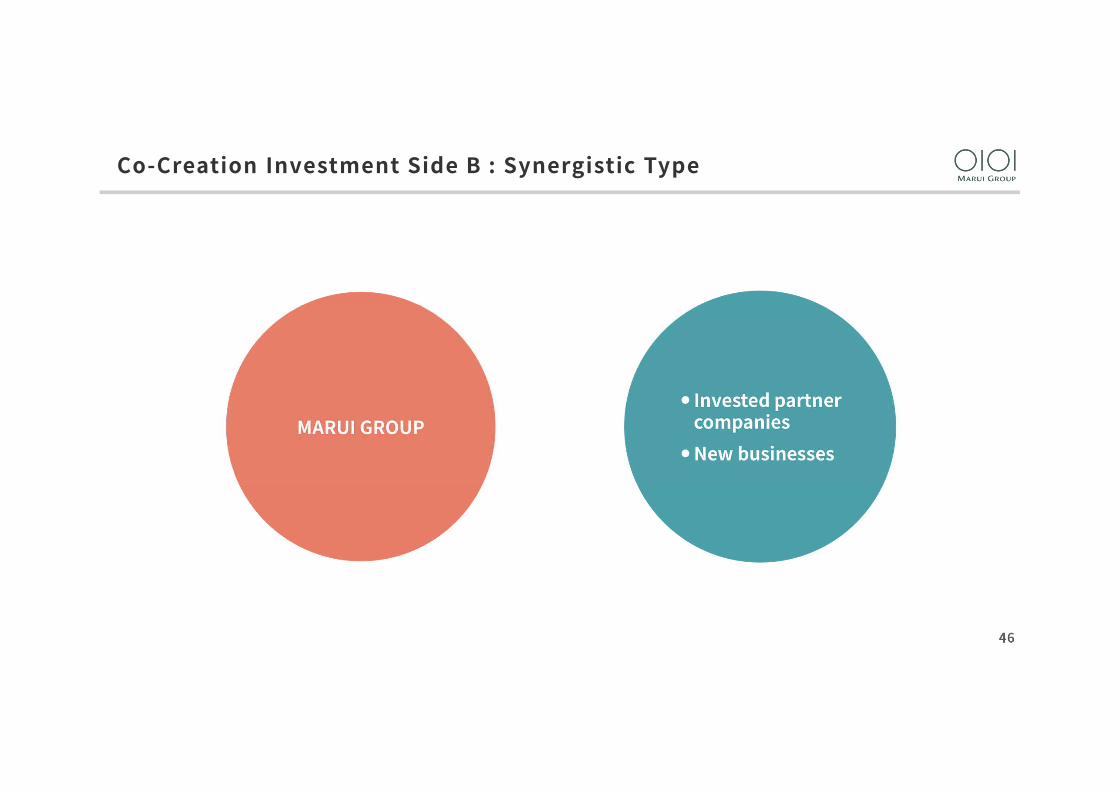
Co-Creation Investment Side B : Synergistic Type

47
Co-Creation Investment Side B : Synergistic Type

48
Co-Creation Investment Side B : Synergistic Type

49
Co-Creation Investment Side B : Synergistic Type

50
Co-Creation Investment Side B : Synergistic Type

5116.3 17.3 18.3 19.3 20.3FY2017 FY2019 FY2020
CumulativeInvestment Amount
TotalContribution Amount
¥0.12 billion
¥4.3 billion
FY2016 FY2018
■Animation Business■Other cases
Ventures and listed companies not to be targets of IPO
(from now on)
Co-Creation Investment Side B : Synergistic Type

52
New businesses¥30 billion
Existing business¥60 billion
Dividends¥50 billion
Purchase of treasury stock¥60 billion
Co-creation investment
Existing business
Dividends
Purchase of treasury stock
ROE > cost of capitalROIC > WACC IRR > ROE
ROE > 10% or more
Current medium-term management plan from April 2016 The next medium-term plan period starts in April 2021
Future Direction of Investment (Image)
53
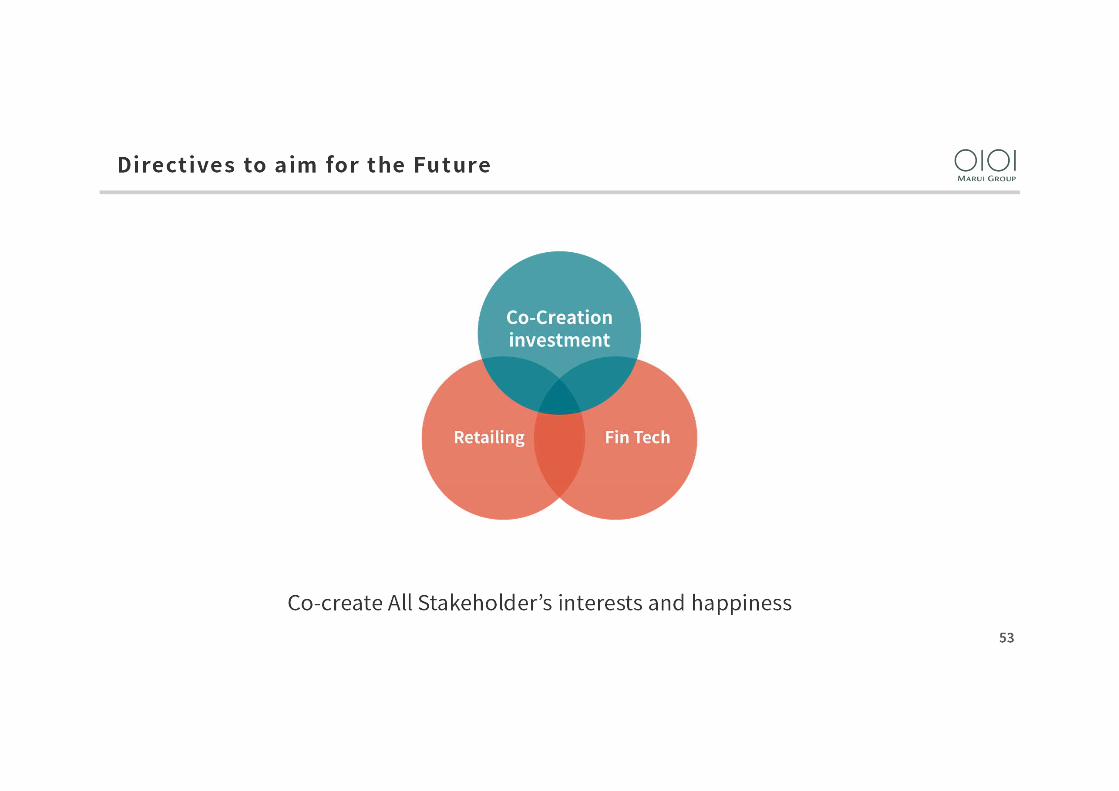
Co-create All Stakeholder’s interests and happiness
Directives to aim for the Future

The forward-looking statements contained in this document are based on information currently available to our company and are reasonable.Actual results may differ materially depending on various factors.If you have any questions, please contact the IR Department at 03-5343-0075.