maryland department of health hiv in the baltimore ......hiv incidence and prevalence by age group...
TRANSCRIPT
HIV in the Baltimore-Columbia-
Towson MSA
Colin Flynn, ScM
Prevention and Health Promotion Administration
Center for HIV Surveillance, Epidemiology and Evaluation
April 16, 2019
MARYLAND DEPARTMENT OF HEALTH

2
MISSION AND VISIONPrevention and Health Promotion Administration
MISSION
The mission of the Prevention and Health Promotion Administration is to protect, promote and improve
the health and well-being of all Marylanders and their families through provision of public health
leadership and through community-based public health efforts in partnership with local health
departments, providers, community based organizations, and public and private sector agencies, giving
special attention to at-risk and vulnerable populations.
VISION
The Prevention and Health Promotion Administration envisions a future in which all Marylanders and
their families enjoy optimal health and well-being.

3
HIV Diagnosis Trends
Percent of new
Maryland cases in
Baltimore City
decreased from
38% to 22%

4
HIV Diagnosis Trends by MSA
More cases now
come from the
Washington
suburbs than from
the Baltimore
metropolitan area
5
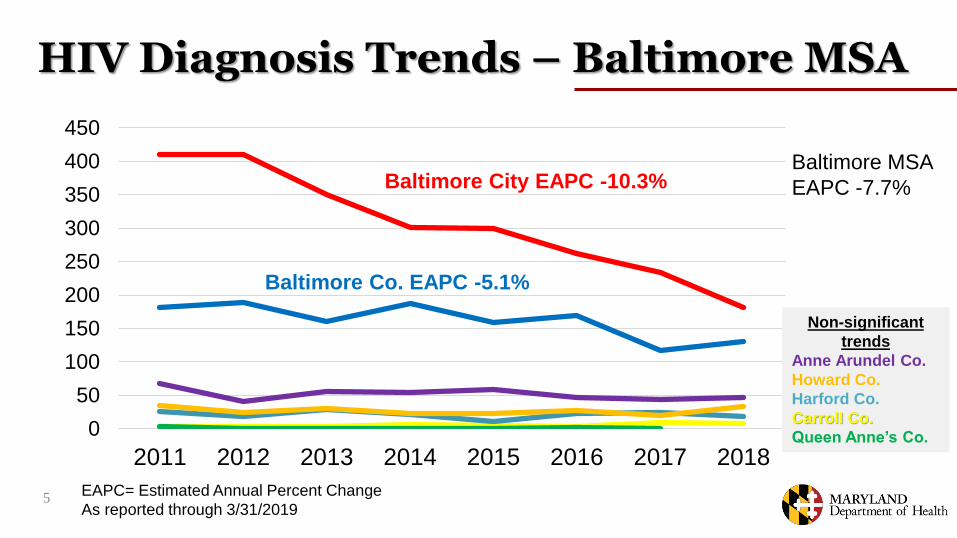
HIV Diagnosis Trends – Baltimore MSA
0
50
100
150
200
250
300
350
400
450
2011 2012 2013 2014 2015 2016 2017 2018
EAPC= Estimated Annual Percent Change
As reported through 3/31/2019
Baltimore City EAPC -10.3%
Baltimore Co. EAPC -5.1%
Non-significant
trends
Anne Arundel Co.
Howard Co.
Harford Co.
Carroll Co.
Queen Anne’s Co.
Baltimore MSA
EAPC -7.7%

6
Living HIV Diagnoses, Year-end 2016 – Ranked by Rates
Rank Metropolitan Area Reported Cases Rate per 100,000
1 Miami-Fort Lauderdale-West Palm Beach, FL 53,269 872.2
2 New York-Newark-Jersey City, NY-NJ-PA 138,830 684.7
3 Baton Rouge, LA 5,097 610.0
4 Baltimore-Columbia-Towson, MD 17,013 607.4
5 New Orleans-Metairie, LA 7,679 604.1
6 Atlanta-Sandy Springs-Roswell, GA 32,043 552.9
7 Memphis, TN-MS-AR 6,926 514.9
8 Jackson, MS 2,911 502.3
9 San Francisco-Oakland-Hayward, CA 23,031 490.1
10 Columbia, SC 3,923 479.9
18 Philadelphia-Camden-Wilmington, PA-NJ-DE-MD 23,920 393.6
30 Washington-Arlington-Alexandria, DC-VA-MD-WV 20,038 325.8
United States* 1,008,264 308.5
CDC. HIV Surveillance Report, 2017. Vol. 29. Table 30
* 50 states, DC & PR

7
Continuum of Care, Baltimore MSA, 2017
Using data as reported through 6/30/2018

8
Sex at Birth Trends, Baltimore MSA
Using data as reported through 6/30/2018
9
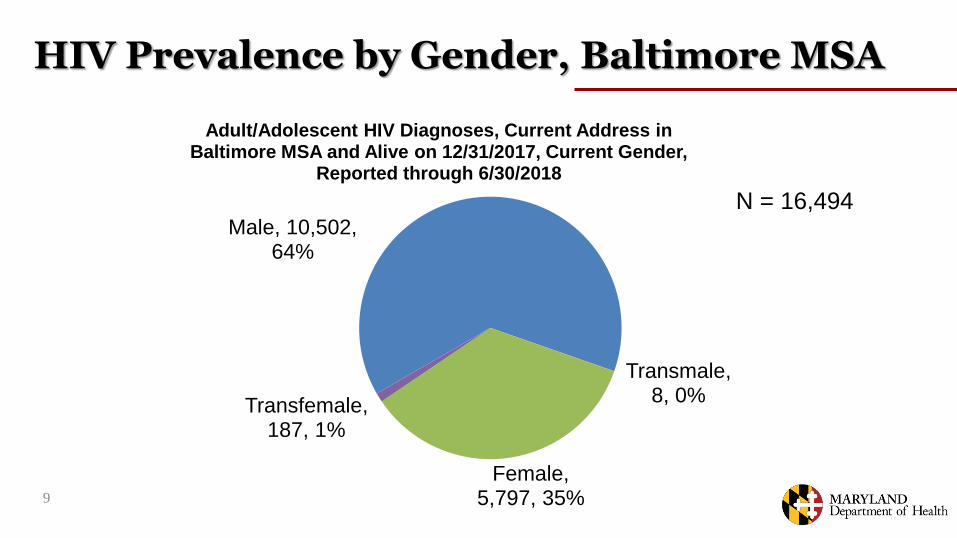
HIV Prevalence by Gender, Baltimore MSA
Male, 10,502, 64%
Transmale, 8, 0%
Female, 5,797, 35%
Transfemale, 187, 1%
Adult/Adolescent HIV Diagnoses, Current Address in Baltimore MSA and Alive on 12/31/2017, Current Gender,
Reported through 6/30/2018
N = 16,494
10
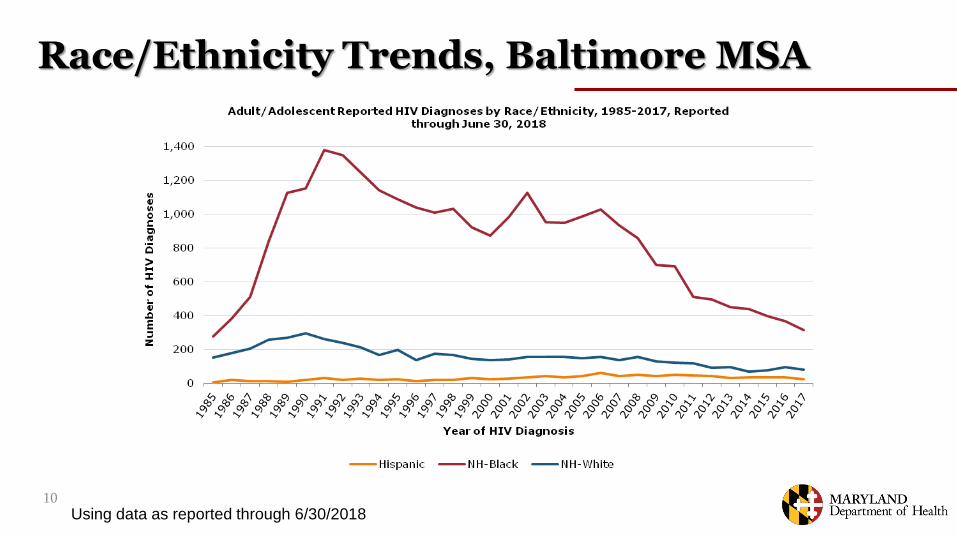
Race/Ethnicity Trends, Baltimore MSA
Using data as reported through 6/30/2018

11
Race/Ethnicity, Living Cases, 2017
620.2
100.8 64.4
1,834.7
85.3 160.1
2,437.6
0
500
1,000
1,500
2,000
2,500
3,000
Hispanic AmericanIndian
Asian Black PacificIslander
White Multiracial
Baltimore MSA (Age 13+ Rate=706.4/100,000)
Using data as reported through 6/30/2018
12
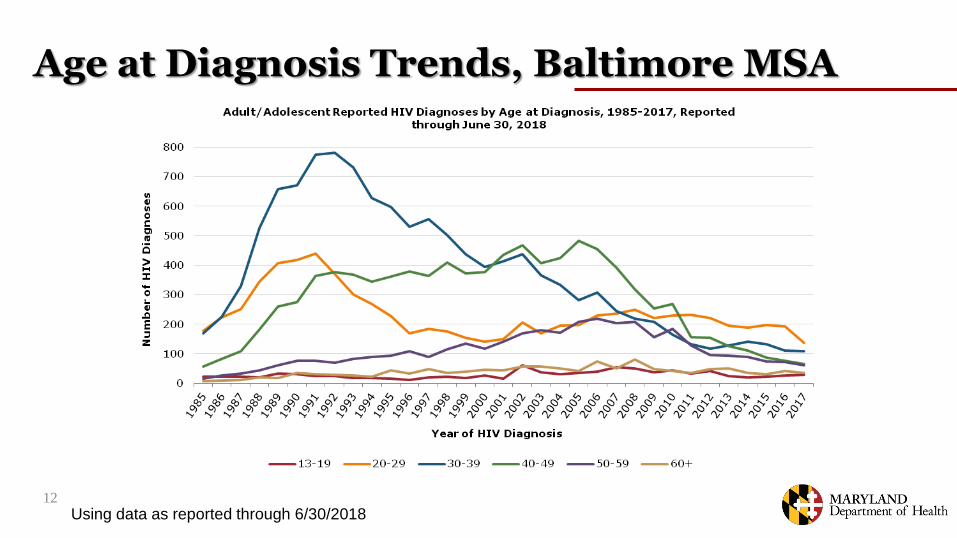
Age at Diagnosis Trends, Baltimore MSA
Using data as reported through 6/30/2018

13
HIV Incidence by Age Group, Baltimore MSA
0
5
10
15
20
25
30
35
13-19 20-29 30-39 40-49 50-59 60+
Pe
rce
nt
Age at Diagnosis of New 2017 HIV Diagnoses
New Dx
Using data as reported through 6/30/2018

14
HIV Prevalence by Age Group, Baltimore MSA
0
5
10
15
20
25
30
35
13-19 20-29 30-39 40-49 50-59 60+
Pe
rce
nt
Age on 12/31/2017 of Persons Living with Diagnosed HIV or AIDS
PLWHA
Using data as reported through 6/30/2018
15
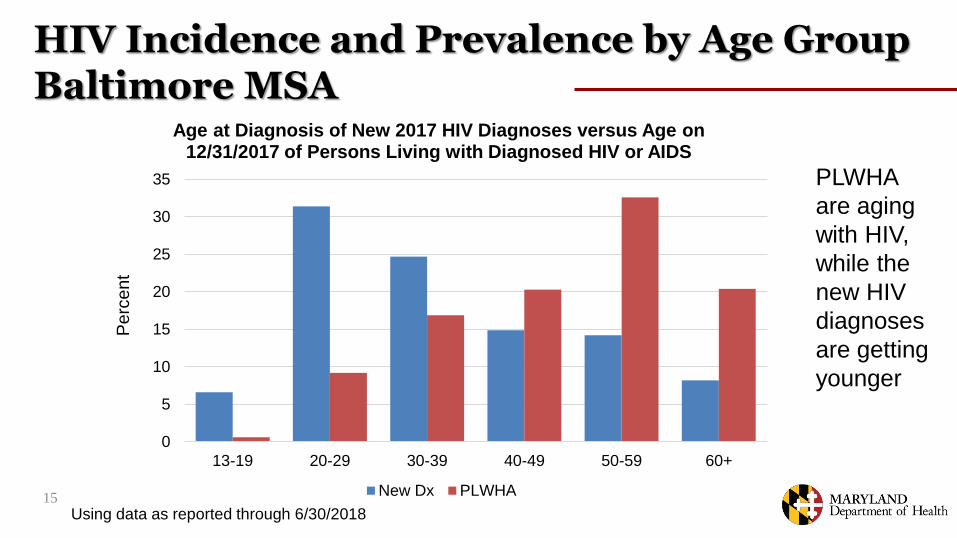
HIV Incidence and Prevalence by Age GroupBaltimore MSA
0
5
10
15
20
25
30
35
13-19 20-29 30-39 40-49 50-59 60+
Pe
rce
nt
Age at Diagnosis of New 2017 HIV Diagnoses versus Age on 12/31/2017 of Persons Living with Diagnosed HIV or AIDS
New Dx PLWHA
PLWHA
are aging
with HIV,
while the
new HIV
diagnoses
are getting
younger
Using data as reported through 6/30/2018

16
Estimated Percent Undiagnosed
0
5
10
15
20
25
30
35
40
45
Pe
rce
nt
Estimated Percent HIV Undiagnosed, United States, 2016Total = 14.2%

17
HIV Exposure Trends, Baltimore MSA
Using data as reported through 6/30/2018

18
HIV Exposure, Living Cases, 2017
MSM35%
MSM/IDU5%
IDU24%
Heterosexual34%
Other<1%
Baltimore MSA (Age 13+ N=16,494)
Using data as reported through 6/30/2018

19
HIV Exposure, Living Cases, 2017
Other, 134 Other, 169Heterosexual,
1,739
Heterosexual, 3,903
IDU, 2,283
IDU, 1,733
MSM/IDU, 743
MSM, 5,790
0%
10%
20%
30%
40%
50%
60%
70%
80%
90%
100%
Male Female
Baltimore MSA (Age 13+ N=16,494 with exposure)
Using data as reported through 6/30/2018

https://phpa.health.maryland.gov
Maryland Department of Health
Prevention and Health Promotion Administration