masma workshop report final - wiomsa
TRANSCRIPT

1 | P a g e
Workshop Report
Regional capacity building through advanced data analysis and writing of scientific publications based on recent deep-water
crustacean trawl surveys in Kenya, Tanzania, Mozambique and Madagascar
Dates: Monday 25th - Friday 29th November 2013
Venue: South Beach Garden Court Hotel, Durban, South Africa
Report by:
Johan Groeneveld, Bernadine Everett and Sean Fennessy

2 | P a g e
1) Background The Western Indian Ocean Marine Science Association (WIOMSA), through its Marine and Coastal Science for Management (MASMA) programme provided funding for a project to analyse data and publish / disseminate results emanating from four deep-water crustacean trawl surveys undertaken in 2011 and 2012 by the South West Indian Ocean Fisheries Project (SWIOFP). The funds were allocated to the South African Association for Marine Biological Research (SAAMBR), trading as the Oceanographic Research Institute (ORI), to host a multi-national data analysis and scientific publication workshop in Durban, South Africa. The aims of the workshop were to:
a) Maintain and strengthen collaborative research networks established in the region under SWIOFP and other projects;
b) Develop scientific capacity building through advanced analyses of combined databases, using state-of-the-art analyses software and techniques;
c) Improve scientific writing skills through drafting publications for the peer-reviewed literature; d) Disseminate information important to fisheries, environmental management, and biodiversity
conservation, through a synthesis of results and a firm recommendation to a RFMO (the South West Indian Ocean Fisheries Commission, SWIOFC);
e) Produce 2 peer-reviewed publications in international journals; f) Produce a workshop report, which describes the process from data analysis to publication of
papers, results of the workshop (including an evaluation by participants in terms of the content, quality, quantity delivery and organization of the workshop).
This Workshop Report addresses all the points above, with particular reference to point (f).
3 | P a g e
2) Tasks undertaken during pre-workshop preparation phase The preparation phase started on 1st October 2013. The organizing committee and invited scientists were as follows: Organizing committee Prof. Johan Groeneveld Dr. Sean Fennessy Ms Bernadine Everett (Software and Data management) Mr James Robey (Technical) Ms Ramini Naidoo (Administration)
Oceanographic Research Institute, South Africa
Invited scientists Dr. Edward Kimani Dr. Cosmus Munga
Kenya Marine and Fisheries Research Institute, Kenya
Dr Baraka Kuguru Mr. Mathias Igulu
Tanzania Fisheries Research Institute, Tanzania
Ms. Nilza Dias Mr Osvaldo Filipe
Fishery Research Institute (IIP) Maputo, Mozambique
Mr Herimamy Razafindrakoto Dr Guy Rabarison
Centre d’Etudes et de Développement des Pêches, Madagascar
Major tasks during the preparation phase were undertaken by ORI and by invited scientists, through email, as follows:
a) Prepare a detailed workplan (see Appendix 1) b) Administer all travel, accommodation and per diem arrangements (ORI); c) Prepare the agenda and workshop logistics (ORI); d) Verify the data from the four trawl surveys, render it in a compatible format, and combine the
data in an electronic database, ready for analyses (ORI and invited scientists); e) Prepare four PowerPoint presentations; one for each deep-water trawl survey undertaken, i.e.
methods used, data collected, difficulties experienced (Invited scientists per country); f) Prepare four PowerPoint presentations for past (historical) deep-water trawl fisheries as
background for the publications to be written (Invited scientists per country); g) Undertake preliminary analyses of the trawl data using GLMs (R software) and Primer (ORI
and KMFRI). h) Prepare two PowerPoint presentations; one on preliminary results using GLMs to model
abundance & distribution (ORI) and the other on preliminary results using Primer to assess species diversity (KMFRI).
4 | P a g e
3) Workshop Agenda and Progress made Each delegate at the Workshop received a document pack, including an Agenda. The following progress was made, relative to the Agenda items: Day 1: After Housekeeping, the objectives and the expected outcomes of the workshop were discussed and agreed upon. The remainder of the day was taken up by the four presentations on the individual surveys, comparing the methodologies used and the differences in data collection procedures between surveys. Morning session: The objectives of the Workshop were stated as follows:
• Strengthen regional collaboration • Continuation of SWIOFP research (unfinished business) • Dissemination of information important for fisheries management • Advanced scientific capacity development
The expected outputs (Workshop and follow-up work) were defined as:
• A validated deep-water trawl database • Two scientific articles in peer-reviewed literature (after follow-up work) • Recommendation to SWIOFC regarding the potential of deep-water trawl fisheries • Workshop report and evaluation
Afternoon session:
• Four presentations (20 minutes each) on the deep-water trawl surveys in Tanzania, Kenya, Madagascar and Mozambique
• Discussion on data compatibility and quality issues • Validation / final formatting of data
Day 2: The morning sessions were taken up by sorting out data compatibility issues and by a series of exploratory analyses on a regional scale. The afternoon sessions were used for presentations by Cosmas Munga (KMFRI) on the preliminary analyses of species diversity using Primer; and by Bernadine Everett on initial GLM models of abundance of key species. R software was loaded onto all laptops in preparation for the GLM modelling tutorial scheduled for day 3. Morning session:
• Standardized on units and conversions (effort, catch rates, abundance, biomass, etc.) • Undertook exploratory analyses (simple analyses to search for trends – use pie charts,
regressions, tables & figures etc) for: o Catch by family or order (%) o Catch rate by depth for key species o Catch rate by latitude for key species o Compated estimated versus calculated trawl hours
Afternoon session:
• Cosmas Munga presented preliminary analyses of species composition trends followed by an in-depth discussion
5 | P a g e
• Bernadine Everett presented preliminary analyses GLMs of catch rates and abundance (Bernadine Everett)
• Installation of R software packages for all participants Day 3: Delegates were introduced to R software (powerful data analysis software available freely over the internet) and how to run GLM models using R, and were then given the opportunity to run their own models. This was a highly successful session, and at its conclusion it was clear that a dire need exists in the region for improvement in data analysis software (for example, making available R-software), and the opportunity for scientists to improve their analytical skills by using this software. A regional user-support group, where new users can find advice to assist them with the intricacies of R and analyses / modelling questions, would potentially have high value. The afternoon included a visit to the Sea World Aquarium at uShaka Marine World. Morning session:
• Tutorial o Introduction to R o Illustration of GLM delta models to be used for data analyses of deep-water trawl
data o Hands-on GLM modelling (binomial and gamma) on R o Post-model conversion to standardised CPUE on Excel
• Scientific writing presentation
Afternoon session:
• Visit to Seaworld Aquarium at uShaka Marine World Day 4: Four summaries of historical deep-water trawl surveys were presented and discussed to extract the salient points, where after unresolved issues were listed, and steps to resolve them were proposed. The latter part of the day was used to structure the two planned publications from this workshop (see Appendix 2).
Morning session:
• Country presentations: Summaries of historical deep-water trawl survey information • Discussion of key outputs from historical surveys per country (i.e. info that will go into the
planned publications) • Trouble-shooting
o List critical unresolved issues and plan for their resolution o Kenya prawn species names o Mozambique environmental data o Swept area (calculated vs estimated trawl speed) o Finalization of database corrections prior to analyses o Other issues??
Afternoon session:
• Structuring of 2 scientific publications o Titles and domains (what goes into which paper) o Development of key research questions o Fisheries paper o Species diversity paper
6 | P a g e
o Aims (state clearly for each paper) • Introduction
o Appetizer o Introduce subject species or issues o Summarize previous research and results o Rationale for this paper o Verbalize broad research questions to be addressed o State specific aims of study
Day 5: During the first session, the structuring of the two publications was continued. The recommendations from the Workshop were drafted during the 2nd and 3rd sessions, Appendix 3). The Workshop evaluation was undertaken during the last session (see Appendix 4). The work to complete the 2 publications is ongoing, with submission to peer-reviewed journals tentatively scheduled for end-March 2014. The Workshop was adjourned.
Morning session:
• Materials and methods o Divide into subsections o Decide on appropriate analyses to address key questions o Who will be responsible for Study area, Sampling methods, Data description, and
Data analysis subsections? • Results
o Based on the above, subdivide into subsections o Which Tables and Figures will be required to illustrate results?
• Discussion • References
o Add key references so long (each country) Afternoon session:
• Recommendations from this workshop o Regional scale projects have many advantages, compared to projects limited by country
borders - Shared stocks - Shared scientific resources (especially because scientists are scarce in SWIO
region) - Access to archived data
o Improving quality of data collection - Regional compatibility - Species identification
o Integration of capacity development and production of applied science for fisheries management
- What we have been doing this week o Potential of deep-water crustacean fisheries in the SWIO, based on trawl data analyses
- Future regional work
• Ensure that all essential data / papers are copied onto a shared flash drive (circulate it) • The way forward for the 2 papers & recommendation • Course evaluation forms • Closure of the Workshop
7 | P a g e
4) Acknowledgements We would like to thank the Western Indian Ocean Marine Science Association and the Programme Committee (PC) of MASMA for approving this project and making the funds available for its implementation. We thank Dr Julius Francis of WIOMSA for facilitating the initial application, and for advice on how to apply. We also thank the directors of the Kenya Marine Fisheries Research Institute (KMFRI), Tanzania Fisheries Research Institute (TAFIRI), Fishery Research Institute (IIP) in Mozambique, and the Centre d’Etudes et de Développement des Pêches in Madagascar for their support, by allowing their scientists to travel to Durban to participate in the Workshop. The support staff at ORI are thanked for taking care of the administrative and logistic arrangements involved in organizing a successful Workshop.
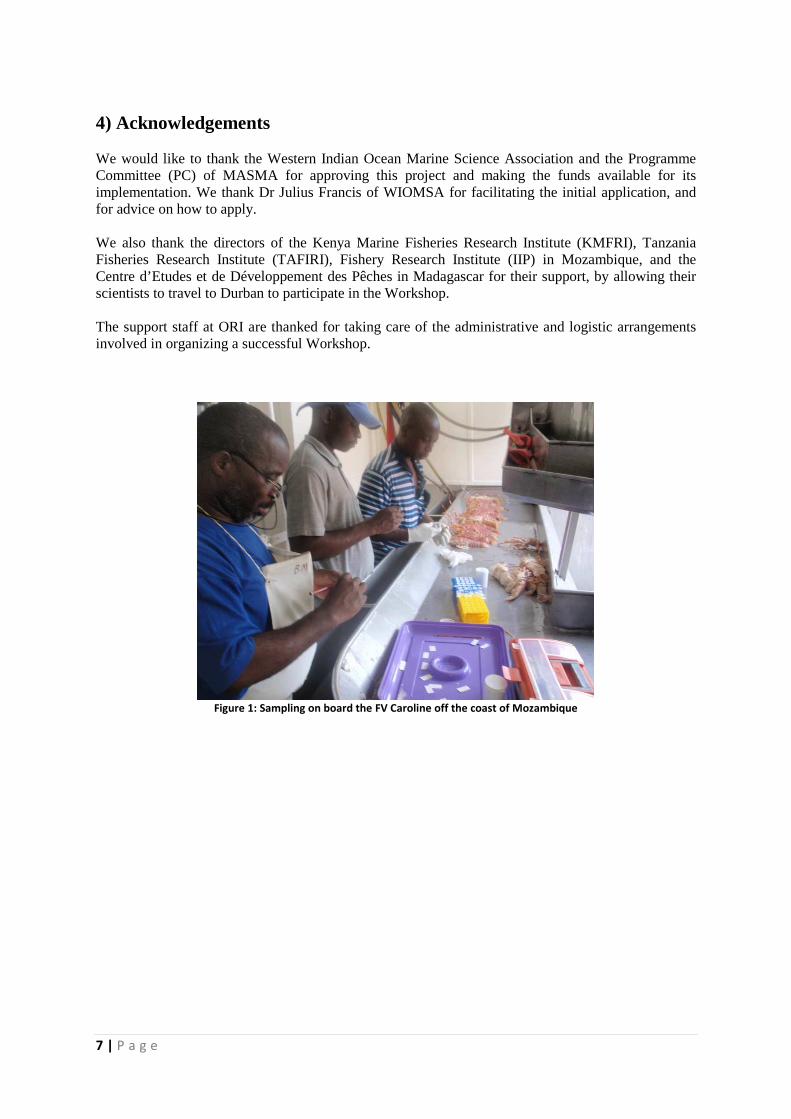
Figure 1: Sampling on board the FV Caroline off the coast of Mozambique

8 | P a g e
Appendix1
Detailed Workplan Thursday, 30th May 2013 Dear Sir / Madam
Detailed Workplan for MASMA proposal
“Regional capacity building through advanced data analysis and writing of scientific publications based on recent deep-water crustacean trawl surveys in Kenya, Tanzania, Mozambique and Madagascar”
We would like to thank the Programme Committee (PC) of MASMA for tentatively approving the above proposal, pending our response to three comments. The comments were that:
i) A detailed workplan with activities and their timelines be supplied, including a workshop to be held in 2013;
ii) The project output includes a synthesis highlighting the main research results from the analyses and management recommendations;
iii) A workshop report, describing the process from data analysis to publication of papers and results of the workshop (including an evaluation by participants in terms of the content, quality, quantity delivery and organization of the workshop) is submitted at its conclusion.
We agree that the additional two outputs (numbers ii and iii above) would be most useful, and will therefore include them as additional outputs of the project. After consultation with collaborating scientists from the four countries involved in the project, it was decided that ORI would host the workshop between 25th and 29th November 2013 (5 days). Step 1: Pre-workshop preparation phase
The preparation phase will start on 1st October 2013.
The tasks to be undertaken at this stage are as follows:
i) Invitations sent out and venue prepared ii) Database and ancillary information compiled and circulated iii) Analysis software selected, installed iv) Preliminary analysis plan developed v) Material for Scientific writing workshop prepared
It is important to note that the databases of the four deep-water bottom trawl surveys to be analysed have already been verified and formatted into a compatible format on an electronic database during a SWIOFC workshop held in Maputo in January 2013. These data must be made available to the organizer of the workshop by 1st October. These data will then be scrutinized once more during the pre-workshop preparation phase, to ensure that they are ready for the workshop.
9 | P a g e
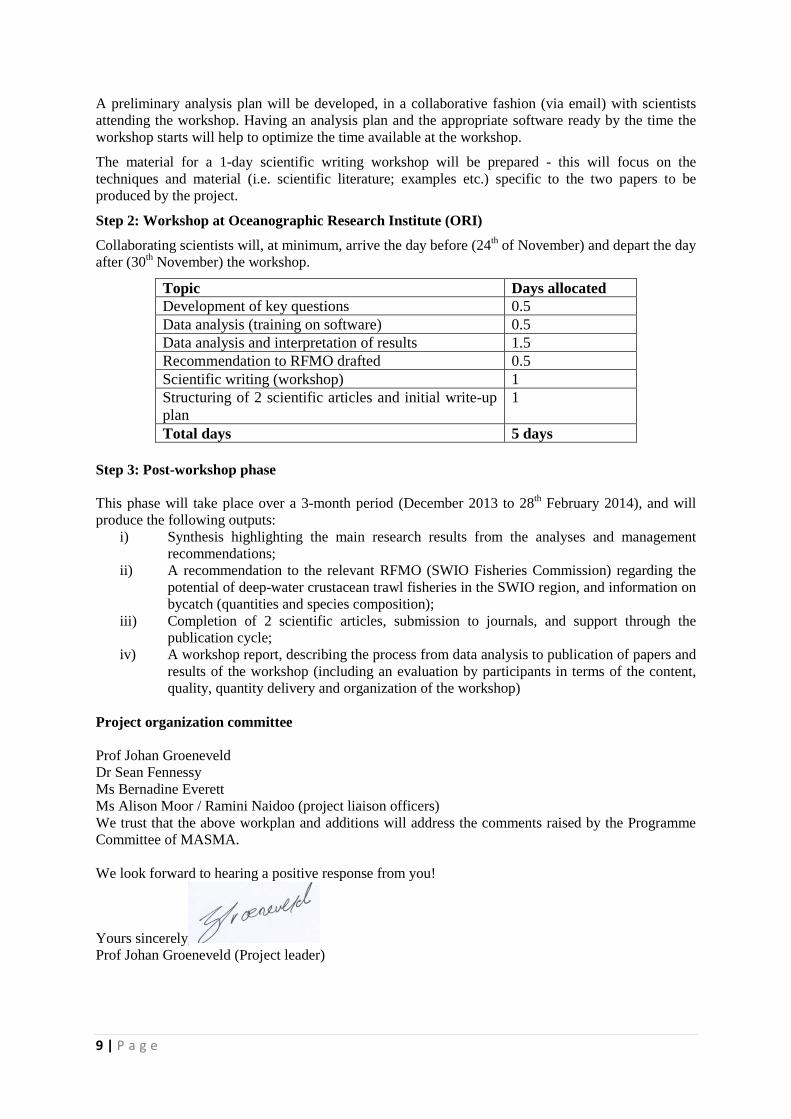
A preliminary analysis plan will be developed, in a collaborative fashion (via email) with scientists attending the workshop. Having an analysis plan and the appropriate software ready by the time the workshop starts will help to optimize the time available at the workshop.
The material for a 1-day scientific writing workshop will be prepared - this will focus on the techniques and material (i.e. scientific literature; examples etc.) specific to the two papers to be produced by the project.
Step 2: Workshop at Oceanographic Research Institute (ORI)
Collaborating scientists will, at minimum, arrive the day before (24th of November) and depart the day after (30th November) the workshop.
Topic Days allocated Development of key questions 0.5 Data analysis (training on software) 0.5 Data analysis and interpretation of results 1.5 Recommendation to RFMO drafted 0.5 Scientific writing (workshop) 1 Structuring of 2 scientific articles and initial write-up plan
1
Total days 5 days
Step 3: Post-workshop phase This phase will take place over a 3-month period (December 2013 to 28th February 2014), and will produce the following outputs:
i) Synthesis highlighting the main research results from the analyses and management recommendations;
ii) A recommendation to the relevant RFMO (SWIO Fisheries Commission) regarding the potential of deep-water crustacean trawl fisheries in the SWIO region, and information on bycatch (quantities and species composition);
iii) Completion of 2 scientific articles, submission to journals, and support through the publication cycle;
iv) A workshop report, describing the process from data analysis to publication of papers and results of the workshop (including an evaluation by participants in terms of the content, quality, quantity delivery and organization of the workshop)
Project organization committee Prof Johan Groeneveld Dr Sean Fennessy Ms Bernadine Everett Ms Alison Moor / Ramini Naidoo (project liaison officers) We trust that the above workplan and additions will address the comments raised by the Programme Committee of MASMA. We look forward to hearing a positive response from you!
Yours sincerely Prof Johan Groeneveld (Project leader)

10 | P a g e
Appendix2
Structures of two planned peer-reviewed publications
Paper 1
MASMA Fisheries Paper
Working Title: Recent deep-water trawl surveys in the South West Indian Ocean: Part 1 - abundance of crustacean resources
Authors: Dias, Everett, Fennessy, Filipe, Groeneveld, Igulu, Kimani, Kuguru, Munga, Rabarison, Razafindrakoto, Robey, Zacharias
Affiliations:
Abstract:
Introduction:
Key Research questions:
• What are the percentages of main taxa (priority crusts, fish, elasmobranchs, cephalopods, other inverts) in catches
• For priority crustaceans, what are the relative proportions by o depth (in kg) o latitude (or country) o in Madagascar versus Mozambique (across the Mozambique channel)
• What are the standardized CPUE trends per selected species o across depth and latitude o across the Mozambique channel (i.e. by longitude)
• What are the biomass per priority species in the actual survey areas • Are there any size / sex differences by latitude (use ranges)
Materials and Methods:
Study area
• Description of the SWIO (gradient from tropical to subtropical / habitats / high biodiversity / bottom topography / ocean currents / etc.) Maybe to Intro??
• GIS maps of countries showing trawl stations; Insert of Africa showing the overall region with arrows to countries (FIGURE)
• Latitudinal and depth ranges covered (name sampling areas covered – 3 per country) • When were the surveys done?
Survey strategy and gear
11 | P a g e
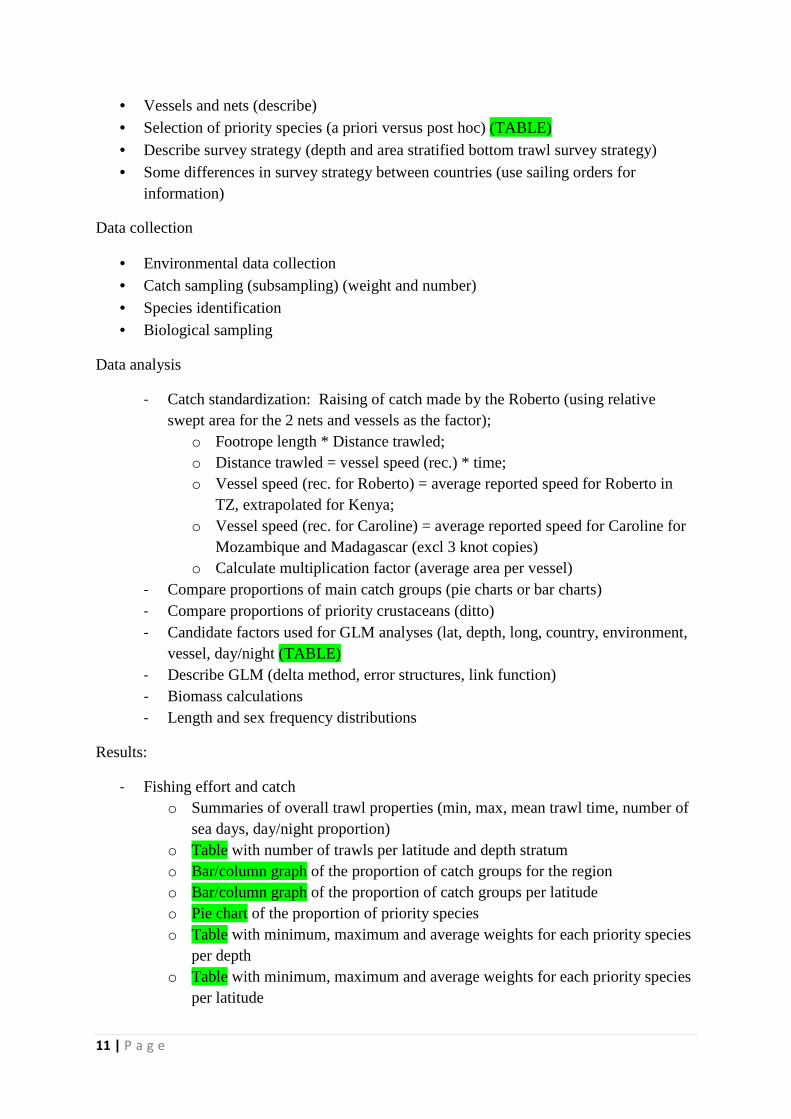
• Vessels and nets (describe) • Selection of priority species (a priori versus post hoc) (TABLE)
• Describe survey strategy (depth and area stratified bottom trawl survey strategy) • Some differences in survey strategy between countries (use sailing orders for
information)
Data collection
• Environmental data collection • Catch sampling (subsampling) (weight and number)
• Species identification • Biological sampling
Data analysis
- Catch standardization: Raising of catch made by the Roberto (using relative swept area for the 2 nets and vessels as the factor);
o Footrope length * Distance trawled; o Distance trawled = vessel speed (rec.) * time; o Vessel speed (rec. for Roberto) = average reported speed for Roberto in
TZ, extrapolated for Kenya; o Vessel speed (rec. for Caroline) = average reported speed for Caroline for
Mozambique and Madagascar (excl 3 knot copies) o Calculate multiplication factor (average area per vessel)
- Compare proportions of main catch groups (pie charts or bar charts) - Compare proportions of priority crustaceans (ditto) - Candidate factors used for GLM analyses (lat, depth, long, country, environment,
vessel, day/night (TABLE) - Describe GLM (delta method, error structures, link function) - Biomass calculations - Length and sex frequency distributions
Results:
- Fishing effort and catch o Summaries of overall trawl properties (min, max, mean trawl time, number of
sea days, day/night proportion) o Table with number of trawls per latitude and depth stratum o Bar/column graph of the proportion of catch groups for the region o Bar/column graph of the proportion of catch groups per latitude o Pie chart of the proportion of priority species o Table with minimum, maximum and average weights for each priority species
per depth o Table with minimum, maximum and average weights for each priority species
per latitude
12 | P a g e
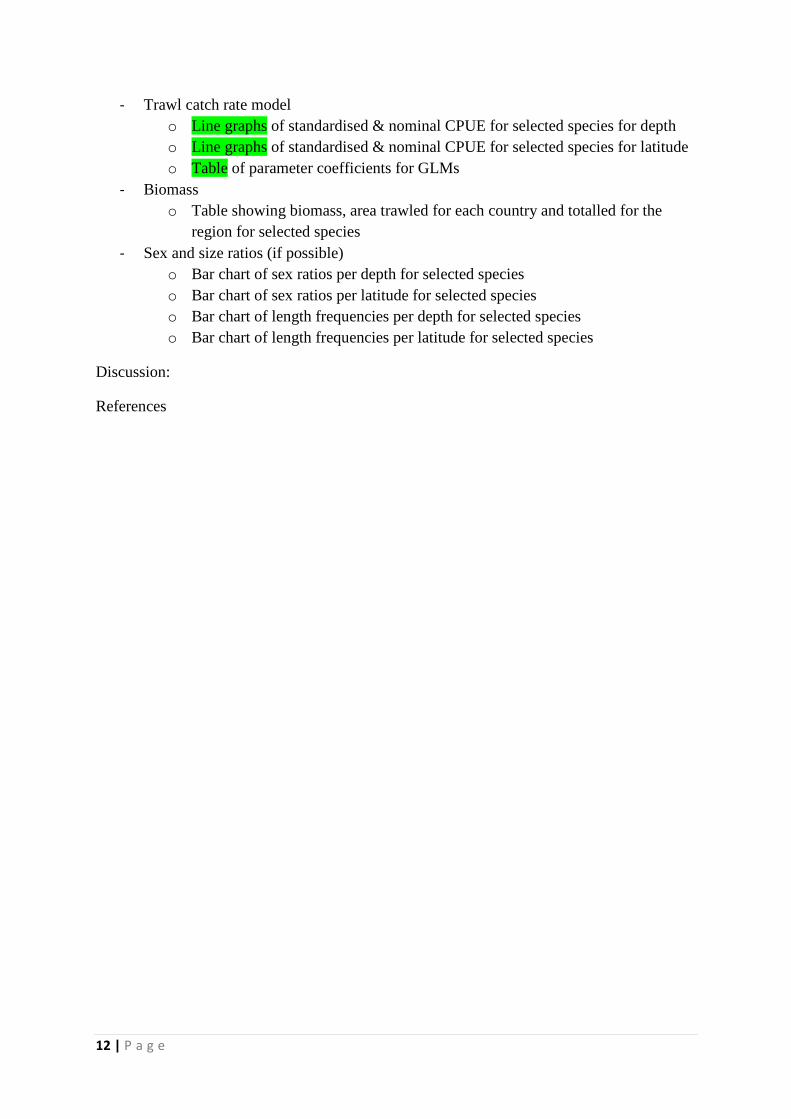
- Trawl catch rate model o Line graphs of standardised & nominal CPUE for selected species for depth o Line graphs of standardised & nominal CPUE for selected species for latitude o Table of parameter coefficients for GLMs
- Biomass o Table showing biomass, area trawled for each country and totalled for the
region for selected species - Sex and size ratios (if possible)
o Bar chart of sex ratios per depth for selected species o Bar chart of sex ratios per latitude for selected species o Bar chart of length frequencies per depth for selected species o Bar chart of length frequencies per latitude for selected species
Discussion:
References

13 | P a g e
Paper 2
MASMA Species diversity paper
Working Title: Recent deep-water trawl surveys in the South West Indian Ocean: Part 2 – diversity and distribution of demersal crustacean and fish communities
Authors: Dias, Everett, Fennessy, Filipe, Groeneveld, Igulu, Kimani, Kuguru, Munga, Rabarison, Razafindrakoto, Zacharias
Affiliations:
Abstract:
Introduction:
Appetizer: Is species richness / diversity of deep-water taxa greater at tropical than at subtropical latitudes, despite more constant cool temperatures at depths below 400 m?
Key research questions:
• What species occurred in the surveys? • What is the species richness?
• What influences diversity and composition of crustaceans and fishes? o Latitude? o Depth? o Environmental factors? o Interactions between factors?
• Which taxa (taxon) are responsible for the differences in composition?
Materials and Methods:
• Study area o See Part 1
• Data collection o See Part 1 o Rationalization of species, genera and families
Data analysis
o Standardization of catch as described in Part 1 o Species composition using MDS in Primer o ANOSIM to look at differences between species composition o SIMPER to identify which taxa contribute to differences o Species Richness (Margalef index and Rarefaction curves – using original
[standardized] count data)
Results:

14 | P a g e
Give species lists of crustaceans and fishes caught during surveys (Country; Total (i.e. 5 columns) Proportions by number in each country and total (2 Tables)
Catch composition
MDS plot of all crusts
MDS plot of all finfish
ANOSIM table covering both MDS plots
SIMPER Table (use a cutoff percentage to compare between groupings [countries?])
Species diversity
Margalev index / Shannon Wiener index (Table or Figure)
Rarefaction figure (number of expected species in a given sample
Discussion:
References
15 | P a g e
Appendix3
Recommendations for Management
MASMA Workshop
Regional capacity building through advanced data analysis and writing of
scientific publications based on recent deep-water crustacean bottom trawl
surveys in Kenya, Tanzania, Mozambique and Madagascar
25th
– 29th
November 2013
Garden Court South Beach Hotel, Durban, South Africa
Recommendations to WIOMSA and the South West Indian Ocean Fisheries
Commission (SWIOFC)
Prepared by:
J. Groeneveld, S. Fennessy and B. Everett (ORI, South Africa)
N. Dias and O. Filipe (IIP, Mozambique)
B. Kuguru and M. Igulu (TAFIRI, Tanzania)
E. Kimani and C. Munga (KMFRI, Kenya)
H. Razafindrakoto and G. Rabarison (Madagascar)

16 | P a g e
During 2011 and 2012, the South West Indian Ocean Fisheries Project (SWIOFP) undertook four
deep-water bottom trawl surveys to assess the fisheries potential of crustacean resources in Kenya,
Tanzania, Mozambique and Madagascar. The aims of these surveys were to assess abundance,
species composition, and biomass of crustacean resources with potential for fisheries development.
Also, the surveys aimed to identify other taxa (i.e. fish, sharks, cephalopods) that may be caught by
trawls in deep water, either as targeted or bycatches.
The surveys were structured by depth stratum (100-200m; 200-300m; 300-400m; 400-500m and
>500m) and area (3 areas per country), and the number of trawls was set based on relative area of
the strata. With the withdrawal of the RV Fridjtof Nansen owing to piracy threats, the surveys were
conducted by wet-leased commercial trawlers, with teams of scientists on board to direct operations
and collect data. These scientists were mainly government employees of the respective countries
being surveyed, complemented by experts in the identification of deep-sea species. The surveys and
data collection were coordinated by the SWIOFP Regional Component Coordinator (J. Groeneveld,
ORI) and the SWIOFP Survey Logistics Coordinator (T. Athayde, SeaMore).
Details of the four surveys were as follows:
TABLE 1: Country, vessel used, duration of surveys and number of trawl stations completed. The
scientists present at the workshop were on board during surveys, except for the Mozambican and
South African scientists.
Country Vessel Duration of survey Number of trawl
stations& depth
range covered
Scientists
involved in the
Workshop
Mozambique FV Caroline
LOA = 41 m
GRT = 312 t
25/10-14/11/2011
(16 days)
90 trawls
220 – 592 m
N. Dias
O. Filipe
Madagascar FV Caroline 20/11-6/12/2011
(15 days)
89 trawls
184 – 658 m
G. Rabarison
H. Razafindrakoto
Tanzania FV Roberto
LOA = 23 m
GRT = 117 t
29/1-13/2/2012 (10
days)
29 trawls
150 – 526 m
B. Kuguru
M. Igulu
Kenya FV Roberto 24/2-7/3/2012 (13
days)
60 trawls
166 – 580 m
E. Kimani
C. Munga
South Africa NA NA NA J. Groeneveld
S. Fennessy
B. Everett
J. Robey
SWIOFP ended in March 2013, before the data from these four surveys could be properly analysed.
Additional funds for data analyses, and the write-up of regional management recommendations and
scientific publications with applied value at a regional level were solicited from WIOMSA, under the
MASMA (Marine Science for Management) code. Funds were granted for a Workshop bringing
together scientists from the four countries and from the Oceanographic Research Institute in
17 | P a g e
Durban, South Africa. The workshop was successfully undertaken between 25th
and 29th
November
2013, and the following recommendations were made for the attention of the SWIOFC.
Recommendation 1: Regional scale projects in the SWIO should be supported as a priority, rather
than projects with a narrower geographical scale.
a) This is specifically so because regional projects can pool scientific expertise in a region
where good scientists are generally scarce. Working together as peers on projects
creates a fertile learning environment, where skills are easily transferred, leading to
better science and scientists.
b) Regional projects are also better suited to addressing issues surrounding shared or
transboundary stocks, and migrating fish stocks such as tunas or other pelagics. These
issues are fundamental to regional fisheries management in the SWIO, and therefore
regional projects offer more to RFMOs than localised projects.
c) Outputs of regional projects have better overlap with the boundaries of large marine
ecosystems (LME’s) in the SWIO, and therefore they are better aligned with SWIOFC and
EAF objectives.
d) Similar issues affect fisheries in several SWIO countries, for example: similar gear types
or fishing methods are used to target some species; large prawn trawl bycatches often
result in user conflicts; and degradation of coral reefs or mangrove areas may affect
recruitment of species that use these habitats as nurseries.
e) Shared projects lead to sharing of archived databases, even where these data were
initially collected at a national level, for purely national motives. Combining similar
datasets can enrich analyses, and show over-arching trends, as well as subtle
differences, which may not be possible if data are seen in isolation.
Recommendation 2: Improve the quality of data collection across a regional scale, so that the gaps
in quality and compatibility between countries are reduced.
a) The compatibility of data collection methods (e.g. trawl speed, net opening etc.) was
weak during the SWIOFP surveys at sea, even where similar sailing orders stipulated and
explained the tasks to be undertaken. This led to some difficulties in combining datasets
across surveys. Differences extended to subsampling procedures, the identification of
species, and the allocation of trawls to day / night categories or depth strata. It is
recommended that a single experienced cruise leader is appointed when several surveys
are to be done, and that this cruise leader ensures that identical methods are used
through-out all surveys.
b) Where possible, a single vessel and standardized gear should be used. In the present
case, the security situation precluded the use of FV Caroline and RV Fridtjof Nansen in
Kenya, Tanzania, and a second vessel (FV Roberto) had to be procured. Differences in
the engine power and configuration of fishing gear between the FV Caroline and the FV
Roberto necessitated complex catch conversions to render the 2 datasets compatible.
c) Species identification proved difficult in many cases, because no up-to-date regional
species identification guide for deep-water taxa in the SWIO exists at present (although
there are some old FAO guides for species of regional commercial interests). Therefore

18 | P a g e
identification was not always standard across countries, and misidentification often
occurred. It is recommended that an improved guide is compiled / developed and used
for deep-water taxa in the SWIO region.
d) Season should be taken into account when designing surveys (either done at the same
time each year, and/or cover more than one season, i.e. NEM and SEM).
e) Curating and storage of voucher specimens during surveys is important, so that species
identification can be improved. In one case, a penaeoid species, important to one
country, could not be identified at sea, and this identification is now rendered very
difficult without voucher specimens.
f) It is often difficult to deploy sophisticated equipment (such as CTD’s) from commercial
fishing vessels), and the environmental /habitat data collected during the surveys were
therefore limited to < 200 m depth in some countries (i.e. the vessel did not have the
appropriate winch or cable available).
Recommendation 3: Integrate scientific capacity development and production of applied science
for fisheries management
a) The Workshop proved to be highly effective in addressing three key aspects of marine
science in the SWIO region at the same time: i] developing analytical capacity in
scientists; ii] producing peer-reviewed articles; and iii] review of methods used with
recommendation for future action. This type of workshop (i.e. regional pooling of skills,
training, production of peer-reviewed outputs, and review of sampling methods with the
purpose of improving them) has the potential to transform applied science in the SWIO
region, and it is recommended that similar opportunities are sought out and supported.
b) Publishing in the peer-reviewed literature as groups of scientists will ensure that good
science is accomplished, that it is reviewed internationally, that skills are transferred,
and that a confident cadre of scientists able to hold their own in the international arena
is gradually developed.
Recommendation 4: Improve the analytical skills and access to appropriate software for basic
biostatistical analyses. Development of R-software skills in the SWIO region is strongly
recommended.
a) Many marine / fisheries scientists in the SWIO region have not had access to in-depth
statistical training, nor to expensive and sophisticated software for analyses.
Unfortunately, this combination leads to much data being collected, but fewer in-depth
analyses of those data. In effect, scientists eventually stagnate, and produce data
without statistical interpretations of these data.
b) During the Workshop, scientists were exposed to R software, and within a single day,
most could construct GLM models, and converse with some confidence on aspects of
these models. It was very clear that enhanced skills in biostatistical analyses and the
appropriate software to handle and analyse complex fisheries data is a crucial
requirement for fisheries science to progress in the SWIO region.
c) R software is freely available and easily accessible from the internet in all countries. It is
used around the world by leading scientists in most fields, including fisheries science.
19 | P a g e
d) It is strongly recommended that a training workshop be funded to train scientists in use
of R for biological and fisheries data analyses.
e) One-time training without continued technical support thereafter is, however, not
enough, because skills that are not regularly used are easily lost or forgotten. Therefore
it is recommended that a marine science R-forum is developed for the region so that
scientists using R will have somewhere to turn to when they have queries with regards
to appropriate analyses or operations of the software.
Recommendation 5: Assess the potential of deep-water crustacean fisheries in the SWIO, based on
surveys and experimental fishing
a) In the present case (four deep-water trawl surveys), firm recommendations on species
distribution, biomass, stock status and fisheries potential can only be made after data
have been fully analysed. This process is now underway, and results are expected during
the first half of 2014.
b) The surveys showed that Madagascar has very little deep-water trawlable area along the
west coast. A survey of non-trawlable grounds (i.e. using traps) in deep water to look for
potential deep-water crustacean resources is therefore recommended. This was part of
the initial SWIOFP cruise plan, but could not be implemented because an appropriate
vessel could not be found in time.
c) Bycatch remains a large proportion of deep-water trawl fisheries (similar to shallow-
water trawl fisheries). Some of these bycatch species (fish) may have commercial value,
and could be reconsidered as target catch.
Recommendation 6: Enhance the profile and basis for advice to SWIOFC, relevant to the regional
management of crustacean fisheries
a) It is recommended that key scientists that specialize in crustacean fisheries are identified
per SWIO country, and that a formal scientific panel be constituted to inform the
SWIOFC on fisheries research and management issues. These scientists should be invited
to SWIOFC meetings / working groups where scientific / fisheries issues are tabled
b) The SWIOFC shrimp working group should be changed to a Crustacean Working group,
so that it can incorporate deep-water taxa (lobsters, langoustines, crabs, prawns etc.)
important to the region. This is an important distinction, considering the increased
importance of deep-water crustacean fisheries, particularly in Mozambique and, to
some extent, in South Africa.
20 | P a g e
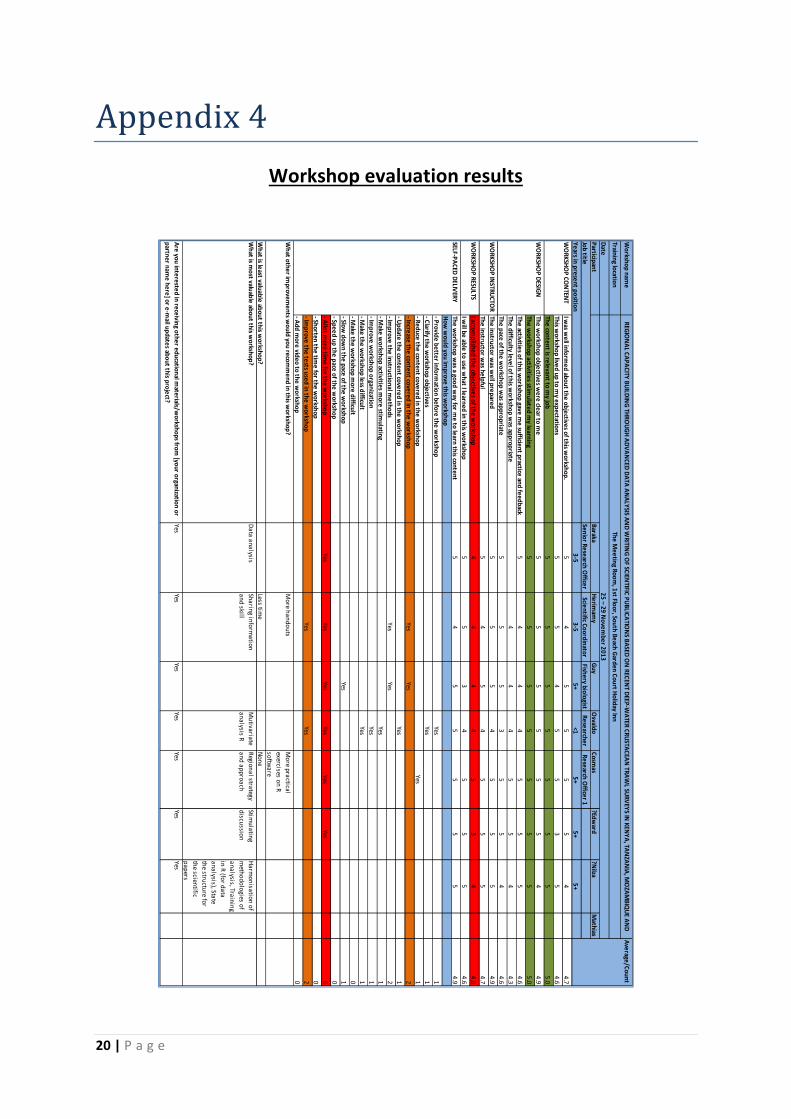
Appendix4
Workshop evaluation results
Wo
rksho
p n
ame
Trainin
g locatio
n
Date
Particip
ant
Baraka
He
rimam
yG
uy
Osvald
oC
osm
as?Ed
ward
?Nilza
Math
ias
Sen
ior R
ese
arch O
fficer
Scien
tific Co
ord
inato
rFish
ery b
iolo
gistR
ese
arche
rR
ese
arch O
fficer 1
3-5
3-5
5+
<15
+5
+5
+
I was w
ell in
form
ed
abo
ut th
e o
bje
ctives o
f this w
orksh
op
.5
45
55
54
4.7
This w
orksh
op
lived
up
to m
y exp
ectatio
ns
55
45
53
54
.6
The
con
ten
t is rele
vant to
my jo
b5
55
55
55
5.0
The
wo
rksho
p o
bje
ctives w
ere
clear to
me
55
55
55
44
.9
The
wo
rksho
p activitie
s stimu
lated
my le
arnin
g5
55
55
55
5.0
The
activities o
f this w
orksh
op
gave m
e su
fficien
t practice
and
fee
db
ack5
44
45
55
4.6
The
difficu
lty leve
l of th
is wo
rksho
p w
as app
rop
riate4
44
55
44
.3
The
pace
of th
e w
orksh
op
was ap
pro
priate
55
53
55
44
.6
The
instru
ctor w
as we
ll pre
pare
d5
55
45
55
4.9
The
instru
ctor w
as he
lpfu
l5
45
45
55
4.7
I accom
plish
ed
the
ob
jective
s of th
e w
orksh
op
44
44
53
44
.0
I will b
e ab
le to
use
wh
at I learn
ed
in th
is wo
rksho
p5
53
45
55
4.6
The
wo
rksho
p w
as a goo
d w
ay for m
e to
learn
this co
nte
nt
54
55
55
54
.9
Ho
w w
ou
ld yo
u im
pro
ve th
is wo
rksho
p
- Pro
vide
be
tter in
form
ation
be
fore
the
wo
rksho
pYes
1
- Clarify th
e w
orksh
op
ob
jective
sYes
1
- Re
du
ce th
e co
nte
nt co
vere
d in
the
wo
rksho
pY
es1
- Incre
ase th
e co
nte
nt co
vere
d in
the
wo
rksho
pY
esYes
2
- Up
date
the
con
ten
t cove
red
in th
e w
orksh
op
Yes1
- Imp
rove
the
instru
ction
al me
tho
ds
Yes
Yes2
- Make
wo
rksho
p activitie
s mo
re stim
ulatin
gYes
1
- Imp
rove
wo
rksho
p o
rganizatio
nYes
1
- Make
the
wo
rksho
p le
ss difficu
ltYes
1
- Make
the
wo
rksho
p m
ore
difficu
lt0
- Slow
do
wn
the
pace
of th
e w
orksh
op
Yes1
- Spe
ed
up
the
pace
of th
e w
orksh
op
0
- Allo
t mo
re tim
e fo
r the
wo
rksho
pY
esY
esYes
YesY
esYes
6
- Sho
rten
the
time
for th
e w
orksh
op
0
- Imp
rove
the
tests u
sed
in th
e w
orksh
op
Yes
Yes2
- Ad
d m
ore
vide
o to
the
wo
rksho
p0
Mo
re ha
nd
ou
tsM
ore p
ractica
l
exercises
on
R
softw
are
Less tim
eN
on
e
Da
ta a
na
lysisSh
arin
g in
form
atio
n
an
d skill
Mu
tiva
riate
an
alys
is R
Regio
na
l strateg
y
an
d a
pp
roa
ch
Stimu
latin
g
discu
ssion
Ha
rmo
nis
atio
n o
f
meth
od
olo
gies of
an
alysis, Tra
inin
g
in R
(for d
ata
an
alysis), S
tate
the stru
cture fo
r
the scien
tific
pa
pers
Yes
YesYes
YesYe
sYes
Yes
Wh
at is least valu
able
abo
ut th
is wo
rksho
p?
Wh
at is mo
st valuab
le ab
ou
t this w
orksh
op
?
Are
you
inte
reste
d in
rece
iving o
the
r ed
ucatio
nal m
aterials/w
orksh
op
s from
[you
r organ
ization
or
partn
er n
ame
he
re] o
r e-m
ail up
date
s abo
ut th
is pro
ject?
Ave
rage/C
ou
nt
WO
RK
SHO
P C
ON
TENT
WO
RK
SHO
P D
ESIGN
WO
RK
SHO
P IN
STRU
CTO
R
WO
RK
SHO
P R
ESULTS
SELF-PA
CED
DELIV
ERY
Wh
at oth
er im
pro
vem
en
ts wo
uld
you
reco
mm
en
d in
this w
orksh
op
?
Job
title
Ye
ars in p
rese
nt p
ositio
n
REG
ION
AL C
AP
AC
ITY B
UILD
ING
THR
OU
GH
AD
VA
NC
ED D
ATA
AN
ALY
SIS AN
D W
RITIN
G O
F SCIEN
TIFIC P
UB
LICA
TION
S BA
SED O
N R
ECEN
T DEEP
-WA
TER C
RU
STAC
EAN
TRA
WL SU
RV
EYS IN
KEN
YA
, TAN
ZAN
IA, M
OZA
MB
IQU
E AN
D
MA
DA
GA
SCA
RTh
e M
ee
ting R
oo
m, 1
st Floo
r, Sou
th B
each
Gard
en
Co
urt H
olid
ay Inn
25
– 29
No
vem
be
r 20
13