mass transport in a micro flow-through vial of a junction-at-the-tip capillary electrophoresis-mass...
TRANSCRIPT
Published: April 29, 2011
r 2011 American Chemical Society 4916 dx.doi.org/10.1021/ac200636y |Anal. Chem. 2011, 83, 4916–4923
ARTICLE
pubs.acs.org/ac
Mass Transport in a Micro Flow-Through Vial of a Junction-at-the-TipCapillary Electrophoresis-Mass Spectrometry InterfaceXuefei Zhong, E. Jane Maxwell, and David D.Y. Chen*
Department of Chemistry, University of British Columbia, 2036 Main Mall, Vancouver, BC, Canada V6T 1Z1
Coupling the highly efficient separation technique capillaryzone electrophoresis (CZE) to the sensitive and informa-
tion rich detection technique mass spectrometry (MS) hasshown great potential in a variety of research areas since it wasfirst introduced in 1987.1 Among different coupling techniques,such as electrospray ionization (ESI),1 inductively coupled plasma,2
matrix assisted laser desorption ionization,3 atmospheric pressurechemical ionization,4 and atmospheric pressure photoionization,5
ESI is one of the most popular because it is easy to operate and canbe adapted to many different types of compounds, especially largeboimolecules. Because of the difficulty of optimizing CE separationand ESI conditions simultaneously, CE-ESI-MS interfaces havebeen redesigned, modified, and improved during the last twentyyears to address the concerns of stable electric contacts, flow ratecompatibility, fluid surface tension modification, and optimumsprayer geometry.6 Interfaces are generally divided into twocategories: interfaces with a sheath-flow or makeup liquid, andsheathless interfaces.6 The conventional sheath-flow interfacesuse sheath liquid to establish electric contact and to modify thesurface tension of the CE effluent. However, the detectionsensitivity is significantly diminished because of the large dilutionfactor introduced by the sheath liquid with a relatively high flowrate of 1�10 μL/min and the separation efficiency might becompromised becauses of the suction effect caused by thenebulizing gas.7 While showing higher sensitivity, most of theshealthless interfaces generally involve complicated fabricationprocedure, such as coating the ESI emitters with various ofconductive materials,8 drilling a hole on the capillary to split theliquid flow in the capillary,9 inserting an electrode into thecapillary,10,11 or etching the tip of silica capillary to make itporous.12 Because of various issues, these shealthless interfaces
are usually fragile, and reproducibility is also a problem becauseof the difficult fabrication process.
Recently, our group has designed a new junction-at-the-tipCE-ESI-MS interface, which decouples the electrical and solution flowrate requirements of the separation and ionization processes.13 Ituses a 360 μm outer diameter CE capillary inserted as far aspossible into a stainless steel emitter needle with a beveled tip, sothat the space enclosed by the end of CE column and innersurface of stainless steel tip forms an open flow-through microvial. Figure 1A shows a schematic of the approximate arrange-ment of the CE outlet micro vial. A chemical modifier solutionsupplied by an additional grounded reservoir is added at a lowflow rate to the micro vial to support the effluent flow rate andsustain stable electrospray. This low flow rate chemical modifierpushes the effluent from CE to the outside of the tip, stabilizesthe electric contact by constantly providing fresh electrolyte intothe space in the micro vial with minimal dilution to the sample.This setup has been used for many types of compounds13 and hasthe advantages of using more durable larger outer diametercapillaries, good sensitivity, compatibility with a larger range ofusable flow rate.14
However, there are concerns about possible postcolumn bandbroadening introduced by the micro flow-through vial at thesprayer tip. This concern is also relevant to other “junction-at-the-tip” CE-ESI-MS interfaces,15�20 where the separation capil-lary is usually surrounded by a tapered outer tube but does notextrude out of it, and the CE effluent mixes with a makeup flow
Received: March 11, 2011Accepted: April 29, 2011
ABSTRACT: When coupling capillary electrophoresis withpostcolumn detection methods, such as mass spectrometry, thepresence of postcolumn band broadening must be considered.The band broadening effects introduced by junction-at-the-tipCE-MS interfaces using a postcolumnmicro flow-through vial areinvestigated by studying the hydrodynamic flow patterns andmass transport process inside the micro vial at the end of the CEseparation capillary. Simulation results obtained by solving theNavier�Stokes and mass balance equations provide insights intothe velocity field and concentration distribution of the analytes in the micro vial and demonstrate that, with a low flow rate of chemicalmodifier solution, the laminar flow streams confine the analyte molecules to the central part of the micro vial and thus maintain majorfeatures of the peak shapes. Peaks detected byUVandMSunder similar experimental conditionswere compared to verify the numericalprediction that the main features of the UV peak can be retained in the MS peak. Experiments also show that band broadening can beminimized when an appropriate chemical modifier flow rate is selected.

4917 dx.doi.org/10.1021/ac200636y |Anal. Chem. 2011, 83, 4916–4923
Analytical Chemistry ARTICLE
inside the ESI emitter. Although the band broadening of CE infree solution has been extensively studied,21�23 these studiesmainly focus on on-column peak broadening factors such asinjection length, longitudinal diffusion, wall adsorption and Jouleheating, and little attention has been paid to the postcolumnband broadening issues. In this work, we investigated the flowprofiles of the CE effluent and the chemical modifier inside theflow-through micro vial and the effects of these flows on the peakshapes through both numerical simulation and CE-MS experi-ments. It is demonstrated that, the MS detected peak would notbe distorted significantly with the presence of a low flow chemicalmodifier inside the nanoliter postcolumn volume micro vial. Theapproach established in this work is also applicable for studyingsimilar postcolumn band broadening issues in liquid chromatog-raphy and chip-based separation techniques24 with differenttypes of postcolumn detectors.
’THEORY
The mass balance equation (eq 1) governs the mass transportprocess in the micro flow-through vial, depicted in Figure 1A, and
in turn determines the band broadening of a chemical speciescoming through the CE-MS interface.25
DcDt
¼ �vB•rcþr•ðDrcÞ þ R ð1Þ
The right side of eq 1 includes three terms: the convective fluxterm, �vB•rc, the diffusion flux term, r•(Drc), and thechemical reaction term, R. For the notations used in eq 1, c isthe concentration of a species, t is the time, vB is the net velocity ofthis chemical species,D is the diffusion coefficient of the chemicalspecies in the medium and R is the chemical reaction rate. In fact,the origins of all the contributors to the peak width can be foundin the mass balance equation. For example, in capillary zoneelectrophoresis, injection length determines the initial conditionof the mass balance equation; longitudinal diffusion is attributedto the diffusion flux term; analyte�analyte interaction and analyte-wall interaction are related to the kinetics of chemical reactionterm R; and pressure induced laminar flow, Joule heating, tem-perature gradients, electromigration dispersion, nonuniform elec-tric filed are all sources of nonuniform net velocity, vB. Accordingly,the band broadening caused by the postcolumn volume can also beanalyzed by the mass balance equation. Because the geometry ofthe micro vial at the tip is irregular and the flow inside is driven bypressure, the nonuniform flow pattern is the major source ofpostcolumn band broadening.
’MODELING
Because of the complexity of micro vial geometry and thedifferential equations used to describe the flow patterns, we haveto recourse to the finite element method to solve the flow fieldand mass transport process in the micro vial. Three dimensionalmodels simulating the flow-through micro vial were constructedusing the commercial software package COMSOL Multiphysics3.5 (COMSOL Inc., Los Angeles CA).26 Concentration profilesunder different conditions after peaks pass through the micro vialwere generated by solving the momentum balance and massbalance equations sequentially and then compared to the peakprofiles in UV detection and MS detection experiments.Geometry. The configuration of sprayer tip was described in
detail previously.13 The length of the tapered part of the stainlesssteel tip was measured to be 700 μm after beveling. As shown inFigure 1B, the geometry of the open flow-through micro vial wasestablished in a three-dimensional Cartesian coordinates system.The micro vial was enclosed by the end of the fused silicacapillary column and the inner surface of the tapered stainlesssteel tube. The gap between outer surface of the silica capillaryand the inner wall of the straight part of the stainless tube was26 μm and gradually shrinks to 10 μm at the end of the silicacapillary. The micro vial was composed of two parts, a parabolic-shaped micro chamber followed by a 75 μm ID straight microchannel which ends with a 60 degree beveled angle. The distancefrom the end of silica capillary to the outlet of the micro vial is600 μm. The volume of the parabolic part of the micro vial wasestimated to be 15.5 nL by domain integration with COMSOL,and the volume of the straight channel part was 1.4 nL. Thecombined contribution to band broadening from both parts isestimated in this paper.Meshing parameters were set as follows: maximum element
size scaling factor 0.35, element growth rate 1.35, mesh curvaturefactor 0.3, mesh curvature cutoff 0.005, resolution of narrowregions 0.85, and maximum element size on the boundaries for
Figure 1. A. Schematic of the micro flow-through vial of a junction-at-the-tip capillary electrophoresis mass spectrometry interface. A 360 μmouter diameter CE column is inserted into the stainless steel emitter andthe space enclosed by the end of CE column and inner surface ofstainless steel tip forms an open flow-through micro vial for CE outlet.The CE effluentmixes with themodifier solution inside themicro vial. B.Geometry of the micro flow-through vial established in COMSOLwhere the electro osmotic flow mixes with the modifier solution. Themicro vial was composed of two parts, a parabolic-shaped micro chamberand a 75 μm ID straight micro channel which ends with a 60 degreebeveled angle. Both parts may contribute to band broadening. Thelength of the tapered part of the stainless steel tip was 700 μm. Thedistance from the silica capillary end to the outlet of the stainless steel tipwas 600 μm. The gap between the outer surface of the silica capillary andthe inner surface of the stainless steel tip began from 26 μm and shrankto 10 μm gradually. The OD of the silica capillary was 360 μm and IDwas 50 μm.

4918 dx.doi.org/10.1021/ac200636y |Anal. Chem. 2011, 83, 4916–4923
Analytical Chemistry ARTICLE
modifier entrance 20 μm. Total number of mesh elementswas 35698.Physical Conditions. Figure 2 depicts the general process of
the physical modeling. First, the hydrodynamic flow inside themicro vial was solved by the Navier�Stokes equation (eq 2)coupled with continuity equation for incompressible continuum(eq 3), where vB is the velocity vector, p is the static pressure, F isfluid density, η is dynamic viscosity, and I is the identity matrix.
FðvB•rvFÞ ¼ r•½�pI þ ηðrvF þ ðrvFÞTÞ� ð2Þ
r•vF ¼ 0 ð3ÞEquation 2 states a balance between inertia force and the sum ofpressure gradient and viscous friction of the fluid. It is assumedthat the density and viscosity of the fluid are constants, and thevelocity field does not vary with time once it reaches the steadystate. For simplicity, the physical parameters of water at 25 �Cwere used for the fluid mixture inside the micro vial.The steady state solution of the velocity field was obtained
with the boundary conditions listed below (eqs 4�6):
vF ¼ 0 ð4Þ
vF ¼ v0 nB ð5Þ
p ¼ 0 ð6ÞEquation 4 is the boundary condition for the inner surface of themicro vial, which implies that the fluid at the wall is stationary.Equation 5 is set as the boundary conditions for the entrances ofCE bulk flow and modifier flow, and v0 corresponds to the linearvelocity of electroosmosis flow or modifier flow respectively, andnB indicates the flow direction is normal to the boundary.Equation 6 gives the boundary condition for the outlet of themicro vial.Numerical solutions of the incompressible Navier�Stokes
equations vB(x,y,z) were stored in the model and passed ontothe next step for solving the mass balance eq 7 along with theseinitial condition and boundary conditions (eqs 8�12):
DcDt
¼ �vB•rcþr•ðDrcÞ ð7Þ
c ¼ 0 at t ¼ 0 ð8Þ
c ¼ f ðtÞ ð9Þ
c ¼ 0 ð10Þ
nB•ð �Drcþ cvFÞ ¼ 0 ð11Þ
nB•ð �DrcÞ ¼ 0 ð12ÞElectromigration in the micro vial region was not considered
here since the surface of the metal needle has a uniform voltageand so the potential gradient inside the micro vial is negligible.The diffusion coefficient was estimated as 5 � 10�10 m2/s forsmall molecules, as we found that the longitudinal diffusion is notsignificant in such a short time scale (several seconds) for thepeaks passing through the micro vial. Equation 8 is the initialcondition of the overall domain which defines that no analyte fillsthe micro vial at the beginning. In eq 9, f(t) is a function of timethat describes the concentration of analyte at the entrance for CEbulk flow, which could be a constant, a well-defined Gaussianfunction, or fitted curve of UV traces in the following simulation.Equation 10 is the boundary condition for the modifier entrance.Equation 11 defines that there is no normal flux across the innerwall of the micro vial. Equation 12 confines the material flux atthe outlet boundary to be convective only. Time-dependentsolver was chosen for the mass balance equation (eq 7). Theinitial time step was set as 0.005 s, and the maximum time stepwas set as 0.02 s. Solutions c(x, y, z, t) were saved every 0.02 or0.04 s. All the calculations were done by a PC with an AMDAthlon 64 � 2 dual core processor and 4G RAM.
’EXPERIMENTAL SECTION
Material. Tryptophan, DOPA (D, L-3,4-dihydroxyphenyl-alanine) and epinephrine were purchased from Sigma-Aldrich(St. Louis, MO, USA) . Ammonium acetate buffer (0.1 M pH3.1) was from Beckman Coulter; isopropanol (HPLC grade) andformic acid (88%), dimethyl sulfoxide (DMSO) were fromFisher Scientific (Nepean, Ont., Canada). Fused silica capillary(75 and 50 μm ID, 360 μmOD) was purchased from PolymicroTechnologies (Phoenix, AZ). A polyethylenimine (PEI) capillarycoating solution was obtained from Gelest, Inc. (Morrisville,PA). All analytes were dissolved in the ammonium acetate buffer,stored at �4 �C, and diluted to 50 μM before use.Instrumentation. CE-UV experiments were performed on a
P/ACE MDQ capillary electrophoresis system (Beckman Coul-ter Inc., Fullerton, CA). A 50 μm ID, 78 cm long (68 cm todetection window) PEI coated capillary was used for separation.Samples were injected by 0.5 psi pressure at the inlet for 14 s.Ammonium acetate buffer (0.1 M pH 3.1) was used as thebackground electrolyte (BGE). Before each run, the capillary wasrinsed with the BGE for 3 min. During the separation,�16.2 kVwas applied across the capillary to generate an electroosmoticflow toward the capillary outlet. The composition of the buffer inthe outlet vial was the same as the chemical modifier that wouldbe used in the CE-MS experiments. The UV detection wave-length was set at 200 nm. 10% DMSO spiked in the run bufferwas used as the EOF marker. The cartridge temperature was setat 27 �C during the separation.CE-ESI-MS experiments were performed by coupling a P/
ACE MDQ electrophoresis system with a modified capillarycartridge (Beckman Coulter Inc., Fullerton CA) for external
Figure 2. Illustration of the physical modeling process and boundaryconditions. Numerical solutions of the Navier�Stokes equation werepassed on to the mass balance equation to solve concentration distribu-tion of analyte in the micro vial.
4919 dx.doi.org/10.1021/ac200636y |Anal. Chem. 2011, 83, 4916–4923
Analytical Chemistry ARTICLE
detectors, which could host both the capillary for separation andthe capillary for chemical modifier delivery, and a MicromassQ-TOF 1E mass spectrometer (Waters, Milford MA) withthe nanospray source replaced by our homemade interface.The setup for the CE-ESI-MS interface had been describedpreviously.13 The major parameters for MS operation were set asfollows: source temperature 120 �C, cone voltage 16 V, scanrange 160 to 220 amu, scan time 0.5 s, and inter scan delay 0.1 s.To match the experimental conditions used in UV detection asmuch as possible, a 50 μm ID, 68 cm long PEI coated capillarywas used for separation. The 0.1 M pH 3.1 ammonium acetatebuffer was used as the BGE, and the isopropanol/water/formicacid (v/v/v) 75/24.8/0.2 mixture was used as the chemicalmodifier. Samples were injected by 0.5 psi pressure at the inletfor 12 s to load the same amount of sample as that of the CE-UVexperiment. To obtain the same electric field strength applied asfor UV detection,�10.1 kV was applied at the CE inlet, and 4 kVwas applied at the electrospray needle. A 75 μm ID, 80 cm longbare fused silica capillary was used for chemical modifier delivery.The pressure applied at the modifier vial was 1�4 psi, to generatea flow rate of 60�240 nL/min. All of the CE-MS separationswere operated under room temperature without coolant circulation.
’RESULTS AND DISSCUSSION
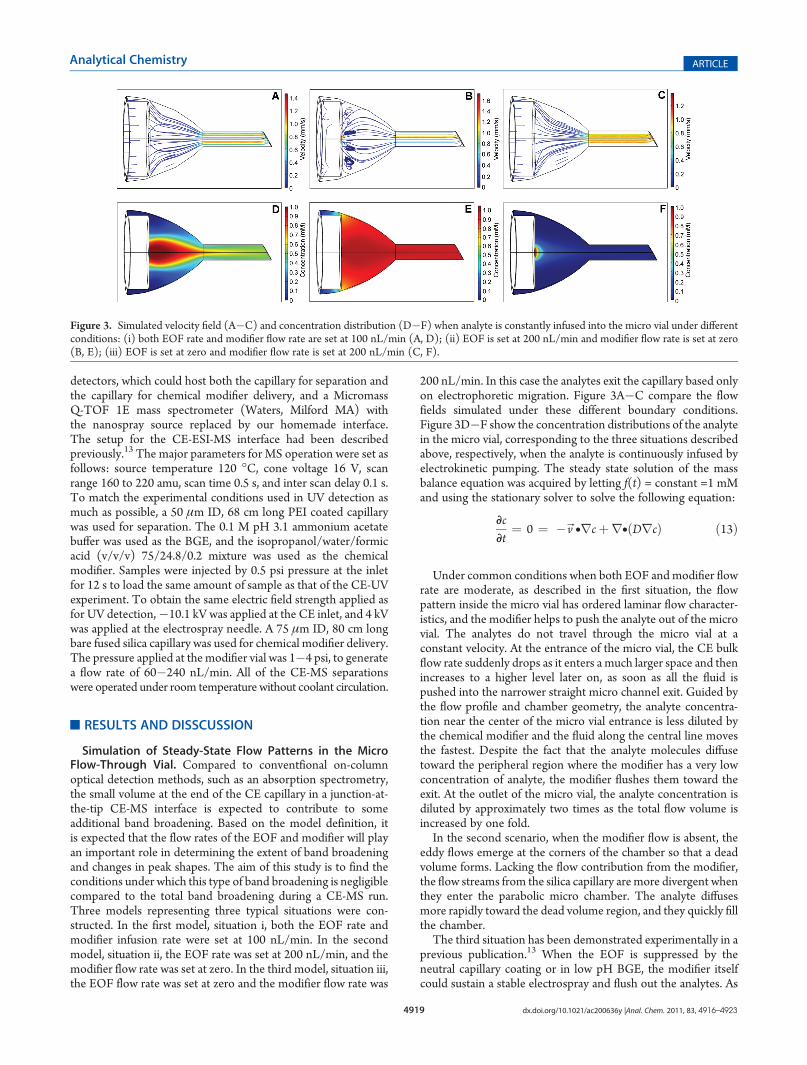
Simulation of Steady-State Flow Patterns in the MicroFlow-Through Vial. Compared to conventfional on-columnoptical detection methods, such as an absorption spectrometry,the small volume at the end of the CE capillary in a junction-at-the-tip CE-MS interface is expected to contribute to someadditional band broadening. Based on the model definition, itis expected that the flow rates of the EOF and modifier will playan important role in determining the extent of band broadeningand changes in peak shapes. The aim of this study is to find theconditions under which this type of band broadening is negligiblecompared to the total band broadening during a CE-MS run.Three models representing three typical situations were con-structed. In the first model, situation i, both the EOF rate andmodifier infusion rate were set at 100 nL/min. In the secondmodel, situation ii, the EOF rate was set at 200 nL/min, and themodifier flow rate was set at zero. In the third model, situation iii,the EOF flow rate was set at zero and the modifier flow rate was
200 nL/min. In this case the analytes exit the capillary based onlyon electrophoretic migration. Figure 3A�C compare the flowfields simulated under these different boundary conditions.Figure 3D�F show the concentration distributions of the analytein the micro vial, corresponding to the three situations describedabove, respectively, when the analyte is continuously infused byelectrokinetic pumping. The steady state solution of the massbalance equation was acquired by letting f(t) = constant =1 mMand using the stationary solver to solve the following equation:
DcDt
¼ 0 ¼ �vB•rcþr•ðDrcÞ ð13Þ
Under common conditions when both EOF and modifier flowrate are moderate, as described in the first situation, the flowpattern inside the micro vial has ordered laminar flow character-istics, and the modifier helps to push the analyte out of the microvial. The analytes do not travel through the micro vial at aconstant velocity. At the entrance of the micro vial, the CE bulkflow rate suddenly drops as it enters a much larger space and thenincreases to a higher level later on, as soon as all the fluid ispushed into the narrower straight micro channel exit. Guided bythe flow profile and chamber geometry, the analyte concentra-tion near the center of the micro vial entrance is less diluted bythe chemical modifier and the fluid along the central line movesthe fastest. Despite the fact that the analyte molecules diffusetoward the peripheral region where the modifier has a very lowconcentration of analyte, the modifier flushes them toward theexit. At the outlet of the micro vial, the analyte concentration isdiluted by approximately two times as the total flow volume isincreased by one fold.In the second scenario, when the modifier flow is absent, the
eddy flows emerge at the corners of the chamber so that a deadvolume forms. Lacking the flow contribution from the modifier,the flow streams from the silica capillary aremore divergent whenthey enter the parabolic micro chamber. The analyte diffusesmore rapidly toward the dead volume region, and they quickly fillthe chamber.The third situation has been demonstrated experimentally in a
previous publication.13 When the EOF is suppressed by theneutral capillary coating or in low pH BGE, the modifier itselfcould sustain a stable electrospray and flush out the analytes. As
Figure 3. Simulated velocity field (A�C) and concentration distribution (D�F) when analyte is constantly infused into the micro vial under differentconditions: (i) both EOF rate and modifier flow rate are set at 100 nL/min (A, D); (ii) EOF is set at 200 nL/min and modifier flow rate is set at zero(B, E); (iii) EOF is set at zero and modifier flow rate is set at 200 nL/min (C, F).

4920 dx.doi.org/10.1021/ac200636y |Anal. Chem. 2011, 83, 4916–4923
Analytical Chemistry ARTICLE
seen in Figure 3C, the flow streams that originate from thechemical modifier entrance converge into the center of micro-chamber and eventually go into the exit channel.Simulation of Band Broadening for a Transient Analyte
Peak. To get a clear view of the processes occurring as a peakpasses through the micro vial, we simulated the situation where aGaussian peak with amplitude of 1 mM, standard deviation of 4 sexits the CE capillary. To make such simulation possible, we firstdefined
f ðtÞ ¼ e�1=2� t � 124ð Þ2 ð14Þ
and the transient solutions of the mass balance equation were thencalculated. The averaged concentrations on the outlet boundary ateach time step for the above three types of situations were sent to aspreadsheet and plotted versus time in Figure 4. From these data, itcan be concluded that it only takes at most 4 s for the peak centerto travel through themicro vial under the circumstance that EOF is
absent; and the peak widths in the time domain are increased by nomore than 3 s compared to the original peak.Figure 5 illustrates the time progress as a Gaussian peak travels
through themicro vial in Situation (i). The analyte concentrationexiting the CE capillary reaches a maximum at 12 s, while theoutlet of the micro vial experiences maximum concentration at15 s. During the first half of the Gaussian peak, the concentrationdistribution shows a profile that is similar to the steady statesolution in Figure 3D. The analyte zone expands when it comesout of the 50 μm ID fused silica capillary, and this zone graduallyshrinks in the radial direction as the parabolic chamber shrinks toa 75 μm ID channel. The radius of the sample stream could beapproximated as the sum of the radius of hydrodynamic flowstreams that originate from the 50 μm ID capillary and thediffusion induced radius.27 As the second half of the Gaussianpeak enters the micro vial, the concentration of analyte exitingthe capillary decreases and the rear part of the analyte concen-tration distribution also reveals a parabolic profile. Throughoutthe 20 s process, the analyte zone is always kept in the central partof the chamber.Experimental Verification of Modeling Results. For the
purpose of investigating peak broadening in the postcolumnregion experimentally, CE-UV and CE-ESI-MS runs were con-ducted separately. Tryptophan, DOPA, and epinephrine werechosen as analytes because they all possess UV-absorbent func-tional groups and basic amine groups that are easily ionized bypositive ion ESI. The effective capillary length, sample injectiontime, field strength, and background electrolytes were arrangedto be consistent in the UV and MS runs, in order to eliminateband broadening caused by other factors when comparing thepeak widths. As coolant circulation was not available in our CE-MS experiments, the cartridge temperature for the UV runs wasset at room temperature (27 �C), to offset heating from the UVlamp. In the UV experiment, the outlet vial contained thechemical modifier solution used for CE-MS experiment insteadof background electrolyte in order to simulate the situation thatthe end of the silica capillary was surrounded by themodifier flowduring the CE-MS runs. The linear velocity of EOF wasmeasured to be 2.043 � 10�3 m/s (∼240 nL/min), and themodifier flow rate as 3.28 � 10�5 m/s (∼60 nL/min) for 1 psipressure applied at the modifier vial. Variation of the detectedMS signal intensity under different modifier flow rates was
Figure 4. Simulation of peaks eluted from the micro vial if a transientGaussian peak (peak height 1 mM, peak center 12 s, standard deviation4 s) is injected into the micro vial. A three parameter Gaussian functionf(x) = Aexp(�1/2(x� x0)/σ)
2) was used to fit the eluted curves underdifferent situations: (i) both EOF rate and modifier flow rate are set at100 nL/min, A = 0.461 mM, x0 = 14.90 s, σ = 4.381 s; (ii) EOF is set at200 nL/min and modifier flow rate is set at zero, A = 0.772 mM, x0 =15.04 s, σ = 4.693 s; (iii) EOF is set at zero andmodifier flow rate is set at200 nL/min, A = 0.118 mM, x0 = 16.11 s, σ = 4.336 s.
Figure 5. Simulated time progress of analyte concentration distribution in themicro vial when aGaussian peak (peak height 1mM, center 12 s, standarddeviation 4 s) is injected with the EOF rate of 100 nL/min and the modifier flow rate of 100 nL/min.

4921 dx.doi.org/10.1021/ac200636y |Anal. Chem. 2011, 83, 4916–4923
Analytical Chemistry ARTICLE
insignificant and this suggests that the MS detector responds tothe mass flux of analytes under these conditions. Therefore, thedilution effect is not a concern.According to the above parameters determined experimentally,
the EOF and modifier linear velocities were used as boundaryconditions in the numerical simulation to generate the flow field inthe micro vial for different modifier delivery rates. UV data wereexported as ASCII files using 32Karat software (BeckmanCoulter,LA) and then imported to Origin 7.0 to perform baselinesubtraction and normalization. The peak data were then importedinto COMSOL Multiphysics to define the function f(t) in eq 9.These data were interpolated by piecewise cubic functions and theuser defined function served as the boundary conditions for theEOF entrance in the mass balance equation. The convective fluxon the outlet boundary was integrated for each time step, normal-ized to the maximum point, and then plotted versus time tosimulate the real peak detected by MS.Figure 6 shows the comparisons of UV peaks, simulated MS
peaks, and MS detected peaks for three analytes under different
modifier flow rates. The time scale in this figure does not reflectthe analyte migration time in the whole separation process; itstarts from the moment that the front of the analyte peak entersthe micro vial. The UV traces of tryptophan and DOPA havesymmetric Gaussian profiles, while the epinephrine peak isfronting due to electromigration dispersion.28 Table 1 sum-marizes the peak width (4 times of standard deviation) of allthe UV, simulated and MS peaks.The fact that several MS peaks show longer tailing than the
simulated ones suggests that there is some error in the model orsome variation in the experiments. Possible sources of errorin the modeling include: (i) the manufacturer’s tolerances limitthe geometric precision of the inner surface of the micro vial;(ii) uncertainty in the gap between the end of the CE column andmicro vial, which cannot be measured directly; (iii) the densityand viscosity of the fluid in the micro vial could vary with thevolumetric flow rate ratio of the EOF and the chemical modifier;(iv) numerical errors accumulated from solving the two differ-ential equations. There are also several possible sources of
Figure 6. Comparison of UV detected peaks, COMSOL simulated peaks, and MS detected peaks of tryptophan, DOPA, and epinephrine underdifferent modifier flow rate: (A, B, C, and D) trpyptophan, modifier flow rate 60, 120, 180, and 240 nL/min, respectively. (E, F, G, and H) DOPA,modifier flow rate 60, 120, 180, and 240 nL/min, respectively. (I, J, K, and L) Epinephrine, modifier flow rate 60, 120, 180, and 240 nL/min, respectively.EOF rate is 240 nL/min.
Table 1. Comparison of peak widths (in seconds) of UV detected peaks, COMSOL simulated peaks and MS detected peaks oftryptophan, DOPA and epinephrine
COMSOL simulated MS peak widths (s) MS detected peak widths (s)
Modifier flow rate (nL/min) Modifier flow rate (nL/min)
UV peak widths (s) 60 120 180 240 60 120 180 240
tryptophan 3.75 4.93 4.60 4.37 4.21 4.54 5.68 6.08 4.35
DOPA 3.96 5.12 4.79 4.56 4.39 5.30 5.30 5.25 4.65
epinephrine 5.11 6.21 5.86 5.63 5.48 6.09 7.29 7.70 5.57

4922 dx.doi.org/10.1021/ac200636y |Anal. Chem. 2011, 83, 4916–4923
Analytical Chemistry ARTICLE
experimental error: (i) the lack of temperature control in the CE-MS operation gives rise to extra band broadening caused bytemperature gradient and Joule heating; (ii) the liquid volume ofthe Taylor cone that resides on the beveled sprayer tip surfaceincreases as the total flow rate goes up, which might also becomea source of dead volume when the modifier flow is relatively high;(iii) the data acquisition rate of MS detector was 0.6 s per scan,which is much slower compared to the time step set in themodeling; (iv) bubbles due to electrolysis inside the micro vialmight disturb the transportation process.Despite the possible systematic errors discussed above, the
results shown in Figure 6 and Table 1 provide us some insight onthe extra band broadening that arises from the postcolumndispersion. Since the variance of a peak is additive for indepen-dent contributors of band broadening,29 provided that theenvironmental differences when running the UV and MS experi-ments are negligible, we can assume that the total variance ofthe MS peak is the sum of variance of the UV peak and thevariance attributed to postcolumn band broadening, and thus itcould be written as
σ2MS ¼ σ2
injection þ σ2diffusion þ σ2
other þ σ2postcolumn
¼ σ2UV þ σ2
postcolumn ð14ÞFrom Figure 4, when the injected peak width is 16 s,
postcolumn variance is 15�27% of the total variance of thesimulated MS peak, depending on the EOF and modifier flowrate. From data in Table 1, when the EOF flow rate is very fastand UV peaks are extremely narrow (peak width 3.7�5.1 s), thesimulation results suggest that 13�42% of the total variance iscontributed by postcolumn dispersion as the modifier flow ratevaries. Compared to the UV peaks, the variance of the detectedMS peaks increased from 15% to 62%, which might also includeband broadening induced by other factors such as temperaturegradient and Taylor cone dead volume. It is also clear thatpostcolumn band broadening varies with different operationalconditions. Because of the additivity of variance,29 the percentagecontribution from the postcolumn band broadening to the totalpeak variance of a wider on-column peak will be smallercompared to a sharper on-column peak. Under certain condi-tions of modifier flow rate, the postcolumn variance is minimaland most of the UV peak features, like the fronting peak ofepinephrine, are preserved in the MS peak shape (Figure 6I�L).Thus, with careful optimization of flow rates, the peak shape maynot be significantly affected by the postcolumn volume in themicro flow-through vial in the junction-at-the-tip configuration.
’CONCLUSIONS
The flow dynamics and mass transport processes inside themicro flow-through vial of “junction-at-the-tip” CE-MS inter-faces can be simulated using finite element method by construct-ing three-dimensional models in COMSOL Multiphysics. Thesimulation results demonstrate that the flow profile inside themicro vial is laminar when a low flow rate of modifier solution isused. The chemical modifier helps to flush the analyte moleculesout of the micro chamber and keeps them from stagnating in themicro vial, and thus the peak shape is not distorted with thepresence of the chemical modifier. The numerical predictionswere verified by experimental results. Comparison of peaksobserved by UV detection and MS detection reveals that themain features of the UV peak have been retained in the MS peak,although the peak width may increase to some extent depending
on the width of the peak entering the micro vial, the electro-smotic flow rate and the modifier flow rate. Nevertheless, thepostcolumn band broadening can be minimized by optimizingthe composition and flow rate of the chemical modifier. Thisstudy also provides an easy-to-use numerical approach to studygeneral postcolumn band broadening issues in other separationtechniques. The simulations can approach the experiment resultscloser by having finer meshing of the geometries if the computa-tion power allows, and better temperature control with liquidcooling of the whole capillary in real experiments.
’AUTHOR INFORMATION
Corresponding Author*Tel: 604 822 0878. Fax: 604 822 2847. E-mail: [email protected].
’ACKNOWLEDGMENT
This work was supported by grants from Beckman CoulterInc. (Brea, CA, USA) and the Natural Sciences and EngineeringResearch Council (NSERC) of Canada.
’REFERENCES
(1) Olivares, J. A.; Nguyen, N. T.; Yonker, C. R.; Smith, R. D. Anal.Chem. 1987, 59, 1230–1232.
(2) Michalke, B.; Schramel, O.; Kettrup, A. Fresenius' J. Anal. Chem.1999, 363, 456–459.
(3) Preisler, J.; Hu, P.; Rejtar, T.; Moskovets, E.; Karger, B. L. Anal.Chem. 2002, 74, 17–25.
(4) Takada, Y.; Sakairi, M.; Koizumi, H.Anal. Chem. 1995, 67, 1474–1476.
(5) Mol, R.; de Jong, G. J.; Somsen, G. W. Electrophoresis 2005,26, 146–154.
(6) Maxwell, E. J.; Chen, D. D. Y.Anal. Chim. Acta 2008, 627, 25–33.(7) Axen, J.; Axelsson, B. O.; Jornten-Karlsson, M.; Petersson, P.;
Sjoberg, P. J. R. Electrophoresis 2007, 28, 3207–3213.(8) Zamfir, A. D. J. Chromatogr. A 2007, 1159, 2–13.(9) Moini, M. Anal. Chem. 2001, 73, 3497–3501.(10) Cao, P.; Moini, M. J. Am. Soc. Mass Spectrom. 1997, 8, 561–564.(11) Fang, L. L.; Zhang, R.; Williams, E. R.; Zare, R. N. Anal. Chem.
1994, 66, 3696–3701.(12) Moini, M. Anal. Chem. 2007, 79, 4241–4246.(13) Maxwell, E. J.; Zhong, X.; Zhang, H.; van Zeijl, N.; Chen,
D. D. Y. Electrophoresis 2010, 31, 1130–1137.(14) Maxwell, E. J.; Zhong, X.; Chen, D. D. Y. Anal. Chem. 2010,
82, 8377–8381.(15) Lewis, K. C.; Opiteck, G. J.; Jorgenson, J. W.; Sheeley, D. M.
J. Am. Soc. Mass Spectrom. 1997, 8, 495–500.(16) Liu, C. C.; Alary, J. F.; Vollmerhaus, P.; Kadkhodayan, M.
Electrophoresis 2005, 26, 1366–1375.(17) Chen, Y. R.; Tseng, M. C.; Chang, Y. Z.; Her, G. R. Anal. Chem.
2003, 75, 503–508.(18) Tseng, W. C.; Chen, Y. R.; Her, G. R. Anal. Chem. 2004,
76, 6306–6312.(19) Hsieh, F.; Baronas, E.; Muir, C.; Martin, S. A. Rapid Commun.
Mass Spectrom. 1999, 13, 67–72.(20) Liu, C. C.; Zhang, J. Z.; Dovichi, N. J. Rapid Commun. Mass
Spectrom. 2005, 19, 187–192.(21) Gas, B.; Kenndler, E. Electrophoresis 2002, 23, 3817–3826.(22) Gas, B.; Stedry, M.; Kenndler, E. Electrophoresis 1997,
18, 2123–2133.(23) Huang, X. H.; Coleman, W. F.; Zare, R. N. J. Chromatogr. 1989,
480, 95–110.(24) Kleparnik, K.; Otevrel, M. Electrophoresis 2010, 31, 879–885.

4923 dx.doi.org/10.1021/ac200636y |Anal. Chem. 2011, 83, 4916–4923
Analytical Chemistry ARTICLE
(25) Giddings, J. C. Unified Separation Science; Wiley-IntersciencePublication: New York, 1991.(26) COMSOL Multiphysics User’s Guide 3.5a [DVD]; COMSOL
AB: Los Angeles, CA, 2008.(27) Cheng, Y. F.; Wu, S. L.; Chen, D. Y.; Dovichi, N. J. Anal. Chem.
1990, 62, 496–503.(28) Gebauer, P.; Bocek, P. Anal. Chem. 1997, 69, 1557–1563.(29) Sternberg, J. Adv. Chromatogr. 1966, 2, 205–270.
’NOTE ADDED AFTER ASAP PUBLICATION
This paper was published on theWeb onMay 17, 2011 with anerror in equation 1. The corrected version was reposted on May20, 2011.