massachusetts energy and environment report card construction and demolition recycling ... on the...
TRANSCRIPT

Massachusetts Energy and Environment Report Card
Y e a r T w o

This reporT was prepared by The following organizaTions:
Charles River Watershed Association, a research and advocacy non-profit, uses science,
advocacy, and the law to restore, protect, and enhance the Charles river, its watershed,
and public access. it promotes sustainable water resource management policies and
practices with a focus on water quality, streamflow and habitat, green infrastructure,
water conservation, and climate change resiliency.
Clean Water Action works to protect our environment, health, economic well-being and
community quality of life. our goals include clean, safe and affordable water; prevention
of health threatening pollution; creation of environmentally safe jobs and businesses;
and empowerment of people to make democracy work.
Conservation Law Foundation forges lasting solutions to environmental challenges for
the people of new england. Clf takes on powerful opponents who would pollute our air
and water and squander our resources. our deep local knowledge, legal acumen, and
policy expertise make Clf a prime mover in building our clean energy future, countering
climate change, and safeguarding our communities.
Environmental League of Massachusetts is committed to combating climate change
and protecting our land, water, and public health. by creating diverse alliances and building
the power of the environmental community, we use our collective influence to ensure
Massachusetts is a leader in environmental and economic sustainability.
Environment Massachusetts is a statewide, citizen-funded environmental advocacy
organization. our staff and members work to protect Massachusetts’ air, water and
open spaces through grassroots organizing, coalition-building, public education,
and direct advocacy.
Massachusetts Rivers Alliance’s mission is to protect and restore the Commonwealth’s
rivers and streams. The organization works to strengthen statewide river policies in four
areas: water quality, stream flow, wildlife habitat, and investment in green infrastructure.
we also strengthen, connect, and unify our 60+ member organizations in support of
shared river protection goals.
Massachusetts Sierra Club’s mission is to inspire and empower humanity to explore,
enjoy, and protect the wild places of the earth. we aim to help accelerate the transition to
100 percent carbon-free electricity by 2030, to replace carbon-based fuels in other sectors
by 2040, to protect the natural environment of Massachusetts, to represent member concerns
effectively at state and local levels, and to promote diversity, equity, and inclusiveness.
For more information, please contact Nancy Goodman, Vice President for Policy at the Environmental League of Massachusetts at [email protected] or 617-742-2553.

MASSAChuSEttS EnERgy And EnviRonMEnt REpoRt CARd yEAR tWo 1
Contents
overview .......................................................................................................................2
Budget ..........................................................................................................................6
Energy and Climate Change .........................................................................................10
energy efficiency ....................................................................................................11
renewable energy .................................................................................................12
reducing global warming pollution .........................................................................14
gas pipelines ........................................................................................................15
Modernizing the electric grid and Utility regulation ..................................................17
electric Vehicles ....................................................................................................18
reducing Transportation sector emissions ..............................................................21
Water .........................................................................................................................23
drought preparedness and Management .................................................................24
delayed water Management act permits .................................................................25
proposed Changes to the interbasin Transfer act .....................................................26
delegation of water pollution Control programs ........................................................27
stormwater Management .......................................................................................28
Environmental Justice ..................................................................................................29
Land Conservation .......................................................................................................31
Reducing the use of toxic Chemicals ...........................................................................33
Solid Waste .................................................................................................................35
Tracking solid waste Metrics ..................................................................................36
decreasing Municipal solid waste disposal .............................................................37
increase Construction and demolition recycling ......................................................38
waste bans...........................................................................................................39
protecting the environment from dangerous waste facilities .....................................40

2 MASSAChuSEttS EnERgy And EnviRonMEnt REpoRt CARd yEAR tWo
overview
The results of the 2016 presidential elec-
tion promise to be devastating for prog-
ress in protecting our natural resources
and public health. we are already seeing
rollbacks and budget cuts with more to come.
The federal agencies charged with maintaining
minimum environmental standards, conducting
reputable climate science and keeping the public
safe from environmental threats are now being
led by secretaries and administrators who have
publicly questioned and attacked environmental
programs and policies. The white house has
declared its intent to gut reasonable federal
efforts to curb emissions. similarly, the white
house has proposed massive federal spending
cuts on clean energy, efficiency, and other envi-
ronmental programs. we also are witnessing
overt efforts to boost the use of dirty fossil
fuels such as tar sands and coal.
What was important last year is now vital now more than ever, states need to lead on envi-
ronment and energy issues. in Massachusetts,
we pride ourselves on our innovative environ-
mental regulations and policies and working to
encourage other states, especially in new england
and the northeast, to take up active regional
leadership on these issues.
but there is much more to be done. advocates
and the baker administration need to work together
to make sure that we have strong protections
in place and that we are promoting cutting edge
policies and technologies that will make us healthier
and safer and contribute to our economy.
So, how are we doing?This assessment evaluates how the baker admin-
istration is performing in managing the state’s
environmental and energy programs through the

MASSAChuSEttS EnERgy And EnviRonMEnt REpoRt CARd yEAR tWo 3
grade
C
while we saw some improvements this past year in a few areas, this progress is overshadowed by:
• environmental agencies that are struggling with deep budget cuts and drastic staff reductions.
• a set of energy policies that continue to support the construction of gas pipelines which undermines good progress on energy efficiency and renewables.
• a transportation system that likely won’t be able to meet our citizens’ future travel needs in ways that are consistent with the long range requirements of the global warming solutions act.
executive office of energy and environmental
affairs (eea). it is our attempt to both recognize
the achievements of the past year and identify
where the administration needs to do more.
we continue to see attention paid to energy
and climate change, but other important environ-
mental issues are not getting the consideration
they deserve.
We also continue to feel the impact of budget cuts and staff losses. We simply cannot do more with less at this point.
last year, we offered two dozen recommendations
on a wide array of issues that would have helped
the Commonwealth move toward stronger environ-
mental protection and enhanced public health.
Unfortunately, only a few were adopted.
administration coming into office. That said,
the baker administration is now in charge and
responsible for carrying out the state’s work on
environment and energy issues. we also note
that this report is not comprehensive; the authors
selected and assessed issues that are major
environmental and energy priorities.
Key developments since last yeara number of developments stand out from the
past year. in July, the legislature passed and the
governor signed an omnibus energy bill that will
lead to significant increases in the use of renew-
able energy, particularly offshore wind. several
important energy policies, however, did not survive
the legislative process such as an increase in the
renewable portfolio standard. we will be pushing
for enactment of those policies this session.
work on the important issue of energy storage is
moving forward with support from the administration.
The administration also has proposed a new
approach to promoting solar energy that currently
is being reviewed. and, in september of last year,
governor baker issued executive order 569 deal-
ing with climate change. The e.o. acknowledges
that “climate change presents a serious threat
to the environment and the Commonwealth’s resi-
dents, communities, and economy” and it directs
the agencies to develop policies and strategies
to help us meet our mandated greenhouse gas
we saw slight improvements in land protection,
energy efficiency and reducing the use of toxic
chemicals and a lower grade for environmental
justice with other grades static. we added a num-
ber of new important and timely issues along with
a new section on solid waste (see table, page 5).
This year, we sought out a number of knowledge-
able outside stakeholders including municipal rep-
resentatives, legislators, energy experts, academics,
and policy innovators. we asked them about their
views on priorities and their sense of how or
whether the administration was making progress.
we have included their input as appropriate.
we recognize that some of the concerns raised
in this assessment existed prior to the baker
OVERALL GRADE
With one more year
under their belt, but very
little to no improvement
on many priority issues, we
once again give the state a C on their
overall performance in managing and
leading on environment and energy.
Bottom Line

4 MASSAChuSEttS EnERgy And EnviRonMEnt REpoRt CARd yEAR tWo
all of this is good news not only because it
advances our efforts to address climate change
but also because the clean energy sector is one
of the fastest growing job sectors in the state.
The most recent Clean energy Center’s Jobs
report found that clean energy is now a $11.8
billion industry in Massachusetts, and represents
2.5 percent of the Commonwealth’s gross state
product. Clean energy jobs represent 2.9 percent
of the overall workforce in the state—and these
are well-paying jobs. The clean energy industry
employs residents of every region in Massachu-
setts. More than 6,300 new clean energy jobs
were added in 2016, and for the first time the
sector has more than 100,000 jobs.
on the bad news side of the ledger, Massachu-
setts experienced the worst drought since the
1960s. This summer, many rivers throughout
Massachusetts experienced record low flows,
and many tributary streams and portions of some
major rivers, such as the ipswich and parker, went
dry. The drought also posed a challenge for public
water suppliers when several local municipal
water sources became too depleted to meet
demand. The state’s response was ineffective
and points to new challenges and a need for
new approaches.
with climate change scientists predicting increases
in both floods and droughts, we need to prepare
for both extremes. The most effective, immediate,
and least costly way to achieve this is to conserve
water during a drought. More information on this
issue can be found in the water section of the
assessment.
The clean energy sector is one of
the fastest growing job sectors in the
state. The most recent Clean Energy
Center’s Jobs report found that clean
energy is now a $11.8 billion industry
in Massachusetts, and represents
2.5 percent of the Commonwealth’s
Gross State Product.
emission reductions and prepare our communities
for the impacts of climate change.
in May of last year, the Massachusetts supreme
Judicial Court (sJC) released a decision in Kain
et al v. MassDEP affirming the state’s obligations
under the global warming solutions act and order-
ing the Commonwealth to create and implement
new regulations to meets its carbon emission
reduction mandates. This was an extremely
important victory and led to Massdep drafting
new regulations that will reduce emissions from
a number of different sources.
Three months later in august 2016, an equally
significant sJC decision was issued that rejected
a natural gas “pipeline tax;” an attempt by pipe-
line companies and electric utilities—supported
by the baker administration—to shift the burden
of paying for new gas pipelines onto electric
ratepayers. private pipeline companies will now
need to find other ways to finance their projects.

MASSAChuSEttS EnERgy And EnviRonMEnt REpoRt CARd yEAR tWo 5
In the past, Commonwealth leaders
of both parties have been held to
high standards and have led our
environment and energy programs to
be among the very best in the country.
Regrettably, we do not see that same
leadership on environmental issues
from Governor Baker.
Leadership and vision on the environmentleaders set a direction, build an inspiring vision,
and motivate their team to be dynamic in reaching
that vision. The team, in turn, sorts out priorities
and sets goals so they (and in this case, the
public) can evaluate progress and determine
if goals have been achieved.
in the past, Commonwealth leaders of both parties
have been held to high standards and have led
our environment and energy programs to be among
the very best in the country. in their own ways,
governors weld, Cellucci, swift, romney and
patrick were all leaders who made environmental
progress in areas including defending our car
emission standards, acquiring and managing
public lands, implementing cutting-edge regula-
tions to reduce pollutants from power plant
smokestacks, protecting our rivers, and develop-
ing and implementing the regional greenhouse
gas initiative (rggi) to reduce carbon emissions.
regrettably, we do not see that same leadership
on environmental issues from governor baker.
while he is engaged and cares about other impor-
tant concerns from addressing the opioid crisis
to reducing health care costs, compared to these
other issues, we see lackluster leadership on
the environment. The governor is known for his
management skills, but we have not seen evidence
of this translating to the environmental agencies.
even more importantly, the governor has yet to
communicate a comprehensive environmental
vision or to provide focus and energy to eea. This
vision and energy are essential for unleashing the
state agencies to do their best and producing the
results that the Commonwealth very much needs.
at the highest level, this assessment points
to the fact that the agencies need to be staffed,
funded and inspired in a much more powerful
way moving forward. Many of the specific results
described here are the fall-out of this lack of
vision and leadership.
Grade Comparisons
2016 2017
overall C C
Budget C C
Energy and Climate Change
• Energy Efficiency b b+
• Renewable Energy C+ C+
• Reducing Global Warming Pollution n/a b-
• Gas Pipelines d d
• Modernizing the Grid n/a incomplete
• Electric Vehicles b+ b+
• Reducing Transportation Emissions d d
Water
• Drought Management n/a C
• Sustainable Water Mgt/Water Mgt Act Permits incomplete d
• Interbasin Transfer n/a C
• Stormwater Management C incomplete
• Delegation of NPDES d d
• Repeal of site specific criteria for lakes and ponds f n/a
Environmental Justice b– C–
Land Conservation b b+
toxic Chemicals use d C–
Solid Waste (new)
• Metrics d–
• Decreasing MSW Disposal d
• C & D Recycling incomplete
• Waste Ban—Food a
• Waste Ban Enforcement C
• Protect Environment from dangerous facilities b

6 MASSAChuSEttS EnERgy And EnviRonMEnt REpoRt CARd yEAR tWo
Budgetgrade
Ci
n the early 2000’s, environmental agencies
received a penny of every state operating dollar,
but with the state budget growing and environ-
mental funding remaining stagnant, environ-
mental agencies are currently receiving only half
a penny of every state budget dollar.
during the 2014 gubernatorial campaign, funding
the environmental programs was a high-level prior-
ity for most candidates and then-candidate Charlie
baker committed to devoting 1% of the state
budget for environmental programs by the end
of four years. since then as governor, he has
expressed his ongoing commitment to achieving
that level of investment, but his actions have not
matched his words. The governor has now issued
three budgets and we are no closer to 1%. in fact,
the governor’s fiscal year 2018 budget would
fund environmental programs at $12.5M less than
what the legislature allocated two years ago, prior
to the loss of more than 200 staff due to early
retirements. This represents a 5% cut.
highlights of the governor’s fy18 budget released
in January include:
• an increase of $2.3 million for the department
of environmental protection (Massdep) that
includes funding for five new inspectors for
compliance and enforcement
• an increase of $2 million to the executive
office of energy and environmental affairs
• an increase of $1.5 million for safe drinking
water act implementation
• an increase of $172,000 for the office of
dam safety
when we look agency-wide, however, and compare
the governor’s fy 2018 proposal to the budget
passed last year by the legislature, the governor’s
budget makes significant cuts to the department

MASSAChuSEttS EnERgy And EnviRonMEnt REpoRt CARd yEAR tWo 7
of Conservation and recreation (dCr) and the
department of agricultural resources (Mdar).
dCr, which manages state parks, parkways, and
forests, receives a cut of more than $4 million
(5%) and Mdar is cut by more than $800,000 (4%).
The table below shows funding levels over
the past few years. as the overall state budget
grows, environmental funding is not keeping pace.
Massachusetts cannot consider itself a pro-
environment state if it continues to significantly
underfund its environmental programs. we must
reverse this trend.
due to the early retirement program that went
into effect in 2015 and continued in 2016, hun-
dreds of long-time employees who had consider-
able expertise and were making significant contri-
butions to protecting our environment and public
health have left the agencies. some agencies,
such as Massdep, have been able to make up for
a portion of the losses, re-filling 30 of the 109
positions that were vacated through early retire-
ment (27%). however, the staffing level of approxi-
mately 650 is substantially lower than a few years
ago. More retirements are expected for 2017
(12 to 20 are anticipated).
it is worth noting that Massdep receives approxi-
mately $20M per year from the U.s. environmental
protection agency. in fy16, that covered 97 em-
ployees. with expected cuts to epa, Massdep
will likely lose federal funding. Therefore, our state
environmental agencies are going to be more de-
pendent on investments by the state and prioriti-
zation by the governor takes on heightened
importance.
even without likely federal budget cuts, recent
funding cuts and staff reductions mean the agencies
currently cannot adequately carry out their core
functions, not to mention some newer responsi-
bilities including addressing climate change and
sustainable water resource management. Mass-
dep has a major role to play in implementing the
governor’s climate change executive order, and
ensuring compliance with the supreme Judicial
Court’s decision directing the agency to issue new
regulations to comply with the global warming
solutions act. in addition, staff that were collect-
ing and tracking data for various environmental
programs are now gone or re-assigned.
decreased Enforcement for Serious Environmental violations one issue of serious concern is that Massdep’s
oversight—inspections and enforcement—has
gAA = general appropriations act (funds allocated by the legislature) h1 = governor’s fiscal year 2018 budget
As a candidate, Governor Baker
committed to devoting one percent of
the state budget to the environment.
The Governor has now issued three
budgets and we are no closer to one
percent. The impacts of insufficient
funding can be seen throughout the
environmental agencies.
Agency 2015 gAA Fy 2016 gAA Fy 2017 gAA Fy 2018 h1
dar $ 20,793,746 $ 23,242,351 $ 23,351,998 $ 22,526,376
dCr 85,520,812 90,190,723 86,856,407 82,441,224
dep 57,640,647 58,739,063 51,345,834 53,688,382
dfg 27,046,308 27,508,142 28,087,460 27,972,674
eoeea 28,864,579 30,862,097 29,805,877 31,391,043
environmental Total $ 219,866,092 $ 230,642,376 $ 219,447,577 $ 218,019,699
total State Budget $36,326,224,233 $38,161,680,347 $39,249,261,765 $40,909,016,091
Share of Budget Spending 0.61% 0.60% 0.56% 0.53%
Not Keeping Pace: environmental Budget by agency

8 MASSAChuSEttS EnERgy And EnviRonMEnt REpoRt CARd yEAR tWo
declined almost in lockstep with drastic decreas-
es in the agency’s funding and the resulting
staff losses. enforcement requires monitoring
data, inspections, and staff with the expertise to
evaluate and bring actions, all of which have been
deeply impacted by the budget cuts. since 2009,
Massdep’s budget has declined by 30 percent;
the agency has lost almost 45 percent of its
staff since 2000.
according to a recent story in the Boston Globe,
Massdep’s enforcement for serious violations
has declined by more than half since 2006 while
monetary penalties plummeted by nearly 75 per-
cent. in a number of recent cases, Massdep has
also forgiven the penalties provided the violator
complies with the terms of its consent order. and
while this has been an issue for years, since the
baker administration took office, Massdep has
conducted 1,000 fewer inspections and 1,000
fewer enforcement actions than the median
number during the past decade.
oversight and enforcement play a vital role in
environmental protection: not only does this en-
sure a level playing field for all, it also punishes
the violator and serves as a deterrent to others.
in 2016, Massdep assessed less than $2 million
in penalties. and because the attorney general’s
office primarily relies on referrals from Massdep
to bring major environmental prosecutions, it
is not surprising that fines in ag enforcement
actions are down by more than 50 percent since
2015. since these fines go to the state’s general
fund, this is a significant drop in this revenue
source. Coupled with the predicted decline in
federal enforcement over the next four years,
the state’s shrinking enforcement is bad news
for protection of our air and water.
Massachusetts State parks park users and friends groups from all over the
state have reported that underinvestment in our
parks and forests translates to limited recreational
opportunities and diminished quality of user
experiences. Campgrounds are closed, trails and
facilities are not maintained, programming for
children has been significantly scaled back, and
environmental laws are not being enforced (e.g.,
off road vehicle use in undesignated areas, illegal
camping, dumping of trash), making our parks
less safe.
Number of enforcement actions
Between 2006 and 2016, state officials conducted 52 percent fewer “higher level” enforcement actions for serious violations and 33 percent fewer lower level enforcement actions.
� high-level � low-level
5,000
4,000
3,000
2,000
1,000
02006 2016
source: The Massachusetts department of environmental protection
MASSAChuSEttS EnERgy And EnviRonMEnt REpoRt CARd yEAR tWo 9
we note that dCr is making progress in a number
of ways. in an effort to complete long-overdue
resource Management plans (rMps) for dCr
properties more quickly, the agency is now in-
corporating multiple units into a Complex. for ex-
ample, the blue hills Complex includes the blue
hills reservation along with about a dozen other
properties. in these rMps, the agency is honing
in on truly top priorities which will help focus
efforts and direct resources.
another positive recent development is a coor-
dinated improvement effort in four categories:
Customer Experience, Infrastructure & Operations;
Policy & Compliance; and Marketing & Communi-
cations. dCr staff is working in teams, with coor-
dination from eea, to identify major barriers to
effective work, ways to remove the barriers, and
what is needed to improve the flow of work. for
example, in operations, fleet management soft-
ware was purchased, additional fleet management
staff were hired, and the number of available
vehicle repair garages were increased for medium
and heavy duty repairs. Under customer experi-
ence, a constituent tracking tool is being created
to ensure issues are tracked and resolved in a
timely fashion.
an asset management system is still needed
and we hope that will be funded and implemented
soon so dCr and the dCr stewardship Council
can study what an optimal “base budget” should
be for the agency to operate at a predictable
but rigorously-applied level of performance.
R E C O M M E N D AT I O Nincrease funding for the environmental agencies so they can carry out their full responsibilities to protect the environment and public health. honor the commitment to dedicate one percent of the state budget to environmental protection.

10 MASSAChuSEttS EnERgy And EnviRonMEnt REpoRt CARd yEAR tWo
Energy and Climate Change
The year 2016 was the warmest on record.
There are no prospects for federal action
on climate change except the rollback
of programs and policies. it is up to the
states to forge ahead with bold new energy and
climate policies that will protect our environment
and public health as well as spur economic
development and speed the transition to phase
out carbon in our energy system.
from its top-ranked energy efficiency programs to
the global warming solutions act, Massachusetts
has enjoyed an energy and climate policy leader-
ship role among states. but to maintain our lead-
ership status, it is not enough to make incremen-
tal progress or coast on the success of policies
that are already in place. The baker administration
needs to aggressively expand the energy efficiency
and renewable energy sectors. There are now over
100,000 clean energy jobs in Massachusetts.
pursuing policies to continue to increase the diver-
sity of our energy mix with new renewables and
enhanced efficiency will help grow jobs as well
as protect human health and the environment.
governor baker signed the energy diversity act
into law last year. This law contains important
provisions to help foster offshore wind as well as
regional hydropower and new onshore wind. inde-
pendent studies1 quantified both the economic
and environmental benefits of adding additional
amounts of offshore wind to the power grid. The
baker administration is also working to comply
with a supreme Judicial Court decision that
requires the state to adopt new regulations to
reduce greenhouse gases and conform to the
requirements of the global warming solutions act.
while these are generally positive steps, there are
areas of concern. for example, cuts to the state’s
solar net metering program could jeopardize the
future growth of solar energy and the ability for
people from all walks of life to access solar power.
also, the baker administration remains a proponent
of new natural gas pipelines. rather than support-
ing new fossil fuel infrastructure, the baker admin-
istration should double down on energy efficiency
and new sources of renewable energy.

MASSAChuSEttS EnERgy And EnviRonMEnt REpoRt CARd yEAR tWo 11
EnERgy EFFiCiEnCygrade
B+Massachusetts has been pursuing greater energy
efficiency for more than a quarter century. Massa-
chusetts invests over $6002 million per year in
energy efficiency (ee) programs. These investments
are paying off in tangible ways that directly impact
the power system as well as greenhouse gas
emissions. each year, investments in ee result
in about 123 megawatts (Mw) of peak energy
savings.3 looking to the future, these ee programs
will deliver 723 Mw of peak energy savings between
2020 and 2025, according to analysis by iso new
england. This amount of savings is larger than
the new natural gas-fired footprint plant in salem.
The more the Commonwealth invests in ee, the
less dependent we are on fossil fuels for energy
production.
as we write this, we are working with the adminis-
tration to introduce legislation that would require
home sellers to perform an energy saving audit of
their properties and obtain an ee rating, similar to
a “miles per gallon” sticker on an automobile. we
applaud the administration for taking this action.
Cities such as portland, oregon and austin, Texas
have adopted similar requirements. if enacted,
Massachusetts could build on its ee leadership
and will be the first state to make this a require-
ment for home sales. however, even if the legisla-
tion passes, there is still significant room for im-
proving energy efficiency in a number of areas.
The baker administration and the department
of energy resources (doer) are in the middle of
implementing the 2016–2018 utility sponsored
ee plans. as with past ee plans, they focus heavily
on savings associated with the installation of
more energy efficient lighting. at some point in the
future, the lighting stock will be transformed from
the older incandescent lights to more efficient
We are working with the administration
to introduce legislation that would
require home sellers to perform an
energy saving audit of their properties
and obtain an EE rating, similar to
a “miles per gallon” sticker on an
automobile.
alternatives like leds. Therefore, it is critical that
as we move forward with ee plans, we include a
focus on other ee measures such as heating and
air conditioning systems and commercial equip-
ment that have not been as thoroughly converted
to more efficient technologies. in order to earn
their ee performance incentives, the utilities need
to do more in the next round of ee plans, espe-
cially in the commercial and industrial sphere.
The Commonwealth has made some progress
in the past to promote more efficient commercial,
residential and especially public buildings and
to reduce the overall environmental impacts
throughout their life cycle. in July 2016, the board
of building regulation and standards voted to
approve an update to the Massachusetts stretch
energy Code. The Massachusetts stretch code

12 MASSAChuSEttS EnERgy And EnviRonMEnt REpoRt CARd yEAR tWo
earned national accolades when first adopted in
2009, and as of January 2017, 190 municipali-
ties, comprising 65.8% of the state’s population,
have adopted the stretch code. These locally
adopted codes are more aggressive than our base
building codes, result in higher energy savings
and lower operating costs for the owner or
future operator.
Unfortunately, the changes made to the stretch
code in July were not nearly as ambitious as they
could have been. for example, in the commercial
building sector, the new stretch code exempts
buildings smaller than 100,000 square feet and
only applies to new buildings. This effectively
excludes much of the commercial construction
in the state. Modest improvements were made
on the residential side, but there the new stretch
code missed an opportunity to reach as many
homes as it could have. it is important that the
Commonwealth continue to work with cities and
towns to ensure that we take advantage of prog-
ress in the areas of new technology, sensor
based energy systems and energy innovation.
R E C O M M E N D AT I O N Sthe administration cannot maintain the status quo on energy efficiency. these additional issues deserve the attention and support of the Baker administration:• ExpandingthefocusofEEprogramsbeyond
lighting.• Re-establishingthescopeofthestretch
code in future versions to:– addresssmall-to-mediumcommercial
buildings– reincorporate requirements for existing
buildings– introduce energy audit/benchmarking
requirements similar to those included in building energy use disclosure ordinances in Boston and Cambridge.
More needs to be done to improve
energy efficiency in our buildings,
especially as new ones are being built.
The energy diversity act also requires utilities to
purchase a substantial amount of offshore wind
as well as onshore clean energy resources like
hydropower and wind. while the existing commit-
ment to 1600 Mw of offshore wind is a positive
step, Massachusetts has the potential to do much
more. it is critical for baker administration officials
to support stronger commitments to offshore
REnEWABLE EnERgygrade
C+wind, at the same time as they work to implement
existing commitments on schedule.
doer and the department of public Utilities (dpU)
are in the process of implementing these onshore
wind and hydropower requirements alongside the
Commonwealth’s electric utilities. a concerning
development in this process had been the utili-

MASSAChuSEttS EnERgy And EnviRonMEnt REpoRt CARd yEAR tWo 13
ties’ drafting of the clean energy request for pro-
posals in a manner that privileged large Canadian
hydropower resources over other large-scale
renewable resources, like onshore wind and solar.
as the parent companies of the two largest utilities,
eversource and national grid, have equity stakes
in transmission projects that propose to bring
large Canadian hydropower to Massachusetts and
that will likely bid into the request for proposals,
it is imperative that doer and dpU prevent the
utilities from stacking the deck in favor of their
own projects. fortunately, after receiving public
input, the utilities and doer made significant
changes to their proposed plan of action that
now create a more level playing field for onshore
wind and solar.
The bill also authorized doer to determine
whether to set targets for electric companies to
procure viable and cost-effective energy storage
systems by January 1, 2020. after commissioning
a widely praised and comprehensive study, State
of Change, at the end of 2016 doer decided to
do so. because energy storage will be crucial to
the successful integration of greater amounts of
intermittently available renewable resources like
solar and wind, it is imperative that the doer
set aggressive and meaningful storage targets.
Unfortunately, the baker administration’s record
on supporting solar energy is much weaker than
its support for large hydropower or even large-
scale renewables like onshore and offshore wind.
in 2015, governor baker filed a bill that would
have slashed the compensation for solar energy
under the state’s net metering program to levels
that would have been insufficient to support con-
tinued solar development. The final bill signed in
april 2016 represented a significant improvement
over the governor’s proposal, but still included
significant cuts to the value of net metering cred-
its. These cuts will have a particularly negative
impact on low-income communities, renters,
and others who are unable to install solar panels
on their roofs but would like to participate in
shared solar installations. To ensure the contin-
ued strength of Massachusetts’ solar industry,
the administration must commit to the continu-
ation of the state’s net metering program, and
ensure that the benefits of solar are available
for all residents.
eea began work in 2016 on a new solar incentive
policy aimed at replacing the existing solar
renewable energy Credit (sreC ii) program.
Under this new program, solar developers will
be compensated with a fixed price for each Kwh
of energy produced. These prices would vary,
depending on the location of the solar facility
(for example, new solar on a closed landfill would
To ensure the continued strength
of Massachusetts’ solar industry, the
administration must commit to the
continuation of the state’s net meter-
ing program, and ensure that the
benefits of solar are available for
all residents.
be compensated at a slightly higher rate than
solar on a farm field) and the customers they
would serve (here, new solar serving low-income
customers would be compensated at a slightly
higher rate than residential customers). we ap-
preciate the administration’s efforts to protect en-
vironmentally sensitive areas by providing greater
solar incentives in areas suitable for development.
because the development of this policy is ongoing
at the time of publication of this report, in-depth
analysis or grading is not possible. however, the
authors look forward to participating in the devel-
opment of this new incentive scheme and will
work to make it as robust as possible.
in 2016, the state funded four projects totaling
$2.3 million via the affordable access to Clean
and efficient energy initiative. The purpose of
this initiative is to help low- and moderate-income
Massachusetts residents access cost-saving,
clean and efficient energy technologies. This pro-
gram was set up in 2016 with $15 million and is
administered by doer and the Massachusetts
Clean energy Center (MassCeC). we encourage

14 MASSAChuSEttS EnERgy And EnviRonMEnt REpoRt CARd yEAR tWo
eea to expand this program to help better serve
low- and moderate-income residents.
while the energy diversity act was a good step
toward meeting Massachusetts’ needs for clean
energy, that journey is far from complete. numer-
ous renewable energy-related bills have been filed
in the 2017–2018 legislative session, including
an increase in the renewable portfolio standard
that would continue to spur the creation of clean
energy jobs in the Commonwealth and reduce our
greenhouse gas emissions. The administration
should make clean and renewable energy a prior-
ity in each legislative session, beginning with
support for the rps increase.
R E C O M M E N D AT I O N S • EnsurethatDOERandtheDPUallocate
sufficient resources and staff to implement both the offshore wind and onshore clean energy resource procurements on schedule.
• Ensureabalancedprocessofreviewingproposals that ensures an appropriate role for renewable resources in the clean energy Request for proposals.
• Assesstheneedforadditionaloffshorewindresources above and beyond the requirements in the Energy diversity bill.
• Setmeaningfulandaggressiveenergystoragetargets for 2020 in line with doER and MassCEC’s State of Charge report.
• Ensurethecontinuedavailabilityofsolarnet metering by supporting the elimination of the net metering cap and restoration of fullretailratenetmeteringforlow-incomeand community solar projects.
• Supporttheproposedincreaseinthe Renewable portfolio Standard so that the program can continue to support local renewable energy and jobs in the renewable energy industry.
• Takeallnecessarystepstoensurethatthesiting of new energy infrastructure is done in a responsible manner and minimizes harmful impactstonaturalresourcesincludingagri-cultural soils, wildlife habitat, forests and pro-tected lands, while also maximizing our ability to take advantage of Massachusetts’ renew-able energy potential.
in response to a decision by the supreme Judicial
Court in 2016, eea has been working to draft new
regulations to meet the global warming solutions
act’s (gwsa) legal requirement to achieve a 25%
reduction in total greenhouse gas emissions by
2020.4 The currently proposed rules generally move
the state in the right direction to reduce green-
house gas emissions, but more is needed to
REduCing gLoBAL WARMing poLLution
grade
B–comply with the Court’s order. in particular, it is
concerning that the transportation sector emis-
sions limits are not enforceable as proposed, and
the proposed cap on fossil fuel-fired power plants
is inadequate to ensure the necessary emissions
reductions. we also note that the gwsa includes
language that regulations required by the act
will expire in 2020 and this must be addressed.

MASSAChuSEttS EnERgy And EnviRonMEnt REpoRt CARd yEAR tWo 15
in the latest update to its Clean Energy and Climate plan, EEA stated that there is a “substantial risk” that the Commonwealth will not meet the 2020 limit, based on analysis indicating that even with existing programs and policies, our 2020 emissions may be as much as five million tons in excess of that limit. in order to comply
with the Court’s order—which requires regulations
that ensure we, in fact, do not exceed the 2020
limit—the rules must be designed to address,
and remove, that risk.
the Regional greenhouse gas initiative (rggi),
is another critical program that has supported
clean energy and energy efficiency in Massachusetts
while reducing carbon pollution. it is now time
to move expeditiously to reach agreement on the
program review to extend the rggi emissions
cap from 2020 to 2030 and to reduce the overall
emission cap. To their credit, officials in the baker
administration were the first among the rggi
states to pledge support for doubling the rate at
which emissions decline each year, from 2.5% per
year to 5% per year. Unfortunately, since then, the
administration has retreated from committing to
a specific target for rggi. To strengthen rggi, we
need governor baker to articulate a strong vision
for the program’s future, reaffirm his commitment
to a 5% per year emissions reduction, and encour-
age his fellow governors to get on board.
R E C O M M E N D AT I O N S• ConcludetheGWSArulemakingsinatimely
and efficient manner that ensures compliance with the Act and the associated Supreme Judicial Court decision.
• Maketherules’proposedtransportationsector emissions limits enforceable.
• SupporteffortstoextendtheGWSAregula-tions to 2050. Set a goal of a 50% emissions reduction from 1990 levels by 2030 to be on the path to meet reductions of 80% by 2050.
• Tightentheproposedcaponin-stateelectricpower plants by at least 1 million tons of Co2.
• Reaffirmthecommitmenttothe5%reductionin greenhouse gas emissions currently being considered under the Regional greenhouse gas initiative program review.
• Establishthecarbonreductionresearchcenter that was authorized by the energy diversity legislation in 2016.
• Supportlegislationthatwouldputapriceoncarbon—an approach that would send strong market signals to spur the transition to a clean energy future.
governor baker and eea leadership continue
to push for new natural gas pipelines in the face
of evidence of significant long-term decreases
in new england’s demand for natural gas over
the lifetime of those proposed pipelines and the
gAS pipELinESgrade
Dimplementation of iso-ne’s federally-approved
electricity market program designed to ensure
the reliability of our electric power system in the
absence of new gas pipelines. new england must
use less, not more, gas over the next thirty years

16 MASSAChuSEttS EnERgy And EnviRonMEnt REpoRt CARd yEAR tWo
in order to meet our state’s climate mandates and
regional climate goals. The governor’s approach
ignores the need for policies that would mitigate
the Commonwealth’s current overreliance on natu-
ral gas for electric generation. in addition to alter-
natives to natural gas, the Commonwealth has
non-pipeline natural gas supply infrastructure (par-
ticularly liquefied natural gas import and storage
infrastructure) that could be used to meet our
current needs while the energy system transitions
to low or non-emitting energy sources. Continuing
to support the interests of natural gas pipeline
companies rather than searching for more targeted
and cleaner solutions to our energy needs is
not in the best interests of the people of the
Commonwealth.
would apply to Ch4 emissions from main and
service lines owned by gas operators with gas
system enhancement plans (gseps) (a subset
of all of the leaking pipelines).
This is expected to reduce emissions by less than
one tenth of a percent of the total Co2e reduc-
tions projected for 2020. further, Massdep did
not address emissions from liquefied natural
gas (“lng”) storage or import facilities, or above-
ground natural gas distribution equipment. per-
haps worse, the department doesn’t include the
longer term leak reduction requirements for 2030,
2040, or 2050, nor does the department set de-
clining emissions caps to 2050 for this industry
in the proposed requirements, although in their
request for comments they sought information
on those aspects of the proposal.
while these percentages may appear small,
methane (the greenhouse gas component of
natural gas, and the majority of natural gas air
emissions), even in small amounts causes
significant near term climate damage. Methane’s
global warming potential is 87 times that of Co2
in the 20 years after it is emitted.
R E C O M M E N D AT I O N S• Giventheenvironmentalandeconomiccostof
new pipelines and the legal challenges facing current pipeline efforts, the Baker administra-tion should reconsider its approach to natural gasinfrastructurebytakinganevidence-based look at what the Commonwealth’s precise needs for natural gas are in the short-tomid-term.
• InvitethemarkettoprovidethecheapestGWSA-compliantsolutionstomeetthoseneeds.
• Takestrongerandcontinuedstepstocontrolmethane emissions. this is imperative if Massachusetts is to meet its gWSA mandated greenhouse gas emissions reduction of 80 percent from 1990 levels by 2050.
Continuing to support the interests
of natural gas pipeline companies
rather than searching for more targeted
and cleaner solutions to our energy
needs is not in the best interests of
the people of the Commonwealth.
Accounting for and Stopping Methane Leaksin addition to adding pipelines, existing pipelines
are a large source of emissions that is being un-
derestimated in our climate protection planning.
according to Massdep, between 1.1 and 1.3 per-
cent of gross ghg emissions from Massachusetts
in recent years (2011–2013), and 2.4 percent in
1990 on a Co2e global warming potential (“gwp”)
basis, were from natural gas systems in the
Commonwealth.
To address this, Massdep proposed methane re-
duction requirements aimed at reducing methane
(Ch4) emissions from natural gas distribution
mains and services by establishing mass-based,
annually declining aggregate limits. The limits

MASSAChuSEttS EnERgy And EnviRonMEnt REpoRt CARd yEAR tWo 17
ModERnizing thE ELECtRiC gRid And ELECtRiC utiLity REguLAtion
incomplete
The energy system in Massachusetts is under-
going a significant transition as consumer-centric
technologies upend the historic model of simply
supplying energy to consumers. Utilities face
expectations to accommodate and promote dis-
tributed solar, efficiency, smart energy manage-
ment, and energy storage, even as these tech-
nologies challenge current regulatory structures.
Clearly, reforms are required to move beyond the
historic model of centralized power stations and
large utility infrastructure to a 21st century energy
system that takes full advantage of smart and
efficient appliances, electric vehicles and other
storage, and rooftop solar.
customer costs; 3) integrating distributed resources;
and 4) improving workforce and asset manage-
ment. Currently, the dpU fails to tie utility earnings
to grid modernization outcomes. without making
this link we are unlikely to shift utilities’ current
financial incentive from building infrastructure
to meeting system needs at lowest cost.
Utility responses to the order in 2015 were insuf-
ficient in addressing the fundamental challenges
and opportunities in the transition to a clean,
distributed, customer-centric energy system. na-
tional grid outlined the most ambitious investment
plan, with deployment of advanced metering infra-
structure to enhance consumer energy options
and control, and optimize the operation of the
system. national grid failed, however, to ade-
quately prepare for integration of distributed en-
ergy resources and the transition from a one-way
power delivery model to a multi-directional, net-
worked system. eversource focused on upgrading
grid-side infrastructure rather than focusing on
consumers and did not provide a strategic plan for
adapting to shifts in the energy system and using
distributed technologies to deliver lower, more
stable energy costs. Unitil also presented a modest
proposal, predicated in part on prior installation of
metering infrastructure with limited functionality.
The dpU has worsened the situation with multiple
delays in the proceedings. filings were made in
august 2015, and decisions should have been
made in 2016. however, due to the delays, hearings
Massachusetts needs to modernize
its electric grid to accommodate new
technologies and ways of generating
and distributing electricity. We need
to align incentives to utilities to
hasten this transition.
in recognition of the new challenges and opportu-
nities presented by new technologies and active
consumers, in 2014 the Massachusetts depart-
ment of public Utilities (dpU) ordered utilities to
develop plans focusing on four grid modernization
objectives: 1) reducing the effects of outages;
2) optimizing demand and reducing system and

18 MASSAChuSEttS EnERgy And EnviRonMEnt REpoRt CARd yEAR tWo
are currently scheduled for May 2017. To make
matters even more difficult, the dpU recently
authorized eversource to shift consideration
of key investments from the grid modernization
proceeding to eversource’s general rate case.
This shift raises numerous questions, and leaves
an uncertain path forward.
separately from the investment-focused grid
modernization proceedings, national grid and
eversource have proposed major changes to
electricity rate design that would seriously impact
consumers and lower incentives for energy effi-
ciency and clean energy investments. in 2016,
the dpU laudably denied national grid’s proposals
for tiered customer charges and unreasonable
access fees for clean distributed generation.
More recently, eversource has made a range of
rate design proposals that would lower incentives
for energy efficiency and clean energy investments
and move away from rates that provide incentives
for customers to help manage system costs.
without improvements in grid modernization
plans, Massachusetts utilities will struggle to
adapt to accelerating trends toward an increas-
ingly networked, electrified, and low-carbon energy
system. without improved business models, the
utilities will not have the incentive to propose
such plans. without greater transparency, coordi-
nation and stakeholder engagement, Massachusetts
will fail to develop a consistent and broadly-
supported plan to modernize the grid. without
improved rate structures, customers will not have
the proper incentives to increase the efficiency of
the electric system. neighboring states, including
rhode island and new york, are taking steps to
address all of these issues and Massachusetts
is at risk of falling behind.
R E C O M M E N D AT I O N S• Completethecurrentgridmodernization
proceedingsandinitiateaGridModerniza-tion 2.0 proceeding that (1) aligns utilities’ financial incentives with grid modernization objectives, (2) establishes a consumer advi-sory board for grid modernization to promote transparency and stakeholder support for investments, (3) optimizes usage of clean local energy resources for the benefit of consumers,and(4)protectslow-incomeconsumers.
• Examineoptionstorequireutilitiestofullyconsider cheaper clean local energy alterna-tives to traditional infrastructure investments.
• Denyutilityproposalsforratesthatlowerincentives for energy efficiency and clean generation and promote rates that give proper incentives to consumers.
ELECtRiC vEhiCLESgrade
B+in december 2016, the baker administration
announced $12 million in funding for the Common-
wealth’s electric vehicle rebate program (Mor-eV).
Consumers can qualify for rebates ranging from
$750–$2,500 on the purchase or lease of more
than 25 qualifying new electric vehicles (eVs), includ-
ing battery electric, plug-in hybrid electric and fuel
cell vehicles. This continues to be a good program.

MASSAChuSEttS EnERgy And EnviRonMEnt REpoRt CARd yEAR tWo 19
in addition, the Mor-eV program statistics offer
interactive access to data collected by the agencies
and include a variety of information about the
adoption and distribution of eVs in Massachusetts.
while we have concerns about outsourcing govern-
ment obligations, the Center for sustainable en-
ergy’s program administration of this data offers
a great example of how to dashboard data in an
open and transparent fashion. Updated twice a
month, this dashboard offers an interesting and
useful picture of the progress of the Mor-eV
program. it would be a great step forward for
other agencies to use a similar approach in-house
for comparable programs.5
several other positive developments this past
year have supported the adoption of eVs in Mas-
sachusetts. some of these developments were
not the direct result of eea actions but we note
all of them to give a fuller picture of the current
eV landscape.
• The Massachusetts legislature passed a bill
(s. 2505), promoting the adoption of zero-emis-
sion vehicles and measures to reduce barriers
to eV ownership. The act prohibits subscription
fees or membership requirements from being
imposed on eV drivers using publicly accessible
charging stations. additionally, municipalities
can now designate certain parking spaces
for drivers of eVs.
• if approved by the department of public Utilities,
over the next 5 years, eversource plans to
The Commonwealth’s electric vehicle
rebate program offers excellent and
interactive access to data collected
and is a great model for state govern-
ment in general. This data is updated
twice a month and presents an inter-
esting and useful picture of the adop-
tion and distribution of EVs in Massa-
chusetts. It would be a great step
forward if other agencies adopted a
similar approach to data collection
and transparency.
dealer or Store City Quantity
Tesla Motors, inc. Multiple 1,051
Quirk Chevrolet braintree 317
Marcotte ford holyoke 100
smart Center boston somerville 99
herb Chambers bMw boston 81
herb Connolly Chevrolet framingham 74
Colonial Chevrolet acton 68
Marlboro nissan Marlborough 67
Mirak Chevrolet arlington 62
watertown ford watertown 62
herb Chambers ford braintree 58
acton ford acton 52
herb Chambers Chevrolet danvers 49
bMw of peabody peabody 45
Muzi Chevrolet needham 44
source: https://mor-ev.org/program-statistics. data is updated semi-monthly. last updated: March 24, 2017.
top eV Retailers by Rebates Rebates by Vehicle category
Drivers Who Have or plan to install a level 2 charger
BEV battery electric Vehicle
(all electric)PHEV
PHEV+ plug-in hybrid electric Vehicle with battery capacity > 10kwh (powered by electricity and gasoline)
plug-in hybrid electric Vehicle with battery capacity < 10kwh (powered by electricity and gasoline)
Have a plan to install
61.9%No charger
38.1%

20 MASSAChuSEttS EnERgy And EnviRonMEnt REpoRt CARd yEAR tWo
develop up to 4500 charging ports at over 500
sites, and national grid has outlined a three-
year plan to help develop over 1200 charging
ports at 140 sites, ramping up eV charging
infrastructure and, ideally, favorable rates and
smart charging and load balancing policies
in the Commonwealth.
• The Massachusetts department of Transpor-
tation has installed eV fast charging stations
(which can charge an eV in 20 minutes) at six
service plazas along the Massachusetts Turnpike.
• Massachusetts has proposed new regulations
to cap greenhouse gas emissions from state
fleet passenger vehicles, which incentivizes
the Commonwealth to own or lease greater
numbers of eVs.
• in survey data of the state’s Mass drive
Clean 2015 eV test drive campaign, consumer
perception of eVs improved among 83 percent
of participants. expansion of the program
will help engage and introduce potential
consumers to eVs.
finally, in 2016, the Commonwealth added three
electric buses in the pioneer Valley Transit agency
(pVTa) area, taking the total count of electric
buses in operation or committed in the state to
about 14—far short of what is needed to meet
the state’s climate goals and expand access
to clean transportation.
R E C O M M E N D AT I O N S• Massachusettsshouldwiselyinvestthe
$69 million plus in funds available through the volkswagen Environment Mitigation trust to accelerate investment in zero emission vehicles such as electric transit buses, school buses and port vehicles, including using the full 15 percent of funds available for charging infrastructure.
• Focusefforts,suchastheEVIncentivePilotprogram and Ev car sharing, to promote Ev adoptioninlow-incomecommunitiesacrossthe state that are most affected by poor air quality.
• WhilenotinEEA’sdirectpurview,theCom-monwealth needs a comprehensive plan to advance the deployment of electric buses in towns and cities across Massachusetts. Massachusetts should commit to: (i) incorpo-rating 100 electric buses into our public transit fleets by 2019; (ii) 50% of new bus purchases are electric by 2025; and (iii) 100% of new buspurchasesareelectricby2030.Low-income residents and people of color, who are disproportionately exposed to urban air pollution and often dependent on city buses, should not have to suffer from the health impacts of diesel or Cng buses and would greatlybenefitfromcleanerzero-emissionbuses.vW settlement funds provide an opportunity to prioritize procurement of electric buses.
• Massachusettsshouldcommittohaving100% of owned or leased passenger vehicles in state fleets be Evs by 2020. the mandated doER and department of transportation study on adoption of Evs by state fleets is an oppor-tunitytosetaggressivetargetsforelectrifi-cation of the state vehicle fleet.
• EEAshouldadvocatefortheBoardofBuildingRegulations and Standards to include “Ev
Pre-wiring during construction is
cheaper than retrofitting, and expand-
ing the number of EV-ready buildings
in the Commonwealth is an
important goal.
however, Massachusetts made limited progress
on some of the key issues identified in 2016.
an important provision in the recently passed
eV bill referenced above that would have required
new residential and commercial buildings to be
pre-wired for eV charging was weakened from
a requirement to a recommendation. pre-wiring
during construction is cheaper than retrofitting,
and expanding the number of eV-ready buildings
in the Commonwealth is an important goal.
Massachusetts electric utilities made no meaning-
ful progress in establishing “time of use rates”
in 2016 to reduce charging costs and ensure
charging does not take place during periods of
peak electricity demand.

MASSAChuSEttS EnERgy And EnviRonMEnt REpoRt CARd yEAR tWo 21
Ready” requirements in the state building code.
• DOERshouldcollaboratewithISO-NewEng-land and other new England states to study regulatory barriers and solutions to effectively incorporating Evs into our electricity grid.
• TheDepartmentofPublicUtilitiesshouldrequire electric utilities to incorporate broader consideration of Evs and Ev charging into their “grid modernization” plans.
• EEAshouldtaketheleadinestablishingaprocess for group purchase of Evs to allow
state agencies to maximize their buying power.• EEAshouldtaketheleadindevelopinginitia-
tives to strengthen the consumer Ev shopping experience at auto dealerships through train-ing salespersons on Ev technology and pro-grams that incentivize dealerships to sell more electric vehicles through awards and recognition.
• DOERshouldtaketheleadindevelopingand promoting the establishment of an Ev car-sharingpilotprogram.
This issue bridges the agencies and while it is
not primarily the responsibility of the energy or
environment agencies, it is necessary to include
here as the state is not planning adequately to
meet our citizens’ transportation needs over time,
while also meeting the economy-wide goals of the
global warming solutions act. given the long time
frame for transportation planning, if decisions and
policy guidance are not started now, it is unlikely
we will meet our long-range targets.
The transportation sector is now the largest single
source of greenhouse gases (ghgs), producing
37% of the Commonwealth’s total emissions
(2014), more than the electric sector (see chart
below). The lack of progress in reducing transpor-
tation emissions remains disappointing and dem-
onstrates a lack of vision and innovation on the
part of the baker administration. even as the
courts found that the state wasn’t meeting its
obligations under the gwsa, the review of new
REduCing tRAnSpoRtAtion SECtoR EMiSSionS
grade
Dtransportation measures was uninspired and
in the end, may not meet the key legislative and
judicial tests.
in addition to being an environmental issue,
transportation sector energy needs is an economic
issue. our continued dependence on oil, none of
which is produced in-state, and the public health
impacts of burning transportation fuels, provide
many reasons for new and pioneering approaches
to reducing transportation energy use.
for example, in 2014 Massachusetts citizens
and businesses used more than 3 billion6 gallons
of transportation fuel and spent over $8 billion
dollars for the privilege. and, we do this annually.
Reducing our transportation energy consumption would keep billions of dollars in state that could create jobs and strengthen the economy. this willtakeleadershipandlong-termthinking.

22 MASSAChuSEttS EnERgy And EnviRonMEnt REpoRt CARd yEAR tWo
Greenhouse Gas emissions by Sector
0
5
10
15
20
25
30
35
40
1990 1995 2000 2005 2010 2015 2020
ThetransportationsectorisnowthelargestsourceofGHGemissions.Thedottedlinesrepresentbusiness-as-usualprojections.
R E C O M M E N D AT I O N S• Trackalltransportationfuelsenteringthe
state by fuel type.• Addressthetransportationfundingcrisis
through leadership and honest talk with the taxpayers of the Commonwealth—we need to raise additional revenue for transportation. Ban the sale of gasoline vehicles by 2030 and set a goal of zero transportation emissions by 2050.
• TasktheEnvironment,Energy,HousingandEconomic development and transportation agency heads to work together to reduce emissions from the transportation sector.
• Putapolicyemphasisonshiftingcarandtruck traffic to lower polluting modes and reducing vehicle miles of travel (vMts) through transit improvements, land use changes, and transportation demand management measures.
• Continuetoimprovetheenergyefficiencyofvehicles through continued legal connection with the California Car program.
• TakealeadershiproleintheTransportationand Climate initiative (tCi) working across the northeast to agree on a package of mar-ket-basedstrategiesandpublicinvestmentsto reduce transportation sector emissions by 30 to 40 percent by 2030, while creating tens of thousands of new jobs. We feel that more than ever, it is time for Massachusetts and governor Baker to bring the northeast gover-nors together to move this initiative forward.
• Offercitiesandtownsincentivesandoptionsfor development that require less vehicle travel, or that is capable of being served by low carbon transit services.
Mill
ion
Met
ric T
ons
of C
o2 e
quiv
alen
t transportation
Electricity Consumption
Residential
Commercial
industrial

MASSAChuSEttS EnERgy And EnviRonMEnt REpoRt CARd yEAR tWo 23
Water
Massachusetts’ freshwater resources
are crucial to human and environmen-
tal health and to sustaining a strong
economy. as climate change brings
increased droughts and floods, managing these
vital natural resources—surface waters, wetlands
and groundwater—to meet these challenges is
more important than ever. governor baker’s recent
executive order 569, establishing “an integrated
Climate Change strategy,” provides a directive for
“strategies that conserve and sustainably employ
the natural resources of the Commonwealth to
enhance climate adaptation, build resilience and
mitigate climate change.”
Measures to make our water resources more resil-
ient fall squarely within the imperative of climate
change adaptation. independent decision-making
by cities and towns about water resources simply
will not suffice as we experience the effects of
climate change—change that will only exacerbate
our current water shortages and flood vulnerability.
These challenges require state-level leadership.
when reviewing the administration’s record on
water policy and programs, we see progress on
some issues, but little to no movement on others.
we continue to be concerned that the state con-
tinues to lack an overall vision and plan for
sustainable water resources management.
as noted in last year’s assessment and again
this year, budget cuts and early retirements have
hit Massdep hard. Massdep has lost 30% of its
staff since 2009. The agency continues to strug-
gle to carry out core programs for safeguarding
water quality and ensuring our rivers and streams
don’t run dry. enforcement of environmental laws
has declined and permits are being delayed be-
cause of these deep budget cuts and staff losses.

24 MASSAChuSEttS EnERgy And EnviRonMEnt REpoRt CARd yEAR tWo
work still not getting done or backlogged includes:
• issuing timely water supply permits and
conducting five-year permit reviews;
• Monitoring, assessing, reporting and research
on water quality and quantity around the state;
• developing Total Maximum daily load analyses
(water pollution control plans) required under
the federal Clean water act for the state’s
water bodies; and
• enforcing water permit conditions—i.e., water
withdrawal and pollution discharge limits and
conservation standards.
bright spots include the work of the division of
ecological restoration (der) within the depart-
ment of fish and game. der provides technical
assistance to municipalities and watershed
groups and project management for dam remov-
als, culvert replacements, and other river restora-
tion work. its tiny budget should be increased to
enable it to play a larger role in climate resiliency
and adaptation. The administration also has pro-
vided grant support for municipalities and farmers
to encourage water conservation, and funding
to encourage regional collaboration to improve
stormwater management. we are hopeful that
the work in progress by the drought Management
Task force to revise the state’s drought Manage-
ment plan will result in improved drought
preparedness and resilience.
Two related issues that warrant attention are
lead in drinking water and more broadly, water
infrastructure. The situation in flint, Michigan has
brought the lead issue to light and to its credit,
the administration is taking steps to test for lead
in our schools. $2 million from the Massachusetts
Clean water Trust has been released to help pub-
lic schools test for lead and copper in drinking
water. Massdep is providing technical assistance
to ensure that public schools can sample taps
and water fountains and replace pipes and outlets
that exceed safe levels. in March 2016, the Mas-
sachusetts water resources authority approved
a program to make available $100 million in
interest-free loans to its member communities to
replace lead service lines. but the pressing need
to deal with our crumbling water infrastructure
remains. The lack of attention to this issue has
persisted for many years but with data from a
2012 water infrastructure finance Commission
report, we now know the magnitude of the prob-
lem: the Commission identified a more than $20
billion need over the next 20 years. we look to
the administration and legislature to take action.
dRought pREpAREdnESS And MAnAgEMEnt
grade
CThe current drought, which began in 2015 and
worsened last summer to extreme drought in
many parts of the state, resulted in record low
flows in rivers and streams. Many tributary
streams and portions of some major rivers, such
as the ipswich and parker, went dry, stranding fish
and stressing wildlife. The drought also posed
a challenge for public water suppliers, with six

MASSAChuSEttS EnERgy And EnviRonMEnt REpoRt CARd yEAR tWo 25
seeking emergency declarations from Massdep
and several others forced to purchase water at a
much higher cost from regional suppliers because
their local water sources were too depleted to
meet demand for drinking water and firefighting.
farmers were particularly hard hit by the drought
as irrigation needs increased and available water
sources decreased. about 80 percent of farmers
that responded to a federal survey reported
losing at least 30% of a specific crop.
eea and its agencies were very slow to respond to
the drought. The state’s initial failure to recognize
the extent of the drought prevented it from devel-
oping an effective response strategy. The drought
Management Task force met for the first time
in July. it quickly became clear that the state’s
drought Management plan (dMp) was inadequate
and that the state lacked basic tools and the
suite of coordinated communication and actions
necessary to respond effectively at each drought
level. Many residents and businesses did not real-
ize the severity of the drought until late august,
when it was far too late to save significant amounts
of water through conservation and particularly,
through reductions in nonessential outdoor water
use (e.g., lawn watering). This was a missed
opportunity to reduce summer water use by at
least 30 percent.
To his credit, secretary beaton recognized the
need to improve the state’s drought response,
and has directed agency staff to revise the dMp.
staff is currently updating both the dMp drought
metrics and the actions triggered at each drought
stage. we note, however, that under existing state
law secretary beaton can only recommend, but
not require, water use restrictions across a
drought region.
R E C O M M E N D AT I O N S We urge the interagency group now updating the dMp to complete its work before this sum-mer. We support giving the EEA Secretary legal authority to order water conservation measures uniformly in drought regions, and to municipalities, the authority to enforce such measures—a current gap in state law. We also urge the administration to complete the update of the Massachusetts Water Conservation Standards by the Water Resources Commission and to ap-point a permanent director of state water policy.
dELAyEd WAtER MAnAgEMEnt ACt pERMitS
grade
Dlast summer’s severe drought underscored the
importance of timely water withdrawal permitting.
had Massdep fully implemented the 2014 amended
water Management act regulations (wMa regula-
tions), the drought’s effects in some regions could
have been less damaging to the environment
and to water supplies.
The wMa regulations resulted from a multi-
year, multi-stakeholder effort to ensure a more

26 MASSAChuSEttS EnERgy And EnviRonMEnt REpoRt CARd yEAR tWo
sustainable water future for Massachusetts.
The regulations require large water withdrawers
to minimize and mitigate impacts of increased
withdrawals and to explore alternative sources
that are less environmentally damaging. The regu-
lations promote permits based on the most recent
fisheries and streamflow science. because these
permits are good for 20 years, it is vital that the
state also take into account expected impacts
on water resources due to climate change.
To date, few permits have been issued. in 2016,
only eight permits were issued to public water
suppliers by Massdep and only a handful were
issued in 2015. More than 100 water permits
scheduled to be renewed under the new wMa
regulations have been “administratively continued”
by Massdep. Consequently, many water suppliers
and the communities they serve are not subject to
the reasonable conservation conditions and other
requirements established in the wMa regulations.
R E C O M M E N D AT I O Nthe WMA regulations require that permittees minimize their existing impacts, offset the impacts of future increased withdrawals, and im-plement standard water conservation measures. these regulations are an important step forward for achieving water sustainability in Massachu-setts, but only if MassdEp actually issues the permits.
PROPOSEDCHANGESTOTHEINTER-BASin tRAnSFER ACt REguLAtionS
grade
CThe interbasin Transfer act (iTa) requires careful
consideration of the environmental impacts of
transferring water and wastewater from one river
basin to another, to discourage unnecessary
transfers. large water transfers can deplete
water sources, harming local ecology and water
supplies. There is also a clear climate mitigation
nexus between water and the energy used for
pumping, treating, and transporting it across river
basins. water resources Commission staff has
proposed numerous changes to the iTa regula-
tions. however, these changes were drafted
before the governor issued e.o. 569 to address
climate change.
The proposed changes to iTa regulations fail to
account for climate change. The draft regulations
will reduce review of some transfers, and elimi-
nate the requirement that applicants develop
local water resource management plans. This is
precisely the type of planning that communities
should be doing under e.o. 569 and should be a
Many water suppliers and the commu-
nities they serve are not subject to
the reasonable conservation conditions
and other requirements established
in the WMA regulations.

MASSAChuSEttS EnERgy And EnviRonMEnt REpoRt CARd yEAR tWo 27
R E C O M M E N D AT I O Nthe draft regulatory changes should be pulled backandre-examinedinlightofclimatechangeto ensure that they will both protect and make the water environment as resilient as possible, now and for the next century.
prominent component of the municipal vulnerability
assessments. The proposed regulations also fail
to incorporate the state’s science-based seasonal
stream flow standards into iTa review and would
allow regional water supply systems to tie up
millions of gallons of water for 20 years for as
yet unidentified customers.
dELEgAtion oF WAtER poLLution ContRoL pRogRAMS
grade
DMassdep is seeking to take over responsibility for
issuing wastewater and stormwater permits under
the federal Clean water act’s national pollution
discharge elimination system, or npdes program.
The question of state delegation, or “primacy” for
the npdes program has been raised before, most
recently in 2016, when the governor introduced
legislation to authorize the change. The legislation
was sent to study in part due to legislators’
concerns about high program costs.
The governor has now reintroduced this bill and
wants to pay for the program though annual bud-
get appropriations. This would leave the program
vulnerable to future budget cuts. in 2013, the leg-
islature asked Massdep to evaluate the feasibility
and cost of delegation. The agency reported that
the program would cost approximately $10M
annually. The agency now estimates the program
cost at $4.7M annually, which includes $1.5M
for outside contract assistance—a low ball figure.
the federal government currently provides this program at no cost to Massachusetts, courtesy of all u.S. taxpayers. despite the daunting price tag for the state, drain on MassdEp’s already thin resources, lack of npdES permitting exper-tise, and no clearly articulated environmental benefits, the administration continues to push for delegation.
R E C O M M E N D AT I O Ndefer delegation unless and until Massachusetts is ready to take on this program by first building up its stalled and weak water pollution program —investing in water quality monitoring and assessment, strengthening its water science and research capability, and restoring compliance and enforcement staff. MassdEp desperately needs additional funding to fulfill its existing obligations to protect water quality and quantity and to conduct research. the administration should support increasing MassdEp’s annual operating budget, rather than take on an expen-sive new program with no clear environmental benefit.
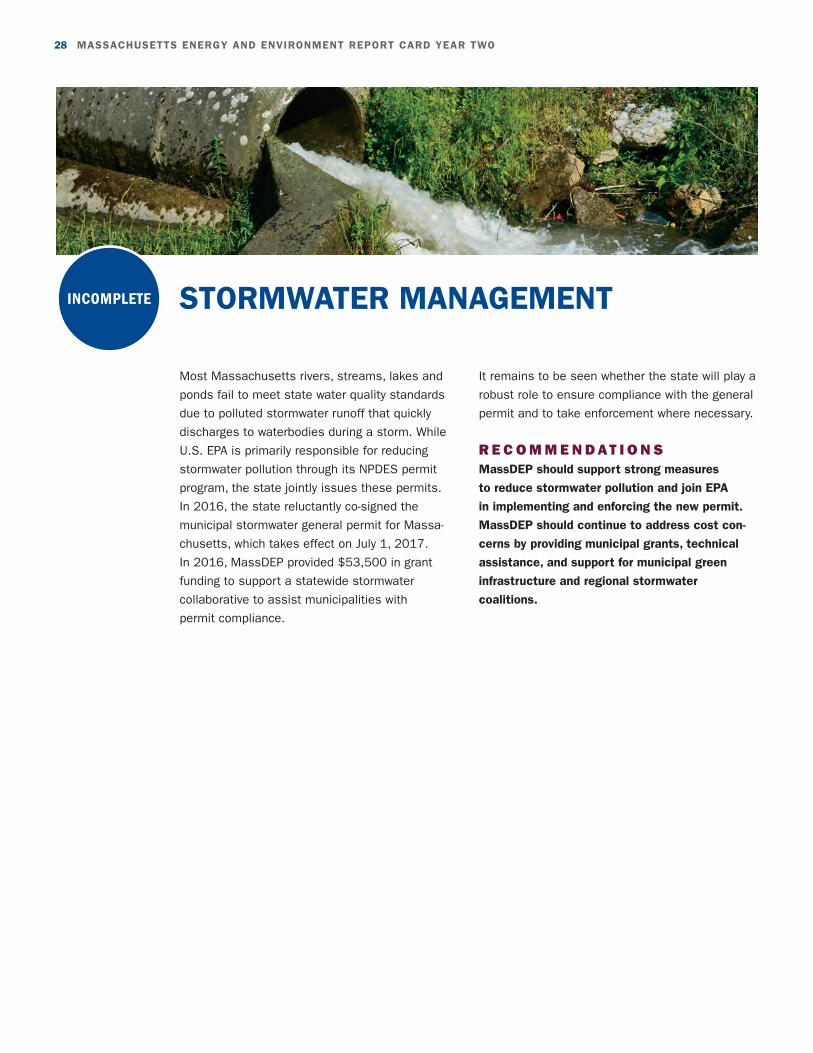
28 MASSAChuSEttS EnERgy And EnviRonMEnt REpoRt CARd yEAR tWo
it remains to be seen whether the state will play a
robust role to ensure compliance with the general
permit and to take enforcement where necessary.
R E C O M M E N D AT I O N SMassdEp should support strong measures to reduce stormwater pollution and join EpA in implementing and enforcing the new permit. MassdEp should continue to address cost con-cerns by providing municipal grants, technical assistance, and support for municipal green infrastructure and regional stormwater coalitions.
StoRMWAtER MAnAgEMEntincomplete
Most Massachusetts rivers, streams, lakes and
ponds fail to meet state water quality standards
due to polluted stormwater runoff that quickly
discharges to waterbodies during a storm. while
U.s. epa is primarily responsible for reducing
stormwater pollution through its npdes permit
program, the state jointly issues these permits.
in 2016, the state reluctantly co-signed the
municipal stormwater general permit for Massa-
chusetts, which takes effect on July 1, 2017.
in 2016, Massdep provided $53,500 in grant
funding to support a statewide stormwater
collaborative to assist municipalities with
permit compliance.

MASSAChuSEttS EnERgy And EnviRonMEnt REpoRt CARd yEAR tWo 29
Environmental Justicegrade
C–s
ince we released our assessment last
year, some modest progress has been
made on environmental justice issues
but we are eager to see this effort ex-
pand. environmental Justice (eJ) is based on the
principle that all people have a right to be protected
from environmental pollution and to live in and
enjoy a clean and healthful environment. studies
have determined that lower-income and minority
communities suffer from a disproportionately
high share of environmental burdens and at the
same time lack environmental assets in their
neighborhoods
The administration recently released a revised
environmental Justice (eJ) policy and although
more than two years late, we commend eea
on the public engagement process it conducted.
The policy brings with it some increased protec-
tions for vulnerable communities, particularly
where public health is concerned. however, the
policy has its limitations, and the environmental
justice efforts of eea should not end here. There
is much more work to be done, and eea should
set the example for the rest of the executive
branch.
we remain concerned that, apart from updating
the eJ policy, executive order 552 has not been
implemented. first, it is imperative that eea back-
fill the director of environmental Justice position,
which has been vacant since last summer. second,
it is critical that the governor’s environmental
Environmental Justice is based on the
principle that all people have a right to
be protected from environmental pollu-
tion and to live in and enjoy a clean
and healthful environment.

30 MASSAChuSEttS EnERgy And EnviRonMEnt REpoRt CARd yEAR tWo
process. however, we feel it misapplied the 2002
environmental justice policy and Mepa triggers,
including the volume of additional ash, applicable
to the facility. as a result, local residents may be
facing a toxic soup of pollutants should the un-
lined, waterfront landfill be hit by a major storm.
R E C O M M E N D AT I O N S• Makeapubliccommitmenttopromoting
environmental justice.• AppointanewDirectorofEnvironmental
Justice.• Ensurethatallstateagencieshavean
Environmental Justice Coordinator in place, beginning with EEA agencies.
• AppointmemberstotheGovernor’sEnviron-mental Justice Advisory Council immediately, and convene the interagency Working group on Environmental Justice.
• Createaplanandtimelineforimplementingother provisions of Eo 552.
Justice advisory Council provided for in section 2
of the executive order be empaneled. That body,
along with the interagency working group provided
for in section 5, can offer support to eea in opera-
tionalizing the executive order.
executive order 552 and the revised environmen-
tal justice policy are key instruments to guide eea
in developing policies that protect Massachusetts’
most vulnerable communities and prioritize them
for reducing sources of pollution they host. The
40+ year old municipal solid waste incinerator
and ash landfill in saugus illustrates the urgent
situation low-income communities and commu-
nities of color in Massachusetts face.
The aging saugus ash landfill, the only unlined
landfill in Massachusetts, has grown in recent
years to 50 feet in height. eea had the opportu-
nity to protect potentially impacted communities
in saugus, revere, and lynn through last year’s
Massachusetts environmental policy act (Mepa)

MASSAChuSEttS EnERgy And EnviRonMEnt REpoRt CARd yEAR tWo 31
Land Conservationgrade
B+Noted Harvard conservation biologist
E.O. Wilson, in his book, Half-Earth:
Our Planet’s Fight for Life, advocates
for 50% of the earth to be protected to
ensure that 85% of the world’s species
survive and that our planet is safe
and healthy for generations to come.
Massachusetts has a successful
history of protecting wildlife habitat,
parks, working lands, and providing
access to outdoor recreation. To date,
roughly 25% of the Commonwealth’s land area is
protected as parks and state forests, wildlife man-
agement areas, private conservation lands, and
working farms and forests. This success is very
much tied to significant public investment in land
protection driven by strong public support. it is
also based on conservation biology principles
of protecting rare species and wildlife, providing
habitat connectivity and supporting long-term resil-
ience. noted harvard conservation biologist e.o.
wilson, in his book, Half-Earth: Our Planet’s Fight
for Life, advocates for 50% of the earth to be pro-
tected to ensure that 85% of the world’s species
survive and that our planet is safe and healthy for
generations to come. Massachusetts is half way
there. The global average is 15%.
The baker administration has articulated the
following land protection priorities: (1) making
nature more accessible to under-served popula-
tions, especially in environmental Justice neigh-
borhoods; (2) focusing conservation and steward-
ship on our most productive and diverse wildlife
habitats; (3) enhancing and expanding sustainable
forestry on private and public forests to support

32 MASSAChuSEttS EnERgy And EnviRonMEnt REpoRt CARd yEAR tWo
rural communities; (4) improving the stewardship
of our public and private lands; and (5) improving
the connectivity and resilience of natural systems
to a changing climate.
only two year aggregate data was available at
time of writing. during the 2015 and 2016 fiscal
years, Massachusetts completed 597 land and
parks projects, and 26,515 acres were protected.
The highest annual average in acreage for land
protection is roughly 16,000 acres per year.7 The
2015 and 2016 fiscal years saw an investment
of $102 million of public dollars, including capital
funding, a state tax credit of $2 million per year,
federal land and water Conservation funds, and
Massachusetts water resources authority funding.
a highlight of the work of the executive office of
energy and environmental affairs is the Urban Tree
planting program, with over 5,000 trees planted
in gateway Cities to enhance neighborhoods
and provide natural cooling.
This administration has also focused on steward-
ship of state lands, and the departments of Con-
servation and recreation and fisheries and wild-
life have conducted habitat restoration projects on
6,000 of their acres. The department of Conser-
vation and recreation “foresters for the birds”
program, in partnership with Mass audubon, has
resulted in habitat management plans for declin-
ing bird species on 5,400 acres of private forest.
The Commonwealth has also invested in marking
property boundaries for state conservation lands
and increasing monitoring of easements that it
holds.
The land protection process has improved in the
second year of the baker administration. some
open positions have been backfilled, however,
we note that across the environmental agencies
staffing is still down significantly.
R E C O M M E N D AT I O N S• Committoinvestingatleast$50million
annually to state land protection programs to meet conservation goals as outlined in BioMap2, protect working farms and forests, and increase park access in urban areas.
• Supportincreasingthestateconservationland tax credit from $2 million annually to $10 million annually. there currently is a three year waiting period for this popular program.
• Supportincreasedfundingforthestatematchfor the Community preservation Act. this local option tool which supports open space and outdoor recreation, historic preservation, and affordable housing has now been adopted by 172 of Massachusetts’ 351 communities. the state match has decreased to roughly 20%. the Baker administration has been supportive of this important program through proposing the use of stabilization funds, which hasbeenanimportantstop-gapmeasure.
• Supportlegislationupdatingouroutdatedzoninglawstopreventsprawl,givecommu-nities the tools they need to direct growth, and assure predictability for developers.
• Upholdthepublictrustandopposeconvey-ance of state conservation land for natural gas pipelines or other fossil fuel infrastructure. We would like to see the Baker Administration use all tools at its disposal to oppose these unnecessarybuild-outsoffossilfuelinfra-structure.

MASSAChuSEttS EnERgy And EnviRonMEnt REpoRt CARd yEAR tWo 33
Reducing the use of toxic Chemicals
grade
C–
Massachusetts was once a national
leader on reducing the use of toxic
chemicals. The Toxics Use reduction
act (TUra), passed in 1989 was one
of a kind. it sought to prevent chronic diseases
and disorders such as cancer, asthma and infertil-
ity, which are all linked to exposure to toxins in the
environment. it requires that Massachusetts com-
panies that use large quantities of certain toxic
chemicals reduce their use to the extent possible
and measure and report the results so that the
success of the program can be tracked and shared.
The program has been incredibly successful at
achieving its environmental aims while also saving
companies money. from 1990 to 2013, Massa-
chusetts companies reduced toxic chemical use
by 48 percent, waste by 77 percent and on-site
releases by 91 percent and many companies
have reported costs savings from working with
the program. This law set a high bar for its time
in environmental health protection.
however, Massachusetts has since lost its leader-
ship position. The TUra program is currently not
being used to its fullest potential (see below), and
while states like washington, Minnesota, Connect-
icut and Vermont have each passed multiple bills
to protect children, workers and others from toxic
chemicals—Massachusetts has trailed behind.
so much has been learned in recent decades
about our exposure to toxic chemicals, the health
effects that they can cause, and the associated
health costs—yet Massachusetts has failed to
act on that information to protect its residents
and workers.

34 MASSAChuSEttS EnERgy And EnviRonMEnt REpoRt CARd yEAR tWo
The TURA program is currently not
being used to its fullest potential,
and while states like Washington,
Minnesota, Connecticut and Vermont
have each passed multiple bills to
protect children, workers and others
from toxic chemicals—Massachusetts
has trailed behind.
Under TUra, chemicals with significant safety
and public health impacts can be designated as
“high hazard substances (hhs).” when a chemi-
cal receives an hhs designation, it brings com-
panies that use that chemical into the program,
leading to reduced exposure and greater disease
prevention, and this often can spur the develop-
ment of safer alternatives.
between 2008 and 2013, the hhs designation
was used about once a year on average—consis-
tently though at a slow pace. in 2014, the state
took a very proactive approach and proposed five
new hhs designations, adopting four. The fifth
chemical class, toluene diisocyanates (Tdi)—
whose chemicals are used in the production of
materials such as foams, paints, binders, and
sealants and are linked to skin irritation, asthma,
and inhalation sensitization—was put on hold
at the end of 2014 due to industry opposition.
in 2015, the program virtually ground to a halt.
The Tdi designation was not discussed (at least
not publicly). no new hhs designations were
proposed. not only did the state do nothing to
advance this important program, it didn’t even
finalize work that was all but completed.
in 2016, the TUra administrative Council made
the decision to designate three chemicals in the
class of Tdi as higher hazard substances, effec-
tively putting a stamp on the research and back-
ground work that had been done in 2014. with
this action, the program tied up a loose end, but
the current administration has yet to consider any
new designations or proactively consider additional
ways to use the program to protect health. in fact,
the TUra program failed to even hold meetings
for most of 2016: the administrative Council
(the TUra decision making body) and its advisory
Committee usually meet bi-monthly, but did not
meet from May 2016 until March 2017.
furthermore, the program continues to be ham-
pered by the fact that fees paid by users of “TUra
listed” toxic chemicals have not been raised
since its inception in 1991, despite a statutorily
required annual increase. without funding keeping
pace with inflation and rising costs, the program
has experienced significant cutbacks in staffing,
preventing the full realization of health benefits
and cost savings for Massachusetts industries
that could be achieved.
it is also worth noting that Massdep offered a
one-time TUra amnesty to encourage facilities
that had failed to comply with the reporting re-
quirements to voluntarily return to compliance.
More than 130 facilities—about 25% of all facili-
ties required to report—took advantage of the
amnesty which ran from January 2015 through
July 2016. lax compliance and oversight is due
to a shortage of program resources and trained
inspectional staff.
overall, in 2016 the TUra program remained inad-
equately funded, failed to hold meetings and did
little more than tie up loose ends. This can hardly
be called a success for environmental and human
health protection. without more aggressive action
to implement the TUra program and advance
additional policies to protect consumer health,
Massachusetts will continue to lag behind.
R E C O M M E N D AT I O N Sthe tuRA program should consider at least five additional chemicals per year for hhS designation. Additionally, the tuRA fee structure should be modernized in keeping with state law and to maintain and improve the effectiveness of the tuRA program.

MASSAChuSEttS EnERgy And EnviRonMEnt REpoRt CARd yEAR tWo 35
Solid Waste
Massachusetts is at a crossroads in
terms of solid waste. The Common-
wealth can either embrace a zero
waste future—designing and manag-
ing products and processes to systematically
avoid and eliminate the volume and toxicity of
waste and materials and conserve and recover all
resources—or continue to endanger public health
by burning, burying, and wasting resources. Mass-
dep’s 2010–2020 solid waste Master plan sets
modest, but important reduction, recycling and
diversion goals, but the Commonwealth does not
have programs in place to achieve even these
modest goals by 2020, not to mention the long-
term goals set for 2050. furthermore, Massdep
has stopped tracking good metrics to measure
their progress, and is not adequately investing
in zero waste programs.
The baker administration has largely continued
the policies of disinvestment in Massdep, the his-
toric inadequate enforcement of the solid waste
bans and lack of oversight over dangerous solid
waste facilities. as discussed below, staff short-
ages have led to Massdep not compiling and
analyzing data necessary for the department to
evaluate its programs or meet its waste goals.
Massdep also has not put programs in place
to combat recognized shortcomings of the waste
system or enforce their own regulations. The Com-
monwealth needs to adopt and expand zero waste
programs like universal recycling, pay-as-you-throw,
and a textiles ban.
while Massdep has recognized the danger to
public health and the environment presented by
some waste facilities, and has denied a permit to
expand in at least one instance, the agency con-
tinues to allow dangerous facilities to operate and
in some instances has supported their expansion.

36 MASSAChuSEttS EnERgy And EnviRonMEnt REpoRt CARd yEAR tWo
2010-2020SolidWasteMasterPlanGoalsThe Massachusetts 2010-2020 solid waste Mas-
ter plan, “a pathway to zero waste,” was issued
in april, 2013 by Massdep (the “swMp”). The
goal of the plan is to put the Commonwealth on
the path to “higher reused and recycling rates
and reduced disposal.”
More specifically, the swMp goals include:
• reducing municipal solid waste (Msw) disposal
in landfills and incinerators by 30 percent by
2020, (from 6.55 million tons of disposal
in 2008 to 4.55 million tons)
• reducing Msw disposal in landfills and incin-
erators by 80 percent by 2050 (from 6.55 mil-
lion tons of disposal in 2008 to 1.31 million
tons), and “virtually eliminate products contain-
ing toxic chemicals from our disposal facilities”
• increasing the recycling rate for construction
and demolition materials (“C&D”), excluding
asphalt, brick and concrete, to 50 percent
by 2020.
tRACKing oF SoLid WAStE MEtRiCS
Massdep has stopped tracking key metrics due
to staff shortages. as a result, it is impossible to
ascertain if the Commonwealth is on a “pathway
to zero waste” or not. Through 2012, Massdep
tracked the total amount of Msw and non-Msw
generated (including C&D waste). MassDEP also
tracked the diversion of these materials, including
the MSW recycled or composted, the C&D recycled,
other C&D diversion (see more below) and other
non-Msw diversion. Massdep also tracked how
much of each C&D material was recycled.
Massdep no longer compiles, tracks, or analyzes
any of these numbers. The agency did not compile
the numbers for 2013 at all—they skipped a year
so they could catch up.
in 2014 and 2015, Massdep only reported dis-
posal totals, net exports, and remaining in-state
landfill and incinerator capacity. Massdep’s policy
now is to compile only the disposal numbers,
more specifically, how much MSW and C&D is
burned and buried in the state, and how much is
exported or imported for disposal. while Massdep
plans to review the Commercial food waste ban’s
success this year, there will not be an accounting
of the other materials composted in the state.
The reason for this change is clear. due to lack
of resources, Massdep was unable or notoriously
late to compile these numbers. staff from
MassDEP has stopped tracking key
metrics due to staff shortages. As
a result, it is impossible to ascertain
if the Commonwealth is on a “pathway
to zero waste” or not.
grade
D–

MASSAChuSEttS EnERgy And EnviRonMEnt REpoRt CARd yEAR tWo 37
Massdep have stated at public meetings that
in the past the department used two full-time
employees, or fTes to compile and analyze data,
while the analysis done for 2014 and 2015’s
waste numbers only took one-half fTe.8 despite
the importance of this data to measure progress
and ensure accountability, Massdep is unable
to devote adequate resources to this work.
R E C O M M E N D AT I O NMassdEp is beginning its review of the 2016 solid waste numbers now. the department should include all of the metrics used in 2012. MassdEp is also planning to begin work on the 2020–2030 Solid Waste Master plan. An excel-lent first step would be to convene the Solid Waste Action Committee to determine which metrics should be tracked and how to fund this work moving forward.
dECREASing MSW diSpoSAL in LAndFiLLS And inCinERAtoRS
grade
DThe swMp’s primary goal is to reduce Munisicpal
solid waste (Msw) disposal in landfills and incin-
erators by 30 percent by 2020. in 2008, 6.55
million tons of Msw was disposed of into landfills
and incinerators. by 2020, that number must be
reduced to 4.55 million tons. The 2015 solid
waste data Update released in March 2017,
states that the total disposal was 5.51 million
tons. on its face, it would seem that Massachu-
setts is a little over half-way to meeting its goal.
however, this reduction is deceiving. The swMp
was completed in 2013, and was supposed to
plan for 2010–2020. why use 2008 disposal
numbers as the baseline for comparison? because
disposal dropped off sharply in 2009 (5.8 million
tons) and 2010 (5.43 million tons) due to economic
factors,9 Massdep is reporting a decrease that
likely had little to do with their work. if instead
Massdep used the 2010 disposal number—5.43
million tons—as its baseline, we would see that
disposal has actually increased by 80,000
tons between 2010 and 2015. when disposal
increases, it means we need to do more to
encourage recycling and waste reduction.
R E C O M M E N D AT I O Nimprove data collection and analysis so the Commonwealth can track enforcement and success of waste bans and other programs. Adopt zero waste programs like mandatory universalrecycling,pay-as-you-throwandadditional waste bans in Massachusetts.
When disposal increases, it means
we need to do more to encourage
recycling and waste reduction.

38 MASSAChuSEttS EnERgy And EnviRonMEnt REpoRt CARd yEAR tWo
inCREASE ConStRuCtion And dEMoLition RECyCLing
incomplete
The SWMP goal for C&D waste is to increase the
recycling rate to 50 percent by 2020. Massdep
based this goal on 2007 C&D generation, and
specified that the goal was to reduce C&D
disposal and non-recycling diversion by a total
of 400,000 tons annually by 2020.
in 2007 Massachusetts already recycled about
200,000 tons of C&D a year10 so when we add in
the new goal the Commonwealth has committed
to recycling a total of 600,000 tons of C&D
each year.
The SWMP stated that increasing C&D recycling
would hopefully decrease disposal and diversion
of C&D materials. Diversion of C&D has histori-
cally been the burning of wood, and the use
of C&D materials in daily cover and shaping at
landfills. These are often not the highest and
best uses of these materials. for instance, in
2007, 510,000 tons of C&D was diverted, and
670,000 tons was disposed of, but in actuality,
all 1,180,000 tons ended up in a landfill or
incinerator.
MassDEP did not track how much C&D was gen-
erated in Massachusetts in 2015 (see above).
The department also did not track how much C&D
was recycled or otherwise diverted. Massdep did
report that Massachusetts disposed of a net total
of 392,271 tons of C&D in 2015. Because this
number is entirely out of context, it is impossible
to track any progress towards Massdep’s stated
goal of recycling another 400,000 tons, or 50%
of C&D.
in the past, Massdep documented an increase
in C&D recycling—the 68% recycling rate based
on actual generation in 2010 had increased to
73% in 2012.11 without updated numbers, we have
no way of knowing if that trend has continued.
It is also possible that not much C&D was pro-
duced at all in 2015. it is a waste stream that
is heavily impacted by building and the housing
market. when one reviews data back through
2005, C&D generation peaked in 2005 (5.1 M
tons), declined steadily until 2011 (2.7 M tons)
and increased again in 2012 (3 M tons). without
the context of tonnage generated, analysis is
guesswork and conclusions weak at best.12
R E C O M M E N D AT I O NCompile the C&d numbers for 2013–2016. if C&d recycling has not improved by 400,000 tons per year, prohibit landfills from diverting C&d to incinerators or for daily cover at landfills to ensure the 2020 C&d goal is met.
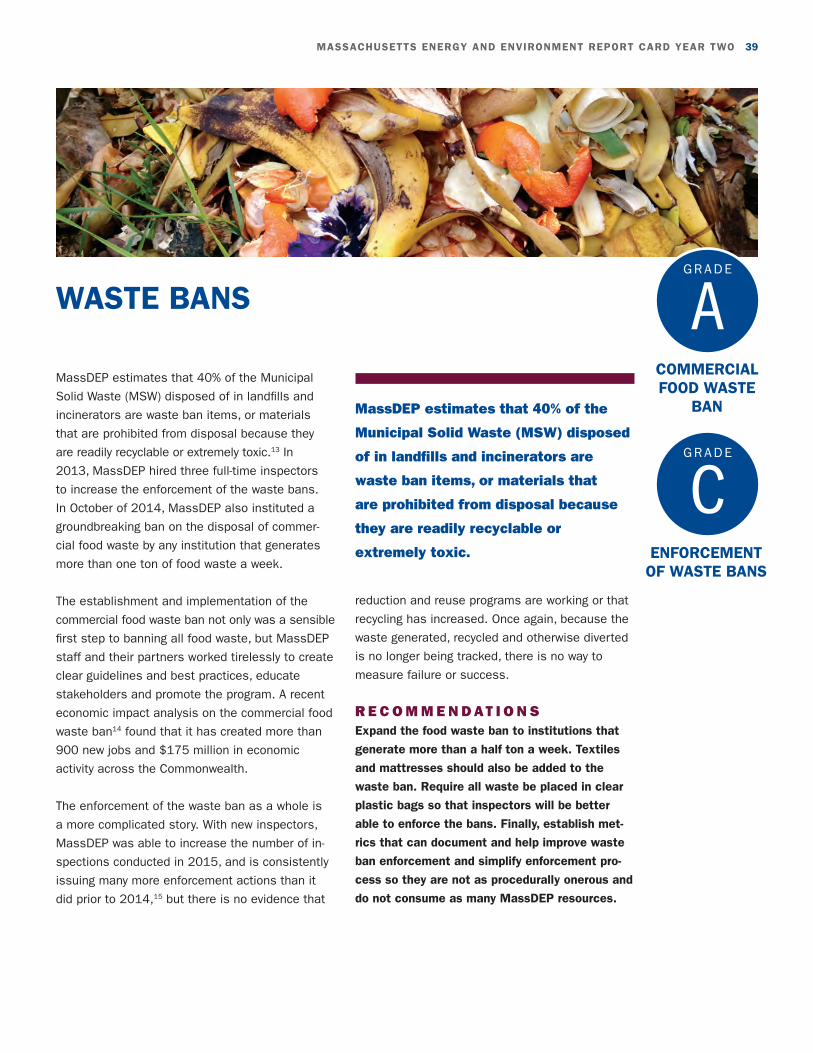
MASSAChuSEttS EnERgy And EnviRonMEnt REpoRt CARd yEAR tWo 39
WAStE BAnSgrade
A
grade
C
CoMMERCiAL Food WAStE
BAn
EnFoRCEMEnt oF WAStE BAnS
Massdep estimates that 40% of the Municipal
solid waste (Msw) disposed of in landfills and
incinerators are waste ban items, or materials
that are prohibited from disposal because they
are readily recyclable or extremely toxic.13 in
2013, Massdep hired three full-time inspectors
to increase the enforcement of the waste bans.
in october of 2014, Massdep also instituted a
groundbreaking ban on the disposal of commer-
cial food waste by any institution that generates
more than one ton of food waste a week.
The establishment and implementation of the
commercial food waste ban not only was a sensible
first step to banning all food waste, but Massdep
staff and their partners worked tirelessly to create
clear guidelines and best practices, educate
stakeholders and promote the program. a recent
economic impact analysis on the commercial food
waste ban14 found that it has created more than
900 new jobs and $175 million in economic
activity across the Commonwealth.
The enforcement of the waste ban as a whole is
a more complicated story. with new inspectors,
Massdep was able to increase the number of in-
spections conducted in 2015, and is consistently
issuing many more enforcement actions than it
did prior to 2014,15 but there is no evidence that
reduction and reuse programs are working or that
recycling has increased. once again, because the
waste generated, recycled and otherwise diverted
is no longer being tracked, there is no way to
measure failure or success.
R E C O M M E N D AT I O N SExpand the food waste ban to institutions that generate more than a half ton a week. textiles and mattresses should also be added to the waste ban. Require all waste be placed in clear plastic bags so that inspectors will be better able to enforce the bans. Finally, establish met-rics that can document and help improve waste ban enforcement and simplify enforcement pro-cess so they are not as procedurally onerous and do not consume as many MassdEp resources.
MassDEP estimates that 40% of the
Municipal Solid Waste (MSW) disposed
of in landfills and incinerators are
waste ban items, or materials that
are prohibited from disposal because
they are readily recyclable or
extremely toxic.

40 MASSAChuSEttS EnERgy And EnviRonMEnt REpoRt CARd yEAR tWo
pRotECting thE EnviRonMEnt FRoM dAngERouS WAStE FACiLitiES
grade
BMassdep also is charged with permitting waste
facilities and protecting citizens and the environ-
ment from the dangerous contaminants emitted
from those facilities. in the case of the south-
bridge landfill (operated by Casella waste), Mass-
dep has established that the landfill is releasing
contaminants into the ground and surface water in
southbridge. The agency also has determined that
the landfill is the likely source of the contaminants
found in more than 40 home wells in the adjacent
town of Charlton. due in part to these two factors,
Massdep denied Casella waste’s request for a
footprint expansion of the landfill. There is another
request for a permit to expand the landfill vertically
using sixty foot high walls. There are also two
other footprint expansions that Casella is seeking.
ground water monitoring wells on the site have
shown contaminants for about 20 years and now
lead and 1,4 dioxance have been found in more
than twenty home wells in sturbridge, west of
the landfill.
Unfortunately, the saugus ash landfill is a very
different story. operating without a liner and located
in an area of Critical environmental Concern in
rumney Marsh, the saugus ash landfill has been
accepting over a hundred thousand tons of toxic
incinerator ash since 1975. for 25 years prior
to that, it was accepting Msw. according to a Con-
sent order issued by the Massdep, it was sched-
uled to close in 1996. since that time, the own-
ers/operators of the facility have received nine
extensions to continue operating. Most recently,
wheelabrator saugus, the owner and operator,
completed the Mepa process for an expansion
of the ash landfill—specifically the filling of two
valleys that were installed for water run-off.
despite more than 200 letters from the public
and local officials requesting a full Mepa review,
Massdep did not recommend that wheelabrator
be required to complete one.
R E C O M M E N D AT I O N S• MassDEPshouldcontinuetodenyrequests
for expansion of the Southbridge landfill. • MassDEPshoulddenytheWheelabrator
Sauguspermit,notonlyduetothecontam-ination being released from the site, but also because the facility is extremely vulnerable to climate change impacts such as sea level rise and storm surge.

MASSAChuSEttS EnERgy And EnviRonMEnt REpoRt CARd yEAR tWo 41
Conclusion
it is time for the governor to prioritize building
on Massachusetts’ record of environmental
achievement and solidify our role as a true
national leader. This will require a new level
of vision and commitment from governor baker—
of a kind not yet demonstrated. we urge the
governor to take bold action so we don’t squander
the opportunities in front of us to make real prog-
ress on these critical environment issues. nothing
less than our climate, our rivers, our beautiful
natural areas, and our health and that of our
children is at stake.

42 MASSAChuSEttS EnERgy And EnviRonMEnt REpoRt CARd yEAR tWo
1 see 2015 Economic Study—Off Shore Wind Development—Final
2 see https://www.iso-ne.com/system-planning/system-forecasting/energy-efficiency-forecast
3 see https://www.iso-ne.com/system-planning/system-forecasting/energy-efficiency-forecast
4 from the 1990 baseline, such that total 2020 emissions across the state are no more than the equivalent of 70.8 million metric tons of Co2.
5 https://mor-ev.org/program-statistics
6 Motor-fuel use: U.s. department of Transportation, federal highway administration, highway statistics, Mf-21, available at www.fhwa.dot.gov/policyinformation/statistics.cfm as of June 2014.
7 http://www.mass.gov/eea/docs/eea/land/land-report-2014.pdf
8 John fischer, february 2, 2017 swaC meeting.
9 2010 solid waste data Update, november 2011, page 5. http://www.mass.gov/eea/docs/dep/recycle/priorities/10swdata.pdf
10 2007 solid waste data Update on the beyond 2000 solid waste Master plan, May 2009, Massachusetts department of environmental protection, executive office of energy and environmental affairs, page 12
11 2012 solid waste data Update, december 2015, http://www.mass.gov/eea/docs/dep/recycle/priorities/12swdata.pdf
12 id. and 2007 solid waste data Update on the beyond 2000 solid waste Master plan, May 2009, Massachusetts department of environmental protection, executive office of energy and environmental affairs, page 12. http://www.mass.gov/eea/docs/dep/recycle/priorities/07swdata.pdf
13 Massachusetts waste bans as a Tool to drive waste reduction, June 2016, Massdep https://uszwbc.org/wp-content/uploads/2016/06/Fischer-waste-ban-presentation-USZWBC-June-2016.pdf. This excludes the commercial organics waste ban.
14 Massachusetts Commercial food waste ban economic impact analysis, submitted to Massdep by iCf, 100 Cambridgepark drive, suite 501, Cambridge, Ma 02140, december 2016. http://www.mass.gov/eea/docs/dep/recycle/priorities/orgecon-study.pdf
15 Massachusetts waste bans as a Tool to drive waste reduction, Massdep June 2016, https://uszwbc.org/wp-content/uploads/2016/06/Fischer-waste-ban-presentation-USZWBC-June-2016.pdf. in 2015 there were more than 230 waste ban inspections conducted (up from 185 conducted in 2014), about 5,300 loads inspected, (up from 4,000 in 2014), there were 146 notices of noncompliance (down from 159 in 2014), 12 higher level enforcements (up from 3 in 2014) and more than 500 generator/hauler letters (down from about 600) issued by Massdep. Massdep waste ban Compliance and enforcement, Massdep January 14, 2015. http://www.newmoa.org/events/docs/147_137/MassDEPWasteBansJan2015.pdf
EndnotES

MASSAChuSEttS EnERgy And EnviRonMEnt REpoRt CARd yEAR tWo 43
Cover Massachusetts office of Travel and Tourism (3 kids) david griffin (heron) david McCormick (farmers Market)
p2 Massachusetts office of Travel and Tourism
p4 Thinkstockphotos/maudib
p6 erica Mattison
p9 Thinkstockphotos/roman babkin
p10 MassCeC
p11 Thinkstockhpotos/Joe binder photography
p12 national renewable energy laboratories
p14 Thinkstockphotos/jzehnder
p15 Thinkstockphotos/alfredo allais
p17 Thinkstockphotos/purestock
p18 istock/neonmaciej
p21 Creative Commons/leslee
p23 david griffin
p24 erica Mattison
p25 david griffin
p26 bill parker
p27 erica Mattison
p28 Thinkstockphotos/resavac
p29 erica Mattison
p31 Massachusetts office of Travel and Tourism
p33 Thinkstockphotos/felipe dupouy
p35 Thinkstockphotos/John fox
p36 Thinkstockphotos/Cylonphoto
p37 Thinkstockphotos/hroe
p38 Thinkstockphotos/Terroa
p39 Thinkstockphotos/maerzkind
p40 Kirstie pecci
p41 Thinkstockphotos/tazhiV
back Massachusetts office of Travel and Tourism
photo CREd itS

Charles River Watershed Association http://www.crwa.org
Clean Water Action http://www.cleanwateraction.org/states/massachusetts
Conservation Law Foundation http://www.clf.org
Environment Massachusetts http://www.environmentmassachusetts.org
Massachusetts Rivers Alliance http://massriversalliance.org
Massachusetts Sierra Club http://www.sierraclub.org/massachusetts
For more information about the organizations that contributed to this report, please go to:
Environmental League of Massachusetts https://www.environmentalleague.org