master thesis - aws · pdf filemaster thesis für herrn cand ... the developed multiphase...
TRANSCRIPT

Lehrstuhl für Technologie der Fertigungsverfahren
Prof. Dr.-Ing. Dr.-Ing. E.h. Dr. h.c. Dr. h.c. Fritz Klocke
Master thesis
Cand.-Ing.: Ashwin Moris Devotta
Matr.-Nr.: 298960
Kurzthema: Development and validation of a 3D multiphase
finite element model for micro drilling of ferritic
pearlitic steel AISI 1045
Betreuender Assistent: Dr.-Ing. Mustapha Abouridouane
Aachen, den 10.07.2012
Inhalt und Ergebnis dieser Arbeit sind ausschließlich zum internen Gebrauch be-
stimmt. Alle Urheberrechte liegen bei der RWTH Aachen. Ohne ausdrückliche Ge-
nehmigung des betreuenden Lehrstuhls ist es nicht gestattet, diese Arbeit oder Teile
daraus an Dritte weiterzugeben.


Lehrstuhl für Technologie der Fertigungsverfahren
Prof. Dr.-Ing. Dr.-Ing. E.h. Dr. h.c. Dr. h.c. Fritz Klocke
Aachen, 10. Juli 2012
M. Abouridouane - Tel. 0241-8028176
Master thesis
für Herrn Cand..-Ing.
Ashwin Moris Devotta
Matrikelnummer: 298960
Thema: Development and validation of a 3D multiphase finite element model for micro
drilling of ferritic pearlitic steel AISI 1045
For the simulation of micro cutting processes, where the chip thickness is in the same order
of work piece material’s grain size, the resulting size and scaling effects has to be taken into
account for an accurate estimation of the cutting forces, temperature development during
cutting and chip formation. Within the scope of this research work, a new 3D multiphase FE
computational model is to be developed based on the concept of representative volume
element (RVE) and constitutive material modelling to simulate explicitly micro drilling ferritic
pearlitic carbon steels. First, a material characterization which includes the analysis of micro-
structure and constitutive equations for each phase ferrite, pearlite and composite ferritic
pearlitic carbon steel is to be carried out. Then, the two phase 3D FE material model for steel
AISI 1045 is to be developed and verified using tension, compression and shear tests. Finally
the developed multiphase FE model is to be validated by simulating the micro drilling process
using the Lagrangian formulation proposed in the implicit FE code DEFORM 3DTM.
The following subtasks need to be solved:
Material Characterization and Material modelling
- The microstructure of the ferritic pearlitic steel AISI 1045 has to be character-ized based on grain size.
- The constitutive equations for each phase ferrite, pearlite and composite ferrit-ic pearlitic steel AISI 1045 has to be developed.
Representative volume element (RVE) development and validation
- The RVE for the steel AISI 1045 has to be developed.
- The developed RVE has to be verified based on tension, compression and shear tests.

The multiphase finite element model has to be validated by simulating the micro drill-ing process using the Lagrangian formulation proposed in the implicit FE code DE-FORM 3DTM.
Prof. Dr.-Ing. Dr.-Ing. E.h. Dr. h.c. Dr. h.c. Fritz Klocke

I Table of Contents i
I Table of Contents
I Table of Contents ......................................................................................................... i
II Table of symbols and abbreviations ........................................................................... i
III List of Figures .............................................................................................................. ii
IV List of tables ................................................................................................................. i
1 Introduction .................................................................................................................. 2
2 State of the art ............................................................................................................. 4
2.1 Mechanical micro cutting process .......................................................................... 5
2.1.1 Micro drill geometry and material .................................................................... 6
2.2 Simulation of cutting process ................................................................................. 7
2.2.1 Empirical modeling of cutting forces in metal cutting ...................................... 8
2.2.2 Analytical modeling of chip formation in metal cutting ..................................... 9
2.2.3 Finite element simulation of chip formation in metal cutting ...........................11
2.2.4 Molecular dynamics simulation of chip formation in metal cutting ..................24
2.2.5 Artificial neural network modeling of metal cutting process ............................25
2.3 Microstructure based finite element mesh model development .............................25
2.3.1 Image based FE mesh construction for material microstructure ....................25
2.3.2 Voronoi tessellation based FE mesh .............................................................26
2.4 Conclusion and derivation of the problem .............................................................27
3 Objectives and approach ...........................................................................................28
4 Development of 3D multiphase FE model for micro-cutting ....................................29
4.1 Microstructure based FE material model development ..........................................29
4.1.1 Microstructure characterization and constitutive material modelling ..............30
4.1.2 New methodology for multiphase material based FE mesh development ......33
4.1.3 Algorithm to develop a 3D microstructure based FE mesh ............................36
4.1.4 Implementation of algorithm into DEFORM 3D ..............................................39
4.1.5 Preliminary validation of 3D multiphase FE model using tension, compression
and shearing tests ........................................................................................................41
4.2 Johnson-Cook (JC) model development methodology for all carbon steels ...........43
4.2.1 JC model development methodology for ferritic pearlitic steels......................44
4.2.2 Validation of the JC model development methodology ..................................47

I Table of Contents ii
5 Validation of 3D multiphase FE model using micro drilling process simulation ...49
5.1 Experimental setup for micro drilling & results .......................................................49
5.2 Cutting process simulation set up in DEFORM 3D ................................................53
5.2.1 Simulation set up ...........................................................................................55
5.2.2 Object definition & object positioning: Cutting tool & work piece ....................56
5.2.3 Mixture material modelling .............................................................................60
5.2.4 Inter-object data ............................................................................................62
5.2.5 Drill modelling ................................................................................................63
5.2.6 Work piece modelling ....................................................................................65
5.2.7 Remeshing strategy ......................................................................................66
5.3 Simulation of drilling process .................................................................................69
5.3.1 Prediction of feed forces & torque .................................................................69
5.3.2 Prediction of chip form ...................................................................................70
5.3.3 Prediction of chip morphology .......................................................................71
6 Future Directions ........................................................................................................74
7 Conclusion ..................................................................................................................75
V Index of literature ........................................................................................................77

II Table of symbols and abbreviations i
II Table of symbols and abbreviations
Symbol Unit Description
α mm Rake angle
β degree Friction angle
mm Yield strength
φ mm Shear angle
d mm Cutting diameter
Fc degree Force along the rake surface
Fp N Cutting force along the direction of cut
Fs N Force along the shear plane
fX mm Volume percentage of phase X
Np N Cutting force perpendicular to the direction of cut
Ns N Force perpendicular to shear plane
t1 N Uncut chip thickness
t2 N Chip width
Abbreviation Description
AISI American Iron and Steel Institute
HSS High speed steel
HSCO Cobalt High speed steel
RVE Representative volume element
CAD Computer aided design

III List of Figures ii
III List of Figures
Figure 1-1: Components employing mechanical micro drilling process ............................. 2
Figure 2-1: Mechanical drilling with process parameters, cutting speed and feed velocity 6
Figure 2-2: Micro drill geometries (1) twist drill (2) spade drill (3) D shape drill ................. 7
Figure 2-3: Merchant’s single shear plane theory ............................................................10
Figure 2-4: Lee & Schaffer’s theory using slip line field theory .........................................10
Figure 2-5: Oxley’s predictive machining theory ..............................................................11
Figure 2-6: Finite element simulation of chip formation in metal cutting ...........................12
Figure 2-7: Basic material modeling approaches in FE simulation of plastic deformation
process ..........................................................................................................15
Figure 2-8: Flow curve modeling with influence of strain, strain rate and temperature on
flow stress of work piece material ..................................................................15
Figure 2-9: Split Hopkinson pressure bar test setup ........................................................16
Figure 2-10: Material modeling using machining tests and Oxley’s predictive machining
theory ............................................................................................................19
Figure 2-11: Microstructure incorporated FE mesh in metal cutting by Simoneau et al
[SIMO06] (A-pearlite & B-ferrite) ....................................................................22
Figure 2-12: Microstructure based FE mesh for AISI 1045 steel with the influence of grain
shape ............................................................................................................22
Figure 2-13: Chip formation at various uncut chip thickness to microstructure size ratio is
simulated using microstructure based FE model ............................................23
Figure 2-14: Microstructure based FE mesh using hexagon based grain cell ....................23
Figure 2-15: Microstructure material level model for chip formation simulation in Ti-6Al-4V ..
..................................................................................................................24
Figure 4-1: Line intercept measurement method for grains size in ferritic pearlitic steel
microstructure ................................................................................................31

III List of Figures iii
Figure 4-2: Microstructural representation of C05, C45, C53 and C75 ferritic pearlitic steel
......................................................................................................................32
Figure 4-3: Microstructure based FE simulation of micro-cutting overview.......................34
Figure 4-4: DEFORM key file predefined structure ..........................................................35
Figure 4-5: Microstructure based FE mesh development algorithm part 1 .......................36
Figure 4-6: Microstructure based FE mesh development algorithm part 2 .......................38
Figure 4-7: Pictorial representation of microstructure based FE mesh development
algorithm ........................................................................................................40
Figure 4-8: Two phase 3D FE model developed for simulation of ferritic pearlitic steel
plastic loading ................................................................................................41
Figure 4-9: Variable loading of different microstructural constituents, pearlite and ferrite on
tension loading ..............................................................................................42
Figure 4-10: Validation of flow curve modelling methodology using law of mixtures ...........48
Figure 5-1: Machine tool setup for micro drilling experiments and microdrill geometry
employed .......................................................................................................50
Figure 5-2: Measurement set up for micro drilling experiments ........................................51
Figure 5-3: Experimental related feed force and related torque in micro drilling process .53
Figure 5-4: Plunging of the work piece and initiation of chip formation with consideration of
cutting edge rounding ....................................................................................56
Figure 5-5: Application of mesh density window to reduce remeshing during simulation run
......................................................................................................................57
Figure 5-6: Boundary conditions for velocity and heat transfer in work piece ...................58
Figure 5-7: Meshing of twist drill geoemtery ....................................................................59
Figure 5-8: Mixture material modelling for microstructure based FE mesh.......................60
Figure 5-9: Preliminary mixture material based FE mesh development ...........................61
Figure 5-10: Volume fraction information format in DEFORM 3D key file ...........................61

III List of Figures iv
Figure 5-11: Twist drill geometry used in experiments and simulation ...............................63
Figure 5-12: Drill geometry variation with drill diameter in micro drilling range ...................64
Figure 5-13: Work piece modelling using drill cutting edge geometry basis .......................65
Figure 5-14: Work piece geometry employed in micro drilling process simulation ..............66
Figure 5-15: Influence of remeshing methodology (global remeshing and local remeshing)
on mesh size .................................................................................................67
Figure 5-16: Chip form during micro drilling of AISI 1045 microstructure steel using 3D two
phase FE model ............................................................................................69
Figure 5-17: Prediction of feed force and torque using 3D two phase FE model, isotropic
FE model in comparison with the experimental results ..................................70
Figure 5-18: Chip form prediction using isotropic FE model and 3D two phase for a drill
diameter of 100 µm ........................................................................................71
Figure 5-19: Chip form prediction using isotropic FE model for a drill diameter of 100 µm ....
......................................................................................................................72
Figure 5-20: Chip shape during micro drilling in AISI 1045 steel ........................................72
Figure 5-21: Chip form and the presence of micro holed during micro drilling of AISI 1045
steel using 1 mm micro twist drill ...................................................................73
Figure 6-1: New local remeshing methodology for multiphase FE model .........................74

IV List of tables i
IV List of tables
Table 4-1: Microstructural characterization of ferritic pearlitic steel .................................32
Table 4-2: Test parameters for material modelling of ferritic pearlitic steel family ...........33
Table 4-3: Johnson Cook parameters for ferrite phase and pearlite phase .....................33
Table 4-4: Flow curve data for a constant strain of 0.1 for various strain rates at room
temperature ...................................................................................................47
Table 5-1: Cutting parameters, measured feed force and torque in micro drilling ...........52
Table 5-2: Parameters involved in the FEM simulation of metal cutting using DEFORM
3D ..................................................................................................................54
Table 5-3: Time step parameter for various drill diameters in DEFORM 3D ...................55
Table 5-4: Time step parameter for various drill diameters in DEFORM 3D ...................57
Table 5-5: Friction modelling and heat transfer modelling for chip, work piece and cutting
tool ................................................................................................................62

1 Introduction 2
1 Introduction
Product miniaturization is considered a key technology in the 21st century due to its inherent
advantages. The foray of metal cutting processes into micro scale manufacturing as an
alternative to material additive and removal process is on the rise and compete with other
micro-manufacturing technologies [DECH03]. A major advantage of the metal cutting pro-
cess is its ability to be employed in a wide array of work piece materials, at different size
scales, complex geometries and at lower economic order quantity. The study of metal cutting
process was of primary importance due to its application in the manufacturing of precision
engineered products of the 20th century in areas like automotive manufacturing, general
engineering and aerospace engineering. In the 21st century, new fields of application like
biomedical engineering, instrumentation, precision mechanics, lightweight design etc. are
probed and pursued (Figure 1-1). Advanced levels of control and predictability of machining
process has been reached due to decades of research effort that took place in different
aspects of machining process. Research in machining focusses on different aspects like
process mechanics, process tooling, work piece material metallurgy optimization, control
strategy, process simulation, process parameter optimization, tool path programming etc.
[DORN06]. This advanced level of knowledge gathered over several decades from different
parts of the world has led to application of the machining process into the micro scale.
Figure 1-1: Components employing mechanical micro drilling process
DIXI
DATRON 5 mm DATRON

1 Introduction 3
Miniaturization in different aspects of product development has seen giant leaps in counts of
improvement in the past two decades. This strategy of miniaturization of products started
primarily within the electronics community where the miniaturization of the circuits and elec-
tronic devices were directly related to its improved efficiency and performance. In the field of
printed circuits, Moore’s law predicted that the number of transistors that would be accom-
modated within the integrated circuit would be doubled every two years. This would indirectly
mean the manufacturing technologies deployed there within would have to improve their
capability in the same pace. This led to the development of a number of manufacturing tech-
nologies that are divided into deposition process, removal process, lithography process and
modification process. These processes were work piece material specific and primarily
worked in the 2D scale.
Since, the manufacturing processes that were developed within the semiconductor manufac-
turing community were material specific, it was not possible for them to be extended to new
areas of materials, geometries and applications. Hence, new manufacturing technologies or
scaling down of existing manufacturing technologies had to be pursued to meet these chal-
lenges. The miniaturization of products in fields other than semiconductor processing needed
processes which were generic and material independent. Material removal process that was
predominantly developed within the realms of general manufacturing is being studied today
to be employed in the micro scale. Micro forming, micro machining, micro injection molding
are a few areas that are pursued with vigor. Challenges that are specifically of interest when
the material processes are scaled into the micro scale are termed as scaling and size effects
[LIU04].
For e.g. in machining with geometrically defined cutting tools at microscale, when the cutting
tool is scaled down from the macro scale into the micro scale, the cutting edge dimensions
reach the dimensions of the phases present in the work piece microstructure leading to an
increase in the specific cutting energy [VOLL03]. Change in cutting tool dimensions for need
of rigidity also leads to specific cutting energy as the mechanics of material removal moves
from shearing of the work piece material into ploughing [KOPA84]. The understanding of the
metal cutting mechanics at the microscale is required to deploy the process in critical engi-
neering applications. These aspects of scaling in metal cutting are better studied through
finite element simulation [KOTS03].
In this work, the scaling and size effects in material removal process in general and micro
drilling process in particular are studied using FE simulation method. A new methodology to
generate a finite element mesh based on microstructure is developed. The newly developed
microstructure based FE mesh is then incorporated into the DEFORM FEM package. Using
the FE mesh, micro-drilling process has been simulated in AISI 1045 steel. The process
output parameters, feed forces and torque are predicted with improved accuracy in compari-
son to isotropic FE mesh and the influence of microstructure on the chip formation process is
ascertained.

2 State of the art 4
2 State of the art
The miniaturization of a number of products into micro range has put a great stress on manu-
facturing technology research to focus on micro manufacturing technologies [WEUL04].
Micro component manufacturing started in the field of electronics where the circuits and other
electronic component size continue to shrink according to the Moore’s law [ROBI05].
With the deployment of micro components primarily within the electronics industry, the manu-
facturing technologies associated with it were silicon based manufacturing technologies.
These silicon based manufacturing technologies were very specific in respect to the geomet-
rical capability and the choice of material on which they can act upon. In due course, different
work piece materials also had to be employed in addition to silicon. This called for the need
to use other manufacturing technologies. The classification of micro manufacturing technolo-
gies has been provided by different research groups based on different classification meth-
odologies. One classification methodology proposed by Brinksmeier [BRIN02] is used here
for it encompasses a wide variety of the manufacturing technologies that are at the disposal
for micro component manufacturing.
Micro manufacturing technologies
1. MEMS processes.
E.g. UV lithography, silicon micro machining, LIGA
2. Energy assisted processes.
E.g. Laser Beam machining, Focused Ion Beam machining, Electron beam machin-
ing, micro electro discharge machining
3. Mechanical processes.
E.g. turning, milling, drilling, polishing, grinding
4. Replication techniques.
E.g. forming, injection molding, casting
5. Technological aids for micro manufacturing technologies.
E.g. handling, assembly, metrology
These technologies are used in both Microsystem Technologies (i.e. technologies used for
the manufacture of micro-electronic mechanical systems and Micro optic-electro mechanical
systems (MOEMS)) and micro-engineering technologies (manufacture of highly precise
mechanical components, molds and micro structured surfaces).
The macro mechanical material removal processes refer to the use of geometrically defined
and undefined cutting tools to remove parts of work piece material with energy input leading
to the removal of material through plastic deformation in the form of chips. The application of
macro mechanical material removal processes in the micro range leads to a number of spe-

2 State of the art 5
cific challenges which are to be understood at the fundamental level for its success in the
long run. These specific challenges are termed size effects in metal cutting and are con-
cerned with the influence of different input parameters at the micro scale.
2.1 Mechanical micro cutting process
The mechanical micro cutting process includes a wide variety of processes within itself and
includes turning, drilling, milling, sawing etc. This work is concerned with the drilling process
in particular and more specifically into the application of drilling process into the micro range.
The micro drilling process falls within the mechanical machining process and in general
encompasses a wide variety of processes depending on the source of energy used to re-
move the material. In general, the micro drilling process is either laser based or mechanical
drill based and each process has its own advantage and disadvantage. The tool based micro
drilling process is a scaled down version of the macro drilling process utilizing the twist drill.
This scaling brings in a new set of challenges with it.
The twist drilling process is a widely used material removal process for the manufacture of
blind and through holes and is by design used at the tail end of the manufacturing of a prod-
uct. The positioning of the twist drilling process in the later stage of the manufacture increas-
es the need for increased reliability of the process because an error during the drilling pro-
cess would lead to the loss of material, process energy, time and human effort. Unfortunate-
ly, twist drilling process is one of the least understood of all the material removal process
using geometrically defined cutting edges as the material removal takes place hidden from
the view of an engineer. The twist drilling process is carried out using different varieties of
drill geometry. The variation of the drill geometry depends on the work piece material in
which the drilling process takes place, the work piece geometry and the process capability in
relation to machine tool.
The term mechanical micro drilling process is not well defined with respect to the drill diame-
ter. But the general classification of drill diameter of less than 1 mm is satisfactorily accurate
where the process parameters are in the micron range.
The process parameters in the drilling process (Figure 2-1) are
1. Speed (m/min)
2. Feed (mm/ rev)
The process parameters are highly dependent on the work piece material, the cutting tool
geometry, cutting tool material and process conditions. The process parameter feed (mm/
rev) is a derivation of the more fundamental parameter of chip thickness. The chip formation
process in micro drilling in addition to the influence of flow behavior of work piece material
and process parameter as in the macro scale, also depends on the work piece microstruc-
ture.

2 State of the art 6
Figure 2-1: Mechanical drilling with process parameters, cutting speed and feed velocity
The cutting speed is dependent on the work piece material’s behavior during chip formation.
This includes the chip form and heat transfer between the cutting tool and the work piece.
The heat generated during the chip formation is directly related to the material deformation
rate. This heat generated is transferred to the cutting tool material and this heat accumulated
reduces the tool’s strength exponentially. Taking all these into account, the cutting speed for
a work piece-cutting tool combination is decided upon. Further, the cutting speed also de-
pends on the application of coolant, the nature of the process etc., the ability of the coolant to
reach the primary shear area.
The scaling of the micro drilling process comprises of scaling down of the micro drill geome-
try and micro drilling process parameters. Linear scaling of the drill geometry leads to non-
linear reduction in the rigidity and makes the process highly unstable. The minimum chip
thickness which is one of the important process parameter depends on the micro drill edge
rounding geometry. The micro drill edge geometry depends on the size of the carbide particle
employed in the manufacture of the particular drill, grinding of the drill geometry and em-
ployment of various post-processing operations. The inter relationship between the different
drill geometry parameters leads to a situation requiring the study of different parameters on
process stability and capability.
2.1.1 Micro drill geometry and material
The micro drill geometry primarily depends on the micro drill diameter. The primary reason
for micro drill geometry to depend on the drill diameter is the method of manufacture of the
micro drill geometry and the increase in cutting load to diameter ratio as the diameter of the
drill reduces. The commonly available drill geometry can be differentiated approximately as
follows although variations occur with each manufacturer.

2 State of the art 7
The drilling geometries that are used in micro drilling are the following (Figure 2-2)
1. Twist drill geometry (0.2 mm < d < 1 mm)
a. Twist drill geometry without undercut ( 0.3 mm < d < 1 mm)
b. Twist drill geometry without margin (0.1 mm < d < 0.3 mm)
2. Spade drill geometry ( d < 0.1 mm )
3. D shape drill geometry ( d < 0.05 mm )
Figure 2-2: Micro drill geometries (1) twist drill (2) spade drill (3) D shape drill
With the continuous improvement in the manufacturing capability of the micro drill geometry,
it is becoming possible for complex geometries to be manufactured for micro drills.
The choice of materials for the manufacture of micro drills falls primarily with HSS and car-
bide material. HSS (Cr4W6Mo5V2) and HSCO (Cr4W6Mo5Co5V2) are two varieties of the
High speed steel family that are employed in the manufacture of micro drills. The carbide
used in the manufacture of micro cutting tools in general fall under the high cobalt content
micro- and nano- grain size family. Cobalt content in tungsten carbide material increases its
toughness which is a prerequisite in micro machining regime.
2.2 Simulation of cutting process
The chip formation process directly or indirectly influences all the different aspects of metal
cutting like temperature distribution in cutting tool and work piece, tool wear, tool deflection,
surface integrity of the machined work piece, machine tool vibration, chatter marks on work
piece surface, surface roughness etc. [LUTT98]. With the increased importance attributed to
the control of the metal cutting process in modern day manufacture, a wide variety of re-
search approaches are pursued to understand the chip formation process. This includes
experimental techniques, numerical techniques and analytical techniques to name a few. The
2 State of the art 8
chip formation process due to its complexity has to date has not lent itself to a successful
theoretical investigation. The primary theoretical investigation started with works of Piispanen
and Merchant and has led to a basic understanding of the chip formation process. The ex-
perimental technique provides the best understanding of the chip formation process in the
metal cutting although the cost involved is enormous and in addition calls for a highly sophis-
ticated technology availability requirement. This has lead naturally for the world’s research
community to embrace numerical simulation approach. The numerical simulation of chip
formation process is itself widely spread depending on the scale of the machining process
under study. Finite element simulation, finite volume method, Boundary value approach, slip
line field modeling, hydrodynamic particle approach and molecular dynamics are some of the
numerical technique approaches that are employed in the simulation of chip formation in
metal cutting. A few of the research approaches in metal cutting are described below in
detail.
2.2.1 Empirical modeling of cutting forces in metal cutting
Empirical relationships have been employed over a long period of time for the prediction of a
number of outcomes in metal cutting. Empirical relations are developed with the enormous
amount of data obtained through experimental investigation. The validity of the empirical
relationship depends heavily on the quantity of data employed to develop the empirical rela-
tion and predict the relationship between input and output parameters within the experi-
mental space. Two categories within the empirical modeling of cutting forces in metal cutting
are linear approximation and the potential approximation. The linear approximation is partly
based on the shear plane model and is easy to calculate. But it leads to a larger percentage
of error compared to the potential approximation method.
The general form of the linear approximation method is given by
(1)
Where A & B are constants of proportionality and b & h represent the cross section of un-cut
chip thickness.
The potential approximation method is a result of curve fitting done to a large value of exper-
imental values and is statistically verified. The drawback with this method is the absence of a
theoretical basis and its non-extendibility to predict the other cutting force components. One
of the most widely used potential approximation method in the field of metal cutting is the
Taylors formula relating the tool life (T) to the cutting velocity (Vc) through material related
constants (C & n).
(2)
Another important empirical formula for the prediction of cutting forces in metal cutting is
given by Victor-Kienzle. It is used to predict the cutting forces based on chip thickness and
chip width as input parameters and hence it is partially based on a theoretical basis.

2 State of the art 9
(3)
Where is the cutting force per unit area, b & h represent the chip cross section area, m
represents the slope of the cutting force curve against chip thickness and K stands for the
material constant.
The empirical relations are best suited for the prediction of parameters in metal cutting. But
the major disadvantage lies in their inability to predict or explain the underlying mechanisms
of material removal in metal cutting.
2.2.2 Analytical modeling of chip formation in metal cutting
With chip formation being the primary source of force generation in metal cutting, various
analytical models of chip formation have been proposed over a period of time with varying
levels of complexity although most of them deal with the simple orthogonal cutting process.
An analytical model is a mathematical model which provides the solution to the equations
which describe the physical state using a closed formed analytical function. Several analyti-
cal models have been developed over a period of several decades. Some of the well-known
analytical model are Merchant’s single shear plane theory, the slip line field modeling of
metal cutting by Lee & Schaffer and Oxley’s predictive machining theory.
Merchant’s single shear plane model is concerned within the purview of orthogonal cutting
with a sharp cutting edge and the un-deformed chip thickness is significantly larger than the
cutting edge corner. This theory assumes that the work piece material is strained in a single
shear plane that extends from the main cutting edge to the free surface of the work piece
material and the friction between the cutting tool and the work piece is concentrated only on
the rake face and the relief face is free from friction. Tool wear, deflection of cutting tool and
nose radius are some of the parameters that are avoided. With all these assumptions made,
the chip is considered to be in equilibrium due to force by the cutting tool on one hand and
work piece on the other hand. The resulting cutting force is measured using a dynamometer
in both the directions. Using the circle of Thales, a circle is constructed whose diameter is
equal to the length of the resultant force vector. This resultant force vector is resolved along
different directions: Along and normal to the shear plane; in the machine coordinate system;
along and normal to the rake face (Figure 2-3).
The simplicity of the Merchant’s theory in explaining the chip formation was widely accepted
to understand the preliminary concepts of metal cutting without getting deep into the fields of
plasticity, metallurgy and mathematics. Naturally a number of shortcomings accompany the
theory which is the assumptions that are made in the first place. The shearing of the material
when it reaches the shear strength of the material without consideration of the strain harden-
ing, the presence of a single shear plane with unit thickness, the shear plane angle remain-
ing constant throughout the cutting process are some of the errors associated with it. Still
with all these assumptions as errors, this theory has provided some critical points in under-
standing chip formation.

2 State of the art 10
Figure 2-3: Merchant’s single shear plane theory
To overcome the above said shortcomings, Lee & Schaffer proposed their solution to the
problem of metal cutting using the slip line field analysis (Figure 2-4). The slip line field solu-
tions include the determination of a system of orthogonal curvilinear trajectories of the maxi-
mum shear stress called slip lines.
Figure 2-4: Lee & Schaffer’s theory using slip line field theory
tool chip
Work piece
φ
β-α
β
Fp
F q
α
chip Shear plane
𝜋
4
𝜋
4− 𝜃
t2
𝛾
t1
Area bounded by slip lines
𝜑

2 State of the art 11
Slip lines bounds the area within which the plastic deformation takes place. But the consider-
ation of a single shear plane and a plastic material behavior without the consideration of
strain, strain rate and temperature on the flow stress of the material made the Lee & Schaffer
model not to predict the cutting forces with reasonable accuracy. Moreover the consideration
of a sharp cutting edge is still void.
Figure 2-5: Oxley’s predictive machining theory
The latest among the well-known analytical models is Oxley’s predictive machining theory.
Oxley’s theory primarily was also concerned with the orthogonal cutting condition
(Figure 2-5). The theory is based on a model of chip formation from slip line field analyses of
experimental flow fields. Stress distributions along the primary shearing plane and the tool
chip interface are analyzed and then the shearing angle is selected so that the stress distri-
butions are in equilibrium. Using the temperature prediction from a compilation of experi-
mental data made by Boothroyd, the temperature along the primary shear plane and along
the interface is calculated.
In addition, the chip thickness which is calculated by taking moments about the tool edge and
the chip thickness is used to calculate the maximum shear strain rate at the tool/ chip inter-
face. The shear stresses are finally calculated and compared to the shear flow stress of the
chip. When the shear stresses and the shear flow stresses are in equilibrium, the corre-
sponding shear angle is ascertained as the correct shear angle. This theory was later devel-
oped for oblique cutting with a nose radius.
2.2.3 Finite element simulation of chip formation in metal cutting
The finite element method is a numerical modeling approach used in varied fields of engi-
neering and increasingly in manufacturing process simulation. The finite element method has
been developed over the past few decades to the extent that they are now capable of solving
industrial problems with high level of accuracy. This leads to improved productivity at a much
lower cost. Within manufacturing, the finite element method has been applied with high levels
of accuracy in small deformation type problems like forming, bending etc. [LORO06].
t1
Work piece
Fs
FN
Fc F
t
𝜃
𝜆 F
N
chip plastic zone
𝛼
2 State of the art 12
Solving of physical problems with large deformation and processes with fracture phenomena
are still not fully developed to the required levels of accuracy. Still, finite element method is
regularly used in the analysis of large deformation type manufacturing process mainly within
the forming process simulation. The simulation of the chip formation process in metal cutting
using finite element method also falls within the large scale deformation process category
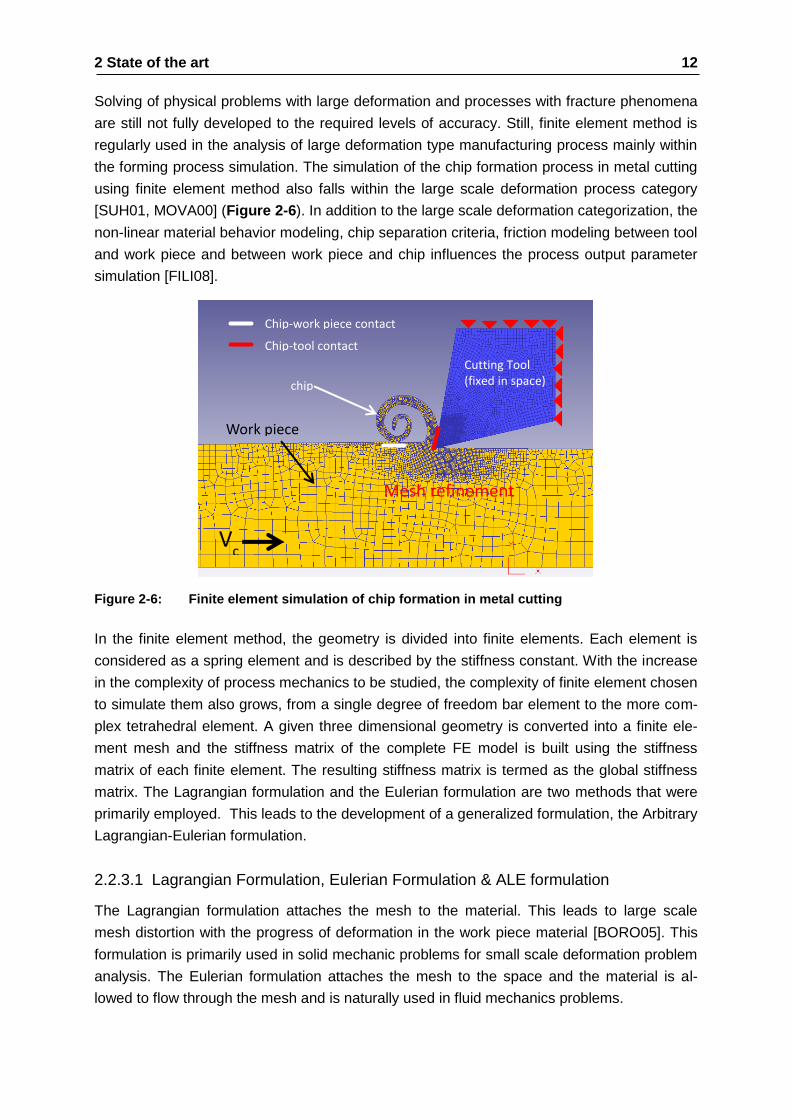
[SUH01, MOVA00] (Figure 2-6). In addition to the large scale deformation categorization, the
non-linear material behavior modeling, chip separation criteria, friction modeling between tool
and work piece and between work piece and chip influences the process output parameter
simulation [FILI08].
Figure 2-6: Finite element simulation of chip formation in metal cutting
In the finite element method, the geometry is divided into finite elements. Each element is
considered as a spring element and is described by the stiffness constant. With the increase
in the complexity of process mechanics to be studied, the complexity of finite element chosen
to simulate them also grows, from a single degree of freedom bar element to the more com-
plex tetrahedral element. A given three dimensional geometry is converted into a finite ele-
ment mesh and the stiffness matrix of the complete FE model is built using the stiffness
matrix of each finite element. The resulting stiffness matrix is termed as the global stiffness
matrix. The Lagrangian formulation and the Eulerian formulation are two methods that were
primarily employed. This leads to the development of a generalized formulation, the Arbitrary
Lagrangian-Eulerian formulation.
2.2.3.1 Lagrangian Formulation, Eulerian Formulation & ALE formulation
The Lagrangian formulation attaches the mesh to the material. This leads to large scale
mesh distortion with the progress of deformation in the work piece material [BORO05]. This
formulation is primarily used in solid mechanic problems for small scale deformation problem
analysis. The Eulerian formulation attaches the mesh to the space and the material is al-
lowed to flow through the mesh and is naturally used in fluid mechanics problems.
Cutting Tool (fixed in space) chip
Work piece
Mesh refinement
Chip-work piece contact
Chip-tool contact
Vc

2 State of the art 13
The application of the Lagrangian formulation in the chip formation simulation necessitates
the very fine mesh size in absence of the remeshing capability due to the enormous amount
of material deformation in the process. Since the FE mesh is linked to the material, as the
material is deformed, the mesh shape gets distorted with the increase in the deformation of
material. The main advantage of the Lagrangian simulation approach is its ability to simulate
the initial penetration of the tool into the work piece, the plunging of the tool, the chip for-
mation process and the reaching of steady state chip formation process. The main ad-
vantage lies in the extreme deformation of the mesh.
The Eulerian formulation is fundamentally applicable to fluid mechanics problems as the
usage of control volume is well defined. The FE mesh is not attached to the material. Rather
the material is allowed to flow through the mesh. This approach completely avoids the main
disadvantage of the Lagrangian formulation, the mesh deformation. On the other side, the
control volume has to be defined. The definition of control volume in a metal forming simula-
tion would imply the volume within the die to be defined accurately and is possible in most
cases with the required accuracy. In the simulation of chip formation, the definition of control
volume means the prediction of the chip shape. Since the chip shape depends on the pro-
cess itself, the prediction of control volume is not possible. This leads to the development of
Arbitrary Lagrangian-Eulerian Formulation. The Arbitrary Lagrangian-Eulerian formulation
combines the merits of both the Lagrangian formulation and Eulerian formulation and is built
from the principle of virtual work.
The Arbitrary Lagrangian-Eulerian formulation uses one mesh which is fixed to the material
and another mesh which is fixed to the global space. A one to one mapping scheme is used
to relate the material mesh and global space mesh. This formulation can be simplified to two
different cases, the Lagrangian formulation and Eulerian formulation.
2.2.3.2 Material modeling in chip formation
A very important aspect for the FE simulation of chip formation in metal cutting is the incorpo-
ration of the work piece material’s thermo-mechanical behavior and cutting tool’s thermo-
mechanical behavior modeling [DENK06]. The effort undertaken to incorporate this thermo-
mechanical behavior depends on the results of the simulation that are of interest to the engi-
neer and the assumptions made thereof. The finite element simulation can be carried to
predict a number of different output parameters like cutting forces, temperature at the cutting
tool edge, chip form, shear angle prediction etc. A comprehensive model to predict all these
output parameters simultaneously with the highest level of accuracy is still not available for
the simplest of cutting condition: the orthogonal cutting model.For e.g. the cutting tool mate-
rial behavior is not given the highest importance when compared to the work piece material
behavior when the aim of the simulation is to study the chip formation and not the cutting tool
deflection, cutting tool wear or temperature at the cutting edge. Under these conditions, the
cutting tool is modeled as a rigid type material [ÖZEL07]. A rigid model does not undergo
elastic or plastic deformation. This significantly reduces the computational power require-
ments which can be the deciding factor in many cases. But the cutting tool material behavior

2 State of the art 14
should incorporate the thermal properties of the cutting tool like thermal conductivity, emis-
sivity when the temperature distribution during cutting process is of prime interest.
In chip formation simulation, the work piece material behavior description plays a very im-
portant role in the prediction of cutting forces, chip morphology and temperature develop-
ment [FILI08]. The stresses experienced by the work piece material at high strain, high strain
rate and temperature, termed as flow stress is to be determined. In chip formation simulation,
the deformation of the work piece is described with increasing levels of complexity as shown
(Figure 2-7).
1. Ideal plastic with no strain hardening.
2. Plastic with strain hardening.
3. Elasto-plastic with strain hardening.
An ideal plastic material yields at a constant rate independent of the strain applied. This
assumption leads to a linear equation and grossly deviates from the physical reality in terms
of work hardening. The concept of work hardening is incorporated into the material modeling
using a model of plastic deformation with strain hardening. Strain hardening in a material is
due to the dislocation movement in the material under applied load.
Modeling of plastic deformation incorporating the strain hardening effect simulates the work
piece material behavior during metal cutting with better accuracy and the important output
parameters of cutting forces, chip form and temperature is predicted well. Hence this model
is used extensively in the material modeling of work piece material. The elastic-plastic mate-
rial model is required to predict the elastic deformation of the work piece when the load is
removed. The plastic material with strain hardening can be defined by the equation,
(4)
Where

2 State of the art 15
Figure 2-7: Basic material modeling approaches in FE simulation of plastic deformation
process
The elastic recovery modeling is required during metal cutting simulation to predict the resid-
ual stresses and work piece material deformation during machining of thin walled compo-
nents.
Figure 2-8: Flow curve modeling with influence of strain, strain rate and temperature on
flow stress of work piece material
The thermo-mechanical behavior of the work piece material defined by flow stress’s depend-
ence on strain, strain rate and temperature is defined in Figure 2-8. In a multiphase material,
the dislocation movement along the grain boundaries is the primary reason for the plastic
deformation when external load applied on the work piece is beyond the elastic limit. This
dislocation movement is restricted with increases in the strain rate and is reflected in the
increase in flow stress with increase in strain rate. With the increase in temperature, the
dislocation movement is greatly activated and leads to reduction in flow stress. When the
material is deformed in the plastic range, heat is generated at the shearing surface, this
leads to reduction in flow stress.
Ideal plastic Plastic with strain
hardening
Elastic-plastic with
strain hardening
σ σ σ
ε ε ε
𝜀 −
𝑤𝑖𝑡 𝑖𝑛𝑐𝑟𝑒𝑎𝑠𝑒 𝑖𝑛 𝑠𝑡𝑟𝑎𝑖𝑛 𝑟𝑎𝑡𝑒
𝑤𝑖𝑡 𝑖𝑛𝑐𝑟𝑒𝑎𝑠𝑒 𝑖𝑛 𝑡𝑒𝑚𝑝𝑒𝑟𝑎𝑡𝑢𝑟𝑒
𝜎 𝑁
/𝑚𝑚
2

2 State of the art 16
To model this flow curve in FEM simulation of chip formation process in metal cutting, the
constitutive equations of this flow stress are used. A wide variety of constitutive equations
are developed by different researchers. Some of the common constitutive equations for steel
are Litonski-Batra model, power law, Johnson-Cook [JOHN83] and Bodner Partom model.
To develop these constitutive equations, material testing is to be carried out in similar condi-
tions to metal cutting. The deformation mode during the material testing experiments will also
have to replicate the material deformation during metal cutting. With the metal under the
cutting edge undergoing a large compressive load before shearing, the compression test is
chosen to obtain the flow curves for FE simulation of metal cutting process. To obtain the
flow curves without these material testing other methods like practical machining tests and
reverse engineering using FEM technique are also used by few researchers.
The compression tests are used in place of tension test because the necking phenomena
during strain under tensile loading are not applicable for material under deformation during
cutting. Also the compression tests are easier to be conducted and have a higher level of
repeatability. The compression tests are carried out under quasi-static conditions and for
lower strains. The material behavior under high strain, high strain rate modeling is mainly
carried out using the Hopkinson’s pressure bar test (Figure 2-9). The Hopkinson’s pressure
bar test consists of an incident bar, a transmitted bar and a striker bar. The striker bar is
being operated using a pressure chamber. With an initial velocity applied, the pressure bar
hits the incident bar. The incident bar is thus provided by the incident stress wave and the
incident stress wave passes through the incident bar. The incident bar is kept long enough to
allow the disturbances to die out leaving only a single wave of specified wave length to pass
through the other end of the incident bar. The specimen is placed between the incident bar
and the transmitted bar. At the end of the incident bar, the stress wave is divided into the
transmitted wave and the reflected wave. The transmitted wave is transmitted to the speci-
men. The reflected wave is transmitted back into the incident bar. The transmitted wave
passes through the specimen.
Figure 2-9: Split Hopkinson pressure bar test setup
This transmitted wave is used for the loading of the specimen and results in a homogeneous
straining of the specimen. A part of the wave that is transmitted through the specimen is
transmitted to the transmitted bar and the other part is reflected back to the specimen. Strain
gauges are placed on both the incident bar and the transmitted bar. The influence of temper-
Projectile mass: m = 0.64 / 2.01 kg
Projectile velocity: v = 8 – 50 m/s
Deformation rate: de/dt = 103 – 104 s-1
bearing bearing
specimen
temperature control
output barinput bar
tube
compressed-air unit
projectile
damping unit
bearing bearing
specimen
temperature control
output barinput bar
tube
compressed-air unit
projectile
damping unit
Split-Hopkinson-Pressure-Bar

2 State of the art 17
ature is accounted for by conducting a series of tests where the specimens are heated using
an induction based heating system. The specimen is heated using this heating system out-
side the experimental setup and immediately placed inside the temperature controlled enclo-
sure in the experimental set up. To obtain the flow stress behavior at different strain rates,
the incident bar velocity is modified for different strain rates. From the strains that are meas-
ured using the strain gauges, the flow stress is obtained for different strain and strain rate.
The work piece constitutive behavior is also obtained using a combination of orthogonal
machining tests, Oxley’s parallel sided shear zone theory and SHPB tests. One example for
the development of the flow curves using machining tests is the method developed by
Sartkulvanich et al [SART03].
In this method, for a given set of cutting parameters, i.e. cutting speed, uncut chip thickness,
chip width and rake angle, two cutting tests are conducted. The two cutting tests that are
done are slot milling tests and quick stop test. The cutting forces and cutting torque are
measured from the slot milling test. In addition, the ratio of the average deformed plastic
zone thickness in the primary zone to the length of the shear plane from the slot milling test
and the ratio of the deformed plastic zone thickness to the cut chip thickness from the quick
stop test is calculated.
In parallel, a computer program is developed that utilizes Oxley’s machining theory to predict
the cutting forces. An initial set of flow stress parameters, basic material properties of the
work piece material, thermal conductivity, specific heat and melting temperature are provided
as input. The flow stress curves are modified in an iterative procedure in comparison to the
cutting forces measured using the experimental set up (Figure 2-10).
The cutting forces, tangential forces and chip thickness are measured from the cutting tests.
The average shear strain, average shear stress are calculated from the cutting test outputs.
The equivalent stress and strain are calculated using Von Mises criterion. These values and
the flow curves obtained using the SHPB tests are inserted in the JC model. Non-linear
regression method is used to calculate the values of JC parameters, A, B, C, n and m with an
initial value of C0 as input. The hydrostatic stress values at the two ends of the primary shear
zone are calculated based on Oxley’s theory. The optimization of the parameters leads to the
identification of the Johnson-Cook parameters.

2 State of the art 18
The Johnson Cook Model is a visco-plastic material model empirical equation and is de-
scribed as follows, [JOHN83]
(
) ( − (
− −
)
) (5)
-
- -
-
- -
-
-
-
It is divided into three different parts, the strain component, strain rate component and ther-
mal component. The strain component is built using a power function with the strain as the
variable. The constant value in the strain component corresponds to the yield stress. The
constant in the power function (n) is used to depict the strain hardening in the material. The
parameter identification of Johnson Cook model is carried out using different methods by
different researchers. This includes various optimization techniques like regression analysis,
evolutionary algorithm, Monte-Carlo simulation and various other techniques. Simpler tech-
niques including fitting of curves are also employed successfully.
-Thermal Component
-Strain Rate Component
-Strain Component

2 State of the art 19
Figure 2-10: Material modeling using machining tests and Oxley’s predictive machining
theory
2.2.3.3 FE simulation of macro cutting process
The simulation of macro cutting process using the FE method has been researched over a
period spanning more than four decades and this has resulted today in the ability to predict
number of outcomes in a machining process. This ranges from the residual stresses in the
work piece and work piece distortion after its removal from the machine tool, the crater wear
in a tool during cutting process to the prediction of machine tool vibration during the cutting
process. The influence of the cutting tool geometry and the work piece response during the
chip formation process are critical factors that are to be included in the simulation of cutting
process [DENK12, ÖZEL07]. In the macro scale, the influence of work piece response in the
chip formation process is considered to depend on the strain undergone by the work piece
material, strain rate at which the strain take place and the temperature generated due to
plastic work.
This indirectly implies that the work piece material is assumed isotropic. This isotropic mate-
rial behavior assumption has been justified by the predicting capability of the FE simulation in
2 State of the art 20
chip formation to near realistic proportions. The influence of the work piece material behavior
is included into the FE simulation by appropriate material behavior modeling.
Several specific FE models have been developed for various manufacturing processes like
turning, milling, drilling, sawing, grinding, broaching etc. The development of specific cutting
models have also been extended to other non-conventional or specific cutting processes like
ultrasonic machining, electro chemical machining, electro discharge machining, plasma hot
machining, laser cutting, laser assisted machining etc. Development of these processes has
been called for based on its criticality in the product manufacture and economics concerned
with the development of the specific machining process in specific applications.
A review of the finite element simulation in cutting process has been published by Jaroslav
Mackerle, (Finite element analysis and simulation of machining: a bibliography (1976-1996)
and Finite element analysis and simulation of machining: an addendum: A bibliography
(1996-2002)). The finite element simulation of cutting process for different work piece materi-
al behavior has also been carried out to a large extent. The simulation of work hardening
materials like nickel based alloys; titanium alloys call for as they demand specific material
behavior modeling to incorporate the work hardening properties.
2.2.3.4 FE simulation of micro cutting process
The finite element simulation of micro cutting process brings in new challenges in addition to
the ones found in the FE simulation of macro cutting process. In micro cutting, the cutting
edge’ radius is in the same scale as the un-deformed chip thickness. This is believed to lead
to a fundamental shift in the chip formation process. When the un-deformed chip thickness is
less than the cutting edge’ radius, a non-proportional increase in the cutting forces is ob-
served. The chip formation mechanics under these conditions falls under the ploughing
mechanism instead of the normal shearing mechanism and is termed under a group under
size effect in metal cutting.
In addition to the effect of un-deformed chip thickness in the cutting edge radius, the effect of
the different phases of the work piece material, their grain size and shape also is found to
have an important influence in the metal cutting process. Hence, the simulation of micro
cutting process has led to the need for inclusion of scaling and size effects. To simulate the
micro cutting process with the finite element method, the incorporation of grain volume, grain
shape and the volume fraction of the corresponding phases has to be incorporated. This
geometrical inclusion calls for new techniques of mesh generation. In addition to the inclu-
sion of geometrical variation within the FE mesh, the flow curve behavior of the different
phases will also have to be incorporated in the simulation. To incorporate the phase material
behavior, the mixture material models are employed where the different phases of the mate-
rial, their interaction, heat transfer and transformation properties can be incorporated.
The inclusion of the different phases in a multiphase material like steel calls for a great effort
in the mesh generation methodology. The Voronoi cell Finite element method is specifically
developed for the representation of the microstructure using meshes in 3D. The maturity of
the VC FE method is not yet developed to simulate the chip formation process in metal cut-

2 State of the art 21
ting. In the present stage, this has led to limitation of the chip formation simulation in the
micro scale in 2 dimensions as they do not need the use of complex algorithms to be incor-
porated.
The chip formation process in the micro-cutting of multi-phase material is simulated using a 2
dimensional cutting model using ABAQUS explicit version 6.4 finite element software by
Simoneau et al [SIMO06, SIMO07, MOHA11] (Figure 2-11). The simulation is carried out for
the micro scale, meso-scale and macro-scale cutting of AISI 1045 Steel. The two phases of
the AISI 1045, ferrite and pearlite have a grain size of 10µm and 100 µm respectively. The
un cut chip thickness is used as a criteria to differentiate among the different scales of cut-
ting: Un cut chip thickness of 5 µm, (uncut chip thickness < ferrite grain size, 50 µm (uncut
chip thickness > ferrite grain size & uncut chip thickness < pearlite grain size) and 100 µm
(uncut chip thickness ≈ pearlite grain size).The cutting edge radius is considered to be sharp
and the edge rounding influence is neglected.
This model was used to understand the variation in chip formation mechanics across scales
of metal cutting. The increased specific cutting forces as the scale of cutting moves from
macro scale cutting into micro scale cutting is explained using the larger plastic deformation
and shear extrusion that takes place in cutting. The larger plastic deformation and the addi-
tional shear localization which is predominantly present in the micro scale cutting are better
captured using the heterogeneous finite element model. The chip shape during micro cutting
is termed as a quasi-shear-extrusion chip whereas under the same cutting conditions, the
chip shape in the macro scale is a continuous chip form and the chip shape in the meso-
scale is a transition between the quasi-shear-extrusion chips to continuous chip shape.
The heterogeneous FE model’s advantage in predicting the surface defects during the micro
cutting of a multiphase material is also simulated. The chip formation process varies as the
primary shearing zone is varied from softer material, ferrite towards the grain boundaries
between ferrite and into pearlite and lastly into the harder pearlite phase and the continuation
till the length of cut is reached. This variation is explained with the change in the shear plane
angle in the different phases, the amount of plastic deformation that the different phases
undergo to keep the cutting energy in equilibrium.

2 State of the art 22
Figure 2-11: Microstructure incorporated FE mesh in metal cutting by Simoneau et al [SI-
MO06] (A-pearlite & B-ferrite)
Another microstructure based FE mesh is developed by Simoneau et al (Figure 2-12). This
model incorporates the shape of the microstructural constituents instead of a cubic structure.
This microstructure based FE mesh is employed to simulate the chip formation process in
AISI 1045 steel.
Figure 2-12: Microstructure based FE mesh for AISI 1045 steel with the influence of grain
shape
The steel’s constituents, ferrite and pearlite are modeled in 2D scale with the cutting edge
considered to be infinitely sharp, i.e. the effect of cutting edge radius is not taken into ac-
count. This model is reported to predict the chip shape with different levels of uncut chip
2 State of the art 23
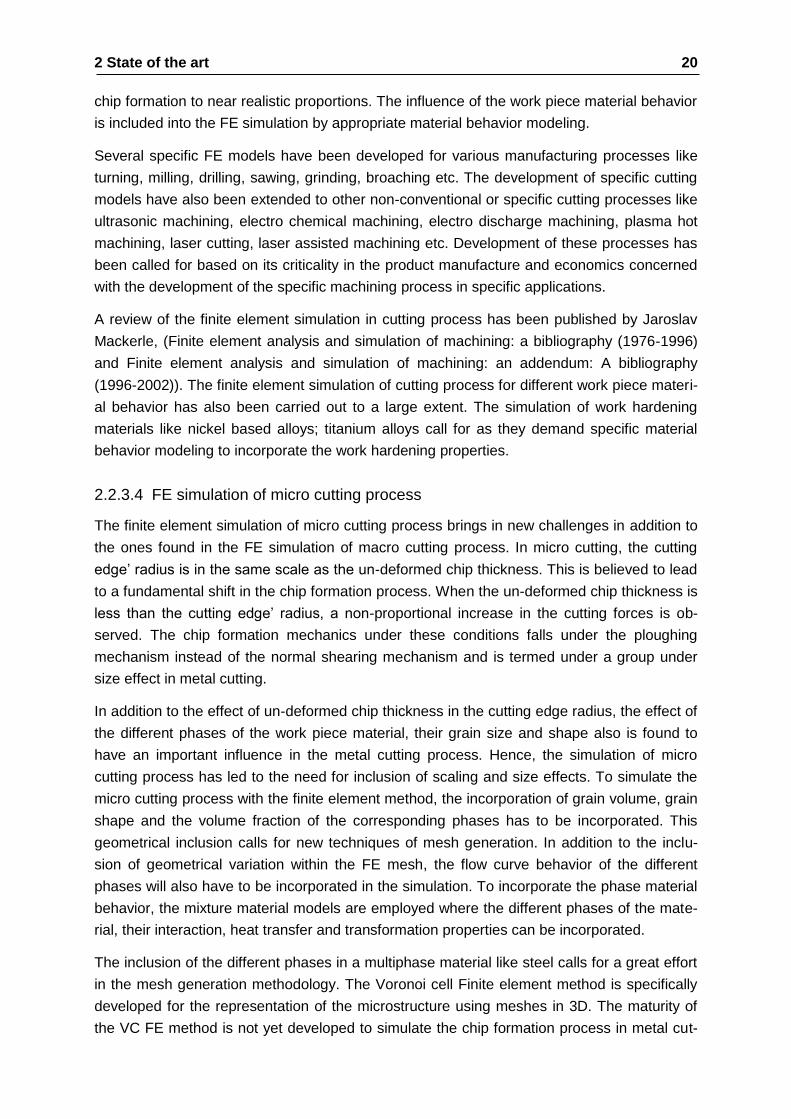
thickness in a better way . The cutting at different uncut chip thickness in relation to the grain
size is shown to affect the chip shape and the mechanisms that lead to it (Figure 2-13).
Figure 2-13: Chip formation at various uncut chip thickness to microstructure size ratio is
simulated using microstructure based FE model
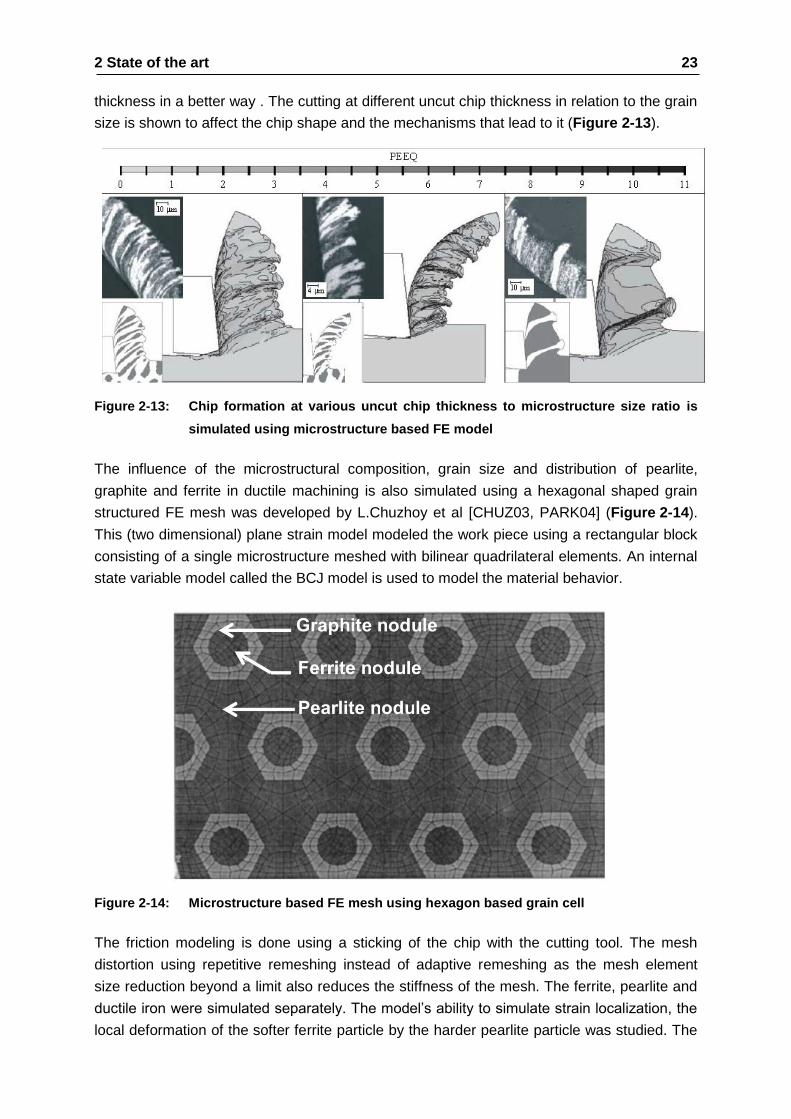
The influence of the microstructural composition, grain size and distribution of pearlite,
graphite and ferrite in ductile machining is also simulated using a hexagonal shaped grain
structured FE mesh was developed by L.Chuzhoy et al [CHUZ03, PARK04] (Figure 2-14).
This (two dimensional) plane strain model modeled the work piece using a rectangular block
consisting of a single microstructure meshed with bilinear quadrilateral elements. An internal
state variable model called the BCJ model is used to model the material behavior.
Figure 2-14: Microstructure based FE mesh using hexagon based grain cell
The friction modeling is done using a sticking of the chip with the cutting tool. The mesh
distortion using repetitive remeshing instead of adaptive remeshing as the mesh element
size reduction beyond a limit also reduces the stiffness of the mesh. The ferrite, pearlite and
ductile iron were simulated separately. The model’s ability to simulate strain localization, the
local deformation of the softer ferrite particle by the harder pearlite particle was studied. The

2 State of the art 24
segmented chip formation was predicted by the microstructure level model and was con-
firmed by experimental test results.
A microstructure material level FE mesh is developed for the simulation of chip formation of
Ti-6Al-4V by Zhang et al (Figure 2-15). The FE mesh is developed employing the cohesive
element model in ABAQUS. The FE mesh is developed does not incorporate two phases, but
only the influence of one phase with the grain boundary. The effect of grain orientation on the
chip formation is studied with this model. This model includes the cutting edge rounding and
simulates the pull out of the grain predicting the burr formation in the newly formed surfaces.
Figure 2-15: Microstructure material level model for chip formation simulation in Ti-6Al-4V
2.2.4 Molecular dynamics simulation of chip formation in metal cutting
The process of metal cutting has been applied in varied fields of application. A relatively
recent application of metal cutting is in the nanometer scale. Two applications of metal cut-
ting in the nanometer scale are single point diamond turning and ultra-precision diamond
grinding. The nanometric cutting process is used to study the material deformation process
at the nanometer scale [PROM10]. The uncut chip thickness is at the scale of 1 nm. The
simulation of the nanometric cutting is carried out using molecular dynamics simulation. At
this scale, the material deformation is not based on the grain boundary displacement, dislo-
cation movement in the material etc. The material movement is at the atomic scale. Material
at the uncut chip thickness contains only few layers of atoms. The interaction of the atoms is
analyzed using the potential energy function. Simulation of nanometric cutting is a relatively
new arena in metal cutting research which requires huge amount of computational power for
the simulation of industrial scale implementation.The material behavior in nanometric cutting
is incorporated using potential energy function. For e.g. in the nanometric cutting of copper,
the embedded atom model (EAM) potential function is used to relate the interaction between
two atoms of copper. Due to the absence of an EAM potential function for the interaction
between the diamond cutting tool and the copper work piece, the Morse potential function is
used. The trajectories of the chip, the cutting forces on the tool, energy of the system, tem-

2 State of the art 25
perature generated during cutting are some of the outputs in the simulation of metal cutting.
Computational power is the main criteria for the non-usability of this simulation technique to
be used in industrial scale micro machining applications.
2.2.5 Artificial neural network modeling of metal cutting process
The metal cutting process due to a large number of input parameters and the interactions
among them lead itself as a candidate to be modeled using artificial neural network method-
ology. The main advantage of artificial neural network methodology is its ability to perform
the modeling process with missing input data and unknown interaction between the input
parameters. Some of the output parameters that are predicted using ANN are forces, torque,
power, tool failure, deformation, surface integrity, noise, acoustic emission, vibration, chip
formation and temperature. Neural networks use a minimum of three steps, or in the ANN
terminology, three layers. These are the input layer, hidden layer and the output layer. Neural
networks are massive parallel systems made up of simple processing units termed as neu-
rons and are linked with weighted connections. These weighted connections represent the
knowledge possessed by the networks. The input parameters are provided to the neurons in
the input layer which converts them into normalized functions, multiply them with the
weighted connections and transferred to the hidden layer. The transfer of the neurons to the
hidden layer is done after scaling of the input layer using a function called bias. The neurons
are further transferred to the next layer using a transfer function termed the activation func-
tion. Finally the output parameters that are present in the neurons of output layer are com-
pared to the experimental values. The difference between the output parameters from the
experiment or learning values and the ANN model is reduced by changing the weights of the
connections between the neurons using a wide variety of back propagation learning algo-
rithm, conjugate gradient algorithms, quasi newton algorithms and Levenberg-Marquardt
method.
2.3 Microstructure based finite element mesh model development
Currently various methods are available for the generation of representative volume element
with different levels of complexity that are employed for different applications. The frequently
used representative volume element methodologies in FEM are
1. Image based FE mesh construction for material microstructure
2. Voronoi tessellation based FE mesh
2.3.1 Image based FE mesh construction for material microstructure
The image based FE mesh construction for material microstructure used to develop a repre-
sentative volume element of a multiphase material [WOJN04]. Direct method and indirect
method are two variations that are available within this methodology. The microstructural
image from a standard metallographic examination is used as the basic for FE mesh devel-
opment.
2 State of the art 26
In the direct method, a pixel of the image is used to represent each phase of a material. The
pixel fineness is directly related to the accuracy of the mesh developed. The image’s each
pixel is identified as a distinct element and each pixel is recognized. Consequently at the end
a single grain can contain a large number of pixels. Each microstructure grain is depicted by
a number of pixels. This leads to a computationally inefficient method. To be used in the
finite element simulation, the mesh obtained from the direct method is to be modified to make
it more computationally efficient. The mesh developed using the direct method is also report-
ed to exhibit false stress concentration geometry.
The indirect method uses the image to develop a FE mesh without only the direct conversion
of pixel into element. An image is initially defined by the pixel and the mesh is generated.
Different algorithms are then employed to improve the efficiency with the FE mesh before
being used in a simulation. The boundary of the elements is identified, modified to reduce the
unnecessary elements within a grain. This results in a computationally efficient FE mesh
which represents the microstructure.
The methodology in obtaining the image from the microstructure is also critical to the accura-
cy of the developed FE mesh. The basic procedure is the serial sectioning of the material
using a standardized metallographic technique. This image segmentation technique results
in a series of images of a microstructure in two dimensions [WEJR08]. This is then used to
develop the FE mesh. The different phases are represented by their boundaries and color.
This methodology provides the best representation of microstructure in the FE mesh. But the
time required to create a mesh is enormous and tedious. One another disadvantage of the
image based FE mesh is the need for process of RVE development to be carried out for
each steel microstructure.
2.3.2 Voronoi tessellation based FE mesh
The Voronoi tessellation scheme is used in 2D space and 3D space. In two dimensional
spaces, a set of points are distributed in the given space initially. Next, the position of the
points is adjusted using Delaunay triangulation algorithm.
In the Delaunay triangulation, the points lying near to each other are used to construct trian-
gles. The Delaunay triangulation then positions the points, such that no point lies inside the
circumcircle of the triangles. These triangles form the grains in a 2 dimensional space. This
tessellation when applied in 3D, leads to the Voronoi tessellation representing microstruc-
ture. The triangles in 2D are converted into tetrahedral elements in 3 D space. The incorpo-
ration of the grain size, grain volume and grain shape has to be taken into account to convert
the Voronoi tessellation into a representative volume element [LASC10].
The Voronoi tessellation is considered a very good approach to model 3D microstructures
[FRIT09, GHOS04]. The challenge in the application of the Voronoi tessellation based mesh
in the finite element simulation of chip formation process lies in the capability of the simula-
tion engine to accept the Voronoi mesh. A major challenge is the regeneration of the mesh
that is of primary importance in the metal cutting simulation. The currently employed FE
simulation package, DEFORM 3D V10.2 does not contain the ability to generate the mesh

2 State of the art 27
based on Voronoi tessellation. This methodology can be probed in the future, when the
capability to incorporate Voronoi tessellation based mesh into the simulation package is
achieved.
2.4 Conclusion and derivation of the problem
The above review of the state of the art clearly shows the importance attached to the devel-
opment of new micro-manufacturing technologies. The importance of material removal pro-
cesses in micro-manufacturing technologies also grows as new work piece materials are to
be processed. The micro-drilling process is a critical process in the manufacturing sequence
of complex engineering products. The micro-drilling process using a twist drill is a scaled
down version of the macro drilling process. The scaling down brings in additional challenges
to those already present in the macro drilling process.
The drilling process carried out using the twist drill in the macro scale includes the extrusion
of the material under the chisel edge due to the highly negative rake angle and the material
removal through shearing under the main cutting edge. The influence of the cutting edge’s
macro geometry like the chisel edge width, cutting edge shape, clearance profile geometry is
significant in relation to the cutting forces generated, the temperature generated at the prima-
ry and secondary shear area. At the micro scale, the influence of the cutting edge rounding
on the mechanics of material removal is significant as proved from previous research for
simple orthogonal cutting. In addition, the work piece microstructure is also proved to be an
influencing factor in the chip formation mechanism under orthogonal cutting. The micro cut-
ting process is so far studied in the 2D scale as the generation of microstructure based FE
mesh is still not completely developed for cutting process simulation. The three dimensional
microstructure based finite element mesh based on Voronoi cell methodology needs other
aspects of cutting process simulation like remeshing, chip separation criteria are to be devel-
oped. To carry forward the application of micro cutting process into industrial applications
with higher level of accuracy, 3 dimensional cutting processes like micro drilling is to be
studied with all its influencing factors taken into consideration.
The study of micro- machining process is carried out using a wide variety of research ap-
proaches which includes experimental approaches, analytical approaches and numerical
simulations approach. One important numerical simulation technique that is used in the study
of cutting process simulation is the finite element simulation method. The finite element
simulation method is developed to the extent to be used for the realistic prediction of cutting
forces, chip form and heat transfer to the cutting tool. The finite element mesh of the work
piece has so far been modeled as isotropic. Since the work piece microstructure is proved to
be an important factor in the micro cutting process, the need for a heterogeneous microstruc-
ture based finite element mesh is warranted. The generation of heterogeneous finite element
mesh and the simulation of microstructure based finite element modeling of chip formation in
micro cutting process would be a step further in understanding of the micro cutting process.

3 Objectives and approach 28
3 Objectives and approach
From the previous discussion on the state of the art in chip formation simulation in the micro
scale, the need for a multiphase FE Model development methodology in the micro scale is
clearly warranted. This model development would enhance the understanding of the chip
formation mechanics in the micro scale and could be developed further for the process moni-
toring of micro-cutting process.
The main aim of this work is the development of a new 3D multiphase FE computational
model for the incorporation of different phases of the work piece material. The developed
model is to be validated by its ability to predict the process output parameters with improved
accuracy in comparison to the isotropic FE model at micro scale plastic deformation pro-
cesses, specifically micro cutting with defined cutting edges. The flow behavior of the differ-
ent phases of the work piece material will also have to be incorporated separately into the
simulation. DEFORM 3D is a FE software developed by Scientific Corporation, Ohio, USA
primarily used for the simulation of metal forming process. Continuous development in the
process capability of the software has led to the possibility to simulate metal cutting process
and hence DEFORM 3D is employed in this work for the simulation of micro cutting process.
The work is divided into three parts and are grouped based on the objective and the ap-
proach thereof pursued.
1. To develop a representative volume element generation strategy for multiphase material.
This strategy should incorporate the microstructure parameters, grain size, grain shape and
phase volume percentage of each phase. The developed representative volume element will
be subjected to different loading conditions like tension, compression and shear loading and
compared with the corresponding experimental result and to validate in the preliminary stage
the ability of the developed RVE to simulate plastic deformation at the micro scale. The AISI
1045 microstructure is used to validate the RVE development strategy.
2. The flow curves of each microstructural phase have to be ascertained through material
testing and modeled using Johnson-Cook model for incorporation into the multiphase materi-
al FE model. A methodology to predict the flow curve behavior of a steel family is also devel-
oped which utilizes the flow curve of its individual constituents. This can be utilized for the
flow curve modelling with reasonable accuracy without conducting extensive material tests.
The two constituents of ferritic pearlitic steel: ferrite and pearlite are modeled using C05 and
C75 microstructure.
3. The RVE developed for AISI 1045 is used in the FE mesh generation for the work piece
used in the chip formation simulation in micro drilling process. Feed forces and torque are
the primary output parameters that are used to evaluate the developed FE model. In addi-
tion, the chip shape and morphology are also compared with the real chip morphology. The
influence of different parameters like uncut chip thickness, cutting edge radius are also stud-
ied. The validity of the generated FE mesh is compared with the results of experimental
investigation.

4 Development of 3D multiphase FE model for micro-cutting 29
4 Development of 3D multiphase FE model for micro-
cutting
As discussed in the state of the art, the need for a methodology to develop a 3D multiphase
material based finite element model for the simulation of micro manufacturing process exists.
To cater to this need, a new methodology which generates a multiphase material based FE
model built on the concept of representative volume element is developed. This FE model
incorporates microstructural parameters such as phase volume percentage, grain volume
and grain shape of the different phases of a multiphase material.
The development of a 3D multiphase FE model for micro cutting involves the generation of a
multiphase material based FE mesh and constitutive material modelling of the microstructural
phases. In addition as part of this work, a general methodology for the constitutive material
modelling for the carbon steel family is also carried out by employing the constitutive material
models of ferrite phase and pearlite phase in the law of mixtures.
4.1 Microstructure based FE material model development
The microstructure based FE material model development involves the development of a
multiphase FE model that is built on the concept of a representative volume element. This
multiphase FE model contains the different phases of the microstructure. The different phas-
es of the microstructure are represented distinctly in terms of geometry, distribution and
material behavior.
A representative volume element of a microstructure as explained by R.Hill is structurally
entirely typical of the whole microstructure on average and the material behavior is macro-
scopically uniform, i.e. the fluctuation of a mean value of a material parameter is small. This
reduction in fluctuation is made by making the representative volume element larger.
The incorporation of the microstructure geometry in the finite element is important and the
complexity level increases multifold compared to a isotropic FE mesh. The microstructural
phases’ geometric shape is highly varied. A common shape cannot be assumed as it leads
to erroneous results. The 3 dimensional geometrical classification of microstructure is a large
area to explore in itself. The effort to be exerted to incorporate the exact geometry of a single
grain into a finite element simulation depends on the scale of the process and also requires
large scale computing power even to today’s standards. For modelling the microstructure’s
geometry in carbon steel family, spheroidal shape has been shown to yield good results in
comparison to experimental investigation. In addition to the geometrical shape, the distribu-
tion of the phases will also have to be taken into account for the finite element mesh to be-
have as a representative volume element of a multiphase material.
The geometry of the grain is specified by its size in addition to its shape. The influence of the
grain size on the material properties is established by Hall-Petch effect. The mechanical
properties of multiphase materials depend on the grain boundaries to a large extent as they

4 Development of 3D multiphase FE model for micro-cutting 30
impede the movement of dislocations when a material applied. Therefore, with variation in
grain size the dislocation movement is influenced and the yield strength is varied.
(6)
Where is the yield strength, d is the grain size and k is the strengthening coefficient. x and k
are material specific parameters.
In addition, the microstructure’s phase distribution can be uniform or non-uniform as in the
case of special heat treated steels. The carbon steel under consideration contains uniform
distribution of the microstructure. The minor variation in the microstructural distribution from
the center of a cylindrical specimen to the outer surface of the cylindrical specimen is ne-
glected without significant loss in accuracy.
In order to use the developed multiphase material based FE model, material behaviors of
each phase has to be independently described in the finite element simulation. For e.g. the
presence of a harder microstructural phase in a softer matrix has to be differentiated on
material level to study the influence of each separate phase during simulation. With the
material models for the different phases being separately considered the deformation re-
sponse of the harder microstructural phase finite element is distinct compared to the defor-
mation response of the softer matrix phase. In addition to the material behavior of phase, the
influence of grain boundaries also plays an important role. The incorporation of the grain
boundaries and their influence needs a completely new upcoming methodology in FEM
called the crystal plasticity based FEM and hence is not considered in this work.
4.1.1 Microstructure characterization and constitutive material modelling
To incorporate the microstructure geometry specifications of grain size, grain shape and
phase volume percentage into the finite element simulation, the material has to be character-
ized. As part of this work, the material characterization is done using standard metallography
technique [WOJN04]. The information obtained from a metallography procedure primarily
includes grain size and the phase volume percentage of the microstructure [BADD02]. For
the ferritic pearlitic steel family, the phase volume percentage of pearlite & ferrite and grain
size of ferrite is to be obtained. To reduce the complexity, the inter-lamellar spacing and the
aspect ratio of pearlite are assumed constant for ferritic pearlitic steel family.
The material characterization is carried out for C05, C45 and C75 steel microstructure. The
standard quantitative metallographic investigation is carried out by polishing and etching the
steel specimen. The microstructure is analyzed under magnifications of 100X, 200X and
500X. The phase percentage is calculated by its area and in the case of ferritic pearlitic
steels; the ferrite area is calculated in µm2. A total of 3 samples are measured to obtain a
statistically accurate estimation.
In addition to the phase volume percentage, the grain size is also to be measured for model-
ling the microstructure with reasonable accuracy. The grain size measurement is carried out
using the intercept method. The grain size to be measured in all its complexity will have to be

4 Development of 3D multiphase FE model for micro-cutting 31
measured using a 3 dimensional irregular structure. To measure the 3 dimensional ferrite
particles which is or arbitrary shape, the integral of the areas of its plane sections is sufficient
by Fubini’s Theorem. Based on this, Delesse, a French geologist, proposed that the plane
section of a microstructure can be regarded as representative of the 3 dimensional irregular
structures. This falls under the idea that the constituent phases that is present in the planar
scale is to be present in the same proportion in which they occur throughout the microstruc-
ture.
This was further simplified by Rosiwal to one dimension by drawing lines across the steel
microstructure image and then calculating the length of the lines that overlap the constituent
of interest under study, in this case the ferrite constituent.
This assumption in simplified terms is represented by
Figure 4-1: Line intercept measurement method for grains size in ferritic pearlitic steel
microstructure
A simple representation of the line intercept method for the C45 steel microstructure in nor-
malized condition is shown here (Figure 4-1). The black lines are drawn at equally spaced
intervals over an image of the C45 steel microstructure. The red lines represent the overlap-
ping of the black lines with the microstructural constituent of interest, ferrite. The measure-
ment of the line’s length is used as a measurement of the microstructure’s grain size.
The carbon percentage in a ferritic pearlitic steel increases from C05 to C75. This increase in
carbon implies the increase in pearlite phase percentage from 1% to 99%. The iron-carbon
diagram clearly depicts this increase in carbon percentage from C05 to C75.
100 µm

4 Development of 3D multiphase FE model for micro-cutting 32
Table 4-1: Microstructural characterization of ferritic pearlitic steel
Steel Carbon
/ w%
Pearlite
/ %
Ferrite
/ %
Ferrite grain size
/ µm
C05 0.05 1 99 30
C45 0.45 60 40 15
C75 0.75 99 1 45
This increase in the pearlite volume percentage takes place at the expense of reduction in
ferrite volume percentage. The variation in the volume percentage directly influences the
grain size variation. Therefore, with the increase in the pearlite percentage, the ferrite grain
size reduces from 30µm in C05 steel microstructure to 15µm in C45 steel microstructure.
Figure 4-2: Microstructural representation of C05, C45, C53 and C75 ferritic pearlitic steel
A representative image of the microstructure of ferritic pearlitic steel is provided for C05 to
C75 (Figure 4-2). This shows the complex microstructural shapes that has to be incorpo-
rated into the microstructure based finite element mesh. The grain size is an approximation
as the grain size is not constant. For the sake of simplicity in microstructural representation in
finite element mesh generation, the mean value of the grain is used. The grain shape, grain
size and volume percentage as shown should be reflected in the finite element mesh that is
developed for the simulation of ferritic pearlitic steel.
To model the micro drilling process using a multiphase finite element model, in addition to
the multiphase finite element mesh, the work piece material behavior will also have to take in
to consideration the two different phases present in the work piece microstructure instead of
modelling the work piece behavior in the model of a single isotropic material model. Hence
C05
C53 C75
C45

4 Development of 3D multiphase FE model for micro-cutting 33
for the multiphase simulation of carbon steels, the two important phases, pearlite and ferrite
are required [ALLA08, RAMA12, SUH01]. In order to obtain the different phases of the work
piece material’s flow curve behavior, a material microstructure in which one of the work
piece’s phases is present in an absolute majority can be used as a reference for the phase.
Hence, to obtain the material models of the AISI 1045 microstructure’s phases separately
two specific steel microstructures, C05 steel and C75 are used. The C05 steel microstructure
contains 1 % of pearlite and 99 % of ferrite and its flow curve model is considered to be
representative of the ferrite phase. The C75 steel microstructure on the other hand contains
99 % of pearlite and 1 % of ferrite and is considered representative of the pearlite phase. The
change of pearlite grain volume with the change in the carbon weight percentage is evident
and its influence is not considered in the current work. The grain boundary variation, inter-
lamellar spacing and aspect ratio of pearlite’s influence on the mechanical behavior is also
not taken into account.
The material testing for the carbon steel family is carried out by a quasi-static compression
loading and a series of high strain, high strain rate compression loading using a split Hopkin-
son pressure bar tests at various temperatures (Table 4.2).
Table 4-2: Test parameters for material modelling of ferritic pearlitic steel family
Microstructure tested C05, C15, C45, C53, C75
Strain ε / - < 0.4
Strain rate έ / (1/s) 0.002, 0.07, 0.35, 3285, 3464,
3713, 3950, 3963, 4050, 4373,
4455, 4994, 5153 Temperature / °C 20, 200, 400, 600, 800
The material testing is carried out for all the microstructures listed in the table under the
conditions specified there within. The constants for the Johnson Cook model are obtained
from these curves.
Table 4-3: Johnson Cook parameters for ferrite phase and pearlite phase
Phase/Microstructure A / MPa B / MPa n / - C / - m / -
Ferrite 175 571 0.35 0.034 1.86
Pearlite 546 487 0.25 0.015 1.22
The Johnson Cook model constants for the ferrite phase are obtained from the flow curves of
C05 steel and the constants for the pearlite phase are obtained from the C75 steel flow
curves as tabulated (Table 4.3).
4.1.2 New methodology for multiphase material based FE mesh development
To incorporate the geometric details of grain size, grain shape and volume percentage of the
ferrite phase and pearlite phase obtained from the metallographic characterization of the
ferritic pearlitic steels in the 3D finite element simulation of the plastic deformation process in
the micro scale, a new methodology for mesh development is established. The advantages

4 Development of 3D multiphase FE model for micro-cutting 34
of this methodology lie in its simplicity and its ability to be integrated into any commercial
finite element software package. An overview of the new 3D multiphase Finite element model
development is provided in this section (figure 4-1). In the subsequent sections, each aspect
of this model development procedure is explained in detail. The overview is provided initially
to provide a better understanding of the structure of model development procedure. The new
methodology is explained is described in this section using generic terms without specific
reference to ferritic pearlitic steel to underline its applicability to general microstructure based
FE mesh development.
Figure 4-3: Microstructure based FE simulation of micro-cutting overview
The micro drilling process is chosen to validate the multiphase finite element material model.
DEFORM 3D is the finite element software chosen to simulate this process. The micro drill
and the work piece geometry is required to simulate the micro drilling process in DEFORM
3D. The work piece geometry is converted into a multiphase material based FE mesh instead
of the usual isotropic FE mesh. DEFORM 3D software has capability to provide different
material behavior modelling for different elements of a finite element mesh. This capability is
employed to generate a FE mesh which is termed as mixture material based FE mesh.
This mixture material based FE mesh does not reflect the microstructure geometry parame-
ters. A new algorithm to model the microstructure geometry parameters in three dimensions
to be used in the FE mesh. A program based on the new algorithm converts the mixture
material based FE mesh into a microstructure based FE mesh. This microstructure based FE
mesh is then employed by DEFORM 3D to simulate the micro drilling process in ferritic pearl-
itic steel.
Micro cutting process simulation
Microstructure based FE model with consideration of grain size, grain volume and phase volume percentage
mixture material based FE model without consideration of grain size, grain volume and phase volume percentage
Work piece CAD modelling (STL format) Solidworks
2010
WZL program
DEFORM 3D V10.2
DEFORM 3D V10.1
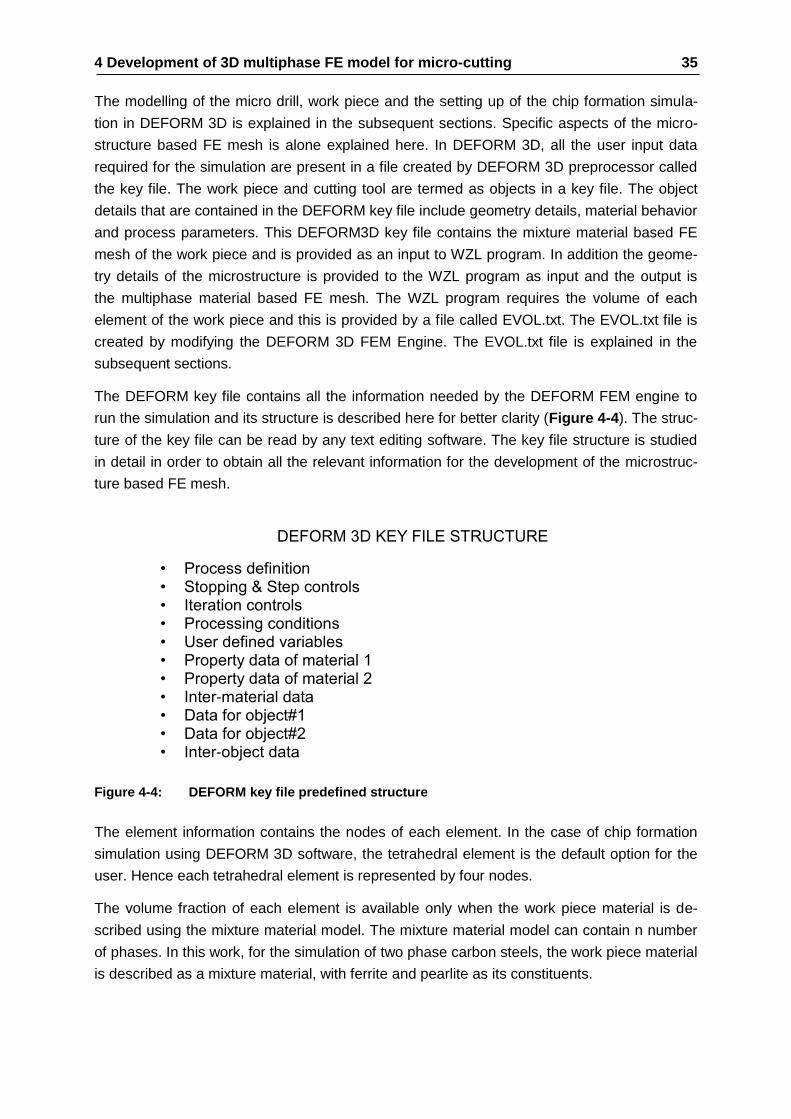
4 Development of 3D multiphase FE model for micro-cutting 35
The modelling of the micro drill, work piece and the setting up of the chip formation simula-
tion in DEFORM 3D is explained in the subsequent sections. Specific aspects of the micro-
structure based FE mesh is alone explained here. In DEFORM 3D, all the user input data
required for the simulation are present in a file created by DEFORM 3D preprocessor called
the key file. The work piece and cutting tool are termed as objects in a key file. The object
details that are contained in the DEFORM key file include geometry details, material behavior
and process parameters. This DEFORM3D key file contains the mixture material based FE
mesh of the work piece and is provided as an input to WZL program. In addition the geome-
try details of the microstructure is provided to the WZL program as input and the output is
the multiphase material based FE mesh. The WZL program requires the volume of each
element of the work piece and this is provided by a file called EVOL.txt. The EVOL.txt file is
created by modifying the DEFORM 3D FEM Engine. The EVOL.txt file is explained in the
subsequent sections.
The DEFORM key file contains all the information needed by the DEFORM FEM engine to
run the simulation and its structure is described here for better clarity (Figure 4-4). The struc-
ture of the key file can be read by any text editing software. The key file structure is studied
in detail in order to obtain all the relevant information for the development of the microstruc-
ture based FE mesh.
Figure 4-4: DEFORM key file predefined structure
The element information contains the nodes of each element. In the case of chip formation
simulation using DEFORM 3D software, the tetrahedral element is the default option for the
user. Hence each tetrahedral element is represented by four nodes.
The volume fraction of each element is available only when the work piece material is de-
scribed using the mixture material model. The mixture material model can contain n number
of phases. In this work, for the simulation of two phase carbon steels, the work piece material
is described as a mixture material, with ferrite and pearlite as its constituents.
DEFORM 3D KEY FILE STRUCTURE
• Process definition • Stopping & Step controls • Iteration controls • Processing conditions • User defined variables • Property data of material 1 • Property data of material 2 • Inter-material data • Data for object#1 • Data for object#2 • Inter-object data

4 Development of 3D multiphase FE model for micro-cutting 36
4.1.3 Algorithm to develop a 3D microstructure based FE mesh
To convert the 3D mixture material based FE mesh developed using DEFORM 3D V10.1 into
a microstructure based FE mesh using a standalone computer program based on given
parameters an algorithm was developed as part of this work (figure 4-5 and figure 4-6).
The inputs to this algorithm are the 3D geometry whose FE mesh is to be converted into a
multiphase material mesh, the grain volume and the volume percentage of the phase. This
particular algorithm is developed to convert a FE mesh into a two phase FE mesh. But the
approach can be extended to multiphase FE mesh generation easily.
Initially, points in 3D space are distributed in the given work piece geometry. The number of
points to be distributed in the 3D work piece geometry is equal to the number of grains of the
secondary phase. The number of grains present within the work piece geometry is calculated
from the phase volume percentage of the secondary phase. Given the volume percentage of
the secondary phase, grain volume and the 3D work piece geometry,
is calculated.
Figure 4-5: Microstructure based FE mesh development algorithm part 1
KEY *
gv → grain volume
Pvp → phase volume percentage
fmsh → FE mesh
evol → element volume file
tev → total volume of selected elements
sgp → selected gaussian point p → p(x,y,z) gp → gaussian point sp → seed point se → selected element mp=2 → material parameter of element =2
fe → finite element ev → element volume
* → Abbreviations arranged in order of appearance
obtain 3D geometry from the fmsh
gv, pvp,fmsh,evol
Disperse seed points in the 3D geometry based on gv and pvp
i=1; j=1;tev=0;
start
A

4 Development of 3D multiphase FE model for micro-cutting 37
With grains being represented by points and the number of grains being distributed inside the
3D geometry based on volume fraction of the microstructure phase (pvp), the points are to
be distributed using a Delanuay triangulation algorithm. This distributes the given points in a
random fashion representing the distribution of phases in a microstructure.Once these points
are uniformly distributed, each point is considered as a seed point (sp) and each seed point
represents the centroid of a grain. The points are stored in a separate array.
The procedure to represent one grain in the mesh is described as follows.To generate the
multiphase mesh, the mixture material model based FE mesh (fmsh) is imported and the FE
mesh nodes are read as 3D points (gp). The point (sgp) nearest to the first seed point is
identified. The DEFORM key file contains an array which relates each finite element (fe) to
their corresponding node points. Using this array, the associated finite element to the point is
selected. This selected finite element’s element number is stored in a seperate list.The
volume of the selected finite element (se) is obtained from EVOL.txt (evol) file. The selected
element’s volume (ev) is compared with the grain’s volume. When the selected element’s
volume is less than the grain’s volume (gv), the next element is selected and added to the
list. The newly selected element’s element number is also added to the list of element
numbers created with the selection of the first element.

4 Development of 3D multiphase FE model for micro-cutting 38
Figure 4-6: Microstructure based FE mesh development algorithm part 2
The combined volume (tev) of the two elements is calculated and compared with the grain
volume. This process is repeated till the combined volume increases the grain’s volume.
The material data of all the elements (mp) whose element number is present in the list is now
converted into phase 2. The procedure so far described creates one grain within the finite
eleemnt mesh whose grain volume is equal to or slightly greater than the average grain
volume which is provided as an input to the algorithm. This procedure is repeated for all the
seed points. The list of elements selected is cleared and the list is made empty and the
procedure repeated. When the procedure is completed for all the seed points, the finite
element mesh is converted from a simple mixture material model based FE mesh into a two
phase material based FE mesh.
sgp= min( p(gp)-p(sp (i)))
se=fe (j) ∈ sgp; mp(se)=2;
tev = tev + ev (se) if j+1 < te, se=fe (j+1) ∈ sgp
mp(se)=2
else
se = (gp+1) ∈ fe(j); mp(se)=2;
tev>gv
yes
sp≥nsp
no
i=i+1;
yes
j=1;tev=0;
end
A
no

4 Development of 3D multiphase FE model for micro-cutting 39
This algorithm can be extended to multiphase FE mesh generation by modifying the seed
point creation algorithm to accommodate separate seed point creation for different phases.
4.1.4 Implementation of algorithm into DEFORM 3D
The implementation of the algorithm developed has been done through a computer program
written in JAVA which converts the mixture material based DEFORM key file into a multi-
phase material model based FE mesh. The structure of the program developed is given in
the Figure 4-7. The DEFORM key file contains all the necessary data required by the FEM
engine to solve the problem. In addition to the above said parameters, one important param-
eter, the element volume has to be generated. The volume of a tetrahedral element is given
by
| − ∙ − − |
6 (7)
Where
a,b,c,d → Gaussian points described in 3 D coordinate system
V → element volume
Elements’ volumes are stored in a separate file called the EVOL.txt file. Since the elements’
volumes are available during the equation solving routine, the FEM engine is modified to
obtain these values and store them in a separate file.
The program flow is explained in the figure (Figure 4-7). The program calculates the number
of grains that will be accommodated in the given 3D volume based on the grain volume and
phase volume percentage. When the number of grains is calculated, these grains are distrib-
uted within the 3D volume using a particle dispersion algorithm. Each grain is described
using a point in Euclidean space. The Gaussian points in the 3D FE mesh is obtained from
the key file. Using the developed algorithm, the 3D FE mesh is converted into a multiphase
FE mesh. The developed algorithm can be used to generate n phase FE mesh although; the
implementation currently supports only a 2 phase material model.

4 Development of 3D multiphase FE model for micro-cutting 40
Figure 4-7: Pictorial representation of microstructure based FE mesh development algo-
rithm
Grain size (GS)
Phase volume % (PV)
DEFORM 3D V10.1
Work piece geometry
Key file with mixture material model FE mesh
All grain points are incorpo-rated
END
NO
YES
EV>GS
Adjacent elements are added to reach grain size
Each point represents a ferrite grain and is termed as grain point
Points distributed within the work piece geometry based on grain size and phase volume percent-age
geometrical comparison
DEFORM 3D
A finite element attached to the node is selected to represent a ferrite microstructure-and the element‘s volume is termed as EV.
FE node closest to grain point is selected
WZL Program

4 Development of 3D multiphase FE model for micro-cutting 41
4.1.5 Preliminary validation of 3D multiphase FE model using tension, com-
pression and shearing tests
The developed 3D multiphase FE model’s ability to simulate large deformation process is
tested primarily by simulation of individual loading conditions of tension, compression and
shear carried out using DEFORM 3D V10.2 and the efficacy of the 3D multiphase FE model
in comparison to the experiment is tested. To simulate the 3D multiphase FE model’s ability,
a two phase 3D FE model for the ferritic pearlitic steel from the micrographs shown and grain
geometry data obtained using the line intercept method. To perform this preliminary valida-
tion, since the multiphase FE model is developed on the basis of representative volume
element, a representative volume element of 0.1 mm3 is selected and tension, compression
and shear loading test simulations are carried out on it (Figure 4-8). From the figure, it is
clear that a FE mesh developed using the newly developed methodology is able to replicate
the microstructure geometry. The pearlite and the ferrite phase’s shape are being clearly
captured in the finite element mesh.
Figure 4-8: Two phase 3D FE model developed for simulation of ferritic pearlitic steel plas-
tic loading
The tensile test specimen’s necking area is meshed using a mesh density window and rep-
resents the representative volume element. The tensile tests were conducted experimentally
and the newly developed multiphase finite element mesh methodology’s ability to capture the
deformation process is established. The time step parameter is set at 10-7 sec and the veloci-
ty of the top plate is set at 10000 mm/sec. The step parameter is selected so that the steady
state is reached well in advance before the deformation of the material. This is carried out
using a trial and error method. The load along the axis of the specimen is obtained using
DEFORM post processor. The bottom surface of the tensile test specimen is fixed in space
and the top surface is fixed with the top plate. The interface between the top plate and the
contact surface of the tensile test specimen is inseparable.
The compression loading simulation and the shear loading simulation is similarly carried out
in a similar fashion in DEFORM 3D. The compression loading is carried out using a cylinder
specimen and the shear loading is carried out using a cube shaped specimen. The compres-
Pearlite
Cross section Longitudinal section
Two-phase 3D FE model(0.1 x 0.1 x 0.1 mm)
Ferrite
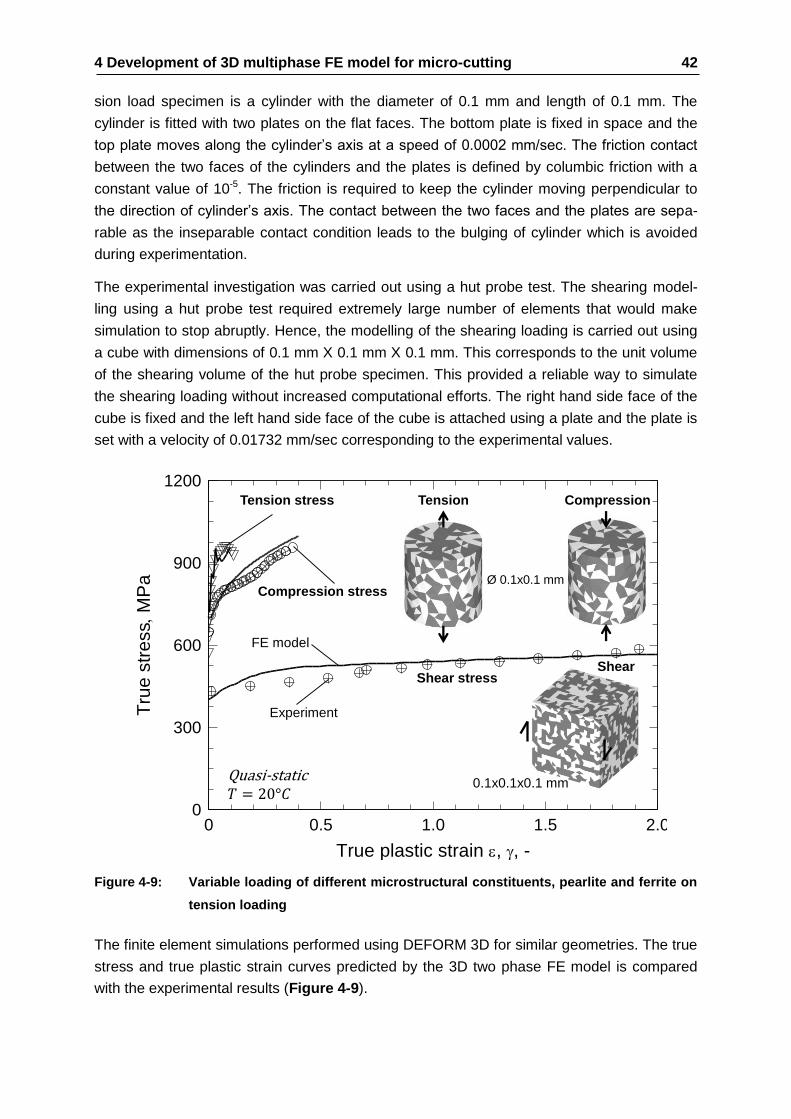
4 Development of 3D multiphase FE model for micro-cutting 42
sion load specimen is a cylinder with the diameter of 0.1 mm and length of 0.1 mm. The
cylinder is fitted with two plates on the flat faces. The bottom plate is fixed in space and the
top plate moves along the cylinder’s axis at a speed of 0.0002 mm/sec. The friction contact
between the two faces of the cylinders and the plates is defined by columbic friction with a
constant value of 10-5. The friction is required to keep the cylinder moving perpendicular to
the direction of cylinder’s axis. The contact between the two faces and the plates are sepa-
rable as the inseparable contact condition leads to the bulging of cylinder which is avoided
during experimentation.
The experimental investigation was carried out using a hut probe test. The shearing model-
ling using a hut probe test required extremely large number of elements that would make
simulation to stop abruptly. Hence, the modelling of the shearing loading is carried out using
a cube with dimensions of 0.1 mm X 0.1 mm X 0.1 mm. This corresponds to the unit volume
of the shearing volume of the hut probe specimen. This provided a reliable way to simulate
the shearing loading without increased computational efforts. The right hand side face of the
cube is fixed and the left hand side face of the cube is attached using a plate and the plate is
set with a velocity of 0.01732 mm/sec corresponding to the experimental values.
Figure 4-9: Variable loading of different microstructural constituents, pearlite and ferrite on
tension loading
The finite element simulations performed using DEFORM 3D for similar geometries. The true
stress and true plastic strain curves predicted by the 3D two phase FE model is compared
with the experimental results (Figure 4-9).
0
300
600
900
1200
0 0.5 1.0 1.5 2.0
True plastic strain e, , -
Tru
e s
tre
ss M
Pa
CompressionTension
Ø 0.1x0.1 mm
Shear
0.1x0.1x0.1 mmQuasi-static
FE model
Experiment
Tension stress
Compression stress
Shear stress

4 Development of 3D multiphase FE model for micro-cutting 43
The finite element simulation of the tensile loading clearly predicts the loading of the harder
pearlite phase and the earlier yielding of the ferrite phase. This clearly indicates the ability of
the multiphase FE model to differentiate between the different phases present in the micro-
structure and the yielding of the softer pearlite phase as displacement increases. In the
developed FE model, the behavior of both the ferrite and pearlite phase are considered to be
plastic with no fracture as the main aim is not complete simulation of the tensile loading.
In a similar way, the finite element simulation for compression loading is carried out similar to
the case of tensile loading. The ability to simulate the work piece behavior under compres-
sion loading is more important compared to tensile loading as plastic deformation during chip
formation in micro cutting process involves the compressive loading of the work piece mate-
rial which lies ahead of the cutting edge before reaching the shear plane. The finite element
simulation of the compression loading of AISI 1045 microstructure is in good agreement with
the experimental values. The simulation is able to predict the larger load bearing capability of
the harder pearlite microstructure phase compared to the softer ferrite phase. The stress
path traced under compression loading is in very good to experimental curve fitting.
The FE simulation of the AISI 1045 microstructure using the multiphase FE model is im-
portant to prove its capability in modelling the plastic deformation taking place in the primary
shear area in micro cutting. The true stress – true strain curve obtained under shear loading
through experiments is very well reproduced by the 3D two phase FE model.
These simulations prove that the 3D multiphase FE methodology is able to model the AISI
1045 microstructure under simple cases of tensile loading, compression loading and shear
loading. With the simple cases of loading being simulated with good accuracy, the more
complex loading of chip formation in AISI 1045 microstructure is carried out.
4.2 Johnson-Cook (JC) model development methodology for all
carbon steels
As part of this work, a methodology to obtain the Johnson Cook parameters for a given mi-
crostructure composition is developed. In general, Johnson Cook model is developed for
each specific microstructure. This involves extensive material testing for each microstructure.
In the newly developed methodology, the Johnson Cook model for the different phases pre-
sent in a composite microstructure is utilized to develop the Johnson Cook model. In this
methodology, the rule of linear mixtures is employed to relate the different phases to the
required microstructural composition [WILLI08]. The composite microstructure is considered
as the sum of its individual microstructure phases. For the family of carbon steels, the ferrite
and pearlite are considered the two important microstructure phases which sums up close to
99% volume. This in turn, leads to the conclusion that the carbon steel’s thermo-mechanical
behavior can be ascertained from the thermo-mechanical behavior of its constituent micro-
structural phases, ferrite and pearlite which are obtained from the thermo-mechanical behav-
ior of C05 steel and C75 steel.

4 Development of 3D multiphase FE model for micro-cutting 44
4.2.1 JC model development methodology for ferritic pearlitic steels
The rule of mixtures is used to relate the properties of a composite whose constituents are A
and B. According to the law of mixtures, eq. 8,
(8)
-
-
-
-
-
The rule of mixture states that the property of a composite can be broken down into the
properties of its constituents. The influence of each phase depends on the phase’s fraction in
the composite. An additional condition applies that the phases fA and fB constitute the 100 %
weightage of the composite (Equation 9).
(9)
This formulation is used to calculate the values of the constants of the Johnson Cook Model
for various compositions of the ferritic pearlitic steel.
In ferritic pearlitic steel, the fraction of the ferrite phase fF and pearlite phase fP is obtained
from the Iron-Iron carbide diagram. As an example the fraction of ferrite phase and pearlite
phase in AISI1045 carbon steel is calculated as follows. The carbon percentage in AISI 1045
carbon steel is 0.45 weight %. The C75 carbon steel (carbon wt. %=0.75) is considered as
100% pearlite and C05 carbon steel (carbon wt. %=0.05) is considered as 100% ferrite.
Applying the lever rule in the Iron-Iron carbide diagram,
6 − 4
6 −
4 4
− 4
The Johnson Cook model for the ferrite phase is obtained from the flow curve of C05 steel
composition and the Johnson Cook model for the pearlite phase is obtained from the flow
curve of C75 microstructure composition. Other influences, such as the shape of the phases,
the interphase relationship are not considered in this work.
The flow curve of ferrite phase is written as follows, eq. 10,
( ) (
) ( − (
− −
)
) (10)
Where the subscript ‘ ’ represent ferrite phase.
The Johnson Cook model for the pearlite phased is written as follows, eq. 11,

4 Development of 3D multiphase FE model for micro-cutting 45
( ) (
) ( − (
− −
)
) (11)
Where the subscript ‘ ’ represent pearlite phase.
To calculate the constants of the Johnson Cook model for any composition of ferritic pearlitic
steel, the linear law of mixtures is applied as follows, eq. 12,
− (12)
Where represent the flow stress of the ferritic pearlitic steel composition with percent-
age of ferrite and percentage of pearlite.
To calculate the value of the constant, the yield stress of the composite, the yield stress of
the constituent phases is to be added according to the linear rule of mixtures. The yield
stress is obtained by applying the following conditions.
to the flow stress equations of ferrite phase and pearlite phase.
Applying the above conditions to equation for and leads to
Applying the above equations in the rule of mixtures leads to
−
( − )
To calculate the value of the constant the following conditions are applied to the flow
stress equations.
This leads to
( ) ( )
Applying the above equations to the rule of mixtures provides
− ( ) ( )
Subtracting the above equation by the Ac equation,
−
( − )
To calculate the value of n, the conditions,

4 Development of 3D multiphase FE model for micro-cutting 46
are applied to obtain
Differentiating on both sides with respect to strain,
− [ ( )] [ ( ( ))]
When ,
− [ ] [ ]
( ) (( ) − ( ))
To calculate the value of C, the conditions
are applied.
This result in
(
)
(
) ( − ( (
))) ( ( (
)))
(
) (( − ( (
))) ( ( (
))))
When
(( − ( ( ))) ( ( ( ))))
(( − ( ( ))) ( ( ( ))))
( ) ( ( ) − ( ))
To calculate the value of the constant m, the conditions
Is applied which leads to the equation
( − (
)
)

4 Development of 3D multiphase FE model for micro-cutting 47
Differentiating on both sides
(
)
(
)
When
− (
− )
(
) ( − ) (
) (
)
( − ) ( ) ( )
( ) (( ) − ( ))
Thus the flow curves of any ferritic pearlitic steel can be obtained from the flow curves of its
constituent phases as follows, eq.13 - eq.17,
( − ) (13)
( − ) (14)
( ) (( ) − ( )) (15)
( ) ( ( ) − ( )) (16)
( ) (( ) − ( )) (17)
This methodology provides an easy approach to calculate the Johnson Cook model parame-
ters for all any microstructure when the phase constituents of the microstructure are known.
4.2.2 Validation of the JC model development methodology
The developed model is validated using the high speed compression test results. The values
of the flow stress for C45 composition in normalized conditions are provided for a constant
strain of 0.1(Table 4.4).
Table 4-4: Flow curve data for a constant strain of 0.1 for various strain rates at room
temperature
Strain rate 0.003 0.08 0.72 3409 3745 3980 4214 4527
Flow stress 808.82 818.73 831.53 939.31 964.92 994.66 1024.63 1025.23
For a constant strain of 0.1 at room temperature
The flow stress curves are provided in a log-log graph to accommodate the range of strain
rate which ranges from o.03 to ~4500. The graph clearly shows the validity of the newly

4 Development of 3D multiphase FE model for micro-cutting 48
developed methodology for obtaining the flow stress curves of a multiphase material by
applying the law of mixtures to the constituents of the multiphase material (Figure 4-10).
Figure 4-10: Validation of flow curve modelling methodology using law of mixtures
Using this methodology, the Johnson Cook parameters for any composition can be obtained
from the Johnson Cook parameters of its constituents. The deviation at higher strain rates is
explained with the reference to the grain boundaries. If the grain boundaries are included into
the formulation, the methodology can be improved further to give accurate results.
0
200
400
600
800
1000
1200
1400
0.001 0.1 10 1000
Strain rate de/dt, 1/s
Tru
e co
mpre
ssio
n s
tres
s, M
Pa
5 Validation of 3D multiphase FE model using micro drilling process simulation 49
5 Validation of 3D multiphase FE model using micro drill-
ing process simulation
The 3D multiphase FE material model in this work is validated by testing its capability to
simulate the effect of microstructure during plastic deformation analysis of ferritic pearlitic
steels. Plastic deformation in multiphase materials is orthotropic and takes place primarily in
the grain boundaries. Since the plastic deformation of materials for manufacturing purposes
for all practical reasons takes place in the macro-scale, work piece material behavior in
manufacturing process simulation have so far been considered isotropic. With the venture of
traditional manufacturing process technologies into the micro scale, the isotropic material
behavior assumption does not hold good anymore. Hence the newly developed 3D multi-
phase FE model would be a better candidate to simulate the manufacturing process and
validate its efficacy.in simulating the plastic deformation.
In this work, the 3D multiphase FE model is used for the simulation of chip formation process
during micro drilling process. This chip formation process simulation is carried out using
DEFORM 3D V10.2 finite element simulation package. DEFORM 3D is a finite element simu-
lation package specifically used for the simulation of plastic deformation during various man-
ufacturing processes like forming and machining. In this FEM software, the chip formation
process is simulated using an updated Lagrangian formulation.
The chip formation simulation process using DEFORM 3D can be segregated into micro twist
drill geometry modelling, the work piece geometry modelling, work piece material modelling,
cutting tool material modelling, process parameter setting, boundary condition setting, simu-
lation set up and inter object interaction modelling . The 3D CAD modelling of cutting tool is
done as part of a previous work. The work piece geometry modelling is carried out using
Solid works 2010 employing the cutting tool model’s geometry as a reference. The material
flow behavior for the work piece is defined using the Johnson Cook model. For the micro
drilling process, the work piece material is considered anisotropic and hence the Johnson
Cook model for the phase constituents, pearlite and ferrite is employed in mixture material
model. Feed forces and torque predicted during the micro drilling chip formation simulation
process is compared with the isotropic finite element model and experimental investigation
results.
In the following section, the micro drilling experiments and the micro drilling simulation using
the 3D multiphase FE material model with focus on cutting tool modelling, work piece model-
ling, material behavior modelling and setting up of the simulation is presented.
5.1 Experimental setup for micro drilling & results
The micro drilling process is carried out using a high precision KERN Evolution machine tool.
This machine tool has a positioning accuracy of ±0.5 µm as the drive for these high precision
systems are provided by direct digital drives with AC Servo motors and Heidenhein glass
measuring scales with a resolution of ±0.1 µm. The maximum spindle speed is 160,000 rpm

5 Validation of 3D multiphase FE model using micro drilling process simulation 50
using HSK 25 adaptor. The machine tool built using special high tech material provides the
maximum rigidity under static and dynamic conditions, higher vibration absorption compared
to cast iron and lower sensitivity to temperature fluctuations. The machine tool comes with a
a laser based non-contact measuring system for the measurement of the cutting tool geome-
try for offsetting and accurate positioning. This system is able to measure the length, radius
and concentric accuracy even at high speeds. The data obtained using the laser based
measuring system is directly transferred to the Heidenhein contouring control and are taken
into consideration in the active program. These characteristics make the KERN Evolution
machine tool the best option for carrying out the micro drilling experiments.
Figure 5-1: Machine tool setup for micro drilling experiments and microdrill geometry em-
ployed
To calculate the feed forces and the torque generated during the micro-drilling process,
special cutting force measurement systems are used. Although a large number of research
has been conducted in the field of monitoring of cutting operations using different types of
measurement techniques, direct dynamometer based cutting force measurement systems
are still considered the most reliable for high frequency cutting operations like micro milling
and micro cutting. In micro milling, the tool contact frequency is the primary reason for the
higher frequencies during the cutting process whereas during the micro drilling process, run
out deviation present in the micro drills lead to a similar high frequency cutting tools. There-
fore dynamometer based cutting force measurement used in micro milling process would
best suit the micro drilling process. A specific dynamometer based measurement system
depicted by Klocke et al [KLOC11] is used in the present study. This measurement system
will also have to exhibit high dynamical behavior to be able to capture the torque generated
during micro drilling experiments.

5 Validation of 3D multiphase FE model using micro drilling process simulation 51
Figure 5-2: Measurement set up for micro drilling experiments
In this measurement setup, two sensors, one for cutting force measurement and the other for
torque measurement are used. A Kistler dynamometer 9256B is used for the cutting force
measurement. This dynamometer consists of four 3-component piezoelectric sensors and is
able to measure forces in 3 directions with a range of ±250N. The Kistler dynamometer
9256B are insensitive to temperature measurement and is best suited for measurement in
machining process study because of its small size with low response threshold, high sensitiv-
ity and high natural frequency. In addition to the measurement of cutting forces, it is also able
to measure the torque generated using single sensor signals and the geometrical distance
between the sensor location and the point of torque application. But the dependence on this
single dynamometer for the measurement of cutting torque is not justified due to its low
quality of torque results compared to measurements using specific torque measuring sen-
sors.
Therefore to measure the torque generated during cutting with the highest level of accuracy,
an additional Kistler 9329A type torque sensor is employed. This torque sensor because of
its low weight of 50 grams can be loaded directly on the 9256B dynamometer. The dyna-
mometer also exhibits higher natural frequency, lower threshold and acceptable cross talk
behavior. It exhibits a natural frequency larger than 53 KHz and leads to accurate measure-
ments at 160000 rpm of the cutting tool. With a low threshold of 0.03Nmm and a high sensi-
tivity of >2000 ρC/Nm, these torque sensors can be used for torque measurement of cutting
tool diameter of 100 µm. In addition with a lower influence of axial forces onto the torque
signal with a maximum cross talk of 0.01 Nmm / N, it exhibits a maximum cross talk of 0.35
Nmm / N, which is less than 3% for a measurement of a 1 mm drilling process. The output
from these sensor are in Coulombs of charge and are converted into standard voltage sig-
nals using charge amplifiers with a 16 bit National instruments data acquisition card which is
realized using NI LabVIEW. The data obtained thereof is analyzed using NI DIAdem.
The micro twist drills from SPHINX cutting tools are manufactured using ultra-fine grain
carbide (HW-K20). The cutting speeds suggested by the manufacturer for these cutting tools
Workpiece
Force measuring dynamometer
Kistler 9256B
Torque sensor Kistler 9329

5 Validation of 3D multiphase FE model using micro drilling process simulation 52
lie in the range of 35-95 m / min. The drilling depth is maintained at a constant value of 2xd
and the cutting is performed in the dry conditions. The experimental results are tabulated in
Table 5.1. In addition to the feed forces and torque, the chips are also collected and ob-
served.
Table 5-1: Cutting parameters, measured feed force and torque in micro drilling
Diameter
/ µm
RPM
/ 1/min
Feed
/ µm
Feed force
/ N
Torque
/ Nmm
50 160000 0.6 0.27 Not measurable
100 111410 1.2 0.65 0.027
200 55704 2.4 2.0 0.202
300 37136 3.6 4.5 0.553
400 27852 4.8 7.3 1.196
500 22282 6.0 11.3 1.446
600 18568 7.2 14.3 2.811
800 13926 9.6 21.4 5.850
1000 11141 12 35.0 11.650
To compare the feed forces and torque during micro drilling process, the feed forces and
torque obtained from the micro drilling experiments are converted into related feed force and
related torque. The related feed force and related torque are obtained by dividing the feed
forces and torque by the cross sectional area of the chip. The cross sectional area of the chip
is calculated by multiplying by the drill’s cutting edge length with the feed per cutting edge.
( )
( )
Where
Related feed force (kN/mm2)
Maximum feed force (kN)
Related torque (kNmm/mm2)
Maximum torque (kNmm)
Drill diameter (mm)
Feed rate per revolution (mm/ rev)

5 Validation of 3D multiphase FE model using micro drilling process simulation 53
Figure 5-3: Experimental related feed force and related torque in micro drilling process
The experimental results clearly show the scaling effect in micro drilling process
(Figure 5-3). In micro drilling process using a twist drill, as the diameter is reduced from
1000 µm to 50 µm, the related feed force increases. This increase in related feed force is
directly related with the increase in chisel edge width in the micro drill geometry family em-
ployed for the micro drilling experiments. The increase in the chisel edge width with reduction
in the drill diameter is warranted due to the need for the increase in rigidity of the drill. With
the increase in the chisel edge width, the ratio of the cutting area under the main cutting
edge proportionally reduces leading and leads to less uncut chip width under the main cut-
ting edges and the remaining area under the chisel edge width being ploughed. This is
proved as the torque generated during the micro drilling process show a linear trend as the
cutting diameter increases.
5.2 Cutting process simulation set up in DEFORM 3D
The simulation of micro drilling process is carried out using DEFORM 3D employing the
updated Lagrangian formulation. The DEFORM 3D simulation package contains three main
divisions namely Preprocessor, FEM engine and post processor. The preprocessor is used
to build the FE model and the output of the preprocessor is the key file. The preprocessor
builds the key file employing the geometry data, constitutive material models, cutting process
parameters and the simulation specific parameters. In addition to the key file, the preproces-
sor builds the data base file, which is machine readable and is used to store the simulation
output parameters.
0
4
8
12
16
20
0 1 2 30
2
4
6
8
10
12
Experiment
tr
kf
Workpiece material: C45 normalized # Cutting material: HW-20Cutting speed: v
c = 35 m/min # Feed: f = 0.012*d # Cooling: dry
Drill diameter d, mm
Re
late
d f
ee
d f
orc
e k
f ,
(kN
/mm
2)
Re
late
d t
orq
ue
tr ,
(kN
mm
/mm
2)

5 Validation of 3D multiphase FE model using micro drilling process simulation 54
The work piece geometry and the micro drill geometry are modeled using Solidworks 2010
and imported using the standard .STL Format. The constitutive material models of the pearl-
ite phase and ferrite phase are used in this multiphase material FE model. The general pro-
cedure for setting up the simulation of metal cutting process in DEFORM 3D preprocessor is
outlined (Table 5.2). The simulation procedure is divided into simulation set up, object defini-
tion, Material, Object definition and inter object relationship. These subdivisions are detailed
in the following section with reference to the micro twist drilling process on AISI 1045 normal-
ized steel.
Table 5-2: Parameters involved in the FEM simulation of metal cutting using DEFORM 3D
Sim
ula
tio
n
set
up
Type of simulation Updated Lagrangian formulation
Mode Deformation, heat transfer
Step definition Time increment
Ob
ject
defi
nit
ion
Object Work piece Cutting tool
Object type definiti-on Plastic Rigid
Geometry import Work piece 3D CAD model Micro twist drill 3D CAD model
Mesh ~100000 elements ~30000 elements
Remesh criteria Local remeshing No remeshing
Movement None Translation & Rotation
Boundary conditions
- Velocity in X,Y & Z direc-tions of outer surface & bot-tom surface is zero
- Heat transfer
Heat transfer
Material
AISI 1045
mixture material model -Pearlite -Ferrite
Tungsten carbide
Object positioning Contact between cutting edge and work piece cut surface
Inter object relationship Friction Interface heat (N/sec/mm/C)
Work piece-Work piece Coulomb friction factor Constant
Top die-Work piece Coulomb friction factor constant

5 Validation of 3D multiphase FE model using micro drilling process simulation 55
5.2.1 Simulation set up
As the simulation of the chip formation process in micro twist drilling falls under the large
scale plastic deformation mechanics the updated Lagrangian formulation is selected in addi-
tion to heat transfer module. The heat generated during the chip formation process influ-
ences the process to a large extent and hence the equations of deformation and heat trans-
fer are solved simultaneously.
In updated Lagrangian simulation, the time step is crucial to keep the computational error at
a minimum thereby ensuring a stable simulation. An approximate value for the time step is
given by DEFORM as
To optimize the simulation for faster computation, the time step for simulation is divided into
time step during plunging and time step during cutting. The time step for the different drill
diameters are provided in the following table for a comparison (Table 5.3).
Table 5-3: Time step parameter for various drill diameters in DEFORM 3D
Drill diameter
/ µm
Time step during
plunging
/ sec
Time step during
cutting
/ sec
100 5xe-6
1xe-6
500 2xe-6
1xe-6
1000 1xe-5
2xe-5
The time step for the plunging step is kept smaller compared to the time step during cutting
as the mesh under the main cutting edge is deformed to take the shape of the cutting edge
with consideration of the edge rounding. The edge rounding of the cutting edge influences
the number of steps to replicate the subtracted surface of the rounded cutting edge
(Figure 5-4). The number of steps required for the plunging of the drill into the work piece
depends on the drill’s cutting edge radius. With the cutting edge radius getting larger, depth
to which the cutting edge has to be plunged is increased for constant mesh size. This in turn
increases the number of time steps for the plunging and in turn the simulation has to be run
for more than one revolution when the plunge depth increases above the feed rate during
cutting.
The plunging of the cutting tool is carried out by translation of the cutting tool along the cut-
ting tool axis in the direction of the work piece. During the penetration, the cutting edge inter-
feres with the work piece mesh. The mesh penetration leads to remeshing to be initiated.
With remeshing, the work piece mesh takes the shape of the twist drill edge and leads to
chip formation. The speed of the cutting tool is usually higher by an order of 2 compared to
the cutting tool feed velocity for a faster computation.

5 Validation of 3D multiphase FE model using micro drilling process simulation 56
Figure 5-4: Plunging of the work piece and initiation of chip formation with consideration of
cutting edge rounding
5.2.2 Object definition & object positioning: Cutting tool & work piece
The cutting tool and the work piece are defined as Objects in DEFORM 3D. The object defi-
nition includes all aspects of the cutting tool and work piece that are required for the solver to
solve the finite element equations.The object definition includes deformation mode of the
material, geometry, mesh definition, translational and rotational movement and boundary
conditions. The object definition and object positioning of the work piece is defined in this
subsection. The work piece is defined as plastic neglecting the elastic deformation to reduce
the complexity of the simulation and as the main priorities of simulation are the cutting force
generation and chip form prediction during chip formation. The geometry of the work piece is
generated with reference to the specific micro twist drill. The geometry is imported into DE-
FORM through the .stl format. The .stl format stands for Standard tessellation language and
describes the geometry using raw unstructured triangulated surfaces by the unit normal and
vertices of the triangles using a three dimensional Cartesian coordinate system. In this work,
the 3D Coordinate system is defined with the origin at the point of contact of the work piece
with the micro twist drill’s center.
The tetrahedral element is used for the meshing of a 3 dimensional geometry in DEFORM.
The mesh definition takes place in three stages. The first stage of mesh definition is the
number of elements and size ratio. The number of elements for a work piece range from
100000 to 150000. The size ratio is defined as the ratio between the maximum element size
and minimum element size. A size ratio of 10 is recommended by DEFORM to mesh the
work piece during chip formation simulation. The second stage of mesh definition is the
weighting factors. The weighting factors are based on surface curvature, temperature defini-
1 2 3
4 5
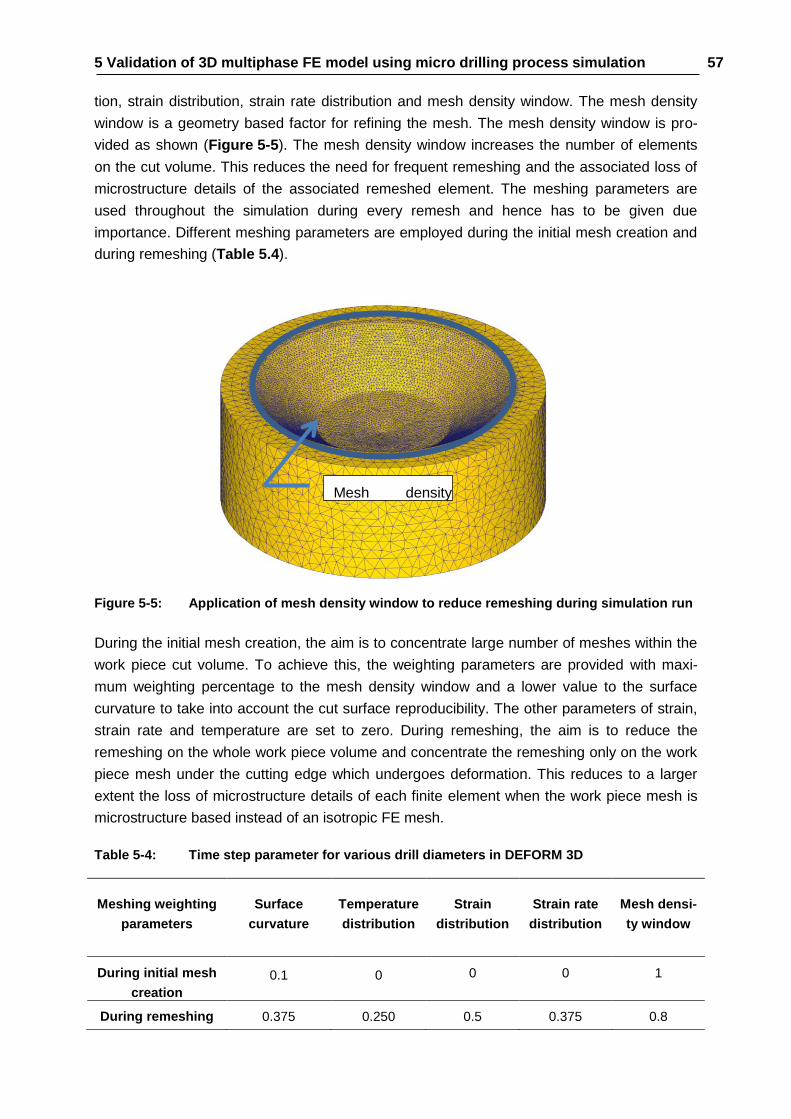
5 Validation of 3D multiphase FE model using micro drilling process simulation 57
tion, strain distribution, strain rate distribution and mesh density window. The mesh density
window is a geometry based factor for refining the mesh. The mesh density window is pro-
vided as shown (Figure 5-5). The mesh density window increases the number of elements
on the cut volume. This reduces the need for frequent remeshing and the associated loss of
microstructure details of the associated remeshed element. The meshing parameters are
used throughout the simulation during every remesh and hence has to be given due
importance. Different meshing parameters are employed during the initial mesh creation and
during remeshing (Table 5.4).
Figure 5-5: Application of mesh density window to reduce remeshing during simulation run
During the initial mesh creation, the aim is to concentrate large number of meshes within the
work piece cut volume. To achieve this, the weighting parameters are provided with maxi-
mum weighting percentage to the mesh density window and a lower value to the surface
curvature to take into account the cut surface reproducibility. The other parameters of strain,
strain rate and temperature are set to zero. During remeshing, the aim is to reduce the
remeshing on the whole work piece volume and concentrate the remeshing only on the work
piece mesh under the cutting edge which undergoes deformation. This reduces to a larger
extent the loss of microstructure details of each finite element when the work piece mesh is
microstructure based instead of an isotropic FE mesh.
Table 5-4: Time step parameter for various drill diameters in DEFORM 3D
Meshing weighting
parameters
Surface
curvature
Temperature
distribution
Strain
distribution
Strain rate
distribution
Mesh densi-
ty window
During initial mesh
creation
0.1 0 0 0 1
During remeshing 0.375 0.250 0.5 0.375 0.8
Mesh density

5 Validation of 3D multiphase FE model using micro drilling process simulation 58
A challenge with the microstructure based finite element creation is the need for an extreme-
ly large mesh number to accommodate simultaneously the work piece geometry and the
sufficient number of meshes for one single grain. This is possible to a certain extent using
the above mesh weighting parameters.
The work piece is fixed to the coordinate system. This is done by fixing the velocity of the
outer surface of the work piece and the bottom surface to zero in x, y and z direction. The
boundary condition for the heat transfer is given in two steps (Figure 5-6).
The heat transfer of all the nodes within the work piece is provided as heat conductive and
the outer and bottom surfaces act as heat sink. Hence the temperature of the outer surface
and the bottom surface is kept at a constant of 20oC.
A new origin is created on the cut surface at the center of the work piece in the Solid works
CAD model and this origin is specified during the .stl file creation. This origin is brought to the
DEFORM 3D coordinate system origin using the rotation and drag method within the object
positioning dialog box.
Figure 5-6: Boundary conditions for velocity and heat transfer in work piece
The object positioning of the cutting tool is defined as follows in reference to work piece
positioning. The cutting tool object is defined as a rigid object. The rigid object type is used
as the simulation does not aim to simulate the cutting tool deflection but only the cutting tool
temperature is to be ascertained. The geometry of the micro twist drill is also modeled using
Solid works 2010 and .stl format is used for the import of the micro twist drill into DEFORM
3D.
The meshing of the micro twist drill is done in a single step and is relatively simple compared
to the meshing of the work piece as the rigid material does not need remeshing during the
simulation run. The micro twist drill is meshed with approximately 30000-50000 elements
with the mesh density window concentrated near to the cutting edge (Figure 5-7). The
weighting parameters are set with highest weightage to mesh density window and other
weighting parameters set to zero during initial mesh generation.

5 Validation of 3D multiphase FE model using micro drilling process simulation 59
The cutting tool movement is defined within the object movement controls. The feed rate and
cutting speed are used to define completely the motion of the cutting tool. The feed rate is
defined in mm/sec and directed in the –Z direction in accordance with the work piece posi-
tion. The cutting tool movement is defined for translational direction for the initial plunging
step and the rotational movement is added during chip formation simulation. The cutting
tool’s translational movement is set at two times the feed rate during cutting to reduce the
number of steps required for plunging. The cutting speed is specified after the required
plunging is reached.
The feed rate of the drill into the work piece is given as axial velocity in mm/min and is de-
rived from the concept of minimum chip thickness.
(
) (18)
The value of feed rate is given in the form of
and is termed as feed velocity.
Figure 5-7: Meshing of twist drill geoemtery
The cutting speed is converted into revolutions per minute and provided in the rotation com-
ponent of the cutting tool. The drill’s cutting speed is given by
(19)
Fine mesh near to
the cutting edge
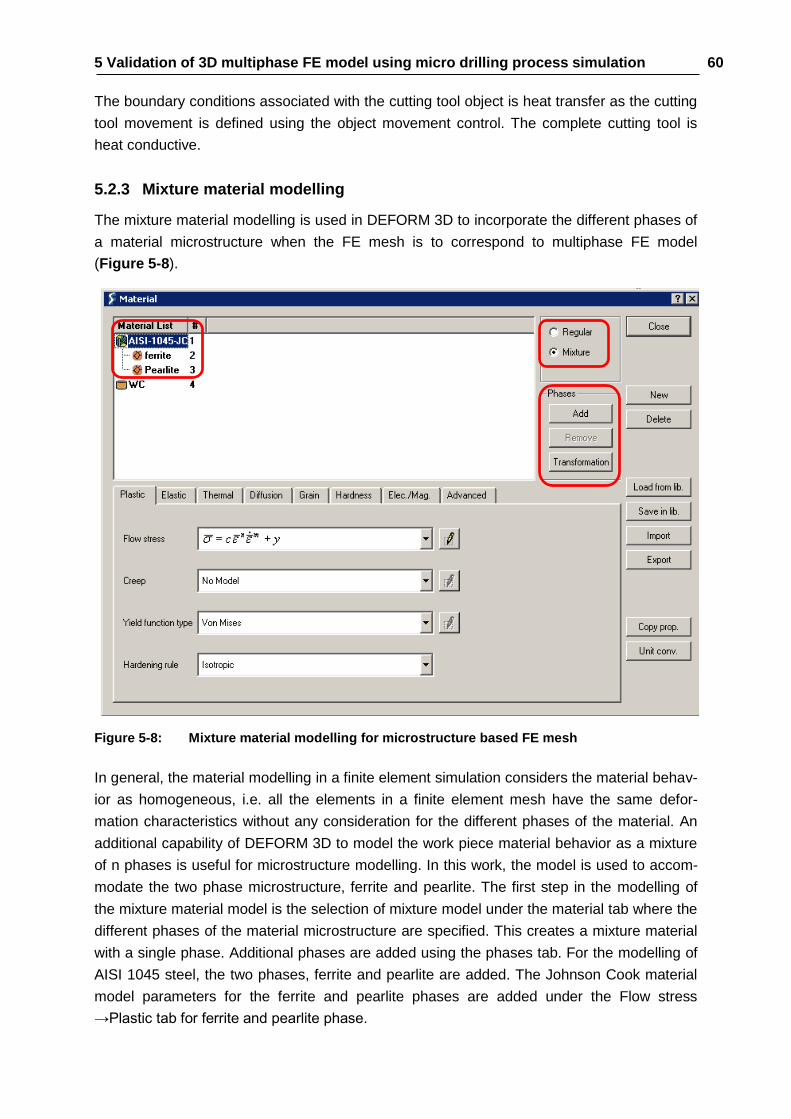
5 Validation of 3D multiphase FE model using micro drilling process simulation 60
The boundary conditions associated with the cutting tool object is heat transfer as the cutting
tool movement is defined using the object movement control. The complete cutting tool is
heat conductive.
5.2.3 Mixture material modelling
The mixture material modelling is used in DEFORM 3D to incorporate the different phases of
a material microstructure when the FE mesh is to correspond to multiphase FE model
(Figure 5-8).
Figure 5-8: Mixture material modelling for microstructure based FE mesh
In general, the material modelling in a finite element simulation considers the material behav-
ior as homogeneous, i.e. all the elements in a finite element mesh have the same defor-
mation characteristics without any consideration for the different phases of the material. An
additional capability of DEFORM 3D to model the work piece material behavior as a mixture
of n phases is useful for microstructure modelling. In this work, the model is used to accom-
modate the two phase microstructure, ferrite and pearlite. The first step in the modelling of
the mixture material model is the selection of mixture model under the material tab where the
different phases of the material microstructure are specified. This creates a mixture material
with a single phase. Additional phases are added using the phases tab. For the modelling of
AISI 1045 steel, the two phases, ferrite and pearlite are added. The Johnson Cook material
model parameters for the ferrite and pearlite phases are added under the Flow stress
→Plastic tab for ferrite and pearlite phase.

5 Validation of 3D multiphase FE model using micro drilling process simulation 61
The second step in the modelling of the mixture material model is the incorporation of the
phase volume percentage for each phase. In addition the grain volume is also to be incorpo-
rated. The ability to incorporate both the phase volume percentage and grain volume is not
available within the capability of DEFORM 3D V10.2. This has been done using the newly
developed methodology. Initially to add the volume fraction details to the simulation key file,
the volume fraction of the mixture material model is defined by Element data under the ad-
vanced tab in the work piece object (Figure 5-9).
Figure 5-9: Preliminary mixture material based FE mesh development
The volume fraction detail of the mixture material model is incorporated into the simulation
key file (Figure 5-10). The volume fraction of one phase, for e.g. pearlite is made 100 % and
a group of elements without consideration of phase volume percentage and grain volume is
selected. The volume fraction is the parameter that is modified using the algorithm and pro-
gram developed in the previous section.
Figure 5-10: Volume fraction information format in DEFORM 3D key file
The next step in the mixture material modelling is the incorporation of the phase volume
percentage and the grain volume. This is carried out using the program developed as part of
VOLFC 1 859102 2 0.0000000E+000
1 0.0000000E+000 1.0000000E+000
2 1.0000000E+000 0.0000000E+000
… ……. …….
… ……. …….
Object
Number of elements
Number of phases

5 Validation of 3D multiphase FE model using micro drilling process simulation 62
this work. Figure 5-10 shows the format of the volume fraction in key file which is modified
according to phase volume percentage and the grain volume. The volume fraction section
contains the number of phases in the mixture material, the number of finite elements in the
FE model and the phase volume fraction of each element.
5.2.4 Inter-object data
The finite element simulation of metal cutting involves the interaction between the cutting tool
mesh and the work piece mesh and this interaction is defined in the inter-object data section
in DEFORM 3D. The inter object interaction in the case of chip formation simulation involves
the interaction between a rigid body and a deformable body and the interaction between two
deformable bodies (Table 5.5).
Table 5-5: Friction modelling and heat transfer modelling for chip, work piece and cutting
tool
No Master Slave Seperation
Friction
coefficient
µ
Interface heat trans-
fer
N/sec/mm/C
1 Cutting tool Work piece Separable Coulomb –
0.2 10000
2 Work piece
(chip
Work piece
(bulk material) separable
Coulomb –
0.2 10000
The modelling of the inter-object data is important and its influence on the cutting force mod-
elling during chip formation process is significant [ÖZEL05]. The inter object data definition in
DEFORM 3D is provided in the format of master-slave relationship. In a master slave rela-
tionship, the master object will be able to penetrate the slave object and not vice versa. Since
the penetration of the cutting tool into the work piece is a realistic option, the cutting tool is
defined as master and the work piece as slave. This leads to the deformation of the work
piece without the cutting tool being cut leading to a realistic simulation of chip formation. The
second factor is the interaction between the bulk work piece surface and the work piece
surface converted into chip. This leads to the formed chip not interfering with the bulk work
piece surface as the chip curls with the tool movement. This is carried out by the work piece
being termed as both master and slave which does not allow the penetration of the work
piece into itself. In the case of chip formation simulation, this penetration turns out to be the
chip not cutting into the work piece.
The inter object data definition is defined by two parameters in this work, the deformation
parameter and the thermal parameter. The deformation parameter is concerned with the
forces related to the interaction between the objects. This parameter is defined by separation
parameter and friction parameter. In the case of the cutting tool - work piece interaction, the
two objects are provided as separable as the cutting tool movement by its very nature leads

5 Validation of 3D multiphase FE model using micro drilling process simulation 63
to a relative motion between the cutting tool mesh and the work piece mesh. The friction
parameter assigned in this work is Coulomb among the choices of Coulomb, Shear and
Hybrid friction factors. The Coulomb friction factor has been employed in a number of chip
formation simulation studies and is known to better predict cutting forces and torque during
cutting process compared to other models. In the case of work piece - work piece interaction,
the chip being formed has a relative motion with the work piece and also changes in geome-
try as time progresses. Hence the bulk work piece surface and the formed chip are designat-
ed as separable and the friction factor is provided with a constant Coulomb factor with a
value of 0.2.
The thermal parameter of the inter object data definition in the case of cutting tool – work
piece interaction is concerned with the heat transfer between the nodes of the work piece
surface and the cutting tool. This heat transfer is very important in predicting the heat that is
being conducted away from the main cutting zone from the main cutting edge into the cutting
tool. This indirectly influences the flow stress of the deforming work piece mesh and conse-
quently cutting forces and chip form. The thermal parameter for the work piece – work piece
interaction is also provided with a constant heat transfer parameter with the value of 10000
Nsec-1mm-1C-1.
The final step in the setting up of simulation is the generation of the database file. The data-
base file is a machine readable file. The simulation output parameters are saved to the data-
base file. This file can be opened using DEFORM Preprocessor and Postprocessor.
5.2.5 Drill modelling
The geometric modelling of the cutting tool and work piece are the primary data required for
the FEM simulation. The modelling of the micro drill geometry has been carried out using
Solid works 2010. As part of a previous project, the modelling of the drill geometry is auto-
mated using API Programming.
Figure 5-11: Twist drill geometry used in experiments and simulation
The drill geometry was measured using a Keyence digital microscope. The micro drill geom-
etry details are not available either from literature or from the cutting tool manufacturer with
reasonable accuracy and clarity. Hence the modelling of drill is to be made based on meas-
flute geometry
clearance geometry
chisel edge geometry
main cutting edge

5 Validation of 3D multiphase FE model using micro drilling process simulation 64
urement of the actual drills. The drills used in the micro drilling process falls under the four
planar facet point drill geometry type. The facet point drill geometry developed by Armarego
et al [ARMA90] is widely used for its simplicity in the grinding axis movement during drill
grinding. This results in a stable and reliable process. The drill geometry is measured and
classified into three main divisions (Figure 5-11)
The four planar facet point drill geometry is primarily divided into
1. Chisel edge geometry
2. Flute geometry
3. Clearance geometry
The chisel edge geometry is defined by the chisel edge angle, chisel edge width and the
point angle. The chisel edge angle is defined by two clearance planes present in the face of
the cutting tool. These two clearance planes are defined as the primary clearance plane and
the secondary clearance plane. The chisel edge directly contributes to the axial forces expe-
rienced by the micro twist drill. The chip formation under the chisel edge angle is predomi-
nantly by ploughing due to the larger negative rake angle created by the point angle and
clearance planes.
The flute geometry acts as the rake surface and the rake angle at each point from the center
of the drill is defined by the helix angle.
Figure 5-12: Drill geometry variation with drill diameter in micro drilling range
The flute geometry is defined using a closed curve and the helix curve. The flute geometry in
addition to acting as the rake face also acts as the chip clearance passage. The flute geome-
try is designed using the sweep operation with the curve as the profile and the helix angle
acting as the path. The clearance geometry is provided on the body of the drill. This body
clearance reduces the friction caused by the rubbing of the drill to the finished work piece.
The drill geometry is modified with the reduction in diameter as the strength of the drill has to
be increased with reduction in cutting diameter (Figure 5-12). This can be done by increas-
ing the contact between the drill’s surface and the work piece. This increases the contact and
indirectly guides the drill through the work piece reducing the wandering of the drill The
clearance geometry is absent for all diameters measured below the diameter of 300 micron.
D > 300 micron D < 300 micron

5 Validation of 3D multiphase FE model using micro drilling process simulation 65
The major variation in the drill geometry with scaling down of drill diameters is depicted as
follows.
As the diameter is reduced, the drill’s strength is severely reduced due to the scaling effect.
The grinding of the clearance surface also poses a challenge. The challenge of grinding the
outer surface of the drill body is overcome by providing the clearance surface by providing a
continuous reduction of diameter as in the case of drill diameters less than 300 µm. For drills
above diameter of 300 µm, the drill’s body clearance surface contains a padding surface to
improve the rigidity of the drill. This design provides better stability with reduced friction com-
pared to the continuous body clearance geometry.
5.2.6 Work piece modelling
The modelling of the work piece plays an important role in regard to the quickness with which
the chip formation process during the steady state cutting process can be simulated. The
modelling of the work piece is carried out using Solid works 2010. The work piece geometry
is to be modeled based on the specific tool geometry for the drill diameter that is used for the
simulation (Figure 5-13).
Figure 5-13: Work piece modelling using drill cutting edge geometry basis
The geometrical parameters of the cut surface are obtained from the corresponding drill
geometry. The drill’s main cutting edge and its corresponding chisel edge are obtained from
the drill geometry model. These curves are utilized to obtain the surface generated during the
drilling process. These surfaces which represent the surface generated in the work piece for
one rotation of the drill are then knitted to generate one single surface model. Subsequently,
the drill surface is used to remove material from the solid work piece body. The resulting
solid body is used to represent the work piece in the finite element simulation. The basic
geometry of the micro drill work piece geometry that is used in this work is provided
(Figure 5-14). The work piece diameter is 20 % larger than the drill diameter. This is done to
ensure that the finite element mesh on the work piece surface is stable enough to avoid

5 Validation of 3D multiphase FE model using micro drilling process simulation 66
unrealistic distortion during cutting. The work piece thickness is also made to a constant ratio
of 50 % of drill diameter.
Figure 5-14: Work piece geometry employed in micro drilling process simulation
5.2.7 Remeshing strategy
The remeshing of the elements is a very important aspect for the finite element simulation of
a plastic deformation process. The element deformation during loading leads to highly dis-
torted element shape and results in the simulation to stop prematurely with increase in time
step. To avoid this, in the updated Lagrangian simulation, the plastic object’ mesh is regen-
erated based on predefined remesh initiation criteria. The highly distorted elements are
modified to improve the shape of the element. The remeshing strategy in DEFORM 3D is
completely handled without much of user interference.
The initiation of remeshing can be controlled in a number of ways in DEFORM 3D and is
contained within the remesh criteria. This includes
1. Maximum Stroke increment
2. Maximum time increment
3. Maximum step increment.
4. Interference depth
The interference depth is a parameter that is used to specify when the remeshing is to be
triggered. The interference depth is defined by the penetration of the rigid body’s mesh into
the plastic object’ mesh.

5 Validation of 3D multiphase FE model using micro drilling process simulation 67
Figure 5-15: Influence of remeshing methodology (global remeshing and local remeshing) on
mesh size
The depth can be given in absolute mode or relative mode. In the absolute mode, the inter-
ference depth is given in millimeters and the relative mode specifies the interference depth in
the form of fraction. A fraction value of 0.7 is recommended for the simulation of chip for-
mation process. The absolute method is easier for simulations where the interference is
highly predictable like forming simulation. During the chip formation simulation, due to the
complexity of the cutting tool geometry and the high level of mesh deformation, the absolute
method is not advisable. In this work, the relative mode is utilized for the remeshing of the
work piece mesh. The remeshing in this work is to be reduced to the extent possible so that
the microstructure phase information of the element is not lost. The remeshing algorithms so
far developed are used only for isotropic finite element mesh. The consideration of the mi-
crostructural phase during the remeshing is not available within the DEFORM 3D capability.
To avoid the number of remeshing during the chip formation simulation of microstructure
based FE mesh, the mesh size is reduced on the work piece cut surface to the extent possi-
ble. Two different remeshing methodology are available in DEFORM 3D namely global
remeshing method and local remeshing method (Figure 5-15).
Initial condition
Number of meshes : ~100000
After global meshing
Number of meshes : ~100000
After local meshing
Number of meshes : ~110000
Increase in number of meshes com-
pared to global remeshing

5 Validation of 3D multiphase FE model using micro drilling process simulation 68
The diagram shows the difference between the global remeshing method and the local
remeshing method. In general, the global remeshing, remeshes the complete work piece
geometry. This method leads to highly efficient remeshing of the work piece with the number
of meshes being approximately constant throughout the simulation run. This remeshing
methodology works very well when the work piece mesh is considered homogeneous from a
material point of view. The remeshing process takes into account the mesh weighting pa-
rameters provided in the work piece object definition. The strain, strain rate and temperature
are given higher weightage compared to geometry and mesh density window. This approach
is best suited to simulate the chip formation process as the elements near to the cutting edge
in which deformation reaches high levels of strains at larger strain rates accompanied by
rising temperature due to plastic work. But the global remeshing algorithm does not take into
account the phase of the element during remeshing and hence does not suit the microstruc-
ture based FE mesh. Hence during remeshing, the element’s phase information is lost. This
leads to the resulting mesh to be homogeneous and to erroneous results. The modification of
the mesh weighting factors to higher weightage did not prove successful as the remeshing
halted abruptly due to the inability of the DEFORM automatic mesh generator. Irrespective of
the mesh weighting factor settings, the global remeshing approach on initial trial lost all the
microstructure information within 50 simulation steps and proved futile with respect to micro-
structural phase information retain ability.
The local remeshing methodology suits better for the microstructure based FE mesh. In this
approach, the remeshing is highly restricted to the mesh distorted by the deformation. The
mesh in the rest of the work piece geometry is not altered. This greatly improves the retain-
ing ability of the microstructure phase information in the finite element mesh.
The local remeshing methodology contains two options for the selection of the element to be
remeshed and is termed as size control. The two options for size control are ‘average of
neighbors’ and ‘scaling factor’. The average of neighbors uses the adjacent elements to be
remeshed. This leads to a maximum probability of only 50% for the elements to lose their
phase information instead of 100% as in the case of global remeshing methodology. The
scaling factor option within the local remeshing methodology uses the elements to be
remeshed in the form of scaling of the element size. Upon initial study this methodology does
not provide a stable chip formation simulation in heterogeneous material model. The local
remeshing strategy allows the simulation to be run to steady state without considerable loss
of phase information loss. Although this process does not prove to be the best option for the
remeshing of a multiphase material mesh, it proves sufficient for the chip formation simula-
tion.
In addition to all the above said factors, the finite elements with good shape and good sur-
face are eliminated from remeshing. This is employed to reduce the loss of phase infor-
mation of the individual elements.

5 Validation of 3D multiphase FE model using micro drilling process simulation 69
5.3 Simulation of drilling process
The simulation of the drilling process is carried out for two different diameters of 100 µm,
500µm and 1 mm. The simulation is carried out with the isotropic finite element mesh and
the 3D two phase finite element mesh to validate the use of this multiphase FE model devel-
opment approach in simulating the chip formation process in micro cutting process. The
experiments are carried out for diameters from 0.05 mm to 1 mm and 3mm. The finite ele-
ment simulation of micro drilling process performed using DEFORM 3D is able to simulate
the chip formation process using the microstructure based multiphase FE model developed
as part of this work.
Figure 5-16: Chip form during micro drilling of AISI 1045 microstructure steel using 3D two
phase FE model
The modelling of the work piece using the microstructure based finite element model makes
it possible to study the influence of the microstructure geometry in the chip formation process
in micro drilling. Figure 5-16 clearly shows the plastic deformation of the microstructure
based finite element mesh of the work piece into a chip. The two phases, pearlite and ferrite
is being represented by grey and white color respectively.
5.3.1 Prediction of feed forces & torque
The prediction of cutting forces, torque generated during drilling and the chip form in micro-
drilling compared to isotropic FE mesh are carried out for validating the multiphase FE model
development approach.
Feed force and torque are the output parameters plotted for comparison with the simulation.
The maximum feed force and maximum torque obtained during the drilling process simula-
tion is used for comparison.
Chip
Drill
Workpiece
Microstructure

5 Validation of 3D multiphase FE model using micro drilling process simulation 70
Figure 5-17: Prediction of feed force and torque using 3D two phase FE model, isotropic FE
model in comparison with the experimental results
The prediction of the feed forces by the 3D two phase FE model is better compared to the
isotropic FE model and it proves that as the drilling diameter reduces, need for multiphase
FE model is more pronounced (Figure 5-17). As the drill diameter reduces, the influence of
the phase’s geometry in feed force generation increases. The 3D two phase FE model in-
cludes the geometry of the microstructural phases and therefore its ability to predict the feed
forces increases in micro drilling. In addition, as explained in the previous section, the in-
crease in related feed force and torque in cutting operation is due to the corresponding in-
crease in the chisel edge width to diameter ratio. The 3D two phase FE model is able to
predict this influence better compared to the isotropic FE model.
5.3.2 Prediction of chip form
The chip formation during micro drilling process is highly influenced by the ratio of the cutting
edge radius to the uncut chip thickness. When the uncut chip thickness is less than the cut-
ting edge radius, the plastic deformation of the work piece material happens because of
ploughing of the material instead of shearing of the material. When the uncut chip thickness
is larger than the cutting edge radius, the plastic deformation of the work piece material takes
place by shear deformation. This dependence of chip formation on the cutting edge radius is
simulated using two different cutting edge radiuses for a drill diameter of 100 µm. The cutting
edge radiuses chosen are 0 µm (sharp cutting edge) and 0.2 µm (rounded cutting edge).
Simulations are carried out using these two cutting edge rounding values. The results clearly
shows that with a cutting edge radius of 0.2 µm the chip form is better predicted for a drill
0
4
8
12
16
20
0 1 2 30
2
4
6
8
10
12
Simulation(isotropic FE macro model)
tr
kf
Simulation (isotropic FE model, d = 100 µm)
Experiment
Simulation (mixture FE model, d = 100 µm)
Workpiece material: C45 normalized # Cutting material: HW-20Cutting speed: v
c = 35 m/min # Feed: f = 0.012*d # Cooling: dry
Drill diameter d, mm
Re
late
d f
ee
d f
orc
e k
f ,
(kN
/mm
2)
Re
late
d t
orq
ue
tr ,
(kN
mm
/mm
2)

5 Validation of 3D multiphase FE model using micro drilling process simulation 71
diameter of 100 µm and indirectly the mode of cutting during the micro drilling of normalized
steel AISI 1045 using a 100 µm, ploughing (Figure 5-18).
Figure 5-18: Chip form prediction using isotropic FE model and 3D two phase for a drill
diameter of 100 µm
5.3.3 Prediction of chip morphology
The chip form is an important criterion to validate the capability of a FE model to simulate the
intricacies to form chip during the cutting process. During micro-drilling of AISI 1045 steel
under normalized state, the material undergoes severe plastic deformation before the chip
formation. The harder particles are also pulled out during the chip form.
This is not reflected during the chip form simulation using an isotropic FE model as the mate-
rial model does not differentiate between a harder phase and a softer phase. When the chip
shape is compared to the experimental chips obtained using SEM images, the multiphase FE
model chip formation simulation proves to be beneficial compared to the isotropic FE model
chip formation (Figure 5-19 & Figure 5-20). The micro drilling using 1 mm diameter micro
drill is shown here to predict in addition to the chip form, the presence of micro holes in the
chip.
Simulation
Experiment

5 Validation of 3D multiphase FE model using micro drilling process simulation 72
Figure 5-19: Chip form prediction using isotropic FE model for a drill diameter of 100 µm
When micro drilling AISI 1045 steel, the harder particles (pearlite) are pulled out of the chip
as they do not undergo yielding like the softer matrix (ferrite). This pull out of the harder
particles is clearly depicted by the presence of micro holes in the chip. The presence of these
chips is captured better using the 3D two phase FE model in comparison to the isotropic FE
model. The ability of the 3D two phase FE model to predict the micro holes is due to the
deletion of the very small elements during the course of remesh in FEM simulation.
Figure 5-20: Chip shape during micro drilling in AISI 1045 steel
In DEFORM 3D during the simulation of chip formation process in micro drilling; the remesh-
ing of the work piece is to be restricted to the extent possible for the want of reduction in loss
of microstructural information. In addition, remeshing is also restricted to local area where
required using local remeshing option and avoiding meshes with a good surface area being
avoided from remeshing. The above two steps leads to very fine meshing of the chip surface
as the mesh shape gets distorted with the progression of chip formation.
Isotropic FE model
Multiphase FE model
Rough edges
Rough edges

5 Validation of 3D multiphase FE model using micro drilling process simulation 73
Figure 5-21: Chip form and the presence of micro holed during micro drilling of AISI 1045
steel using 1 mm micro twist drill
DEFORM 3D removes very fine meshes in the work piece and this leads to the prediction of
cracks on the edges of the machined chip and micro holes in the chips internal surfaces
(Figure 5-21). This prediction of holes and rough edges present in the work piece is better
with the multiphase FE model. In the 3D two phase finite element model, the elements which
represent the harder pearlite particle are remeshed more often compared to the elements
which represent the softer ferrite particles. This leads to the harder pearlite particle finite
elements to become fine earlier compared to the soft ferrite particle finite elements. This
corresponding leads to the deletion of the elements in the chip and the prediction of holes
during micro drilling of AISI 1045 microstructure steel.
Chip form
Holes

6 Future Directions 74
6 Future Directions
The developed multiphase Finite element model is the first attempt in this direction with the
DEFORM simulation package. The developed model can be improved further to an extent as
outlined here.
The finite element software package DEFORM 3D recognizes the different phases in a mate-
rial, but does not take into consideration the grain size and grain geometry as a whole. This
has been overcome in this work by the developed algorithm and program. In addition, the
DEFORM 3D remeshing module can be improved to recognize the grain shape and geome-
try during remeshing. This will highly retain the phase information during the course of
remeshing and hence improve the efficiency of the simulation of micro cutting processes in
general using multiphase finite element mesh.
Figure 6-1: New local remeshing methodology for multiphase FE model
During the course of the simulation, it has been observed that local remeshing leads to
enormous increase in the number of meshes and this leads to abrupt termination of the
simulation. This can be improved if the remeshing methodology takes into account grain
shape and reverts back the refined mesh under the cutting edge to coarse mesh. This will
reduce the overall increase in mesh size over the course of simulation and in turn increase
the computational efficiency of multiphase finite element modelling of 3D micro cutting pro-
cess.
Area selected to remesh
Present local remeshing methodology
Proposed local remeshing methodology
7 Conclusion 75
7 Conclusion
This work primarily is concerned with the development of a multiphase finite element model
to analyze the micro cutting process in ferritic pearlitic steel. The micro cutting process war-
rants the phases present in the work piece microstructure to be included in the finite element
model to understand the mechanics of material removal. The study of micro cutting process
with isotropic finite element model does not predict the process output parameters with the
required accuracy due to a lot of specific aspects of cutting at the micro scale termed in
general as size effects in micro cutting. The micro cutting process has so far been studied
through finite element model in two dimensions. The two dimensional multiphase finite ele-
ment models are used for the study of chip formation in orthogonal metal cutting. For the
study of industrially relevant metal cutting processes like drilling, a reliable 3D multiphase
finite element model is developed.
The details of microstructural phases present in the work piece that are needed for the 3D
multiphase FE model development include phase volume percentage, grain size and grain
shape of each constituent. These details are obtained through standard metallographic ex-
aminations of the work piece specimens. To incorporate the obtained work piece microstruc-
ture information into a 3D FE mesh, an algorithm is developed which distributes points in
correspondence to the number of grains of a microstructure phase present in the given geo-
metrical volume separately. Once the points are distributed, these points represent geomet-
rical location of grains in a microstructure. These points are then compared in geometrical
coordinates with the finite element nodes. The node present closest to a point is selected to
represent a microstructural phase and is called seed node. To incorporate the grain volume
information in the finite element model, the first element corresponding to the seed node is
selected. The seed node’s volume is calculated and compared to the grain volume. When
the element’s volume is less than the grain volume, additional adjacent nodes and corre-
sponding elements are selected to reach the grain volume. This procedure is carried out for
all the seed points in the geometrical volume.
With the multiphase finite element mesh generated using the above mentioned methodology,
the material modelling of the work piece also has to consider the different phases present in
the material microstructure. Hence the material behavior modelling for the multiphase finite
element model is carried out using the mixture material model present in DEFORM 3D. The
ferritic pearlitic steel is modeled as a mixture material with ferrite and pearlite as its constitu-
ents. The ferrite phase is modeled using C05 microstructure’s flow curve model and the
pearlite phase is modeled using C75 microstructure.
This new multiphase finite element model development methodology is validated through
finite element simulation of AISI 1045 steel microstructure under tensile loading, compres-
sion loading, shear loading and finally micro twist drilling process. The geometry for the
tensile loading are modeled using Solidworks 2010 and imported into the finite element
package. The compression and shear geometries are modeled within the finite element
package itself. From the simulation results under tensile, compression and shear loading, the
developed finite element model’s efficacy is proved for simple loading conditions.

7 Conclusion 76
Finally, micro drilling is employed to validate the developed multiphase finite element model’s
ability to simulate the influence of microstructure during large scale plastic deformation prob-
lems at the micro scale. The micro drilling process experiments are carried out for a variety
of diameters ranging from 50 micron to 1 mm in AISI 1045 steel. The feed forces, torque and
the chip form are selected as the process output parameters that are to be compared with
the finite element simulation results.
For the finite element simulation of the micro drilling process, the micro twist drill geometry is
studied using Keyence digital microscope and geometrical parameters like chisel edge angle,
chisel edge width, cutting diameter, main cutting edge length, main cutting edge angle,
clearance geometry along the axis, primary clearance angle and secondary clearance angle
on the face of the cutting edge is measured. With the measured geometrical details the micro
twist drill geometry is modeled using Solidworks 2010 and imported into DEFORM 3D.
The micro drilling simulation is carried out for drill diameters 100 µm, 500 µm and 1000 µm.
The finite element simulations are carried out with isotropic finite element models and multi-
phase finite element models. The process output parameters, feed force, torque and chip
forms are compared. As the cutting diameter is reduced from 1000 µm to 50 µm, the related
feed force calculated from the experimental results is shown to increase which is explained
with the increase in chisel edge width increase as the cutting diameter is reduced. The chip
formation simulation results are validated by the micro drilling experiments conducted on
AISI 1045 microstructure steel using the same parameters as employed in FE simulations.
From the simulation results, it is proved that the multiphase FE model is able to predict better
the feed forces and torque better compared to the isotropic FE model. This shows the influ-
ence of the microstructure in chip formation mechanics in addition to the macro geometry
variations like chisel edge width increase. The chip form is also better predicted using the
multiphase FE model when compared to the isotropic FE model. In micro drilling, the influ-
ence of the micro drill’s cutting edge radius parameter is also studied using FE simulation.
When the micro drilling process is simulated using a sharp cutting edge micro drill, a smooth
chip edge is simulated whereas the experimental investigation shows the chip to have a
rough edge. This is better simulated using a micro twist drill with a cutting edge radius of 0.2
µm. Thus the size effect due to the ratio of uncut chip thickness to the cutting edge radius
parameter is explained. The multiphase FE model is also able to predict the holes present in
the chips generated during micro drilling whereas the isotropic FE model predicts a smooth
chip without the presence of the micro holes. When the uncut chip thickness, is in the same
range of the microstructure phase size, the chip generated during the cutting process is
shown to have micro holes which correspond to the harder phase present in the work piece
microstructure.
The chip formation in micro drilling process is therefore better simulated using a multiphase
FE model compared to an isotropic FE model. Using this simulation, the new multiphase
material FE model development methodology’s ability to study large scale plastic defor-
mation at the micro scale is proved.
V Index of literature 77
V Index of literature
[ALLA08] Allain, S.; Bouaziz, O.: Microstructure based modeling for the mechanical
behavior of ferrite-pearlite steels suitable to capture isotropic and kinematic
hardening, Materials Science and Engineering A, 496, pg. 329-336
[ARMA90] Armarego, E.J.A.; Smith, A.J.R.; Gong, Z.J.: Four planar Facet point Drills -
Basic Design and cutting model predictions, CIRP Annals- Manufacturing
Technology, Vol. 39/1, 1990, pg. 41-45
[BADD02] Baddeley, A.; Jensen, E.B.V.: Stereology-sampling in three dimensions. Re-
search report no. 22, Laboratory for Computational Stochastics, Department of
Mathematical Sciences, University of Aarhus, Denmark.
[BORO05] Borouchaki, H.; Laug, P; Cherouat, A.; Saanouni, K.: Adaptive remeshing in
large plastic strain with damage, International Journal for numerical methods
in Engineering, 63, 2005, pg. 1-36
[BRIN02] Brinksmeier, E; Oltmann, R.; Stern, R.; Machining of Precision Parts and
Microstructures, Initiatives of precision engineering at the beginning of a mil-
lennium, Part 1, 2002, pg.3-11
[CHUZ03] Chuzhoy, L.; DeVor, R.E.: Machining Simulation of Ductile Iron and Its Con-
stituents, Part 2: Numerical Simulation and Experimental Validation of machin-
ing. Journal of Manufacturing Science and Engineering, Transactions of the
ASME, 125/2, 2003, pg.192-201
[DECH03] De Chiffre, L.; Kunzmann, H.; Peggs, G.N.; Lucca, D.A.: Surfaces in Precision
Engineering, Microengineering and Nanotechnology. Annals of the CIRP,
52/2, 2003, pg.561-577
[DENK06] Denkena, B.; Altan, T.; Jivishov, V.; Al-Zkeri, I.: Influence of Material models
Used in Finite Element Modeling on Predicted Scaling Effects in Machining.
Annals of the German Academic Society for Production Engineering (WGP),
Production Engineering, XIII/1, 2006, pg.103-108
[DENK12] Denkena, B.; Köhler, J.; Mengesha, M.S.: Influence of the cutting edge round-
ing on the chip formation process: Part1. Investigation of material flow, pro-
cess forces and cutting temperature. Pro. Eng. Res. Devel., German Academ-
ic Society for Production Engineering, 2012
[DORN06] Dornfeld, D.A.; Min, S., Takeuchi, Y.; Recent advances in mechanical mi-
cromachining, Annals of the CIRP, 52/2, 2006, pg.745-768

V Index of literature 78
[FILI08] Filice, L.; Micari, F.; Rizzuti, S.; Umbrello, D.: Dependence of machining simu-
lation effectivensss on material and friction modeling, Machining science and
technology: An international Journal,Vol. 12, 2008, pg. 370-389
[FRIT09] Fritzen, F.; Bühlke, T.; Schnack, E.: Periodic three-dimensional mesh genera-
tion for crystalline aggregates based on Voronoi tessellations, Computational
mechanics, Vol. 43/5, 2009, pg. 701-713
[GHOS04] Ghosh, S.; Moorthy, S.: Three dimensional Voronoi cell Finite element model
for microstructures with ellipsoidal heterogeneities. Computational Mechanics,
34, 2004, pg.510-531
[IMRA08] Imran, M.; Mativenga, P.T.; Kannan, S.; Novovic, D.: An experimental investi-
gation of deep-hole micro drilling capability for a nickel-based super alloy.
Proceeding of the institution of mechanical engineers, Part B: journal of Engi-
neering Manufacture, Vol. 222, 2008, pg. 1589-1596
[JOHN83] Johnson, G.R.; Cook, W.H.: A constitutive model and data for materials sub-
jected to large strains, high strain rates and high temperatures. Proc. 7th Int.
Symp. On Ballistics, The Hague, Netherlands, 1983, pg.541-547
[KLOC07] Klocke, F.; Gerschweiler, K.; Abouridouane, M.: Size Effects of the Tool Edge
Radius on Specific Cutting Energy and Chip Formation in Drilling. Proceedings
of the 2nd International Conference on New Forming Technology, 2007,
pg.499-509
[KLOC11] Klocke, F.; Adams, O.; Garzon, M.; Veselovac, D.; Kircheim, A.; Thiel, R.;
Blattner, M.: High Frequency Force Measurement of Micro Milling Operations
in Hardened Steel, Ninth International Conference on Advanced Manufactur-
ing Systems and Technology (AMST'11), Mali Losinj, Croatia, publisher Acad-
emy of Sciences and Arts, ISBN 978-953-6326-64-8, 2011, pg. 611-622
[KLOC06] Klocke, F.; Lung, D.; Gerschwiler, K.; Risse, K.; Abouridouane, M.: Modelling
and Scaling Effects in Drilling, the 9th CIRP International Workshop on Model-
ling of Machining Operations, Bled Slovinien, 2006, pg. 263-269
[KOPA84] Kopalinsky, E.M.; Oxley, P.L.B.: Size effects in Metal Removal Processes.
Institute of Physics Conference Series, 70, 1984, pg.389-396
[KOTS03] Kotschenreuther, J.; Delonnoy, L.; Hoichrainer, T.; Schmidt, J.; Fleischer, J.;
Schulze, V.; Löhe, D.; gumbsch, P.: Modelling, simulation and experimental
tests for process scaling of cutting processes with geometrically defined edge,
1st Colloquium Processscaling, Bremen, 2003, pg. 1-16

V Index of literature 79
[LASC10] Laschet, G.; Quade, H.; Henke, T.; Dickert, H.-H.; Bambach, M: Comparison
of elasto-plastic multi-scale analyses of the u-forming process of a steel line-
pipe tube, IV European Conference on Computational Mechanics, Paris,
France, 2010, pg. 1-2
[LIU04] Liu, X.; DeVor, R.E., Kapoor, S.G.: The mechanics of machining at the micro
scale : Assessment of the current state of the science, ASMEJ. Manuf. Sci.
Eng., 126, 2004, pg.666-678
[LORO06] Lorong, Ph.; Yvonnet, J.; Coffignal, G.; Cohen, S.: Contribution of computa-
tional mechanics in numerical simulation of machining and blanking: State of
the art, Archives of Computational methods in engineering, state of th art re-
views, Vol. 13/1, 2006, pg. 45-90
[LUTT98] Lutervelt, C.A.; Childs, T.H.C.; Jawahir, I.S.; Klocke, F.; Venuvinod, P.K.:
Present situation and future trends in modelling of machining operations Pro-
gress report of the CIRP Working group ‘Modelling of Machining operations’.
Annals of the CIRP, Vol. 47/2, 1998, pg. 587-626
[MOHA11] Mohammed, W.M.; Ng, E.; Elbestawi, M.A.: Modeling the effect of the micro-
structure of compacted graphite iron on chip formation. International Journal of
Machine tools & Manufacture, 51, 2011, pg. 753-765
[MOVA00] Movaheddy, M.; Gadala, M.S.; Altintas, Y.: Simulation of the orthogonal metal
cutting process using an arbitrary Lagrangian-Eulerian finite element method.
Journal of Materials processing technology, 103, 2000, pg. 267-275
[ÖZEL05] Özel, T.: The influence of friction models on finite element simulations of ma-
chining, International Journal of machine tools & manufacture, 46, 2006, pg.
518-530
[ÖZEL07] Özel, T.; Karpat, Y.: Identification of constitutive material model parameters for
high strain rate metal cutting conditions using evolutionary computational algo-
rithms. Materials and Manufacturing processes, 22, 2007, pg. 659-667
[PARK04] Park, S.; Kapoor, S.G.: Mechanistic Cutting Process Calibration via Micro-
structure Level Finite Element Simulation Model. Journal of Manufacturing
Science and Engineering, Transactions of the ASME, 126/4, 2004, pg.706-709
[PROM10] Rapeepan, P.; Mouanyri, H.E.; Yang, X.: Molecular dynamics simulation of
nanometric cutting. Machining Science and Technology: An international
Journal, 14, 2010, pg. 423-439

V Index of literature 80
[RAMA12] Ramazani, A.; Mukherjee, K.; Prahl, U.; Bleck, W.: Modelling the effect of
microstructural banding on the flow curve behavior of dual-phase (DP) steels,
Computational Materials Science, 52, 2012, pg. 46-54
[ROBI05] Robinson, G.M.; Jackson, M.J.: A review of micro and Nano machining from a
materials perspective. Journal of Materials processing technology, 167, 2005,
pg. 316-337
[SART03] Sartkulvanich, P.; Koppka, F.; Altan, T.: Determination of flow stress for metal
cutting simulation-a progress report, Journal of Materials Processing Technol-
ogy, Vol. 146/1, 2004, pg. 61-71
[SHIH95] Shih, A.J.: Finite Element Simulation of Orthogonal Metal Cutting, Journal of
Engineering for Industry. Transactions of the ASME, Vol. 117, 1995, pg. 84-93
[SIMO06] Simoneau, A.; Ng, E.; Elbestawi, M.A.: The effect of microstructure on chip
formation and surface defects in microscale, mesoscale, and macroscale cut-
ting of steel, Annals of the CIRP, Vol. 55/1, 2006
[SIMO07] Simoneau, A.; Ng, E.; Elbestawi, M.A.: Grain size and Orientation Effects
when Microcutting AISI 1045 Steel. Annals of the CIRP, 56/1, 2007, pg.57-60
[SUH01] Suh, D.W.; Bae, J.H.; Cho, J.Y.; Oh, K.H.; Lee, H.C.: FEM Modeling of Flow
Curves for Ferrite/Pearlite Two-Phase Steels. ISIJ International, 41/7, 2001,
pg.782-787
[VOLL03] Vollersten, F.: Size effects in manufacturing. 1st Colloqium Processscaling,
Bremen, 2003, pg. 1-10
[WEDB10] Wedberg, D.: Dislocation density based material model applied in FE-
simulation of Metal Cutting. Licentiate Thesis, Luleä University of Technology,
2010, ISSN: 1402-1757
[WEJR08] Wejrzanowski, T.; SPYCHALSKI, W.L.; Rozniatowski, K.; Kurzydlowski, K.J.:
Image based analysis of complex microstructures of engineering materials, In-
ternational Journal of Applied Mathematical Computer Science, Vol. 18/1,
2008, pg. 33-39
[WEUL04] Weule, H. et al: International state of the art of micro production technology,
Production Engineering, XI/1, 2004, pg.29-36
[WOJN04] Wojnar, L.: Image Analysis. Applications in Materials Engineering, Boca Ra-
ton, CRC Press, 1999
[WILLI08] William D.; Rethwisch, G.: Fundamentals of Materials Science and Engineer-
ing, John Wiley & Sons (third edition), ISBN 978-0-470-12537-3, 2008

V Index of literature 81
[ZERI04] Zerilli, F. J.: Dislocations Mechanics-Based Constitutive Equations, Metallurgi-
cal and Materials Transactions A. Vol. 35 A, pg. 2547-2555