master thesis · redactado. a noe, cesc, dioni, laia, sara, silvia (aunque no hicieses este máster...
TRANSCRIPT

Master in Industrial Chemistry and Introduction to Chemical Research
Master Thesis
Marta Ayala Roque
Directors:
Dr. Albert Gargallo
Dr. Jordi Sardans
Prof. Josep Peñuelas
Tutor:
Dr. Félix Busqué
Chemistry Department
Faculty of Science
2016


The presented Master Thesis was performed at CREAF in the Universitat Autònoma
de Barcelona to pass the module Master Thesis from Master in Industrial Chemistry
and Introduction to Chemical: Specialization in Advanced Chemical Research.
I would especially like to thank Bjarni D. Sigurdsson, Niki Leblans, Steven Dauwe and
all the members of the FORHOT project for letting me collaborate and because without
them this master thesis could not have been done.
Marta Ayala Roque
Approval
Dr. Albert Gargallo Dr. Jordi Sardans Prof. Josep Peñuelas
Bellaterra, 29stJuly 2016


Acknowledgments
Y tras arduos meses de trabajo y estrés llega el momento de acordarse de aquellas
personas que han estado ahí soportándome, que ya es decir.
En primer lugar quiero agradecer a mis directores de máster, por darme la oportunidad
de crecer y conocer un poquito más el ámbito de la ciencia y por transmitirme su pasión
por la investigación.
A Josep Peñuelas, por dejarme hacer el máster en un grupo tan importante y por sacar
siempre tiempo de donde no hay para ayudarme en lo necesario.
A Jordi Sardans, por ayudarme siempre con los problemas que me han ido surgiendo y
ayudarme a encarrilar de la mejor manera el máster con su buen humor.
A Albert, o como prefiero llamarlo yo “jefecito”. Sé que tener una súbdita como yo te ha
gustado, pero no te acostumbres! A ti… gracias por sacarme de quicio cuando no
entendía las cosas y sugerir que quizá el problema lo tenía yo. Ahora en serio, tú sabes
que tengo mucho que agradecerte, porque has estado siempre al pie del cañón cuando
te he necesitado, académica y no académicamente, por todas las risas que nos hemos
echado que no son pocas, por las cervecitas y por hacerme ver la vida desde un punto
de vista menos “postureta”.
Como no podía ser de otra manera, a mis todos mis compañeros del CREAF, por
hacerme sentir una más desde el primer momento que llegué y hacer mucho más
llevadero todos los momentos de éste máster, ha sido un placer conoceros!
A Boireta, mi fiel compañera de despacho que a veces me roba el sitio y que siempre
está dispuesta a reclamar algún mimo!
En especial al conjunto de despachos que anida alrededor de la fuente. A Sara, mi compi
de despacho, gracias por las charlas y risas y por hacer piña para meternos con Albert.
A Helena por las risas, gyms, cenas y sobretodo mostrarme que una “dama” tiene
también su lado perreque aunque no quieras salir de fiesta conmigo a ese sitio tan
glamuroso que ya sabes... A Víctor por ser ese compañero que siempre ayuda y al que
le debo una cerveza aún del pádel…sin olvidar de darte las gracias por la masterclass
de R!!

A Xavi, por todas las charlas y sobre todo por ese conocimiento del vocabulario callejero
que te he transmitido, de nada! Vale guay.
A Aitziber por los spinnings que nos hemos pegado y por ser la alegría de la huerta!
A Irene i Rosa por los buenos momentos y risas que hemos pasado!!
También me gustaría agradecer este máster a los compañeros de resonancia: a Teo,
Miriam, Eva, Pau, Andre, Miquel por hacerme sentir una más y por prestarse a ayudarme
cuando lo he necesitado.
No podían faltar mis agradecimientos a los químicos!! Gracias a vosotros por los viernes
de cervecita y las numerosas barbacoas que ayudaban a combatir las duras semanas.
A Silvia, Laia, Gisela, Adri, Rodri, Alba, Rubén. A mi “grupo” de café, penas y sobretodo
alegrías Sergio y Kevin. A ti Sergio (piedra), tú ya me entenderás! Gracias por animarme
los días chof!! y a ti Kevin por estar siempre atento conmigo y por ser mi confidente
(aunque me molestes mientras estoy escribiendo los agradecimientos!!). Para cuando
otro pádel?
No podía faltar el agradecimiento a mis compis de batalla del máster los que han vivido
conmigo la tortura del máster teórico y también están en estos momentos con el
redactado. A Noe, Cesc, Dioni, Laia, Sara, Silvia (aunque no hicieses este máster
también lo has sufrido!).
Me gustaría agradecer a Adriana i a mi “cuqui”, mis dos grandes amigas, por ser eso,
amigas cuando lo he necesitado y haber escuchado mil veces la misma historia por muy
aburrida que fuese. Sabéis que os quiero mucho.
A mi compi Sera, como ves al final he sobrevivido y cualquier día sin darte cuenta te
estoy mandando a que me traigas un café! Gracias por los ánimos y las charlas sobre
la vida.
Para finalizar, pero no por ello menos importante, agradecer a mi familia el apoyo
durante el máster, por hacerme sentir que valía aunque os diese algún que otro dolor
de cabeza. En especial a ti, madre, por preocuparte cada día de mí y hacerme la vida
sumamente más bonita.

viii
Index
List of acronyms ............................................................................................................. i
Abstract ........................................................................................................................ iii
1 Introduction ............................................................................................................ 1
2 Objectives .............................................................................................................. 7
3 Results .................................................................................................................. 8
3.1 Effects of site and warming on the metabolome of Agrostis capillaris L. ....... 10
3.2 Effects of site and warming on the metabolome of Ranunculus acris L. ........ 12
4 Discussion ........................................................................................................... 16
5 Conclusions ......................................................................................................... 21
6 Material and Methods .......................................................................................... 23
6.1 Description of the study area ........................................................................ 23
6.1.1 Situation ................................................................................................ 23
6.1.2 Study sites ............................................................................................. 23
6.1.3 Experimental design .............................................................................. 24
6.2 Collection and preparation of tissue samples ................................................ 25
6.3 Extraction of metabolites for liquid chromatography–mass spectrometry (LC-
MS) analysis............................................................................................................ 25
6.4 LC-MS analysis ............................................................................................ 26
6.5 Processing of LC-MS .................................................................................... 26
6.6 Statistical analyses ....................................................................................... 27
7 Bibliography ......................................................................................................... 28
Supporting information ................................................................................................ 31


i
List of acronyms
LC-MS Liquid Chromatography–Mass Spectrometry
GC-MS Gas Chromatography–Mass Spectrometry
HPLC High Performance Liquid Chromatography
FTMS Fourier Transform Mass Spectrometry
S/N Signal-to-Noise ratio
m/z Mass-to-Charge ratio
ESI ElectroSpray Ionization
HESI Heated ElectroSpray Ionization
RT Retention Time
PCA Principal Components Analysis
PC Principal Component
PLS-DA Partial Least Squares Discriminant Analysis
ANOVA ANalysis Of VAriance
PERMANOVAs PERmutational ANOVAs
RNA RiboNucleic Acid
DNA DeoxyriboNucleic Acid
MEOH Methanol
ROS Reactive Oxygen Species


iii
Abstract
Under the projected climate change scenario, plants will be subjected to a combination
of abiotic stresses such as warming and drought. The temperature seems that will rise
in higher proportion at high than at temperate and tropical latitudes.
The natural geothermal conditions in southern Iceland provide an opportunity to
study the impact of warming on plants because of hot springs and fumaroles that induce
stable temperature gradients at soil level. In one of the studied valleys, hot springs have
been present for centuries while in another valley hot springs started in 2008 after
suffering a shallow crustal earthquake.
We aim to study the impact of soil warming on the metabolomic profile of two
typical species of Arctic latitudes Agrostis capillaris L. and Ranunculus acris L. and
discern whether their shifts in metabolome became stronger in the long-time warming
grassland than in the short-time warming grassland.
Agrostis capillaris L. and Ranunculus acris L. showed a different response to
warming depending on the evolutionary time they were exposed. While the grass species
presented a shift in metabolome on the long-time warming site, the herb species did not
show a clear shift. The different responses of both species could be related to their
different reproductive strategies; the grass species reproduces mainly by vegetative
spread whereas the herb reproduces mainly by seedlings. This enable the grass species
a faster adaptation capacity at plot level.
The temperature threshold where we observed an abrupt shift in overall
metabolome profile of Agrostis capillaris L. and Ranunculus acris L. species was located
between 5-10 ºC above the control temperature. Current climate models projected by
the scenario of 2100 increases of annual average temperature between 3-5 ºC for the
Arctic region depending on the areas. The results thus suggest that some current
dominant plants in the boreal would not trigger the metabolism pathways related to
warming stress.
In the long-time grassland the main compounds that we detected to be up-regulated
at highest temperatures were sugars and amino acids both related to heat shock
metabolic pathways and some secondary metabolites such as phenols and terpenes
also associated with a wide array of stresses.


1
1 Introduction
The effect of human activities on environment has exponentially increased since pre-
industrial era leading to higher atmospheric concentrations of carbon dioxide, methane
and nitrous oxide. These atmospheric gases seem to have been the dominant cause of
the observed warming since the mid-20th century (IPCC, 2013). The impact of climate
change is difficult to predict because it depends on many direct and indirect effects2–4.
Overall, the increase of global mean surface temperature at the end of the century (2081-
2100) is likely to increase between 2.6 ºC to 4.8 ºC5. The effect of the temperature is
intrinsic to all species since it alters their life cycle and each species has a range of living
temperatures depending on its distribution. Often the exposure to higher temperatures
implies generally a faster development but does not mean a higher production because
climate change also will imply a shorter life cycle and reproductive phase reducing the
yield potential6. The capacity of organisms to increase their activity by warming could be
limited by several variables such as water and nutrients availability7–9. These alterations
of climatic conditions usually affect living organisms shifting their seasonal activities and
migration patterns10,11.
Temperature rises across the globe and especially in the High North is melting
snow and ice further altering the capacity of the hydrological system at regional but also
at planetary scale. The Arctic region is one of the most studied areas in the context of
climate change impacts because of it is crucial importance related to the climate change
of all the planet. Over the next 100 years, climate change is expected to accelerate and
to be also accompanied by several other processes such as impacts on river runoff, on
atmospheric circulation and modulation of atmospheric CO2 and CH4 concentrations at
world scale12. Boreal areas are receiving an extra energy input in its surface compared
with other world areas, as example in the tropic areas where a greater fraction of the
new warming energy is consumed into evaporation. However, in Arctic and Antarctic
regions the melting of snow and ice reduces the albedo effect causing increase of heat
absorption by ocean surface and land. As warming reduces the extent of sea ice, solar
heat absorbed by the oceans in the summer is more easily transferred to the atmosphere
during winter, and because of this absorbed energy is transported by the atmosphere
and oceans affecting other regions. Under this scenario, the temperatures are projected
to rise the Arctic between 3-5ºC over the land and above 7ºC in the oceans13.

2
Figure 1. Maps of CMIP5 multi-model mean results for the scenarios RCP2.6 (left) and RCP8.5 (right) of change
in average surface temperature (1986-2005 to 2081-2100). Source: IPCC 2013.
By this high capacity to absorb light energy in arctic, warming advances more
rapidly than in the other parts of the world. In the Arctic, growing season is short and cool
and thus imposing major constraints on the biota because the growing season is so
compressed14. Therefore, faster changes as for instance the lengthening of the summer
period can have a great impact on the artic ecosystems.
Plants are closely tuned to the abiotic and biotic factors and they have evolved
biochemical, molecular and genetic mechanisms to avoid stress15,16. When there is an
alteration of the normal climatic conditions, plants suffer stress and respond to avoid
injury. Plants exposed in any stress conditions are able to perceive the first stress signals
and trigger stress responses mechanisms. Moreover, there is an overlap among the
different stress responses explains the cross-tolerance phenomenon. Several studies
provide evidence that physiology of the plants are directly controlled by abiotic conditions
such as: salinity17–20, water availability21, nutrients availability22–24 temperature20. Those
abiotic factors must be in a balanced ratio to reach the optimum abiotic conditions for
live developing. There are many investigations providing information about the
mechanisms underlying the stress response and the identification of the specific genes
and metabolites that are responsible for tolerance in determined phenotypes to different
abiotic stresses. One of the most important and studied stress is that due to temperature
change.
Plants are subjected to continuous diurnal and seasonal temperature fluctuations
and some species are adapted to extreme climates, they have acquired thermotolerance,
where plants have increased the freezing or heat tolerance25. These high complex
mechanisms of defense are reached by reprogramming the transcriptome, proteome and
finally the metabolome of plants. Predictions of climate change suppose that plants will
respond to different abiotic stress factors such as warming, drought, cold, salinity and/or

3
anthropogenic activities with the final consequence of the alteration of their metabolome
as the end of the cascade of responses to adapt to new temperature situation. These
changes are associated with metabolic pathways up- and down-regulation to increase
resistance to stress, and are thus the consequence of the final molecular responses
associated with physiological and morphological shifts such as growth, production,
photosynthesis-respiration, reproductive output, defense responses and finally to the
proportional allocation of resources to all these different functions and also to different
plant organs.
The heat stress induces metabolic changes that frequently are associated with
heat shock protein accumulations, that are responsible of this stress resistance in heat-
exposed conditions26,27. Extreme high temperatures during the reproductive stage affect
fertilization, pollen viability and even fruit formation28,29. The fast climate change and
extreme climatic events are expected to have a large impact on plants and ecosystems,
to the point of surpassing the thresholds of resistance of ecosystems30–36. Improving
tolerance to these fast climate change and extreme events will be a target for ongoing
and future agricultural and nature-conservation programmes. Species of fundamental
importance in nature conservation in current boreal areas, such as the grass Agrostis
capillaris L. and one herbaceous dicot Ranunculus acris L., can be affected by these
extreme events. These species are thus interesting subjects for studying the impacts of
extreme periods of warming on the metabolomic shifts in plants and soil.
The impact of climate change on grasslands on high latitudes is higher than in
grasslands of mid- and low-latitudes due to a rapid increased of climate change in these
cold-climate regions. This makes the boreal ecosystems especially helpful to understand
the sensitivity of plant communities in terms of community change. Northern ecosystems
are characterized by stress-tolerant species, adapted to nutrient-poor conditions and
having low leaf phosphorus and mainly nitrogen concentrations37,38. Several records
provides the evidence of relatively fast vegetation changes in response to past climate
change in Iceland. During the last years a metaanalysis of phenological, growth and
reproductive responses of individual plants on moderate warming sites shows that
species respond in different ways and to different degrees depending on growth form
and initial environmental conditions39,40.
Previous studies showed that warming may cause a shift in abundance of species
due to a change on nitrogen availability and decomposition of soil organic carbon41. On
the other hand, nitrogen is an important nutrient present in proteins and in essential
enzymes and the limitation of this element could have crucial effects on plant

4
productivity. Higher temperature also means higher decomposition rate, increasing the
carbon released to the atmosphere and thus a positive feedback on global warming.
Some experiments on tundra vegetation evidence an increase in nitrogen availability and
nutrient accumulation in response to warming, suggesting that could be an important
indirect effect of warming42. An increase on nitrogen availability can favour more
competitive species against more stress-tolerant.
Metabolomics is a powerful tool for improving our understanding of the changes
in metabolism and biochemical composition of organisms, i.e. the ultimate phenotypic
response to environmental changes43–47. It is increasingly applied to ecological studies
in what has been called ecometabolomics45,46,48. Ecometabolomics can explore the
effects of the ecological organism-environment interaction by detecting the final
phenotypic response of the organism and by detecting the metabolic pathways that are
up- and down-regulated in response to environmental changes. Within the context of
metabolomics, a metabolite is defined as an organic molecule, weighting less than 1kDa.
Metabolites are the final products of the activity of different cellular processes and,
hence, define the phenotype in the sense of the final response of the genotype to
environmental changes. Metabolites can be divided in primary metabolites that are
synthesized by the cell because of their indispensability for their growth, development
and reproduction, such as organic acids or nucleotides, and secondary metabolites,
which are those that are produced by an organism not for primary metabolic processes
but are important for ecological functions such as terpenes or phenols. The principal goal
of studying metabolomics is to monitor metabolic changes during stress responses, to
identify metabolites belonging to the groups that are responsible for stress tolerance and
the shift in metabolic pathways and functions of the plants in response to warming stress.
The concept of top-down omics approaches allows to begin at the highest
conceptual level and work down to the details. In this way, metabolomics provides a
better analysis of the different response capacities conferred by the phenotypic plasticity
of each species, allowing for elucidation of metabolic pathways that might be involved in
a specific phenotypic response. Metabolomics can be also used as a preliminary
screening study of the metabolome response. This does not exclude the simultaneous
or subsequent use of targeted chemical analyses.
Previous metabolomic studies of warming stress on plants have observed
increases in the concentrations of saturated fatty acids49,50 in the thylakoid51 and plasma
membranas52. Metabolomic studies have allowed to observe that under combined
drought and warming conditions plants respond differently at shoot than at root levels53.

5
Under high temperature stress, the level of saturation of membrane lipids extracted from
the leaves of creeping bent grass increased, whereas no change in membrane lipids was
observed in root tissues54. These metabolomic changes usually drive warming to
increase biomass production in several ecosystems41. Warming can thus have a positive
effect on growth and biological activity but only when water or nutrients are not limited
warming can also have a negative effect on plant growth and primary productivity in other
ecosystems, often because warming reduces water availability and/ or nutrient
availability or up-take capacity55,56.
Ecometabolomics has recently been used to monitor the phenotypic changes of
a particular genotype in response to temperature shifts48,57–64. The effects of warming on
leaf metabolomes have been widely studied46,48,58–60,62,65. Nevertheless, undo less is
known about the combined effect of warming on plant-soil system by metabolomic
analyses of both compartments at once, and little is known on the tipping point of
increased warming.
In this master thesis two grassland ecosystem, submitted to natural temperature
gradients of warming are studied in Iceland to consider plant and soil simultaneously to
search for tipping points in the responses to progressive
warming, and to discern the role of evolutionary adaptation,
the long-term responses in comparison with immediate
short-term responses to warming. Iceland is an island
formed in the zone between the American and Eurasian
continental plates66. The area around Hveragerði is
extremely geothermally active, because it is situated in the
direct surroundings of the Hengill volcano system67. This
geothermal activity manifests itself as hot springs and
fumaroles. These hot spots warm the surrounding soil
layers, creating a soil temperature gradient. We studied two
valleys that have housed fumaroles and hot rivers for
centuries. The hot spots are present in the first grassland
from at least the 1980ties and is assumed that this valley
can be considered as a study of long time exposure and
the plant species communities can be considered to be
near to equilibrium. The second valley suffered a shallow
crustal earthquake with a strength of 6.3 on the Richter
magnitude scale in 2008. This earthquake changed the
Figure 2. Natural soil warming in natural grassland in Iceland.

6
course of underwater systems and as a result new fumaroles appeared and the soil
began to head up. Thus, this valley can be considered as a proxy to study the short-
medium time exposure and the plant species communities can be considered to be far
to equilibrium.
We investigated the impact of warming on the metabolomic structure of
aboveground organs (leaves) of the grass Agrostis capillaris L. and the herbaceous dicot
Ranunculus acris L., in both sites. We tested the hypothesis that plants respond
differently depending on the time that their population have been exposed to warming.
The interest of this study is that the temperature gradient of soil in these valleys of
southern Iceland provides the possibility to study the impact of the predicted temperature
rise at short- and at long-time and to study the likely abrupt shifts in the progressive
warming by comparing plots in a gradient from control to +15 ºC. The temperature
gradient in the experimental sites has a lot of advantages in comparison with the human
induced warming experiments such as lack of experimental artefacts in addition to the
zero cost of warming. Moreover, as in the old valley was likely warmed during centuries
or at the very least by more than 30 years, and the newest valley is warmed only since
2008 they offer an excellent chance to study the impact of temperature on many
ecosystems process at different time scenarios.

7
2 Objectives
The objectives of this Master Thesis were the following ones:
1. To study the impact on soil warming on the metabolic profile in two plant species, the
grass Agrostis capillaris L and the herb Ranunculus acris L. a grass and herb, i.e. two
plants species of very different morphological and physiological traits.
2. To discern whether the growth shifts in the metabolome in response to warmer soils
are stronger in the grassland submitted to long-time warming than in the grassland
submitted to short-medium time warming.
3. To find out which metabolites are in higher or lower concentration in relation with the
different degrees of warming, and therefore which metabolic pathways are up-regulated
and which ones are down-regulated.
4. To search for tipping points, i.e. for thresholds, in the response of the metabolomes to
increasing warming.

8
3 Results
Both studied species, Agrostis capillaris L. and Ranunculus acris L., had different overall
metabolome profiles (PERMANOVA pseudo-F = 243; P < 0.001). The metabolome
profile was also affected by site (pseudo-F = 13.2; P < 0.001), and marginally significantly
by warming (pseudo-F = 2.02; P < 0. 1). There was a significant interaction between
species and site (pseudo-F = 6.29; P < 0.001) and between site and warming (pseudo-
F = 2.03; P < 0.05), but not between species and warming (pseudo-F = 1.26; P > 0.05).
The temperature threshold where we observed an abrupt shift in overall metabolome
profile of both species was located between 5 and 10 ºC above the control temperature
(Table S1).
Soil pH and C and N concentrations were different between sites (pH; F = 5.42;
P < 0. 05; %C: F = 10.5; P < 0. 001; %N: F = 155; P < 0. 001) and among warming levels
(pH; F = 6.03; P < 0. 001; %C: F = 7.92; P < 0. 001; %N: F = 4.18; P < 0. 005). No
significant differences were found for soil RNA/DNA neither with site nor with warming
(pseudo-F = 0.56; P > 0.05) (Table S2).
When all data were analysed together in a Principal Component Analysis (PCA),
PC1 accounted for the differences between species, whereas PC2 separated samples
of both sites (Figure 3) consistent with the results of PERMANOVA analysis. PCs 1 and
2 explained 31 and 7% of variance respectively in the PCA conducted with the leaf
samples (including species, site and warming). Species is thus the primary factor and
site the secondary factor explaining leaf metabolomic profile variance. Concentrations of
amino acids, some amino acid and sugar related compounds (RCAAS), some nitrogen
bases, some phenols and most organic acids were higher in Agrostis capillaris L. species
(Figure 3). The concentrations of some sugars such as ribose, lyxose, sorbose and
trehalose, some organic acids such as malic acid, and some phenols were higher in
Ranunculus acris L. species (Figure 3).

9
Figure 3. Plots of cases and variables in the PCA conducted with the physic-chemical, elemental composition, biological
and metabolomic variables in Ranunculus acris L. and Agrostis capillaris L. using PC1 versus PC2. (A) The cases are
categorized by site and specie. Species are indicated by different colours (green, Ranunculus acris L.; orange, Agrostis
capillaris L. The two sites are indicated by symbols N, new warming site; O, old warming site). (B) Loadings of the
metabolomic variables in PC1 and PC2. The various metabolomic families are represented by colours: dark blue, sugars;
green, amino acids; orange, related compounds to the metabolism of amino acids and sugars; cyan, nucleotides; brown,
phenolics; dark red, terpenes and red others. Metabolites: Arginine (Arg), asparagine (Asn), aspartic acid (Asp), glutamic
acid (Glu), glutamine (Gln), isoleucine (Ile), lysine (Lys), leucine (Leu), methionine (Met), phenylalanine (Phe), serine
(Ser), tryptophan (Trp), threonine (Thr), tyrosine (Tyr), valine (Val), adenine (Ade), adenosine (Ado), thymidine (TdR),
chlorogenic acid (CGA), trans-caffeic acid (CafA), α-ketoglutaric acid (KG), citric acid (Cit), L-malic acid (Mal), lactic acid
(LA), succinic acid (SAD), pantothenic acid hemicalcium salt (Pan), jasmonic acid (JA), 5,7-dihydroxy-3,4,5-
trimethoxyflavone (Fla), acacetin (AC), epicatechin (EC), epigallocatechin (EGC), homoorientin (Hom), isovitexin (Ivx),
kaempferol (Kae), myricetin (Myr), quercetin (Qct), resveratrol (Rvt), saponarin (Sp), catechin hydrate (Cat), 3-coumaric
acid (CouA), gallic acid (GA), quinic acid (QuiA), Sodium salicylate (Sal), syringic acid (Syr), trans-ferulic acid (Fer), vanillic
acid (Van), 2-deoxy-D-ribose (Rib), D-(-)-lyxose (Lyx), D-(+)-Sorbose (Sor), D-(+)-Trehalose dehydrate (Tre), Aucubin
(Auc). Unassigned metabolites are represented by small grey points.

10
3.1 Effects of site and warming on the metabolome of Agrostis capillaris L.
PCs 1 and 2 explained 13 and 8% of variance respectively in the PCA conducted with
the leaf samples (including site and warming) of A. capillaris plants (Figure 4). PC1
accounted for the differences between sites. RNA/DNA ratios are higher in the old site
(Figure 4).
Figure 4. Plots of cases and variables in the PCA conducted with the physic-chemical, elemental composition, biological
and metabolomic variables in Agrostis capillaris L. using PC1 versus PC2. (A) Samples categorised scores (mean ± S.E.)
in both sites (new warming site, N and old warming site, O). (B) Loadings of the various physic-chemical, biological and
metabolomic variables in PC1 and PC2. Physic-chemical variables, C, N and RNA/DNA concentrations are shown in
purple. The various metabolomic families are represented by colours: dark blue, sugars; green, amino acids; orange,
related compounds to the metabolism of amino acids and sugars; cyan, nucleotides; brown, phenolics; dark red, terpenes
and red others. Metabolites as in Figure 3. Unassigned metabolites as in Figure 3 are not depicted in this figure.

11
The PCA showed differences among the different warming levels and this result
is backed up with the PERMANOVA results showing that A. capillaris plants growing at
higher temperatures had clearly different metabolome structure than those growing at
lower temperatures in the old warming site. Differently, in the new warming site there
were not differences in metabolome structure among plants growing at different soil
temperatures (Figure 4 and table 1 and 2).
The main differences observed in A. capillaris plants growing in old warming site
at different temperatures were the increase of the concentrations of the most determined
phenols and terpenes under extreme warming conditions (+15ºC). However, plants
growing in soil at +10ºC had higher the concentrations of some amino acids and had the
highest concentration of malic acid (Figure 4 and 5).
Figure 5. Clustered image maps of the metabolites in the old warming site of Agrostis capillaris L. based on the data of
the PLS analysis. The red and blue colours indicate positive and negative correlations respectively.

12
The physic-chemical variables such as soil pH and soil C and N concentration
did not show differences between sites. Soil pH and temperature were linked to
metabolome shifts in both sites, while foliar RNA/DNA ratio was linked to metabolome
shifts only in the new grassland.
Table 1. PERMANOVA results of Agrostis capillaris L. Bold type indicates significant effects (P < 0.05). Italics type indicates marginally significant effects (P < 0.1).
Df F.Model P-value
Site 1 13.3136 0.0005
Temperature 5 1.6354 0.0210
SitexTemp 5 1.4068 0.0815
Table 2. Post-hoc Turkey HSD tests from the one-way ANOVA. The table shows the results of t-test statistics for the
comparisons of different warming levels of Agrostis capillaris L. (A) in the old warming site, and (B) the new warming site
regarding the PCA scores. Bold type indicates significant effects (P < 0.05) and italic type indicated marginal effect
(P < 0. 1).
Agrostis capillaris L. Old warming site
B C D E F
A 0.92 1.000 1.00 0.01 0.047
B 0.936 0.92 0.08 0.004
C 1.00 0.04 0.01
D 0.05 0.05
E 0.03
Agrostis capillaris L. New warming site
B C D E F
A 1.00 0.70 0.23 0.02 0.08
B 0.93 0.49 0.04 0.07
C 0.98 0.07 0.07
D 1.00 0.09
E 0.82
3.2 Effects of site and warming on the metabolome of Ranunculus acris L.
PC2 accounted for the differences between sites in the metabolomes of Ranunculus
acris L. (Figure 6). PCs 1 and 2 explained 9 and 7% of variance respectively in the PCA
conducted with the leaf samples (including site and warming). The metabolomes were
more different among plants submitted at different soil temperatures in the new warming
site than in the old warming site (Figure 6).
The metabolome was different in the sets of plants growing in the two sites, and
in the different levels of warming. In the new warming site, the highest warming levels
A)
B)

13
(+15ºC, +10ºC) had different metabolome profile than the plants growing under other soil
temperatures (Table 3).
The physic-chemical variables such as soil pH and stoichiometry were different
between sites. In R. acris, soil pH and temperature were linked to metabolome
differences in the new warming site while the foliar RNA/DNA and soil C and N were
linked to metabolome shifts in the old warming site.
Figure 6. Plots of cases and variables in the PCA conducted with the physic-chemical, elemental composition, biological
and metabolomic variables in Ranunculus acris L. using PC1 versus PC2. (A) Samples categorised scores (mean ± S.E.)
in both sites (new warming site, N and old warming site, O). (B) Loadings of the various physic-chemical, biological and
metabolomic variables in PC1 and PC2. Physic-chemical variables, C, N and RNA/DNA concentrations are shown in
purple. The various metabolomic families are represented by colours: dark blue, sugars; green, amino acids; orange,

14
related compounds to the metabolism of amino acids and sugars; cyan, nucleotides; brown, phenolics; dark red, terpenes
and red others. Metabolites as in Figure 3. Unassigned metabolites as in Figure 3 are not depicted in this figure.
The main effects of warming were higher in concentrations of phenols such as
coumaric acid, quinic acid, saponarin, resveratrol and some terpenes, and some sugars
detected at high concentrations in plants growing under the extreme warming conditions.
In contrast, the concentrations of some amino acids and organic acids such as malic
acid were higher in R. acris plants growing under lower warming treatments (Figure 6
and 7).
In the new warming site, the metabolome profile of R. acris plants growing at
higher temperatures were clearly separated from the rest; while in the old warming site
R. acris plants growing at different soil temperatures presented less difference in
metabolome structure (Figure 6). The PCA showed differences among the different
warming levels in both sites and this result is backed up with the PERMANOVA results
(Table 4).
Figure 7. Clustered image maps of the metabolites in the new warming site for Ranunculus acris L. based on the data of
the PLS analysis. The red and blue colours indicate positive and negative correlations respectively.

15
Soil total carbon and nitrogen concentrations were negatively related with
metabolome shifts associated with increasing temperature in R. acris, and foliar
RNA/DNA of R. acris was negatively related with metabolome shifts associated with
increasing temperature.
Table 3. Post-hoc Turkey HSD tests from the one-way ANOVA. The table shows the results of t-test statistics for the
comparisons of different warming levels of Ranunculus acris L. (A) in the old warming site and (B) the new warming site
regarding the PCA scores. Bold type indicates significant effects (P < 0.05) and italic type indicated marginal effect
(P < 0. 1).
Ranunculus acris L. Old warming site
B C D E
A 0.05 0.14 0.99 0.40
B 0.92 0.05 0.53
C 0.12 0.91
D 0.31
Ranunculus acris L. New warming site
B C D E F
A 0.99 1.00 0.74 0.02 0.02
B 0.96 0.97 0.007 0.006
C 0.62 0.03 0.03
D 0.01 0.001
E 0.89
Table 4. PERMANOVA results of Ranunculus acris L. Bold type indicates significant effects (P < 0.05). Italics type
indicates marginally significant effects (P < 0.1).
Df F.Model P-value
Site 1 2.9063 0.0005
Temperature 5 1.9687 0.0005
SitexTemp 4 1.0586 0.2334
A)
B)

16
4 Discussion
The effect of warming in metabolome of both species was abrupt in temperatures higher
than 5-10ºC respect to control; the metabolome suffered significant changes (table S1)
between the two sets of plants growing at these temperatures. Under climate change
scenario, temperatures are projected to rise between 3-5ºC in boreal areas13 (Figure 1).
According to our results, both species would adapt to this increase in temperature without
significantly shifting their metabolome.
The variability of the metabolome was lower in the Ranunculus acris L. samples
than in the Agrostis capillaris L. samples (Figure 3). The shift in the metabolome of
Ranunculus acris L. individuals growing at different soil temperatures was much less
significant and smaller than those Agrostis capillaris L. The coefficient of variation of the
PC2 scores was 15% for Ranunculus acris L. and 57% for Agrostis capillaris L. The
metabolomic analyses results strongly suggested that the metabolism of Ranunculus
acris L. appears to be much more conservative and homeostatic than that of A. capillaris.
These results are consistent with previous studies reporting that heath herbs showed
higher metabolomic homeostasis and less metabolomic flexibility in response to changes
in environmental conditions than grass species68.
The grass species did not shift its metabolome significantly with soil warming at
short-term but it did at long-term warming. A possible reason could be that Agrostis
capillaris L. propagates vegetatively by rhizomes and stolons but also could be by way
of seeds. The large proportion of A. capillaris clones and low proportion of seedlings in
populations suggests that much of its reproduction is vegetative. Contrarily, the heath
herb species shifted its metabolomic profile much less than the grass, but the little
change occur at short time but not at long-term warming. These results thus showed
contrasting different time-response when comparing both species. The seeds of R. acris,
while having no obvious dispersal mechanism and tending to fall close to the parent
plant70, can be carried long distances on the pelts or hooves of stock and in the gut of
grazing animals71–74. Sarukhan (1974) found that a large proportion of R. acris seeds fed
to cows was still viable after being voided in faeces and Dore and Raymond (1942)
calculated that one cow could disperse approximately 9400 tall buttercup seeds. The
different strategies to spread the new individual plants can be underlying the different
results observed between both species. A. capillaris have mainly vegetative reproduction
and thus the new individuals grow near their parental cohort. This should facility the local
evolution and a progressive adaptation to the temperature gradient at short distances.

17
Thus a progressive selection at short distances explained why we observed greater
differences among plots under different temperatures with the pass of time. In contrast,
the great dispersion of the new individuals of R. acris with respect the parent cohort will
prevent this effect.
The metabolome profile of A. capillaris among different individual plants
submitted to different soil temperatures in the old warming site is more different
depending on soil temperature (the highest warming plot are clearly different than the
others that indicate the specialization through time) in the old than the in new field. The
metabolome did not significantly change with warming in the new warming site. The ratio
of RNA/DNA is higher in the old grassland in the highest warmed plot of A.
capillaris plants, also suggesting that A. capillaris plants growing in old warming site have
higher transcriptome activity or a higher activity of gene expression and protein synthesis
in the long-term warming exposed population than in short-time warming exposed
population. A selection towards more metabolically active individuals by long-time
warming is thus suggested in this species. Warmed grassland plants had more active
metabolism pathways related with sugars and amino acids but also with some important
secondary metabolite groups such as phenols and terpenes. This up-regulation of
primary metabolic pathways coincided with a higher RNA/DNA ratio in plants indicating
a higher capacity of the system to increase its DNA consistent with a rise in plant activity.
Agrostis capillaris L. plants in the old warming site presented an increase of
amino acids and their derivates (citric acid, threonine, glutamine, glutamic acid, and
malate) phenols and terpenes with warming; whereas in the new warmed grassland the
organic acids, sugars and phenols concentrations were present in higher concentrations
(Figure 5). These results are consistent with previous ones that found similar
metabolomic shifts under drought or warming conditions observing a metabolomic shift
towards a pronounced mobilization of sugars in soluble form and by a synthesis of
soluble amino acids. All of them contribute to an increase of cell osmotic potential and
prevents water losses76–78.
Agrostis capillaris L. plants metabolome in the old warming site growing under
higher temperature showed an increase of sugars that revealed a regulatory effect on
the heat stress effect79, phenolic compounds, some organic acids and terpenes such as
aucubin concentrations, all them involved in anti-stress mechanisms80 (Figure S1).
Agrostis capillaris L. plants in the new warming site at higher temperature had the lowest
concentration of the free amino acids such as methionine, lysine, and isoleucine (Figure
S1). This decrease in free amino acids could be associated to the incorporation of amino

18
acids in heat stress protective proteins. However, there was an increase in asparagine,
a metabolite that plays the role in nitrogen storage and transport and contributes to the
maintenance of osmotic pressure81. An extreme increase in soil temperature can lead
plant to water deficit producing more soluble sugars and amino acids that could act as
osmolytes that contribute to turgor maintainance by osmotic adjustment78,82,83. The
metabolome in leaves of Agrostis capillaris L. in the new warming site in higher
temperature, showed an increase of jasmonic acid that acts as a regulator of plant growth
and development process. Jasmonic acid is converted to a variety of derivatives
including their esters that may also be conjugated to amino acids.
Ranunculus acris L. had higher concentrations of free amino acids, most phenols
and organic acid and sugars in the new warming site than in the old warming site (Figure
7 and S2). However, in the old warming site we detected higher concentration of nitrogen
bases, flavonols, and higher foliar RNA/DNA ratio. This heath herb, with long-time
generation time and probably with general traits closer to a stress-tolerant species has
less metabolomic flexibility and variability among different individuals and the differences
among individual plants growing at different temperatures tend to be small with time.
When metabolomic profiles of R. acris plants of both sites were analysed
together, we observed higher concentration of free amino acids and some nucleotide
bases in the lowest temperature plots in the old and the new warming sites. The
production of amino acids indicates activation of primary metabolism suggesting that
under control temperatures plants had more up regulated the primary metabolism and
less the secondary metabolism than under heat stress. In the new warming site
Ranunculus acris L. had higher concentration of organic acids such as lactic acid, trans-
caffeic acid, sugars such as lyxose, ribose, sorbose and trehalose, and secondary
metabolites such as phenols than in the old warming sites (Figure 7 and S2). These
patterns are in accordance to previous studies reporting that during stress period plants
can accumulate non-reducing disaccharides such as lyxose84. Plants in the warming
treatments had higher concentrations of metabolites related to the heat shock response,
such as sucrose and glucose and normally were associated with higher concentrations
of amino acids. R. acris did not have an increase in the pool sizes of amino acids
(asparagine, leucine, isoleucine, threonine, alanine and valine), and derivatives such as
oxaloacetate and pyruvate78. The extreme increase in soil temperature can lead plant to
water deficit producing more soluble sugars and amino acids that could act as osmolytes
that contribute to turgor maintainance by osmotic adjustment78,82,83. Tyrosine was found
in a high concentration due to its important role in photosynthesis because acts as an
electron donor in the reduction of oxidized chlorophyll and it has been shown to have

19
relation in the levels of stress hormones85. Phenylalanine, which is in higher
concentration in the highest temperature, is the substrate of phenylalanine ammonia
lyase (PAL) which is the key enzyme in the phenolic biosynthesis pathway. This is in
agreement with the increase of concentration of phenolics compounds the highest
temperature. These phenols seem to protect the plants against abiotic and biotic
stresses86.
Ranunculus acris L. growing in the old warming site under moderate warming
(control to +5ºC), presented metabolome with higher concentration of polyphenolics such
as quinic acid and organic acids that are metabolites associated to the Krebs cycle such
as malic acid, chlorogenic acid, quercetin and α-Ketoglutaric acid (Figure S2). α-
Ketoglutaric acid is an intermediary of the Krebs cycle and a precursor to the amino acid
biosynthesis of glutamine and glutamate. These compounds have been frequently
associated with antioxidant function. Quinic acid is a precursor in the shikimic acid
pathway, a common metabolic pathway in the biosynthesis of aromatic amino acids such
as tyrosine, tryptophan, and phenylalanine87. These kind of amino acids are precursors
of a large variety of secondary metabolites such as lignins, flavonoids, alkaloids, and
phytodexins88. Ranunculus acris L. growing in the old warming site under higher
temperatures (+5 to +10ºC) had also higher concentration of phenols, terpenes and
flavonols such as kaempferol and quercetin, that could have a protective effect against
biotic stressors89,90.
Warming does usually affects the stability of proteins, the efficiency of enzymatic
reactions and the nucleic acids causing severe metabolic imbalance. The most important
primary metabolites are sugar and amino acids which concentration in plant tissues are
affected by stress, usually as result of an increase of impairment in the CO2 assimilation
process75. The high concentration of secondary metabolites cannot be explained as a
result from variation in their primary metabolite precursors and usually is result of a
complex regulatory process. The heat stress frequently affects the plasma membrane of
cells, the stability of proteins, the efficiency of enzymatic reactions and the nucleic acids,
and all together causes severe metabolic imbalance and also changes on the impairment
in electrons transport chains and production of ROS.
Changes in temperature generated the production of different metabolites and thus
a different composition of available C91. Under moderate warming, favourable conditions
for growth, the assimilated C is allocated to growth and energy supply (more primary
metabolism) whereas under less favourable conditions of strong warming the assimilated

20
C is allocated increasingly to anti-stress compounds such as phenols and terpenes
(more secondary metabolism).

21
5 Conclusions
Plant species responded differently to soil warming depending on the time they were
exposed. The shifts in metabolome composition were stronger in the long-time warming
site than in the short-time warming site in the case of the grass species but this was not
so clear in the heath herb species.
The temperature threshold where we observed an abrupt shift in overall
metabolome profile of Agrostis capillaris L. and Ranunculus acris L. species was located
between 5-10 ºC more than control temperature. Above this threshold, both species
tended to up-regulate the metabolic pathways related to warming stresses.
The variability of the metabolome was lower in the Ranunculus acris L. samples than
in the Agrostis capillaris L samples. The shift in the metabolome of Ranunculus acris L.
individuals growing at different soil temperatures was much less significant and smaller
than the shift in Agrostis capillaris L.
In the long-time warming site, plants contained higher concentration in sugars
and amino acids that are related to heat shock metabolism pathways. In addition, in this
long-time warming site, plants had higher concentration of some important secondary
metabolite groups such as phenols and terpenes that could have a protective effect
against biotic stressors. This up-regulation of primary metabolic pathways coincided with
a higher foliar RNA/DNA ratio.
Agrostis capillaris L. plants in the old warming site presented an increase of
amino acids and their derivates (citric acid, methionine, glutamine, glutamic acid, and
malate) phenols and terpenes with warming; whereas in the new warming site the
organic acids, sugars and phenols concentrations were present in higher concentrations
with warming. The ratio of RNA/DNA has higher in the old grassland in the highest
temperatures plots.
The metabolome of Ranunculus acris L. plants of both sites, showed higher
concentration of free amino acids and some nucleotide bases in the lowest temperature
plots. In the new warming site Ranunculus acris L. had more organic acids such as lactic
acid and trans-caffeic acid, sugars such as lyxose, ribose, sorbose and trehalose, and
secondary metabolites such as phenols than the old warming sites. However, in the old
warming site we detected higher concentration of nitrogen bases, flavonols, and higher
foliar RNA/DNA ratio.

22
In the long-time warming site the main compounds that we detected to be up-
regulated at highest temperatures were sugars and amino acids both related to heat
shock metabolic pathways and some secondary metabolites such as phenols and
terpenes also associated with a wide array of stresses.

23
6 Material and Methods
6.1 Description of the study area
6.1.1 Situation
Iceland is a volcanic island situated on the conjuncture of the Atlantic and Arctic ocean
close to the Arctic Circle between the latitudes 62°23’N and 66°32’N and longitudes
13°30’W and 24°32’W. Because of its high latitude, the solar angle is never high and
there is a large difference in day length between summer and winter. The climate of
South West Iceland is maritime with cool summers and mild winters influenced by the
cold East Greenland Current and the warm North Atlantic Current93. The island itself is
a dome uplift of the Mid-Atlantic ridge with mountain peaks of up to more than 2000 m.
Glaciers cover about 11.5% of Iceland’s total area67. Its position on the Mid-Atlantic ridge
makes it a very active volcanic area that played a major role in shaping the island
together with the erosive power of the past and present glacial cover94.
6.1.2 Study sites
The two grasslands studied in this thesis are located in the South West part of Iceland,
near the town of Hveragerði. The mean annual temperature is 4.1°C, with a mean of -
1.1°C in the coldest month (January) and 10.8°C in the warmest (July), and an annual
precipitation of 1372mm (Icelandic Met Office, 2014). The soil type is a brown andosol
with a volcanic origin. This is a freely drained soil type, rich in allophane clay minerals
and ferrihydrates, evolved from eolian and tephra materials originating from
neighbouring active volcanos95,96. The geothermal activity occurring in this area, mainly
in the form of hot springs and fumaroles, originates from the Hengill volcanic system.
This system is situated on the intersect of three volcanic zones, the Hengill system, the
Hrómundartindur system and the Hveragerdi system67,97.
The old warming site (O) ecosystem is situated in a valley several kilometres north of
Hveragerði, known for its geothermal activity for centuries98. Transects in this area will
be studied as a proxy for long-term effects of soil warming. The new warming site, (N),
only has been warmed since an earthquake in May 2008 modified the underground hot
water systems99. Transects of this grassland are situated near the university campus of
Hveragerði and will be examined as an indicator for short-term effects of soil warming on
vegetation.

24
The selected plants included one grass species (Agrostis capillaris L.) and one
herbaceous dicot (Ranunculus acris L.).
6.1.3 Experimental design
Five replicate transects were established along the temperature gradients in the two
valleys, the old-warming site and the new-warming site. Each transect consisted out six
different soil temperature levels. The orientation of the slopes was chosen as similar as
possible for all transects in both warming sites.
The temperature levels were established in by vegetation plots of 0.2x0.5m in which
the average temperature corresponds with one of the six temperature levels. Control, +1
ºC, +3 ºC +5 ºC +10 ºC and +15 ºC.
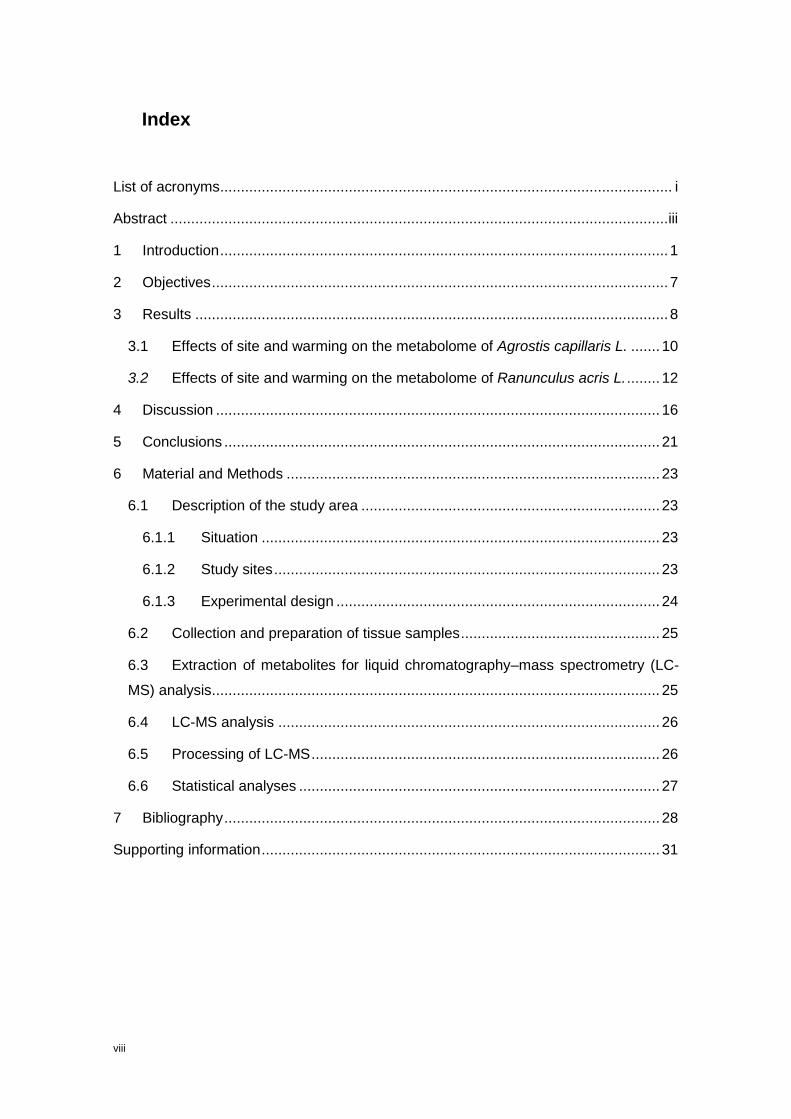
Figure 8. Soil temperatures at 10 cm depth from May 2013 to May 2015 in every measurement plot in (A) the short-term warming site and (B) the long-term warming site. Colours show targeted soil temperature elevations: blue for unwarmed soils, green for +1°C, yellow for +3°C, orange for +5°C and red for +10°C. (C) Natural soil warming in natural grassland in Iceland.
C-)

25
6.2 Collection and preparation of tissue samples
Samples were collected at the end-growing season in July. Leaves 113 tissue samples
were collected (2 species × 2 sites (N and O) × 6 warming treatment × 5 transects (plots).
The procedure for sample preparation is described in detail by Rivas-Ubach et al. (2013).
Briefly, the frozen samples were lyophilized and stored in plastic cans at -80 °C. The
samples were ground with a ball mill (Mikrodismembrator-U, B. Braun Biotech
International, Melsungen, Germany) at 1700 rpm for 2 min, producing a fine powder that
was stored at -80 °C until the extraction of the metabolites. See the supplementary
material of Gargallo-Garriga et al. (2014) for details.
6.3 Extraction of metabolites for liquid chromatography–mass spectrometry
(LC-MS) analysis
The extraction of metabolites followed the protocol of t’Kindt et al. (2008) with minor
modifications. The Eppendorf tubes received 150 mg of sample powder from each
sample, and then 1ml of MeOH/H2O (80: 20) was added to each tube. The tubes were
vortexed for 10 min, sonicated for 5 min at room temperature and then centrifuged at 23
000 g for 5 min. After centrifugation, 0.7 ml of the supernatant from each tube was
collected using crystal syringes, filtered through 0.22-lm pore microfilters and transferred
to a labelled set of high-performance liquid chromatography (HPLC) vials. The vials were
stored at -80°C until the LC-MS analysis. This procedure was repeated for two
extractions of the same sample.
Figure 9. Experimental procedure for the preparation of extracts of plant tissue for its posterior LC-MS analysis.

26
6.4 LC-MS analysis
LC-MS chromatograms were obtained with a Dionex Ultimate 3000 HPLC system
(Thermo Fisher Scientific/Dionex RSLC, Dionex, Waltham USA) coupled to an LTQ
Orbitrap XL high-resolution mass spectrometer (Thermo Fisher Scientific, Waltham,
USA) equipped with an HESI II (heated electrospray ionisation) source. Chromatography
was performed on a reversed-phase C18 Hypersil gold column (150 × 2.1 mm, 3-µ
particle size; Thermo Scientific, Waltham, USA) at 30 °C. The mobile phases consisted
of acetonitrile (A) and water (0.1% acetic acid) (B). Both mobile phases were filtered and
degassed for 10 min in an ultrasonic bath prior to use. The elution gradient, at a flow rate
of 0.3 mL per minute, began at 10% A (90% B) and was maintained for 5 min, then to
10% B (90% A) for the next 20 min. The initial proportions (10% A and 90% B) were
gradually recovered over the next 5 min, and the column was then washed and stabilised
for 5 min before the next sample was injected. The injection volume of the samples was
5 µL. HESI was used for MS detection. All samples were injected twice, once with the
ESI operating in negative ionisation mode (-H) and once in positive ionisation mode (+H).
The Orbitrap mass spectrometer was operated in FTMS (Fourier Transform Mass
Spectrometry) full-scan mode with a mass range of 50-1000 m/z and high-mass
resolution (60 000). The resolution and sensitivity of the spectrometer were monitored by
injecting a standard of caffeine after every 10 samples, and the resolution was further
monitored with lock masses (phthalates). Blank samples were also analysed during the
sequence. The assignment of the metabolites was based on the standards, with the
retention time and mass of the assigned metabolites in both positive and negative
ionisation modes.
6.5 Processing of LC-MS
The LC-MS raw data files were processed using MZMINE 2.10 100 (see Table S3 of the
Supporting Information for details). Before the numerical database was exported in “csv”
format, the chromatograms were base-line-corrected, deconvoluted, aligned and filtered.
Metabolites were assigned by comparison with the analyses of the standards (retention
time and mass spectrometry). Assigned variables corresponding to the same molecular
compounds were summed. The LC-MS data for the statistical analyses corresponds to
the absolute peak area at each retention time (RT). The area of a peak is directly
proportional to the concentration (i.e. µg/mL) of its corresponding (assigned) metabolite
in the sample. Thus, a change in the area of a peak will mean a change in the
concentration of its assigned metabolite.

27
6.6 Statistical analyses
HPLC-MS data was analysed by univariate and multivariate statistical analyses. We
conducted permutational multivariate analyses of variance (PERMANOVAs)101 using the
Euclidean distance, with site (N and O), species (Ra, Ao), warming treatment (six levels
of warming), and plant as fixed factors and individuals as random factors. Multivariate
ordination principal component analyses (PCAs) (based on correlations) and partial least
squares discriminant analyses (PLS-DAs) were also performed to detect patterns of
sample ordination in the metabolomic and stoichiometric variables. The profiles of leaves
from different site were additionally submitted to separate PCAs (Fig. 1). The PC scores
of the cases were subjected to one-way ANOVAs to determine the statistical differences
among groups with different levels of the categorical independent variables studied
(species, plant and warming treatment). The PERMANOVAs, PCAs, PLS analyses, and
clustered image maps were conducted by the mixOmics package of R software (R
Development Core Team 2008). The Kolmogorov-Smirnov (KS) test was performed on
each variable to test for normality. All assigned and identified metabolites were normally
distributed, and any unidentified metabolomic variable that was not normally distributed
was removed from the data set. Statistica v8.0 was used to perform the ANOVAs, post
hoc tests, and KS tests.

28
7 Bibliography
1. Moss, R. et al. Towards New Scenarios for Analysis of Emissions, Climate Change, Impacts and Response Strategies. IPCC Expert Meeting Report (2008).
2. Parmesan, C. Ecological and Evolutionary Responses to Recent Climate Change. Annu. Rev. Ecol. Evol. Syst. (2006). doi:10.1146/annurev.ecolsys.37.091305.110100
3. Peñuelas, J. et al. Evidence of current impact of climate change on life: a walk from genes to the biosphere. Glob. Chang. Biol. 19, 2303–38 (2013).
4. Walther, G.-R. et al. Ecological responses to recent climate change. Nat. www.nature.com 416, (2002). 5. IPCC. (2013). 6. Song, Y. H., Ito, S. & Imaizumi, T. Flowering time regulation: Photoperiod- and temperature-sensing in leaves.
Trends in Plant Science (2013). doi:10.1016/j.tplants.2013.05.003 7. Carnicer, J. et al. Widespread crown condition decline, food web disruption, and amplified tree mortality with
increased climate change-type drought. Proc. Natl. Acad. Sci. U. S. A. 108, 1474–1478 (2011). 8. Fernández-Martínez, M. et al. Nutrient availability as the key regulator of global forest carbon balance. Nat.
Clim. Chang. 4, 471–476 (2014). 9. Peñuelas, J. et al. Human-induced nitrogen–phosphorus imbalances alter natural and managed ecosystems
across the globe. Nat. Commun. 4, (2013). 10. Wolkovich, E. M. et al. Warming experiments underpredict plant phenological responses to climate change.
Nature 485, (2012). 11. Peñuelas, J., Filella, I. & Comas, P. Changed plant and animal life cycles from 1952-2000 in the Mediterranean
region. Glob. Chang. Biol. 531–544 (2002). doi:10.1046/j.1365-2486.2002.00489.x 12. Overpeck, J. et al. Arctic Environmental Change of the Last Four Centuries. Science (80-. ). 278, 1251–1256
(1997). 13. ACIA. Impacts of a Warming Arctic: Arctic Climate Impact Assessment. Cambridge Univ. Press 1046 (2004).
doi:10.2277/0521617782 14. Thóra Ellen Thórhallsdóttir. Flowering phenology in the central highland of Iceland and implications for climatic
warming in the Arctic. Oecologia 43–49 (1998). 15. Shanker, A. K. & Venkateswarlu, B. ABIOTIC STRESS IN PLANTS – MECHANISMS AND ADAPTATIONS
Abiotic Stress in Plants – Mechanisms and Adaptations Edited. (2011). 16. Gall, H. et al. Cell Wall Metabolism in Response to Abiotic Stress. Plants 4, 112–166 (2015). 17. Munns, R. Comparative physiology of salt and water stress. Plant Cell Einviron 25, 239–250 (2002). 18. Stepien, P. & Klobus, G. Antioxidant defense in the leaves of C3 and C4 plants under salinity stress. Physiol.
Plant. 125, 31–40 (2005). 19. Munns, R. & Tester, M. Mechanisms of salinity tolerance. Annu. Rev. Plant Biol. 59, 651–81 (2008). 20. Mahajan, S. & Tuteja, N. Cold, salinity and drought stresses: an overview. Arch. Biochem. Biophys. 444, 139–
58 (2005). 21. Bates, L. S., Waldren, R. P. & Teare, I. D. Rapid determination of free proline for water-stress studies. Plant
Soil 39, 205–207 (1973). 22. Voisin, A. S., Munier-Jolain, N. G. & Salon, C. The nodulation process is tightly adjusted to plant growth. An
analysis using environmentally and genetically induced variation of nodule number and biomass in pea. Plant Soil 337, 399–412 (2010).
23. Kant, S., Bi, Y.-M., Weretilnyk, E., Barak, S. & Rothstein, S. J. The Arabidopsis halophytic relative Thellungiella halophila tolerates nitrogen-limiting conditions by maintaining growth, nitrogen uptake, and assimilation. Plant Physiol. 147, 1168–1180 (2008).
24. Malamy, J. E. & Ryan, K. S. Environmental Regulation of Lateral Root Initiation in Arabidopsis 1. Plant Physiol. 127, 899–909 (2001).
25. Bita, C. E. & Gerats, T. Plant tolerance to high temperature in a changing environment: scientific fundamentals and production of heat stress-tolerant crops. Front. Plant Sci. 4, 273 (2013).
26. Allakhverdiev, S. I. et al. Heat stress: An overview of molecular responses in photosynthesis. Photosynth. Res. 98, 541–550 (2008).
27. Wang, W., Vinocur, B., Shoseyov, O. & Altman, A. Role of plant heat-shock proteins and molecular chaperones in the abiotic stress response. Trends Plant Sci. 9, 244–252 (2004).
28. Hatfield, J. L., Boote, K. J., Kimball, B. A., Ziska, L. H. & Izaurralde, R. C. Climate Impacts on Agriculture: Implications for Crop Production. (2011).
29. Hatfield, J. L. & Prueger, J. H. Temperature extremes: Effect on plant growth and development. Weather Clim. Extrem. 10, 4–10 (2015).
30. Schär, C. & Jendritzky, G. Climate change: Hot news from summer 2003. Nature 432, 559–560 (2004). 31. Gutschick, V. P. & BassiriRad, H. Extreme events as shaping physiology, ecology, and evolution of plants:
toward a unified definition and evaluation of their consequences. New Phytol. 160, 21–42 (2003). 32. Reusch, T. B. H., Ehlers, A., Hämmerli, A. & Worm, B. Ecosystem recovery after climatic extremes enhanced
by genotypic diversity. Proc. Natl. Acad. Sci. U. S. A. 102, 2826–31 (2005). 33. Jentsch, A. & Beierkuhnlein, C. Research frontiers in climate change: Effects of extreme meteorological events
on ecosystems. Comptes Rendus Geosci. 340, 621–628 (2008). 34. Knapp, A. K. et al. Consequences of More Extreme Precipitation Regimes for Terrestrial Ecosystems.
Bioscience 58, 811–821 (2008). 35. Jentsch, A. et al. Climate extremes initiate ecosystem-regulating functions while maintaining productivity. J.
Ecol. 99, 689–702 (2011). 36. Smith, M. D. The ecological role of climate extremes: current understanding and future prospects. J. Ecol. 99,

29
651–655 (2011). 37. Reich, P. B., Walters, M., Tjoelker, M., Vanderklein, D. & Buschena, C. Photosynthesis and respiration rates
depend on leaf and root morphology and nitrogen concentration in nine boreal tree species differing in relative growth rate. Funct. Ecol. 12, 395–405 (1998).
38. Reich, Peter B and Wright, Ian J and Lusk, C. H. redicting leaf physiology from simple plant and climate attributes: a global GLOPNET analysis. Ecol. Appl. 17, (2007).
39. Walker, M. D. et al. Plant community responses to experimental warming across the tundra biome. 103, (2006). 40. Elmendorf, S. C. et al. Plot-scale evidence of tundra vegetation change and links to recent summer warming.
Nat. Clim. Chang. 2, 453–457 (2012). 41. Rustad, L. et al. A meta-analysis of the response of soil respiration, net nitrogen mineralization, and
aboveground plant growth to experimental ecosystem warming. Oecologia 126, 543–562 (2001). 42. Chapin, F. S., Shaver, G. R., Giblin, A. E., Nadelhoffer, K. J. & Laundre, J. A. Responses of Arctic Tundra to
Experimental and Observed Changes in Climate RESPONSES OF ARCTIC TUNDRA TO EXPERIMENTAL AND OBSERVED CHANGES IN CLIMATE ’. 76, 694–711 (1995).
43. Fiehn, O. et al. Metabolite profiling for plant functional genomics. Nat. Biotechnol. 18, 1157–61 (2000). 44. Peñuelas, J. & Sardans, J. Ecology: Elementary factors. Nature 460, 803–804 (2009). 45. Peñuelas, J. & Sardans, J. Ecological metabolomics. Chem. Ecol. 25, 305–309 (2009). 46. Sardans, J., Peñuelas, J. & Rivas-Ubach, A. Ecological metabolomics: overview of current developments and
future challenges. Chemoecology 21, 191–225 (2011). 47. Weckwerth, W., Loureiro, M. E., Wenzel, K. & Fiehn, O. Differential metabolic networks unravel the effects of
silent plant phenotypes. Proc. Natl. Acad. Sci. U. S. A. 101, 7809–14 (2004). 48. Rivas-ubach, A. et al. Drought enhances folivory by shifting foliar metabolomes in Quercus ilex trees. New
Phytol. 202, 874–885 (2014). 49. Allakhverdiev, S. I., Nishiyama, Y., Suzuki, I., Tasaka, Y. & Murata, N. Genetic engineering of the unsaturation
of fatty acids in membrane lipids alters the tolerance of Synechocystis to salt stress. Proc. Natl. Acad. Sci. U. S. A. 96, 5862–7 (1999).
50. Horváth, I., Vigh, L., Pali, T. & Thompson, G. A. Effect of catalytic hydrogenation of Tetrahymena ciliary phospholipid fatty acids on ciliary phospholipase A activity. Biochim. Biophys. Acta - Lipids Lipid Metab. 1002, 409–412 (1989).
51. Vigh, L., Gombos, Z., Horváth, I. & Joó, F. Saturation of membrane lipids by hydrogenation induces thermal stability in chloroplast inhibiting the heat-dependent stimulation of Photosystem I-mediated electron transport. Biochim. Biophys. Acta - Biomembr. 979, 361–364 (1989).
52. Vigh, L., Los, D. a, Horváth, I. & Murata, N. The primary signal in the biological perception of temperature: Pd-catalyzed hydrogenation of membrane lipids stimulated the expression of the desA gene in Synechocystis PCC6803. Proc. Natl. Acad. Sci. U. S. A. 90, 9090–4 (1993).
53. Gargallo-Garriga, A. et al. Opposite metabolic responses of shoots and roots to drought. Sci. Rep. 4, 1–7 (2014).
54. Larkindale, J. et al. Heat Stress Phenotypes of Arabidopsis Mutants Implicate Multiple Signaling Pathways in the Acquisition of Thermotolerance. Plant Physiol. 138, 882–897 (2005).
55. Heckathorn, S. A. & DeLucia, E. H. Drought-Induced Nitrogen Retranslocation in Perennial C4 Grasses of Tallgrass Prairie. Ecology 75, 1877–1886 (1994).
56. Heckathorn, S., & Delucia, E. Restranslocation of Shoot Nitrogen to Rhizomes and Roots in Prairie Grasses May Limit Loss of N to Grazing and Fire during Drought. Funct. Ecol. (1996).
57. Charlton, A. J. et al. Responses of the pea (Pisum sativum L.) leaf metabolome to drought stress assessed by nuclear magnetic resonance spectroscopy. Metabolomics 4, 312–327 (2008).
58. Fumagalli, E. et al. NMR Techniques Coupled with Multivariate Statistical Analysis: Tools to Analyse Oryza sativa Metabolic Content under Stress Conditions. J. Agron. Crop Sci. 195, 77–88 (2009).
59. Lugan, R. et al. Metabolome and water status phenotyping of Arabidopsis under abiotic stress cues reveals new insight into ESK1 function. Plant. Cell Environ. 32, 95–108 (2009).
60. Michaud, R. M. et al. Metabolomics reveals unique and shared metabolic changes in response to heat shock, freezing and desiccation in the Antarctic midge, Belgica antarctica. J. Insect Physiol. 54, 645–55 (2008).
61. Pinheiro, C., Passarinho, J. A. & Ricardo, C. P. Effect of drought and rewatering on the metabolism of Lupinus albus organs. J. Plant Physiol. 161, 1203–10 (2004).
62. Rivas-ubach, A., Sardans, J., Pérez-Trujillo, M., Estiarte, M. & Peñuelas, J. Strong relationship between elemental stoichiometry and metabolome in plants. Proc. Natl. Acad. Sci. U. S. A. 109, 4181–6 (2012).
63. Sardans, J., Peñuelas, J. & Rivas-Ubach, A. Ecological metabolomics: overview of current developments and future challenges. Chemoecology 21, 191–225 (2011).
64. Michaud, M. R. & Denlinger, D. L. Shifts in the carbohydrate, polyol, and amino acid pools during rapid cold-hardening and diapause-associated cold-hardening in flesh flies (Sarcophaga crassipalpis): a metabolomic comparison. J. Comp. Physiol. B. 177, 753–63 (2007).
65. Cramer, G. R. et al. Water and salinity stress in grapevines: early and late changes in transcript and metabolite profiles. Funct. Integr. Genomics 7, 111–34 (2007).
66. Nodroff, S. R. Seismic Response of Squat Walls Founded on Gravel Cushions. 1253–1262 (2016). 67. Zakharova, O. K. & Spichak, V. V. Geothermal fields of Hengill Volcano, Iceland. J. Volcanol. Seismol. 6, 1–
14 (2012). 68. Urbina, I. et al. Shifts in the elemental composition of plants during a very severe drought. Environ. Exp. Bot.
111, 63–73 (2015). 69. Lamoureaux, S. L. & Bourdôt, G. W. A review of the ecology and management of Ranunculus acris subsp.
acris in pasture. Weed Res. 47, 461–471 (2007). 70. Rabotnov, TA and Saurina, N. J. The density and age composition of certain population of Ranunculus acris
L. and R. auricomus L. Bot. Zhurnal (1971).

30
71. Dore, WG and Raymond, L. C. Pasture studies XXIV. Viable seeds in pasture soil and manure. Sci. Agric (1942).
72. Kiviniemi, Katariina and Eriksson, O. Dispersal, recruitment and site occupancy of grassland plants in fragmented habitats. Oikos (1999).
73. Sarukhan, J. Studies on Plant Demography: Ranunculus Repens L., R. Bulbosus L. and R. Acris L.: II. Reproductive Strategies and Seed Population Dynamics. J. Ecol. 62, 921–936 (1974).
74. Tuckett, A. J. Proceedings of the 14th New Zealand Weed and Pest Control Conference. New Plymouth, New Zealand: New Zealand Plant Protection Society (Inc). (1961).
75. Yu, J., Du, H., Xu, M. & Huang, B. Metabolic Responses to Heat Stress under Elevated Atmospheric CO2 Concentration in a Cool-season Grass Species. J. … 137, 221–228 (2012).
76. Pluskal, T., Nakamura, T., Villar-Briones, A. & Yanagida, M. Metabolic profiling of the fission yeast S. pombe: quantification of compounds under different temperatures and genetic perturbation. Mol. Biosyst. 6, 182–198 (2010).
77. Anders Malmendal, Johannes Overgaard, J. G. B. J. G. S. & Niels Chr. Nielsen, Volker Loeschcke,and Martin Holmstrup. Tempreture. Am J Physiol Regul Integr Comp Physiol 2 R205–R212, 1–8 (2006).
78. Kaplan, F. et al. Exploring the Temperature-Stress Metabolome. Plant Physiol. 136, 4159–4168 (2004). 79. Diamant, S., Eliahu, N., Rosenthal, D. & Goloubinoff, P. Chemical Chaperones Regulate Molecular
Chaperones in Vitro and in Cells under Combined Salt and Heat Stresses. J. Biol. Chem. 276, 39586–39591 (2001).
80. Lipka, V. et al. Pre- and postinvasion defenses both contribute to nonhost resistance in Arabidopsis. Science 310, 1180–1183 (2005).
81. Lea, P. J., Sodek, L., Parry, M. A. J., Shewry, P. R. & Halford, N. G. Asparagine in plants. Ann. Appl. Biol. 150, 1–26 (2007).
82. Rizhsky, L. et al. When Defense Pathways Collide . The Response of Arabidopsis to a Combination of Drought and Heat Stress. Plant Physiol. 134, 1683–1696 (2004).
83. Yamakawa, H. & Hakata, M. Atlas of rice grain filling-related metabolism under high temperature: Joint analysis of metabolome and transcriptome demonstrated inhibition of starch accumulation and induction of amino acid accumulation. Plant Cell Physiol. 51, 795–809 (2010).
84. Arbona, V., Manzi, M., de Ollas, C. & Gómez-Cadenas, A. Metabolomics as a tool to investigate abiotic stress tolerance in plants. Int. J. Mol. Sci. 14, 4885–4911 (2013).
85. Guy, C., Kaplan, F., Kopka, J., Selbig, J. & Hincha, D. K. Metabolomics of temperature stress. Physiol. Plant. 132, 220–35 (2008).
86. Peñuelas, J. & Estiarte, M. Can elevated CO(2) affect secondary metabolism and ecosystem function? Trends Ecol. Evol. 13, 20–4 (1998).
87. Draths, K. M., Knop, D. R. & Frost, J. W. Shikimic Acid and Quinic Acid : Replacing Isolation from Plant Sources with Recombinant Microbial Biocatalysis. J Am Chem Soc 1603–1604 (1999).
88. Herrmann, K. M. The Shikimate Pathway: Early Steps in the Biosynthesis of Aromatic Compounds. Am. Soc. Plant Physiol. 7, 907–919 (1995).
89. Moura, J. C. M. S., Bonine, C. A. V., de Oliveira Fernandes Viana, J., Dornelas, M. C. & Mazzafera, P. Abiotic and biotic stresses and changes in the lignin content and composition in plants. J. Integr. Plant Biol. 52, 360–376 (2010).
90. Gallego-Giraldo, L., Jikumaru, Y., Kamiya, Y., Tang, Y. & Dixon, R. A. Selective lignin downregulation leads to constitutive defense response expression in alfalfa (Medicago sativa L.). New Phytol. 190, 627–639 (2011).
91. Coucheney, E., Daniell, T. J., Chenu, C. & Nunan, N. Gas chromatographic metabolic profiling: a sensitive tool for functional microbial ecology. J. Microbiol. Methods 75, 491–500 (2008).
92. Zheng, Z.-L. Carbon and nitrogen nutrient balance signaling in plants. Plant Signal. Behav. 4, 584–591 (2009). 93. Einarsson. Climate of Iceland. Quarterly Journal of the Royal Meteorological Society 25, 175–177 (1984). 94. Óskarsson, B. V., Riishuus, M. S. & Arnalds, ??lafur. Climate-dependent chemical weathering of volcanic soils
in Iceland. Geoderma 189-190, 635–651 (2012). 95. Arnalds, Ó. Soil Survey and Databases in Iceland. Eur. Soil Bur. Res. Rep. 181–186 (1999). 96. Arnalds, O. Volcanic soils of Iceland. Catena 56, 3–20 (2004). 97. Geptner, a. R., Ivanovskaya, T. a. & Pokrovskaya, E. V. Hydrothermally altered clayey sediments in the rift
zone of Iceland (influence of microbiota on accumulation of minor elements). Lithol. Miner. Resour. 41, 332–343 (2006).
98. Magnússon. Jarðabók. Annað bindi. (1708). 99. Halldórsson, B. & Sigbjörnsson, R. The Mw 6.3 Ölfus earthquake at 15:45 UTC on 29 May 2008 in South
Iceland: ICEARRAY strong-motion recordings. Soil Dyn. Earthq. Eng. 29, 1073–1083 (2009). 100.Pluskal, T., Castillo, S., Villar-Briones, A. & Oresic, M. MZmine 2: modular framework for processing,
visualizing, and analyzing mass spectrometry-based molecular profile data. BMC Bioinformatics 11, 395 (2010).
101.Anderson, M. J., Gorley, R. N. & Clarke, K. R. PERMANOVA + for PRI-MER: Guide to Software and Statistical Methods. (2008).

31
Supporting information
Table S1. Post-hoc Bonferrani tests from the one-way ANOVA. Shows the results of t-test statistics for the comparisons
of different warming levels of both species, Agrostis capillaris L. and Ranunculus acris L. regarding the PCA scores. Bold
type indicates significant effects (P < 0.05) and cursive indicated marginal effect (P < 0. 1).
Temperature B C D E F
A 0.79 0.13 0.96 <0.001 0.001
B 0.80 0.99 0.01 0.05
C 0.60 0.02 0.05
D 0.005 0.03
E 0.005
Tables S2. One-way ANOVAs of the physic-chemical and biological traits of the soils. Bold type indicates significant
effects (P < 0.05). Italics type indicates marginally significant effects (P < 0.1).
Degr. of AverageT pH H2O pH KCl RNA/DNA %C %N
Freedom F p F p F p F p F p F p
Site 1 8.70 0.01 5.42 0.03 10.8 0.001 0.56 0.46 10.5 0.001 155 0.001
Temp 5 127 0.001 6.03 0.001 2.14 0.09 0.98 0.44 7.92 0.001 4.18 0.005
Site*Temp 5 1.52 0.21 0.46 0.80 0.41 0.84 0.87 0.51 1.61 0.18 3.10 0.02
Table S3. Processing parameters of LC-MS chromatograms using MzMine 2.10100. Chromatograms presented
correspond to the total ion current (TIC).
(+H) Chromatograms (-H) Chromatograms
1
Baseline correction
Chromatogram type TIC TIC
MS level 1 1
Smoothing 10E6 10E6
Asymmetry 0.001 0.001
2 Mass detection (Exact Mass )
Noise level 4.5 × 10⁵ 4.5 × 10⁵
3
Chromatogram builder
Min time span 0.05 0.05
Min height 25000 25000
m/z tolerance 0.002 0.002
4 Smoothing
Filter width 5 5
5
Chromatogram deconvolution (Local minimum search)
Chromatographic threshold 70% 70%
Search minimum in RT range (min)
0.1 0.1
Minimum relative height 7.0% 7.0%
Minimum absolute height 30000 30000
Min ratio of peak top/edge 2 2
Peak duration range 0.0-2.0 0.0-2.0

32
6
Chromatogram alignment (join alignment)
m/z tolerance 0.001 0.001
weight for m/z 80 80
RT tolerance 0.3 0.3
Weight for RT 20 20
7
Gap filling (Peak Finder)
Intensity tolerance 20% 20%
m/z tolerance 0.001 0.001
Retention time tolerance 0.1 0.1
RT correction marked marked
8 Filtering
Minimum peaks in a row 25 25
Ions excluded from database <75
Between 0.0 and 1 min Between 28.5 and 30 min
<85
Between 0.0 and 1,1 min Between 27.0 and 30 min
Figure S1. Clustered image maps of the metabolites in the new warming site for Agrostis capillaris L. based on the data
of the PLS analysis. The red and blue colours indicate positive and negative correlations respectively.

33
Figure S2. Clustered image maps of the metabolites in the old warming site for Ranunculus acris L. based on the data of
the PLS analysis. The red and blue colours indicate positive and negative correlations respectively.
