material cost - live.icai.org
TRANSCRIPT

MATERIAL COST
LEARNING OUTCOMES
After studying this chapter, you would be able to-
State the meaning, need and importance of materials,
Discuss the procedures and documentations involved in
procuring, storing and issuing material.
Discuss the various inventory control techniques and
determination of various stock levels.
Compute Economic Order Quantity (EOQ) and apply the EOQ
to determine the optimum order quantity.
Discuss the various methods of inventory accounting and
Prepare stock ledger/ account.
Identify and explain normal and abnormal loss and its
accounting treatment.
© The Institute of Chartered Accountants of India
CHAPTER 2

2.2 COST AND MANAGEMENT ACCOUNTING
© The Institute of Chartered Accountants of India
2.1 INTRODUCTION
We have acquired a basic knowledge about the concepts, objectives, advantages,
methods and elements of cost. We shall now study each element of cost separately
beginning with material cost. The general meaning of material is all commodities/
physical objects used to make the final product. It may be direct or indirect.
(i) Direct Materials: Materials, cost of which can be directly attributable to the
end product for which it is being used, in an economically feasible way.
(ii) Indirect Materials: Those materials which are not directly attributable to a
particular final product.
Direct Materials constitute a significant part for manufacturing and production of
goods. Being an input and a significant cost element, it requires adequate
management attention. Cost control starts from here, and for this purpose it is
necessary that the principle of 3Es (Economy, Efficiency and Effectiveness) i.e.

2.3 MATERIAL COST
© The Institute of Chartered Accountants of India
economy in procurement, efficiency in handling and processing the material and
effectiveness in producing desired output as per the standard, is also applied for
this cost element. Importance of proper recording and control of material are as
follows:
(a) Quality of final product: The quality of output depends on the quality of
inputs.
(b) Price of the final product: Material constitutes a significant part of any
product and the cost of final product is directly related with cost of materials used
to produce the product.
(c) Production continuity: The production firms need to ensure that production
process runs smoothly and should not be paused for the want of materials. In order
to avoid production interruptions, an adequate level of stock of materials should
be maintained.
(d) Cost of Stock holding and stock-out: An entity has to incur stock holding
costs in the form of interest and/or opportunity cost for the fund used, stock
handling losses like evaporation, obsolescence etc. Under-stocking causes in loss
of revenue due to stock-out and breach of commitment.
(e) Wastage and other losses: While handling and processing of materials,
some wastage and loss arise. Based on the nature of material and process, these
are classified as normal and abnormal for efficient utilisation and control.
(f) Regular information about resources: Regular and updated information on
availability and utilisation of materials are necessary for the entity for timely and
informed decision making.
2.2 MATERIAL CONTROL
In the previous chapter, we have discussed the term Cost Control, which means all
activities and control mechanism which are necessary to keep the cost in adherence
to the set standards. Material, being one of the total cost elements, are also
required to be controlled so that the overall cost control objective can be fulfilled.
2.2.1 Objectives of System of Material Control
The objectives of a system of material control are as following:
(i) Minimising interruption in production process: Material Control system
ensures that no activity, particularly production, suffers from interruption for want
of materials and stores. It should be noted that this requires constant availability of

2.4 COST AND MANAGEMENT ACCOUNTING
© The Institute of Chartered Accountants of India
every item that may be needed in production process, howsoever, small its cost
may be.
(ii) Optimisation of Material Cost: The overall material costs includes price,
ordering costs and holding costs. Since all the materials and stores are acquired at
the lowest possible price considering the required quality and other relevant
factors like reliability in respect of delivery, etc., holding cost too needs to be
minimized.
(iii) Reduction in Wastages: Material Control System has an objective of
avoidance of unnecessary losses and wastages that may arise from deterioration in
quality due to defective or long storage or from obsolescence. It may be noted that
losses and wastages in the process of manufacture are a concern of the production
department.
(iv) Adequate Information: The system of material control maintains proper
records to ensure that reliable information is available for all items of materials and
stores. This not only helps in detecting losses and pilferages but also facilitates proper
production planning.
(v) Completion of order in time: Proper material management is very necessary
for fulfilling orders of the firm. This adds to the goodwill of the firm.
2.2.2 Requirements of Material Control
Material control requirements can be summarised as follows:
1. Proper co-ordination of all departments involved viz., finance, purchasing,
receiving, inspection, storage, accounting and payment.
2. Determining purchase procedure to see that purchases are made, after
making suitable enquiries, at the most favourable terms to the firm.
3. Use of standard forms for placing the order, noting receipt of goods,
authorising issue of the materials etc.
4. Preparation of budgets concerning materials, supplies and equipment to
ensure economy in purchasing and use of materials.
5. Operation of a system of internal check so that all transactions involving
materials, supplies and equipment purchases are properly approved and
automatically checked.
6. Storage of all materials and supplies in a well designated location with proper
safeguards.

2.5 MATERIAL COST
© The Institute of Chartered Accountants of India
7. Operation of a system of perpetual inventory together with continuous stock
checking so that it is possible to determine, at any time, the amount and the
value of each kind of material in stock.
8. Operation of a system of stores control and issue so that there will be delivery
of materials upon requisition to departments in the right amount at the time
they are needed.
9. Development of system of controlling accounts and subsidiary records which
exhibit summary and detailed material costs at the stage of material receipt
and consumption.
10. Regular reports of materials purchased issue from stock, inventory balances,
obsolete stock, goods returned to vendors, and spoiled or defective units are
required.
2.2.3 Elements of Material Control
Material control is a systematic control over the procurement, storage and usage
of material so as to maintain an even flow of material.
Material control involves efficient functioning of the following operations:
Purchasing of materials
Receiving of materials
Inspection of materials
Storage of materials
Issuing materials
Material Usage Control
Material Storage
Control
Material Procurement
Control
Material Control

2.6 COST AND MANAGEMENT ACCOUNTING
© The Institute of Chartered Accountants of India
Maintenance of inventory records
Stock audit
2.3 MATERIALS PROCUREMENT PROCEDURE
Material procurement procedure can be understood with help of the following
diagram. Documents required and the departments who initiate these documents
are shown sequentially.
Diagram: Material Procurement Procedure
[The name of the departments and documents shown in the diagram are for illustrative purpose only]

2.7 MATERIAL COST
© The Institute of Chartered Accountants of India
2.3.1 Bill of Materials
It is also known as Materials Specification List or Materials List. It is a detailed
list specifying the standard quantities and qualities of materials and
components required for producing a product or carrying out of any job. The
materials specification list is prepared by the product development team commonly
known as engineering or planning department in a standard form. This is shared
with other concerned departments like Marketing, Production, Store, and Cost/
Accounting department.
Format and content of a Bill of Materials vary on the basis of industrial peculiarities,
management information system (MIS) and accounting system in place.
Uses of Bill of Material
Marketing
(Purchase)
Dept.
Production Dept. Stores Dept. Cost/ Accounting
Dept.
Materials are
procured
(purchased) on
the basis of
specifications
mentioned in it.
Production is planned
according to the nature,
volume of the materials
required to be used.
Accordingly, material
requisition lists are
prepared.
It is used as a
reference
document while
issuing materials
to the
requisitioning
department.
It is used to estimate
cost and profit. Any
purchase, issue and
usage are
compared/verified
against this
document.
2.3.2 Material Requisition Note
It is also known as material requisition slip . It is a voucher of authority used to
get materials issued from store. Generally, it is prepared by the production
department and materials are withdrawn on the basis of material requisition list or
bill of materials. If no material list has been prepared, it is desirable that the task of
the preparation of material requisition notes be left to the planning department or
by the department requires the materials. The note is shared with Store and Cost/
Accounting department.
Format of a Material requisition note may vary on the basis of industrial
peculiarities, management information system (MIS) and accounting system in
place.

2.8 COST AND MANAGEMENT ACCOUNTING
© The Institute of Chartered Accountants of India
Difference between Bill of Materials and Material Requisition Note:
Bill of Materials Material Requisition Note
1. It is the document prepared by the
engineering or planning dept.
1. It is prepared by the production
or other consuming department.
2. It is a complete schedule of
component parts and raw materials
required for a particular job or work
order.
2. It is a document asking Store-
keeper to issue materials to the
consuming department.
3. It often serves the purpose of a
material requisition as it shows the
complete schedule of materials
required for a particular job i.e. it can
replace material requisition.
3. It cannot replace a bill of
materials.
4. It can be used for the purpose of
quotations.
4. It is useful in arriving historical
cost only.
5. It helps in keeping a quantitative
control on materials drawn through
material requisition.
5. It shows the material actually
drawn from stores.
2.3.3 Purchase Requisition
This is a document which authorises the purchase department to order for the
materials specified in the note. Since the materials purchased will be used by the
production departments, there should be constant co-ordination between the
purchase and production departments. A purchase requisition is a form used for
making a formal request to the purchasing department to purchase materials.
This form is usually filled up by the store keeper for regular materials and by the
departmental head for special materials (not stocked as regular items).
At the beginning a complete list of materials and stores required should be drawn
up, which should be reviewed periodically for any addition or deletion. On the basis
of standing order, once an item is included in the standard list, it becomes the
duty of the purchase department to arrange for fresh supplies before existing
stocks are exhausted. Any change in the consumption pattern should be informed
to the purchase department for necessary action from their end.
For control over buying of regular store materials, Inventory control system is to
determine stock levels to be maintained and the number of quantities to be

2.9 MATERIAL COST
© The Institute of Chartered Accountants of India
ordered. In respect of special materials, required for a special order or purpose, it
is desirable that the concerned technical department should prepare materials
specifications list specifying the quantity, size and order for the materials.
Purchase requisition note may either be originated by the stores department in
connection with regular materials or by the production planning or other technical
departments in respect of special materials.
Format of a purchase requisition note may vary on the basis of industrial
peculiarities, management information system (MIS) and accounting system in
place.
2.3.4 Inviting Quotation/Request for Proposal (RFP)
After receipt of duly authorised purchase requisition from the store department or
other departments, role of purchase department comes into play. If a concern can
afford or the size of the concern is big enough, there should be a separate purchase
department for all purchases to be made on behalf of all other departments. Such
a department is bound to become expert in the various matters to be attended to,
for examples— units of materials to be purchased and licences to be obtained,
transport, sources of supply, probable price etc.
Materials purchase department in a business house is confronted with the following
issues:
(i) What to purchase?
(ii) When to purchase?
(iii) How much to purchase?
(iv) From where to purchase.
(v) At what price to purchase.
To overcome these questions, purchase department make an enquiry into the
market for the required material. The process of gathering information about the
rate, quantity, technology, services and support etc., purchase department sends
RFP to the selected vendors in case if purchase policy allows this practice. Some
organizations follow the open and transparent purchase policy and invite
quotations from the interested vendors. This process is called Tender Notification
or Invitation of Tender.

2.10 COST AND MANAGEMENT ACCOUNTING
© The Institute of Chartered Accountants of India
2.3.5 Selection of Quotation/ Proposal
After invitation of tender from the vendors, interested vendors who are fulfilling all
the criteria mentioned in the tender notice send their price quotations/ proposals
to the purchase department. On the receipt of quotations, a comparative statement
is prepared. For selecting material suppliers, the factors which the purchase
department keeps in its mind are—price, quantity, quality offered, time of delivery,
mode of transportation, terms of payment, reputation of supplier etc. In addition to
the above listed factors purchase manager obtains other necessary information for
final selection of material suppliers.
2.3.6 Preparation and Execution of Purchase Orders
Having decided on the best quotation that should be accepted, the purchase
manager or concerned officer proceeds to issue the formal purchase order. It is a
written request to the supplier to supply specified materials at specified rates and
within a specified period. Generally, copies of purchase order are given to Store or
order indenting department, receiving department and cost accounting
department. A copy of the purchase order with relevant purchase requisitions, is
held in the file of the department to facilitate the follow-up of the delivery and also
for approval of the invoice for payment.
2.3.7 Receipt and Inspection of Materials
After execution of purchase order and advance payment (if terms of quotation so
specify), necessary arrangement is made to receive the delivery of materials After
receipt of materials along with relevant documents or/ and invoice, receiving
department (store dept.) arrange to inspect the materials for its conformity with
purchase order. After satisfactory inspection, materials are received and Goods
Received Note is issued. If some materials are not found in good condition or are
not in conformity with the purchase order are returned back to the vendor along
with a Material Returned Note.
2.3.7.1 Goods Received Note
If everything is in order and the supply is considered suitable for acceptance, the
Receiving department prepares a Receiving Report or Material Inward Note or
Goods Received Note. Generally, it is prepared in quadruplicate, the copies being
distributed to purchase department, store or order indenting department, receiving
department and accounting department.

2.11 MATERIAL COST
© The Institute of Chartered Accountants of India
2.3.7.2 Material Returned Note
Sometimes materials have to be returned to suppliers after these have been
received in the factory. Such returns may occur before or after the preparation of
the receiving report. If the return takes place before the preparation of the receiving
report, such material obviously would not be included in the report and hence not
shown in the stores ledgers. In that case, no adjustment in the account books would
be necessary. But if the material is returned after its entry in the receiving report, a
suitable document must be drawn up in support of the issue so as to exclude from
the Stores of Material Account the value of the materials returned back. This
document usually takes the form of a Material Returned Note or Material outward
return note.
2.3.8 Checking and Passing of Bills for Payment:
The invoice received from the supplier is sent to the accounts section to check
authenticity and mathematical accuracy. The quantity and price are also checked
with reference to goods received note and the purchase order respectively. The
accounts section after checking its accuracy finally certifies and passes the invoice
for payment.
2.4 VALUATION OF MATERIAL RECEIPTS
After the procurement of materials from the supplier actual material cost is
calculated. Ascertainment of cost of material purchased is called valuation of
materials receipts. Cost of material includes cost of purchase net of trade
discounts, rebates, duty draw-back, input credit availed, etc. and other costs
incurred in bringing the inventories to their present location and condition. Invoice
of material purchased from the market sometime contain items such as trade
discount, quantity discount, freight, duty, insurance, cost of containers, taxes, cash
discount etc.
Treatment of items associated with purchase of materials is tabulated as below
Sl No. Items Treatment
Discounts and Subsidy
(i) Trade
Discount
Trade discount is deducted from the purchase price
if it is not shown as deduction in the invoice.
(ii) Quantity
Discount
Like trade discount quantity discount is also shown
as deduction from the invoice. It is deducted from

2.12 COST AND MANAGEMENT ACCOUNTING
© The Institute of Chartered Accountants of India
the purchase price if not shown as deduction.
(iii) Cash Discount Cash discount is not deducted from the purchase
price. It is treated as interest and finance charges. It
is ignored.
(iv) Subsidy/
Grant/
Incentives
Any subsidy/ grant/ incentive received from the
Government or from other sources deducted from
the cost of purchase.
Duties and Taxes
(v) Road Tax/ Toll
Tax
Road tax/ Toll tax, if paid by the buyer, is included
with the cost of purchase.
(vi) Integrated
Goods and
Service Tax
(IGST)
Integrated Goods and Service Tax (IGST) is paid on
inter-state supply of goods and provision of services
and collected from the buyers. It is excluded from
the cost of purchase if credit for the same is
available. Unless mentioned specifically it should
not form part of cost of purchase.
(vii) State Goods
and Service Tax
(SGST)
State Goods and Service Tax (SGST) is paid on intra-
state supply and collected from the buyers. It is
excluded from the cost of purchase if credit for the
same is available. Unless mentioned specifically it
should not form part of cost of purchase.
(viii) Central Goods
and Service Tax
(CGST)
Central Goods and Service Tax (CGST) is paid on
manufacture and supply of goods and collected
from the buyer. It is excluded from the cost of
purchase if the input credit is available for the same.
Unless mentioned specifically CGST is not added
with the cost of purchase.
(ix) Basic Custom
Duty
Basic Custom duty is paid on import of goods from
outside India. It is added with the purchase cost.
Penalty and Charges
(x) Demurrage Demurrage is a penalty imposed by the transporter
for delay in uploading or offloading of materials. It
is an abnormal cost and not included with cost of
purchase
(xi) Detention
charges/ Fine
Detention charges/ fines imposed for non-
compliance of rule or law by any statutory authority.

2.13 MATERIAL COST
© The Institute of Chartered Accountants of India
It is an abnormal cost and not included with cost of
purchase
(xii) Penalty Penalty of any type is not included with the cost of
purchase
Other expenditures
(xiii) Insurance
charges
Insurance charges are paid for protecting goods
during transit. It is added with the cost of purchase.
(xiv) Commission or
brokerage paid.
Commission or brokerage paid is added with the
cost of purchase.
(xv) Freight inwards It is added with the cost of purchase as it is directly
attributable to procurement of material.
(xvi) Cost of
containers
Treatment of cost of containers are as follows:
Non-returnable containers: The cost of
containers is added with the cost of purchase
of materials.
Returnable Containers: If the containers are
returned and their costs are refunded, then cost
of containers should not be considered inthe
cost of purchase.
If the amount of refund on returning the
container is less than the amount paid, then,
only the short fall is added with the cost of
purchase.
(xvii) Shortage Shortage in materials are treated as follows:
Shortage due to normal reasons: Good units
absorb the cost of shortage due to normal reasons.
Losses due to breaking of bulk, evaporation, or due
to any unavoidable conditions etc. are the reasons
of normal loss.
Shortage due to abnormal reasons: Shortage
arises due to abnormal reasons such as material
mishandling, pilferage, or due to any avoidable
reasons are not absorbed by the good units. Losses
due to abnormal reasons are debited to costing
profit and loss account.

2.14 COST AND MANAGEMENT ACCOUNTING
© The Institute of Chartered Accountants of India
ILLUSTRATION 1
An invoice in respect of a consignment of chemicals A and B provides the following
information:
(`)
Chemical A: 10,000 kgs. at ` 10 per kg. 1,00,000
Chemical B: 8,000 kgs. at ` 13 per kg. 1,04,000
Basic custom duty @ 10% (Credit is not allowed) 20,400
Railway freight 3,840
Total cost 2,28,240
A shortage of 500 kgs. in chemical A and 320 kgs. in chemical B is noticed due to
normal breakages. You are required to COMPUTE the rate per kg. of each chemical,
assuming a provision of 2% for further deterioration.
SOLUTION
Working:
Computation of effective quantity of each chemical available for use
Chemical A (kg.) Chemical B (kg.)
Quantity purchased 10,000 8,000
Less: Shortage due to normal breakages 500 320
9,500 7,680
Less: Provision for deterioration 2% 190 153.6
Quantity available 9,310 7,526.4
Statement showing the computation of rate per kg. of each chemical
Chemical A (`) Chemical B (`)
Purchase price 10,000@ `10 per kg,
8,000@`13 per kg
1,00,000 1,04,000
Add: Basic Custom Duty @10% 10,000 10,400
Add: Railway freight
(in the ratio of quantity purchased i.e., 5:4)
2,133
1,707
Total cost (A) 1,12,133 1,16,107
Effective Quantity (see working) (B) 9,310 kg. 7,526.4 kg.
Rate per kg. (A ÷ B) 12.04 15.43
2.15 MATERIAL COST
© The Institute of Chartered Accountants of India
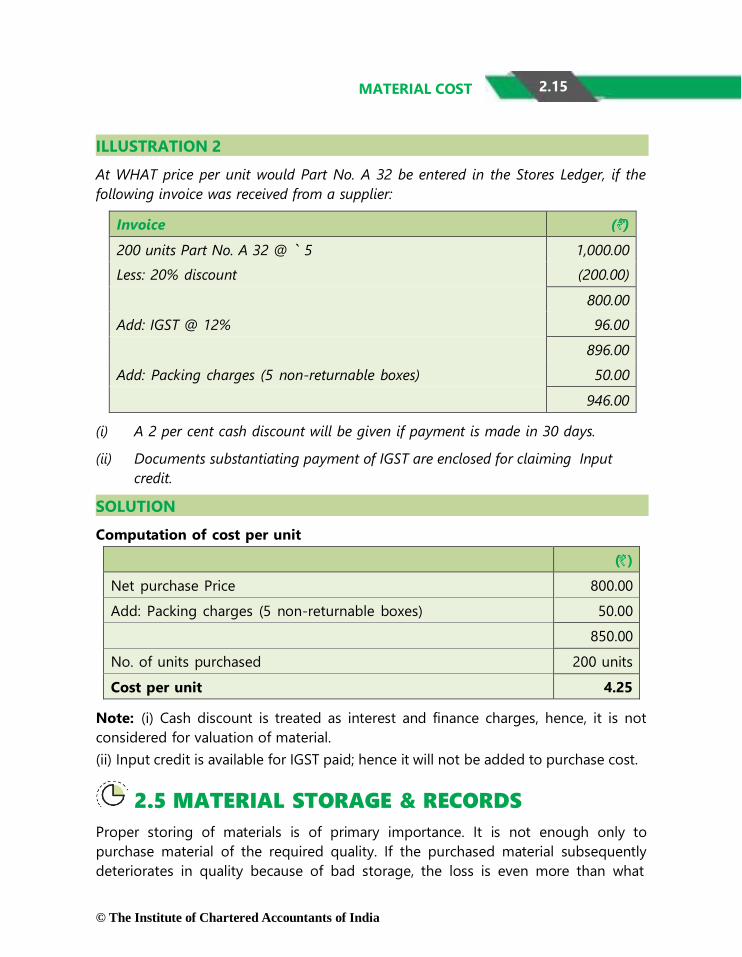
ILLUSTRATION 2
At WHAT price per unit would Part No. A 32 be entered in the Stores Ledger, if the
following invoice was received from a supplier:
Invoice (`)
200 units Part No. A 32 @ ` 5 1,000.00
Less: 20% discount (200.00)
800.00
Add: IGST @ 12% 96.00
896.00
Add: Packing charges (5 non-returnable boxes) 50.00
946.00
(i) A 2 per cent cash discount will be given if payment is made in 30 days.
(ii) Documents substantiating payment of IGST are enclosed for claiming Input
credit.
SOLUTION
Computation of cost per unit
(`)
Net purchase Price 800.00
Add: Packing charges (5 non-returnable boxes) 50.00
850.00
No. of units purchased 200 units
Cost per unit 4.25
Note: (i) Cash discount is treated as interest and finance charges, hence, it is not
considered for valuation of material.
(ii) Input credit is available for IGST paid; hence it will not be added to purchase cost.
2.5 MATERIAL STORAGE & RECORDS
Proper storing of materials is of primary importance. It is not enough only to
purchase material of the required quality. If the purchased material subsequently
deteriorates in quality because of bad storage, the loss is even more than what

2.16 COST AND MANAGEMENT ACCOUNTING
© The Institute of Chartered Accountants of India
might arise from purchase of bad quality of materials. Apart from preservation of
quality, the store-keeper also ensures safe custody of the material. It should be the
function of store-keeper that the right quantity of materials always should be
available in stock.
2.5.1 Duties of Store Keeper
These can be briefly set out as follows:
(i) General control over store: Store keeper should keep control over all
activities in Stores department. He should check the quantities as mentioned in
Goods received note and with the purchased materials forwarded by the receiving
department and to arrange for the storage in appropriate places.
(ii) Safe custody of materials: Store keeper should ensure that all the materials
are stored in a safe condition and environment required to preserve the quality of
the materials.
(iii) Maintaining records: Store keeper should maintain proper record of
quantity received, issued, balance in hand and transferred to/ from other stores.
(iv) Initiate purchase requisition: Store keeper should initiate purchase
requisitions for the replacement of stock of all regular stores items whenever the
stock level of any item of store approaches the re-order level fixed.
(v) Maintaining adequate level of stock: Store keeper should maintain
adequate level of stock at all time. He/ she should take all the necessary action so
that production could not be interrupted due to lack of stock. Further he/ she
should take immediate action for stoppage of further purchasing when the stock
level approaches the maximum limit. He also needs to reserve a particular material
for a specific job when so required.
(vi) Issue of materials: Store keeper should issue materials only against the
material requisition slip approved by the appropriate authority. He/ she should also
refer to bill of materials while issuing materials to requisitioning department.
(vii) Stock verification and reconciliation: Store keeper should verify the book
balances with the actual physical stock at frequent intervals by way of internal
control and check the any irregular or abnormal issues, pilferage, etc.
2.5.2 Store Records
The record of stores may be maintained in three forms:
Bin Cards

2.17 MATERIAL COST
© The Institute of Chartered Accountants of India
Stock Control Cards
Store Ledger
Bin Cards: It is a quantitative record of inventory which shows the quantity of
inventory available in a particular bin. Bin refers to a box/ container/ space where
materials are kept. Card is placed with each of the bin (space) to record the details
of material like receipt, issue and return. It is maintained by store department.
Stock Control Cards: It is also a quantitative record of inventory maintained by
stores department for every item of material. In other words, it is a record which
shows the overall inventory position in store. Recording includes receipt, issue,
return, in hand and order given.
Advantages and Disadvantages of Bin Cards
Advantages:
(i) There would be fewer chances of mistakes being made as entries are made
at the same time as goods received or issued by the person actually handling
the materials.
(ii) Control over stock can be more effective, as comparison of the actual quantity
in hand at any time with the book balance is possible.
(iii) Identification of the different items of materials is facilitated by reference to
the Bin Card, the bin or storage receptacle.
Disadvantages
(i) Store records are dispersed over a wide area.
(ii) The cards are liable to be smeared with dirt and grease because of proximity
to material and also because of handling materials.
(iii) People handling materials are not ordinarily suitable for the clerical work
involved in writing Bin Cards.
Advantages and Disadvantages of Stock Control Cards
Advantages:
(i) Records are kept in a more compact manner so that reference to them is
facilitated.
(ii) Records can be kept in a neat and clean way by men solely engaged in clerical
work so that a division of workers between record keeping and actual material
handling is possible.

2.18 COST AND MANAGEMENT ACCOUNTING
© The Institute of Chartered Accountants of India
(iii) As the records are at one place, it is possible to get an overall idea of the
stock position without the necessity of going round the stores.
Disadvantages:
(i) On the spot comparison of the physical stock of an item with its book balance
is not facilitated.
(ii) Physical identification of materials in stock may not be as easy as in the case
of bin cards, as the Stock Control Cards are housed in cabinets or trays.
Stores Ledger: A Stores Ledger is maintained to record both quantity and cost
of materials received, issued and those in stock. It is a subsidiary ledger to the
main cost ledger ;it is maintained by the Cost/ Accounts Department. The source
documents for posting the ledger are Goods received notes, Materials requisition
notes etc.
The first two forms are records of quantities received, issued and those in balance,
but in the third record i.e. store ledger, value of receipts, issues and closing balance
is also maintained. Usually, records of quantities i.e. Bin cards and Store Control
Cards are kept by the store keeper in store department while record of both quantity
and value is maintained by cost accounting department.
Difference between Bin Card & Stores Ledger
Bin Card Stores Ledger
It is maintained by the storekeeper in
the store.
It is maintained in cost accounting
department.
It contains only quantitative details of
material received, issued and returned
to stores.
It contains information both in quantity
and value.
Entries are made when transaction
takes place.
It is always posted after the
transaction.
Each transaction is individually
posted.
Transactions may be summarized and
then posted.
Inter-department transfers do not
appear in Bin Card.
Material transfers from one job to
another job are recorded for costing
purposes.

2.19 MATERIAL COST
© The Institute of Chartered Accountants of India
2.6 INVENTORY CONTROL
The Chartered Institute of Management Accountants (CIMA) defines Inventory
Control as “The function of ensuring that sufficient goods are retained in stock to
meet all requirements without carrying unnecessarily large stocks.”
The objective of inventory control is to make a balance between sufficient stock
and over-stock. The stock maintained should be sufficient to meet the production
requirements so that uninterrupted production flow can be maintained. Insufficient
stock not only pause the production but also cause a loss of revenue and goodwill.
On the other hand, inventory requires some funds for purchase, storage,
maintenance of materials with a risk of obsolescence, pilferage etc. The main
objective of inventory control is to maintain a trade-off between stock-out and
over-stocking. The management may employ various methods of inventory
control to have a balance. Management may adopt the following basis for inventory
control:
2.6.1 Inventory Control- By Setting Quantitative Levels
Re-order Stock Level
Re-order Quantity/ EOQ
Maximum Stock Level
Minimum Stock Level
Average Stock Level
Danger Stock Level
Buffer Stock
• When to Order
• How Much to Order
• Upto How much to stock
• Atleast How much to stock
• Stock normally kept
• Kept for emergency requirement
• To meet sudden demand
Physical Control Using Ratio
Analysis
On the basis of
Relative
Classification
By Setting
Quantitative
Levels
Inventory Control

2.20 COST AND MANAGEMENT ACCOUNTING
© The Institute of Chartered Accountants of India
(i) Re-order Stock Level (ROL): This level lies between minimum and the
maximum levels in such a way that before the material ordered is received into the
stores, there is sufficient quantity in hand to cover both normal and abnormal
consumption situations. In other words, it is the level at which fresh order should
be placed for replenishment of stock.
It is calculated as:
Maximum Consumption = The maximum rate of material consumption in
production activity
Maximum Re-order period = The maximum time to get order from supplier
to the stores
This can also be calculated alternatively as below:
Minimum Stock Level = Minimum Stock level that must be maintained
all the time.
Average Rate of Consumption = Average rate of material consumption in
production activity. It is also known as normal
consumption/ usage
Average Re-order period = Average time to get an order from supplier to
the stores. It is also known as normal period.
(Re-order period is also known as Lead time)
(ii) Re-Order Quantity: Re-order quantity is the quantity of materials for which
purchase requisition is made by the store department. While setting the quantity
to be re-ordered, consideration is given to the maintenance of minimum level of
stock, re-order level, minimum delivery time and the most important the cost.
Hence, the quantity should be where, the total of carrying cost and ordering
cost is at minimum. For this purpose, an economic order quantity should be
calculated.
Economic Order Quantity (EOQ): The size of an order for which total of ordering
and carrying cost are minimum.
ROL = Maximum Consumption × Maximum Re-order Period
ROL = Minimum Stock Level + (Average Rate of Consumption × Average Re-
order period)

2.21 MATERIAL COST
© The Institute of Chartered Accountants of India
Ordering Cost: Ordering costs are the costs which are associated with the purchase
or order of materials such as cost to invite quotations, documentation works like
preparation of purchase orders, employee cost directly attributable to the
procurement of material, transportation and inspection cost etc.
Carrying Cost: Carrying costs are the costs for holding/ carrying of inventories in
store such as the cost of fund invested in inventories, cost of storage, insurance
cost, obsolescence etc.
The Economic Order Quantity (EOQ) is calculated as below:
Annual Requirement (A)- It represents demand for raw material or Input for a year.
Cost per Order (O) - It represents cost of placing an order for purchase.
Carrying Cost (C) – It represents cost of carrying average inventory on annual basis.
Assumptions underlying E.O.Q.: The calculation of economic order of material to
be purchased is subject to the following assumptions:
(i) Ordering cost per order and carrying cost per unit per annum are known and
they are fixed.
(ii) Anticipated usage of material in units is known.
(iii) Cost per unit of the material is constant and is known as well.
(iv) The quantity of material ordered is received immediately i.e. the lead time is
zero.
EOQ = 2 ×Annual Requirement (A) ×Cost per order (O)
Carrying Costper unitper annum (C)

2.22 COST AND MANAGEMENT ACCOUNTING
© The Institute of Chartered Accountants of India
210,000 50
2 8
100
2 10,000 50 25
4
ILLUSTRATION 3
CALCULATE the Economic Order Quantity from the following information. Also state
the number of orders to be placed in a year.
Consumption of materials per annum : 10,000 kg.
Order placing cost per order : ` 50
Cost per kg. of raw materials : ` 2
Storage costs : 8% on average inventory
SOLUTION
EOQ =
A = Units consumed during year = 10,000
O = Ordering cost per order = 50
C = Inventory carrying cost per unit per annum. = 8% of ` 2
EOQ = = = 2,500 kg
No. of orders to be placed in a year = Total consumption of materials per annum
EOQ
= 10,000 kg.
2,500 kg. = 4 Orders per year
ILLUSTRATION 4
(i) COMPUTE E.O.Q. and the total variable cost for the following:
Annual Demand = 5,000 units
Unit price = ` 20.00
Order cost = ` 16.00
Storage rate = 2% per annum
Interest rate = 12% per annum
Obsolescence rate = 6% per annum
2 A O
C

2.23 MATERIAL COST
© The Institute of Chartered Accountants of India
2AO
C
2×5000×16
4 40,000
2×5,000×16
2.56
(ii) DETERMINE the total cost that would result for the items if a new price of
` 12.80 is used.
SOLUTION
(i) Carrying cost (C) = Storage rate = 2%
Interest Rate = 12%
Obsolescence Rate = 6%
Total = 20% per annum
C = 20% of ` 20 = ` 4 per unit per annum.
E.O.Q = = = = 200 units
Total cost:
Purchase price of 5,000 units @ ` 20.00 per unit = ` 1,00,000
Ordering cost = 5000
=25 orders @ ` 16 = ` 400 200
Carrying cost of average Inventory = 200
=100 units @ ` 4 = ` 400 2
Total cost ` 1,00,800
(ii) If the new price of ` 12.80 is used:
C = 20% of 12.80 = ` 2.56 per unit per annum.
E.O.Q. = = 250 units
Total cost:
Purchase price of 5,000 units @ ` 12.80 per unit = ` 64,000
Ordering cost = 5,000
= 20 orders @ ` 16 = ` 320
250
Carrying cost (of average inventory) = 250
=125 units @ ` 2.56= ` 320
2
Total variable cost ` 64,640

2.24 COST AND MANAGEMENT ACCOUNTING
© The Institute of Chartered Accountants of India
(iii) Minimum Stock Level: It is lowest level of material stock, which must be
maintained in hand at all times, so that there is no stoppage of production due to
non-availability of inventory.
It is calculated as below:
(iv) Maximum Stock Level: It is the highest level of quantity for any material
which can be held in stock at any time. Any quantity beyond this level cause extra
amount of expenditure due to engagement of fund, cost of storage, obsolescence
etc.
It can be calculated as below:
Here, Re-order Quantity may be EOQ
(v) Average Inventory Level: This is the quantity of material that is normally
held in stock over a period. It is also known as normal stock level.
It can be calculated as below:
Alternatively, it can be calculated as below:
(vi) Danger level: It is the level at which normal issues of the raw material
inventory are stopped and emergency issues are only made.
It can be calculated as below:
*Some time minimum consumption is also used.
(vii) Buffer Stock: Some quantity of stock may be kept for contingency to be
used in case of sudden order, such stock is known as buffer stock.
Danger Level = Average Consumption* × Lead time for emergency purchase
Average Stock Level = Maximum Stock Level + Minimum Stock Level
2
Minimum Stock Level = Re-order Stock Level - (Average Consumption Rate ×
Average Re-order Period)
Maximum Stock Level = Re-order Level + Re-order Quantity - (Minimum
Consumption Rate × Minimum Re-order Period)
Average Stock Level = Minimum Stock Level + 1/2 Re-order Quantity

2.25 MATERIAL COST
© The Institute of Chartered Accountants of India
All the above stock levels can be understood with the help of the following diagram:
Stock Control Chart
When the materials are purchased the level keeps rising. It may reach maximum
level if the rate of issuance is less. As the materials are consumed, the stock level
starts declining. At re-order level, reorder quantity is ordered and fresh supplies are
normally received when stocks reach minimum level. The time interval between re-
order level, when the fresh order is placed, and the time of actual receipt of
materials is known as lead time.
ILLUSTRATION 5
Two components, A and B are used as follows:
Normal usage 50 per week each
Maximum usage 75 per week each
Minimum usage 25 per week each
Re-order quantity A: 300; B: 500
Re-order period A: 4 to 6 weeks
B: 2 to 4 weeks
CALCULATE for each component (a) Re-ordering level, (b) Minimum level, (c)
Maximum level, (d) Average stock level.
Quantity

2.26 COST AND MANAGEMENT ACCOUNTING
© The Institute of Chartered Accountants of India
SOLUTION
(a) Re-ordering level:
Maximum usage per week × Maximum delivery period.
Re-ordering level for component A = 75 units 6 weeks = 450 units
Re-ordering level for component B = 75 units 4 weeks = 300 units
(b) Minimum level:
Re-order level – (Normal usage × Average period)
Minimum level for component A = 450 units – (50 units × 5 weeks) = 200 units
Minimum level for component B = 300 units – (50 units × 3 weeks) = 150 units
(c) Maximum level:
Re-order level + Re-order quantity – (Min. usage × Minimum period)
Maximum level for component A = (450 units + 300 units) – (25 units × 4
weeks) = 650 units
Maximum level for component B = (300 units + 500 units) – (25 units × 2
weeks) = 750 units
(d) Average stock level:
½ (Minimum + Maximum) stock level
Average stock level for component A = ½ (200 units + 650 units) =425 units.
Average stock level for component B = ½ (150 units + 750 units) =450 units.
ILLUSTRATION 6
From the details given below, CALCULATE:
(i) Re-ordering level
(ii) Maximum level
(iii) Minimum level
(iv) Danger level.
Re-ordering quantity is to be calculated on the basis of following information:
Cost of placing a purchase order is ` 20
Number of units to be purchased during the year is 5,000

2.27 MATERIAL COST
© The Institute of Chartered Accountants of India
Purchase price per unit inclusive of transportation cost is ` 50
Annual cost of storage per units is ` 5.
Details of lead time : Average- 10 days, Maximum- 15 days, Minimum- 5 days.
For emergency purchases- 4 days.
Rate of consumption : Average: 15 units per day,
Maximum: 20 units per day.
SOLUTION
Basic Data:
A (Number of units to be purchased annually) = 5,000 units
O (Ordering cost per order) = ` 20
C (Annual cost of storage per unit) = ` 5
Purchase price per unit inclusive of transportation cost = ` 50.
Computations:
(i) Re-ordering level = Maximum usage per period × Maximum lead time
(ROL) = 20 units per day × 15 days = 300 units
(ii) Maximum level = ROL + ROQ – [Min. rate of consumption × Min.
(Refer to working notes1 and 2) lead time]
= 300 units + 200 units – [10 units per day × 5 days]
= 450 units
(iii) Minimum level = ROL – Average rate of consumption × Average re-
order-period
= 300 units – (15 units per day × 10 days) =150 units
(iv) Danger level = Average consumption × Lead time for emergency
purchases
= 15 units per day × 4 days = 60 units

2.28 COST AND MANAGEMENT ACCOUNTING
© The Institute of Chartered Accountants of India
Working Notes:
1. Minimum rate of consumption per day
Minimum rate of +
Maximum rate of
Av. rate of =
consumption consumption
consumption 2
15 units per day = X units/day 20 units per day
2 or X = 10 units per day.
2. Re-order Quantity (ROQ) or Economic Order Quantity (EOQ) =
200 units
2.6.2 Inventory Stock- Out
Stock out is said to be occurred when an inventory item could not be supplied
due to insufficient stock in the store. The stock- out situation costs to the entity
not only in financial terms but in non-financial terms also. Due to stock out an entity
not only loses overheads costs and profit but reputation (goodwill) also due to non-
fulfilment of commitment. Though it may not be a monetary loss in short term but
in long term it could be a reason for financial loss.
While deciding on the level of inventory, a trade-off between the stock out cost
and carrying cost is made so that overall inventory cost can be minimized.
ILLUSTRATION 7
M/s Tyrotubes trades in four wheeler tyres and tubes. It stocks sufficient quantity of
tyres of almost every vehicle. In year end 2019-20, the report of sales manager
revealed that M/s Tyrotubes experienced stock-out of tyres.
The stock-out data is as follows:
Stock-out of Tyres No. of times of Stock Out
100 2
80 5
50 10
20 20
10 30
0 33
2×5,000 units×` 20
5

2.29 MATERIAL COST
© The Institute of Chartered Accountants of India
M/s Tyrotubes loses ` 150 per unit due to stock-out and spends ` 50 per unit on
carrying of inventory.
DETERMINE optimum safest stock level.
SOLUTION
Computation of Stock-out and Inventory carrying cost
Safety
Stock
Level
(units)
(1)
Stock-
out
(units)
(2)
Probability
(3)
Stock-
out cost
(`)
(4) = (2)
x ` 150
Expected
stock-out
cost (`)
(5)=(3)x(4)
Inventory
carrying cost
(`)
(6) =(1)x` 50
Total
cost (`)
(7) =
(5)+(6)
100 0 0.00 0 0 5,000 5,000
80 20 0.02 3,000 60 4,000 4,060
50 50 0.02 7,500 150
30 0.05 4,500 225
12,000 375 2,500 2,875
20 80 0.02 12,000 240
60 0.05 9,000 450
30 0.10 4,500 450
25,500 1,140 1,000 2,140
10 90 0.02 13,500 270
70 0.05 10,500 525
40 0.10 6,000 600
10 0.20 1,500 300
31,500 1,695 500 2,195
0 100 0.02 15,000 300 2,700
80 0.05 12,000 600
50 0.10 7,500 750
20 0.20 3,000 600
10 0.30 1,500 450
39,000 2,700 0 2,700
At safety stock level of 20 units, total cost is least i.e. ` 2,140.

2.30 COST AND MANAGEMENT ACCOUNTING
© The Institute of Chartered Accountants of India
Working Note:
Computation of Probability of Stock-out
Stock-out
(units)
100 80 50 20 10 0 Total
Nos. of
times
2 5 10 20 30 33 100
Probability 0.02 0.05 0.10 0.20 0.30 0.33 1.00
Explanation:
Stock-out means the demand of an item that could not be fulfilled because of
insufficient stock level.
Safety stock is the level of stock of any item which is maintained in excess of
lead time consumption. It is kept as cushion against any unexpected demand for
that item.
Safety stock
level
Impact
100 units Any unexpected demand up-to 100 units can be met.
80 units Stock out will only arise if unexpected demand will be for 100
units. In this case 20 units will remain unsatisfied. The probability
of any unexpected demand for 100 units is 0.02.
50 units Any unexpected demand beyond 50 units will be remain
unsatisfied. If unexpected demand for 100 units arises
(probability is 0.02) 50 units will be unsatisfied. Similarly, if
unexpected demand for 80 units arises (probability is 0.05), 30
units will be unsatisfied.
20 units Any unexpected demand beyond 20 units will be remain
unsatisfied. If unexpected demand for 100 units arises
(probability is 0.02), 80 units will remain unsatisfied. If
unexpected demand for 80 units arises (probability is 0.05), 60
units will remain unsatisfied. Similarly, when unexpected
demand for 50 units arises (probability is 0.10), 30 units will
remain unsatisfied.
10 units Any unexpected demand beyond 10 units will be remain
unsatisfied. If unexpected demand for 100 units arises
(probability is 0.02), 90 units will remain unsatisfied. If
2.31 MATERIAL COST
© The Institute of Chartered Accountants of India
unexpected demand for 80 units arises (probability is 0.05), 70
units will remain unsatisfied. If unexpected demand for 50 units
arises (probability is 0.10), 40 units will remain unsatisfied.
Similarly, when unexpected demand for 20 units arises
(probability is 0.20), 10 units will remain unsatisfied.
0 unit When no safety stock level is maintained, any unexpected
demand cannot be satisfied. If unexpected demand for 100 units
arises (probability is 0.02), 100 units will remain unsatisfied. If
unexpected demand for 80 units arises (probability is 0.05), 80
units will remain unsatisfied. If unexpected demand for 50 units
arises (probability is 0.10), 50 units will remain unsatisfied. If
unexpected demand for 20 units arises (probability is 0.20), 20
units will remain unsatisfied. Similarly, unexpected demand for
10 units (probability is 0.30), 10 units will remain unsatisfied.
2.6.3 Just in Time (JIT) Inventory Management
JIT is a system of inventory management with an approach to have a zero
inventories in stores. According to this approach material should only be
purchased when it is actually required for production.
JIT is based on two principles
(i) Produce goods only when it is required and
(ii) the products should be delivered to customers at the time only when they want.
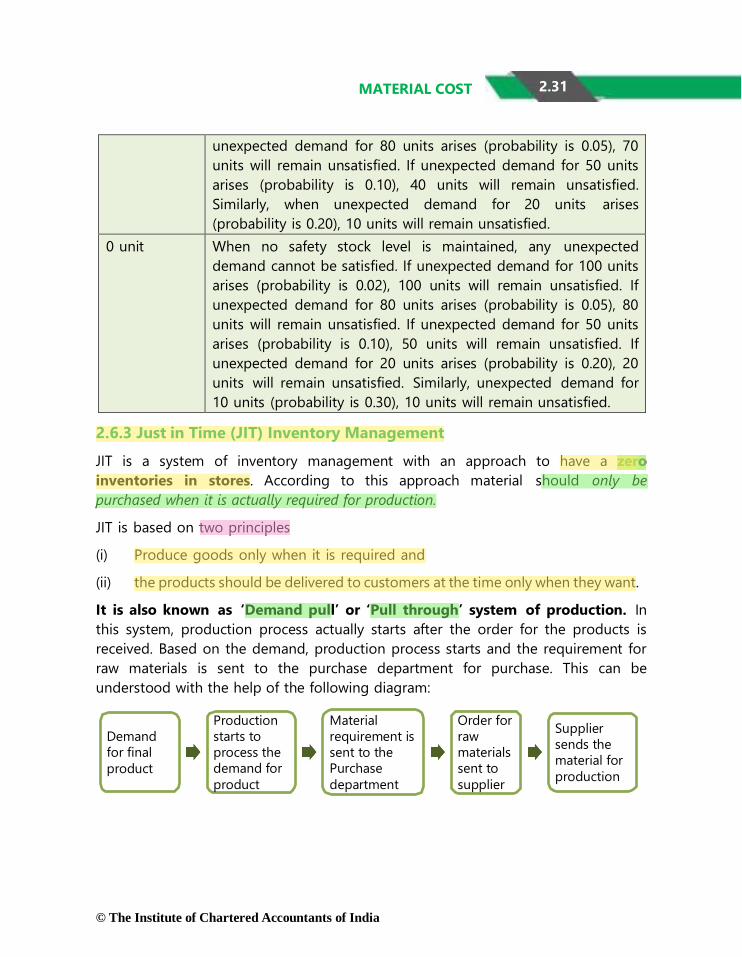
It is also known as ‘Demand pull’ or ‘Pull through’ system of production. In
this system, production process actually starts after the order for the products is
received. Based on the demand, production process starts and the requirement for
raw materials is sent to the purchase department for purchase. This can be
understood with the help of the following diagram:
Demand
for final
product
Production
starts to
process the
demand for
product
Material
requirement is
sent to the
Purchase
department
Order for
raw
materials
sent to
supplier
Supplier
sends the
material for
production

2.32 COST AND MANAGEMENT ACCOUNTING
© The Institute of Chartered Accountants of India
2.6.4 Inventory Control- On the basis of Relative Classification
ABC Analysis
Fast, Slow and Non Moving (FSN)
Vital, Essential and Desirable (VED)
High, Medium and Low (HML)
• On the basis of value and frequency of inventory
• On the basis of inventory turnover
• On the basis of importance of inventory
• On the basis of price of an item of inventory
(1) ABC Analysis: This system exercises discriminating control over different
items of inventory on the basis of the investment involved. Usually the items are
classified into three categories according to their relative importance, namely, their
value and frequency of replenishment during a period.
(i) ‘A’ Category: This category of items consists of only a small percentage i.e.,
about 10% of the total items handled by the stores but require heavy investment
about 70% of inventory value, because of their high prices or heavy requirement
or both. Items under this category can be controlled effectively by using a regular
system which ensures neither over-stocking nor shortage of materials for
production. Such a system plans its total material requirements by making budgets.
The stocks of materials are controlled by fixing certain levels like maximum level,
minimum level and re-order level.
(ii) ‘B’ Category: This category of items is relatively less important; they may be
20% of the total items of material handled by stores. The percentage of investment
required is about 20% of the total investment in inventories. In the case of these
items, as the sum involved is moderate, the same degree of control as applied in
‘A’ category of items is not warranted. The orders for the items, belonging to this
category may be placed after reviewing their situation periodically.
(iii) ‘C’ Category: This category of items does not require much investment; it
may be about 10% of total inventory value but they are nearly 70% of the total items
handled by store. For these category of items, there is no need of exercising con-
stant control. Orders for items in this group may be placed either after six months
or once in a year, after ascertaining consumption requirements. In this case the
objective is to economies on ordering and handling costs.

2.33 MATERIAL COST
© The Institute of Chartered Accountants of India
ILLUSTRATION 8
From the following details, DRAW a plan of ABC selective control:
Item Units Unit cost (`)
1 7,000 5.00
2 24,000 3.00
3 1,500 10.00
4 600 22.00
5 38,000 1.50
6 40,000 0.50
7 60,000 0.20
8 3,000 3.50
9 300 8.00
10 29,000 0.40
11 11,500 7.10
12 4,100 6.20
Co
st

2.34 COST AND MANAGEMENT ACCOUNTING
© The Institute of Chartered Accountants of India
SOLUTION
Statement of Total Cost and Ranking
Item Units % of Total
units
Unit cost
(`)
Total
cost (`)
% of Total
cost
Ranking
1 7,000 3.1963 5.00 35,000 9.8378 4
2 24,000 10.9589 3.00 72,000 20.2378 2
3 1,500 0.6849 10.00 15,000 4.2162 7
4 600 0.2740 22.00 13,200 3.7103 8
5 38,000 17.3516 1.50 57,000 16.0216 3
6 40,000 18.2648 0.50 20,000 5.6216 6
7 60,000 27.3973 0.20 12,000 3.3730 9
8 3,000 1.3699 3.50 10,500 2.9513 11
9 300 0.1370 8.00 2,400 0.6746 12
10 29,000 13.2420 0.40 11,600 3.2605 10
11 11,500 5.2512 7.10 81,650 22.9502 1
12 4,100 1.8721 6.20 25,420 7.1451 5
2,19,000 100 3,55,770 100
Basis for selective control (Assumed)
` 50,000 & above -- ‘A’ items
` 15,000 to 50000 -- ‘B’ items
Below ` 15,000 -- ‘C’ items
On this basis, a plan of A B C selective control is given below:
Ranking Item
Nos.
% of Total
units
Cost (`) % of Total
Cost
Category
1 11 5.2512 81,650 22.9502
2 2 10.9589 72,000 20.2378
3 5 17.3516 57,000 16.0216
Total 3 33.5617 2,10,650 59.2096 A
4 1 3.1963 35,000 9.8378
5 12 1.8721 25,420 7.1451
6 6 18.2648 20,000 5.6216

2.35 MATERIAL COST
© The Institute of Chartered Accountants of India
7 3 0.6849 15,000 4.2162
Total 4 24.0181 95,420 26.8207 B
8 4 0.2740 13,200 3.7103
9 7 27.3973 12,000 3.3730
10 10 13.2420 11,600 3.2605
11 8 1.3699 10,500 2.9513
12 9 0.1370 2,400 0.6746
Total 5 42.4202 49,700 13.9697 C
Grand Total 12 100 3,55,770 100
(1) Advantages of ABC analysis: The advantages of ABC analysis are the
following:
(i) Continuity in production: It ensures that, without there being any danger
of interruption of production for want of materials or stores, minimum
investment will be made in inventories of stocks of materials or stocks
to be carried.
(ii) Lower cost: The cost of placing orders, receiving goods and maintaining
stocks is minimised specially if the system is coupled with the
determination of proper economic order quantities.
(iii) Less attention required: Management time is saved since attention need
to be paid only to some of the items rather than all the items, as would
be the case if the ABC system was not in operation.
(iv) Systematic working: With the introduction of the ABC system, much of
the work connected with purchases can be systematized on a routine
basis, to be handled by subordinate staff.
ILLUSTRATION 9
A factory uses 4,000 varieties of inventory. In terms of inventory holding and
inventory usage, the following information is compiled:
No. of varieties of
inventory
% % value of
inventory holding
(average)
% of inventory
usage (in end-
product)
3,875 96.875 20 5
110 2.750 30 10

2.36 COST AND MANAGEMENT ACCOUNTING
© The Institute of Chartered Accountants of India
15 0.375 50 85
4,000 100.00 100 100
CLASSIFY the items of inventory as per ABC analysis with reasons.
SOLUTION
Classification of the items of inventory as per ABC analysis
1. 15 number of varieties of inventory items should be classified as ‘A’ category
items because of the following reasons:
(i) Constitute 0.375% of total number of varieties of inventory handled by
stores of factory, which is minimum as per given classification in the
table.
(ii) 50% of total use value of inventory holding (average), which is
maximum, according to the given table.
(iii) Highest in consumption, about 85% of inventory usage (in end-
product).
2. 110 number of varieties of inventory items should be classified as ‘B’ category
items because of the following reasons:
(i) Constitute 2.750% of the total number of varieties of inventory items
handled by stores of factory.
(ii) Requires moderate investment of about 30% of total use value of
inventory holding (average).
(iii) Moderate in consumption, about 10% of inventory usage (in end–
product).
3. 3,875 number of varieties of inventory items should be classified as ‘C’
category items because of the following reasons:
(i) Constitute 96.875% of total varieties of inventory items handled by
stores of factory.
(ii) Requires about 20% of total use value of inventory holding (average).
(iii) Minimum inventory consumption, i.e. about 5% of inventory usage (in
end-product).
(2) Fast Moving, Slow Moving and Non Moving (FSN) Inventory: It is also
known as FNS (Fast, Normal and Slow moving) classification of inventory analysis.
2.37 MATERIAL COST
© The Institute of Chartered Accountants of India
Under this system, inventories are controlled by classifying them on the basis of
frequency of usage. The classification of items into these three categories depends
on the nature and managerial discretion. A threshold range on the basis of
inventory turnover is decided and classified accordingly.
(i) Fast Moving- This category of items are placed nearer to store issue point
and the stock is reviewed frequently for making of fresh orders.
(ii) Slow Moving- This category of items are stored little far and stock is
reviewed periodically for any obsolescence. and may be shifted to Non-moving
category.
(iii) Non Moving- This category of items are kept for disposal. This category of items
is reported to the management and an appropriate provision for loss may be created.
Some of the reasons for slow moving and non-moving inventories are stated
below:
(i) Failure of production management to communicate the updated requirement
to the stores management
(ii) Technological upgradation in terms of new machine requiring new kind of
material or existing material becoming obsolete.
(iii) Lack of periodic review of inventories.
By careful observation, timely identification and adoption of inventory
management techniques such as maintenance of minimum level or just in time
approach, one can manage slow moving and non-moving inventories. We may
calculate inventory turnover ratio and present the reports of comparison of actual
and standards with variations, if any to the management.
(3) Vital, Essential and Desirable (VED): Under this system of inventory analysis,
inventories are classified on the basis of its criticality for the production
function and final product. Generally, this classification is done for spare parts
which are used for production.
(i) Vital- Items are classified as vital when its unavailability can interrupt the
production process and cause a production loss. Items under this category are
strictly controlled by setting re-order level.
(ii) Essential- Items under this category are essential but not vital. The
unavailability may cause sub standardisation and loss of efficiency in production
process. Items under this category are reviewed periodically and get the second
priority.

2.38 COST AND MANAGEMENT ACCOUNTING
© The Institute of Chartered Accountants of India
(iii) Desirable- Items under this category are optional in nature, unavailability
does not cause any production or efficiency loss.
For instance, in hospital administration, stock of medicines and essential chemicals
are categorized as VED or FSN inventory. In case of life saving, rare and critical
drugs, they are being categorized as vital inventory. They are the ones whose
unavailability can interrupt smooth service. Those inventories which are optional or
substitutes, not leading to loss in efficiency would be categorized as desirable
inventories. FNS categorization helps the store keepers in hospitals to keep a check
on medicines whose expiry date is close and needs to be disposed off at the earliest.
The quantity of slow moving drugs are maintained accordingly.
(4) High Cost, Medium Cost, Low Cost (HML) Inventory: Under this system,
inventory is classified on the basis of the cost of an individual item, unlike ABC
analysis where inventories are classified on the basis of overall value of inventory.
A range of cost is used to classify the inventory items into the three categories.
High Cost inventories are given more priority for control, whereas Medium cost and
Low cost items are comparatively given lesser priority.
2.6.5 Using Ratio Analysis
(i) Input- Output Ratio: Inventory control can also be exercised by the use of
input- output ratio analysis. Input- output ratio is the ratio of the quantity of
input of material to production and the standard material content of the
actual output.
This type of ratio analysis enables comparison of actual consumption and standard
consumption, thus indicating whether the usage of material is favourable or
adverse.
(ii) Inventory Turnover Ratio: Computation of inventory turnover ratios for
different items of material and comparison of the turnover rates provides a useful
guidance for measuring inventory performance. High inventory turnover ratio
indicates that the material in the question is a fast moving one. A low turnover ratio
indicates over-investment and locking up of the working capital in inventories.
Inventory turnover ratio may be calculated by using the following formulae: -
Inventory Turnover Ratio = Cost of materials consumed during the period
Cost of average stock held duirng the period
Average stock = 1/2 (opening stock + closing stock)

2.39 MATERIAL COST
© The Institute of Chartered Accountants of India
By comparing the number of days in the case of two different materials, it is
possible to know which is fast moving and which is slow moving. On this basis,
attempt should be made to reduce the amount of capital locked up, and prevent
over-stocking of the slow moving items.
ILLUSTRATION 10
The following data are available in respect of material X for the year ended 31st
March, 2020.
(`)
Opening stock 90,000
Purchases during the year 2,70,000
Closing stock 1,10,000
CALCULATE:
(i) Inventory turnover ratio, and
(ii) The number of days for which the average inventory is held.
SOLUTION
Inventory turnover ratio
(Refer to working note) = Cost of stock of raw material consumed
Average stock of raw material
= `2,50,000
= 2.5
`1,00,000
Average number of days for which the average inventory is held
= 365
=
Inventory turnover ratio
365 days
2.5
Working Note:
= 146 days
(`)
Opening stock of raw material 90,000
Average no. of days of Inventory holding = 365days /12months
Inventory TurnoverRatio

2.40 COST AND MANAGEMENT ACCOUNTING
© The Institute of Chartered Accountants of India
Add: Material purchases during the year 2,70,000
Less: Closing stock of raw material 1,10,000
Cost of stock of raw material consumed 2,50,000
ILLUSTRATION 11
From the following data for the year ended 31st March, 2020, CALCULATE the
inventory turnover ratio of the two items and put forward your comments on them.
Material A (`) Material B (`)
Opening stock 1.04.2019 10,000 9,000
Purchase during the year 52,000 27,000
Closing stock 31.03.2020 6,000 11,000
SOLUTION
First of all, it is necessary to find out the material consumed:
Cost of materials consumed Material A
(`)
Material B
(`)
Opening stock 10,000 9,000
Add: Purchases 52,000 27,000
62,000 36,000
Less: Closing stock 6,000 11,000
Materials consumed 56,000 25,000
Average inventory: (Opening Stock + Closing Stock)
2
8,000 10,000
Inventory Turnover ratio: (Consumption Average
inventory)
7 times 2.5 times
Inventory Turnover (Number of Days in a year/IT ratio) 52 days 146 days
Comments: Material A is moving faster than Material B.
2.6.6 Physical Control
(i) Two Bin System: Under this system, each bin is divided into two parts –
(I) smaller part to stock the quantity equal to the minimum stock or even the re-
ordering level, and

2.41 MATERIAL COST
© The Institute of Chartered Accountants of India
(II) the other part to keep the remaining quantity.
Issues are made out of the larger part; but as soon as it becomes necessary to use
quantity out of the smaller part of the bin, fresh order is placed. “Two Bin System”
is supplemental to the record of respective quantities on the bin card and the stores
ledger card.
(ii) Establishment of system of budgets: To control investment in the
inventories, it is necessary to know in advance about the inventories requirement
during a specific period (usually a year). The exact quantity of various types of
inventories and the time when they would be required can be known by studying
carefully production plans and production schedules. Based on this, inventories
requirement budget can be prepared. Such a budget will discourage the
unnecessary investment in inventories.
(iii) Perpetual inventory records and continuous stock verification:
Perpetual inventory represents a system of records maintained by the stores
department. It, in fact, comprises of: (i) Bin Cards, and (ii) Stores Ledger.
The success of perpetual inventory depends upon the following:
(a) The Stores Ledgershowing quantities and amount of each item.
(b) Stock Control cards (or Bin Cards).
(c) Reconciling the quantity balances shown by (a) & (b) above.
(d) Checking the physical balances of a number of items every day systematically
and by rotation.
(e) Explaining promptly the causes of discrepancies, if any, between physical
balances and the book figures.
(f) Making corrective entries wherever required after step (e) and
(g) Removing the causes of the discrepancies referred to in step (e)
Advantages of perpetual inventory: The main advantages of perpetual inventory
are as follows:
(1) Physical stocks can be counted and book balances adjusted as and when
desired without waiting for the entire stock-taking to be done.
(2) Quick compilation of Profit and Loss Account (for interim period) due to
prompt availability of stock figures.
2.42 COST AND MANAGEMENT ACCOUNTING
© The Institute of Chartered Accountants of India
(3) Discrepancies are easily located and thus corrective action can be promptly
taken to avoid their recurrence.
(4) A systematic review of the perpetual inventory reveals the existence of
surplus, dormant, obsolete and slow-moving materials, so that remedial
measures may be taken in time.
(5) Fixation of the various stock levels and checking of actual balances in hand
with these levels assist the store keeper in maintaining stocks within limits
and in initiating purchase requisitions for correct quantity at the appropriate
time.
(iv) Continuous Stock Verification: The checking of physical inventory is an
essential feature of every sound system of material control. The system of
continuous stock-taking consists of physical verification of items of inventory.
The stock verification may be done by internal audit department but are
independent of the store and production staff. Stock verification is done at
appropriate interval of time without prior notice. The element of surprise is
essential for effective control of the system.
Disadvantages of Annual/ Periodic Stock Taking: Annual stock-taking, however,
has certain inherent shortcomings which tend to detract from the usefulness of
such physical verification. For instance, since all the items have to be covered in a
given number of days, either the production department has to be shut down
during those days to enable thorough checking of stock or else the verification
must be of limited character.
On the contrary, continuous stock taking is holding more advantages. Some of
them are discussed below:
Advantages of continuous stock-taking:
1. Closure of normal functioning is not necessary.
2. Stock discrepancies are likely to be brought to the notice and corrected much
earlier than under the annual stock-taking system.
3. The system generally has a sobering influence on the stores staff because of
the element of surprise present therein.
4. The movement of stores items can be watched more closely by the stores
auditor so that chances of obsolescence buying are reduced.
5. Final Accounts can be ready quickly. Interim accounts are possible quite
conveniently.
2.43 MATERIAL COST
© The Institute of Chartered Accountants of India
2.7 MATERIAL ISSUE PROCEDURE
Issue of material must not be made except under properly authorised requisition
slip. Usually, it is the foreman of a department who has the authority to draw
materials from the store. Issue of material must be made on the basis of first in first
out, that is, out of the earliest lot in hand. If care is not exercised in this regard,
quality of earliest lot of material may deteriorate for having been kept for a long
period.
(i) Issue against Material Requisition Note: It is the voucher of the authority
as regards to the issue of materials for use in the factory or in any of its
departments. After receipt of material requisition slip, store keeper ensures that
requisition is properly authorized and requisitioned quantity is within the quantity
specified in bill of materials. After satisfied with the documents, store keeper issue
materials and keeps one copy of the MRN to maintain the necessary records.
(ii) Transfer of Material: The surplus material arising on a job or other units
of production may sometime be unsuitable for transfer to store because of its bulk,
heavy weight, brittleness or some otherreason. It may, however, be possible to find
some alternative use for such materials by transferring them to some other job
instead of returning them to the store.
It must be stressed that generally transfer of material from one job to another is
irregular, if not improper; in so far, it is not conducive to correct allocation and
control of material, cost of jobs or other units of production. It is only in the circum-
stances envisaged above, that such direct transfer should be made. At the time of
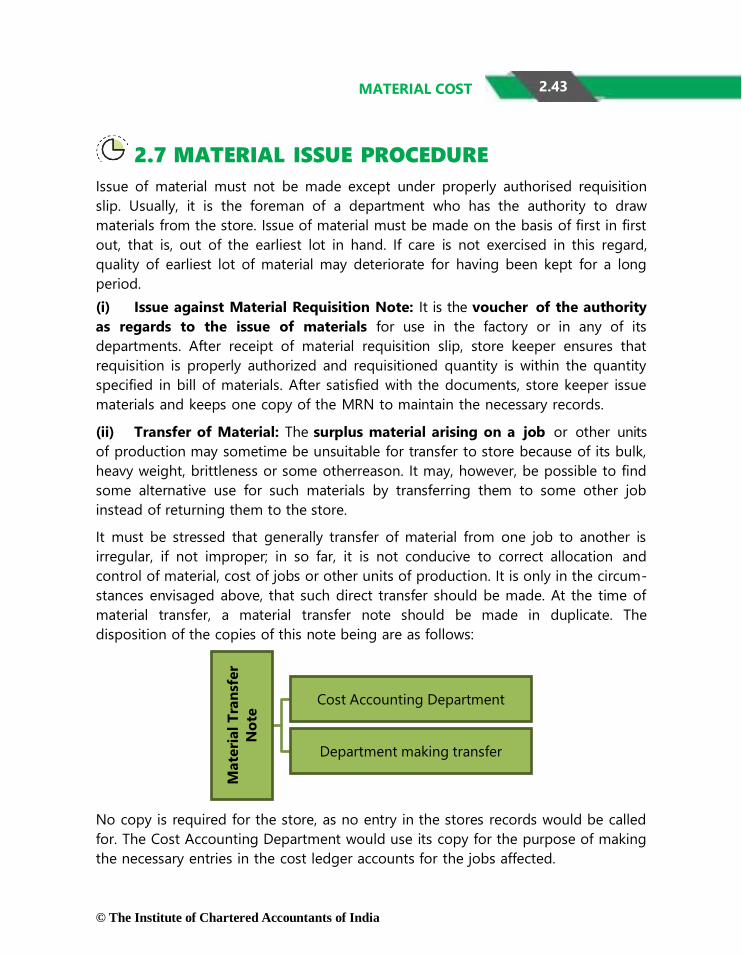
material transfer, a material transfer note should be made in duplicate. The
disposition of the copies of this note being are as follows:
No copy is required for the store, as no entry in the stores records would be called
for. The Cost Accounting Department would use its copy for the purpose of making
the necessary entries in the cost ledger accounts for the jobs affected.
Department making transfer
Cost Accounting Department
Mate
rial
Tra
nsf
er
No
te

2.44 COST AND MANAGEMENT ACCOUNTING
© The Institute of Chartered Accountants of India
Format of a material requisition note may vary on the basis of industrial
peculiarities, management information system (MIS) and accounting system in
place.
(iii) Return of Material: Sometimes, it is not possible before hand to make any
precise estimate of the material requirements or units of production. Besides, at
times, due to some technical issues or other difficulties, it is not practicable to
measure the exact quantity of material required by a department. In either case,
material may have to be issued from stores in bulk, often in excess of the actual
quantity required. Where such a condition exists, it is of the utmost importance
from the point of view of materials control that any surplus material left over on
the completion of a job should be promptly hand over to the storekeeper for
safe and proper custody.
Unless this is done, the surplus material may be misappropriated or misapplied to
some purpose, other than that for which it was intended. The material cost of the
job against which the excess material was originally drawn in that case, would be
overstated, unless the job is given credit for the surplus arising thereon.
The surplus material, when it is returned to the storeroom, should be accompanied
by a document known as a Shop Credit Note or alternatively as a Stores Debit
Note. This document should be made out; by the department returning the surplus
material and it should be in triplicate to be used as follows:
Format of a shop credit note may vary on the basis of industrial peculiarities,
management information system (MIS) and accounting system in place.
2.8 VALUATION OF MATERIAL ISSUES
Materials issued from stores should be priced at the value at which they are carried
in stock. But there can be a situation where the material may have been purchased
at different times and at different prices with varying discounts, taxes etc. Because
of this the problem arises as to how the material issues to production are to be
valued. There are several methods for tackling this situation. The cost accountant
Department Returnign it
Cost Accounting Department Shop Credit Note
Store Room

2.45 MATERIAL COST
© The Institute of Chartered Accountants of India
should select the proper method based on following factors:
1. The frequency of purchases, price fluctuations and its range.
2. The frequency of issue of materials, relative quantity etc.
3. Nature of cost accounting system.
4. The nature of business and the type of production process.
5. Management policy relating to the valuation of closing stock.
Several methods of pricing material issues have been evolved in an attempt to
satisfactorily answer the problem. These methods may be grouped and explained
as follows:
2.8.1 Cost Price Methods
(i) Specific Price Method: This method is useful, especially when materials are
purchased for a specific job or work order, as such materials are issued
subsequently to that specific job or work order at the price at which they were
purchased.
To use this method, it is necessary to store each lot of material separately and
maintain its separate account.
Advantages and Disadvantages
Advantages Disadvantages
The cost of materials issued for
production purposes to specific jobs
represent actual and correct costs.
This method is difficult to operate,
specially when purchases and
issues are numerous.
This method is best suited for non-
standard and specific products.
(ii) First-in First-out (FIFO) method: It is a method of pricing the issues of
materials, in the order in which they are purchased. In other words, the materials
are issued in the order in which they arrive in the store or the items longest in stock
are issued first. Thus each issue of material only recovers the purchase price which
does not reflect the current market price.
This method is considered suitable in times of falling price because the material
cost charged to production will be high while the replacement cost of materials will
be low. But, in the case of rising prices, if this method is adopted, the charge to
production will be low as compared to the replacement cost of materials.

2.46 COST AND MANAGEMENT ACCOUNTING
© The Institute of Chartered Accountants of India
Consequently, it would be difficult to purchase the same volume of material (as in
the current period) in future without having additional capital resources.
Advantages and disadvantages
Advantages Disadvantages
It is simple to understand and easy
to operate.
If the prices fluctuate frequently, this
method may lead to clerical error.
Material cost charged to production
represents actual cost with which
the cost of production should have
been charged.
Since each issue of material to
production is related to a specific
purchase price, the costs charged to
the same job are likely to show a
variation from period to period.
In the case of falling prices, the use
of this method gives better results.
In the case of rising prices, the real
profits of the concern being low,
while the profits in the books will
appear high. This may lead to
inability of the firm to meet the
materials purchase demand at the
current market price.
Closing stock of material will be
represented very closely at current
market price.
The application of FIFO method is illustrated below:
Material Received and Issued
Lot
No.
Date Quantity
Kg.
Lot
No.
Rate
(`)
Amount
(`)
1. July 3 600 1.00 600.00
2. July 13 800 1.20 960.00
3. July 23 600 0.90 540.00
4. August 5 400 1.10 440.00
5. August 6 1200 0.80 960.00
July 8 400 Kgs. out of (1) 1.00 400.00
July 12 200 Kgs. out of (1) 1.00 200.00
July 22 600 Kgs. out of (2) 1.20 720.00
July 25 200 Kgs. out of (2) 1.20 240.00

2.47 MATERIAL COST
© The Institute of Chartered Accountants of India
200 Kgs. out of (3) 0.90 180.00
August 8 400 Kgs. out of (3) 0.90 360.00
400 Kgs. out of (4) 1.10 440.00
200 Kgs. out of (5) 0.80 160.00
The stock in hand after 8th August will be 1,000 kgs. This will be out of lot number
(5) and its value will be ` 800, i.e., @ ` 0.80 per kg.
(iii) Last-in-First-out (LIFO) method: It is a method of pricing the issues of
materials on the basis of assumption that the items of the last batch (lot)
purchased are the first to be issued. Therefore, under this method the prices of
the last batch (lot) are used for pricing the issues, until it is exhausted, and so on.
If however, the quantity of issue is more than the quantity of the latest lot, then
earlier (lot) and its price will also be taken into consideration.
During inflationary period or period of rising prices, the use of LIFO would
help to ensure that the cost of production determined on the above basis is
approximately the current one. This method is also useful specially when there is a
feeling that due to the use of FIFO or average methods, the profits shown and tax
paid are too high.
Advantages and Disadvantages
Advantages Disadvantages
The cost of materials issued will be
either nearer to and or will reflect
the current market price. Thus, the
cost of goods produced will be
related to the trend of the market
price of materials. Such a trend in
price of materials enables the
matching of cost of production with
current sales revenues.
Calculation under LIFO system
becomes complicated and
cumbersome when frequent
purchases are made at highly
fluctuating rates.
The use of the method during the
period of rising prices does not reflect
undue high profit in the income
statement as it was under the first-in-
first-out or average method. In fact, the
profit shown here is relatively lower
because the cost of production takes
Costs of different similar batches of
production carried on at the same
time may differ a great deal.

2.48 COST AND MANAGEMENT ACCOUNTING
© The Institute of Chartered Accountants of India
into account the rising trend of material
prices.
In the case of falling prices profit
tends to rise due to lower material
cost, yet the finished products
appear to be more competitive and
are at market price.
In time of falling prices, there will
be need for writing off stock value
considerably to stick to the
principle of stock valuation, i.e., the
cost or the market price whichever
is lower.
Over a period, the use of LIFO helps
to iron out the fluctuations in profits.
This method of valuation of
material is not acceptable to the
income tax authorities.
In the period of inflation LIFO will tend
to show the correct profit and thus
avoid paying undue taxes to some
extent.
ILLUSTRATION 12
The following transactions in respect of material Y occurred during the six months
ended 30th June, 2020:
Month Purchase
(units)
Price per unit
(`)
Issued
Units
January 200 25 Nil
February 300 24 250
March 425 26 300
April 475 23 550
May 500 25 800
June 600 20 400
It may be noted that Last in First out (LIFO) is not permitted under Accounting
Standard (AS)-2: Valuation of Inventories and Ind AS- 2: Inventories. However, for
the purpose of academic knowledge LIFO method is included in this Study
Material

2.49 MATERIAL COST
© The Institute of Chartered Accountants of India
Required:
(a) The Chief Accountant argues that the value of closing stock remains the same
no matter which method of pricing of material issues is used. Do you agree?
Why or why not? EXPLAIN. Detailed stores ledgers are not required.
(b) STATE when and why would you recommend the LIFO method of pricing
material issues?
SOLUTION
(a) Total number of units purchased = 2,500
Total number of units issued = 2,300
The closing stock at the end of six months’ period i.e., on 30th June, 2020 will be
200 units
Upto the end of May 2020, total purchases coincide with the total issues i.e., 1,900
units. It means that at the end of May 2020, there was no closing stock. In the
month of June 2020, 600 units were purchased out of which 400 units were issued.
Since there was only one purchase and one issue in the month of June, 2020 and
there was no opening stock on 1st June 2020, the Closing Stock of 200 units is to
be valued at ` 20 per unit.
In the view of this, the argument of the Chief Accountant appears to be correct.
Where there is only one purchase and one issue in a month with no opening stock,
the method of pricing of material issues becomes irrelevant. Therefore, in the given
case one should agree with the argument of the Chief Accountant that the value of
closing stock remains the same no matter which method of pricing the issue is
used.
It may, however, be noted that the argument of Chief Accountant would not stand
if one finds the value of the Closing Stock at the end of each month.
(b) LIFO method has an edge over FIFO or any other method of pricing material
issues due to the following advantages:
(i) The cost of the materials issued will be either nearer or will reflect the current
market price. Thus, the cost of goods produced will be related to the trend of
the market price of materials. Such a trend in price of materials enables the
matching of cost of production with current sales revenues.
(ii) The use of the method during the period of rising prices does not reflect
undue high profit in the income statement, as it was under the first-in-first-

2.50 COST AND MANAGEMENT ACCOUNTING
© The Institute of Chartered Accountants of India
out or average method. In fact, the profit shown here is relatively lower
because the cost of production takes into account the rising trend of material
prices.
(iii) In the case of falling prices, profit tends to rise due to lower material cost, yet
the finished products appear to be more competitive and are at market price.
(iv) During the period of inflation, LIFO will tend to show the correct profit and
thus, avoid paying undue taxes to some extent.
ILLUSTRATION 13
The following information is provided by Sunrise Industries for the fortnight of April,
2020:
Material Exe:
Stock on 1-4-2020 100 units at ` 5 per unit.
Purchases
5-4-2020, 300 units at ` 6
8-4-2020, 500 units at ` 7
12-4-2020, 600 units at ` 8
Issues
6-4-2020, 250 units
10-4-2020, 400 units
14-4-2020, 500 units
Required:
(A) CALCULATE using FIFO and LIFO methods of pricing issues:
(a) the value of materials consumed during the period
(b) the value of stock of materials on 15-4-2020.
(B) EXPLAIN why the figures in (a) and (b) in part A of this question are different
under the two methods of pricing of material issues used. You need not draw
up the Stores Ledgers.
SOLUTION
(A) (a) Value of Material Exe consumed during the period
1-4-2020 to 15-4-2020 by using FIFO method.

2.51 MATERIAL COST
© The Institute of Chartered Accountants of India
Date Description Units Qty. (Units) Rate
(`)
Amount
(`)
1-4-2020 Opening balance 100 5 500
5-4-2020 Purchased 300 6 1,800
6-4-2020 Issued 100
150
5
6
1,400
8-4-2020 Purchased 500 7 3,500
10-4-2020 Issued 150
250
6
7
2,650
12-4-2020 Purchased 600 8 4,800
14-4-2020 Issued 250
250
7
8
3,750
15-4-2020 Balance 350 8 2,800
Total value of material Exe consumed during the period under FIFO
method comes to (` 1,400 + ` 2,650 + ` 3,750) ` 7,800 and balance on
15-4-2020 is of ` 2,800.
Value of material Exe consumed during the period 01-4-2020 to 15-
4-2020 by using LIFO method
Date Description Qty.
(Units)
Rate
(`)
Amount
(`)
1-4-2020 Opening balance 100 5 500
5-4-2020 Purchased 300 6 1,800
6-4-2020 Issued 250 6 1,500
8-4-2020 Purchased 500 7 3,500
10-4-2020 Issued 400 7 2,800
12-4-2020 Purchased 600 8 4,800
14-4-2020 Issued 500 8 4,000
15-4-2020 Balance 350 — 2,300*
Total value of material Exe issued under LIFO method comes to (` 1,500
+ ` 2,800 + ` 4,000) ` 8,300.

2.52 COST AND MANAGEMENT ACCOUNTING
© The Institute of Chartered Accountants of India
*The balance 350 units on 15-4-2020 of ` 2,300, relates to opening
balance on 1-4-2020 and purchases made on 5-4-2020, 8-4-2020 and
12-4-2020. (100 units @ ` 5, 50 units @ ` 6, 100 units @ ` 7 and 100
units @ ` 8).
(b) As shown in (a) above, the value of stock of materials on 15-4-2020:
Under FIFO method ` 2,800
Under LIFO method ` 2,300
(B) Total value of material Exe issued to production under FIFO and LIFO methods
comes to ` 7,800 and ` 8,300 respectively. The value of closing stock of
material Exe on 15-4-2020 under FIFO and LIFO methods comes to ` 2,800
and ` 2,300 respectively.
The reasons for the difference of ` 500 (` 8,300 – ` 7,800) as shown by the
following table in the value of material Exe, issued to production under FIFO
and LIFO is as follows:
Date Quantity
Issued
Value Total Value Total
FIFO LIFO
(Units) (`) (`) (`) (`)
6 - 4-2020 250 1,400 1,500
10-4-2020 400 2,650 2,800
14-4-2020 500 3,750 7,800 4,000 8,300
1. On 6-4-2020, 250 units were issued to production. Under FIFO their
value comes to ` 1,400 (100 units × ` 5 + 150 units × ` 6) and under
LIFO ` 1,500 (250 × ` 6). Hence, ` 100 more was charged to production
under LIFO.
2. On 10-4-2020, 400 units were issued to production. Under FIFO their
value comes to ` 2,650 (150 × ` 6 + 250 × ` 7) and under LIFO ` 2,800
(400 × ` 7). Hence, ` 150 more was charged to production under LIFO.
3. On 14-4-2020, 500 units were issued to production. Under FIFO their
value comes to ` 3,750 (250 × ` 7 + 250 × ` 8) and under LIFO ` 4,000
(500 × ` 8). Hence, ` 250 more was charged to production under LIFO.
Thus the total excess amount charged to production under LIFO comes to
` 500.

2.53 MATERIAL COST
© The Institute of Chartered Accountants of India
The reasons for the difference of ` 500 (` 2,800 – ` 2,300) in the value of 350
units of Closing Stock of material Exe under FIFO and LIFO are as follows:
1. In the case of FIFO, all the 350 units of the closing stock belongs to the
purchase of material made on 12-4-2020, whereas under LIFO these
units were from opening balance and purchases made on 5-4-2020, 8- 4-
2020 and 12-4-2020.
2. Due to different purchase price paid by the concern on different days
of purchase, the value of closing stock differed under FIFO and LIFO.
Under FIFO 350 units of closing stock were valued @ ` 8 p.u. Whereas
under LIFO first 100 units were valued @ ` 5 p.u., next 50 units @ ` 6
p.u., next 100 units @ ` 7 p.u. and last 100 units @ ` 8 p.u.
Thus, under FIFO, the value of closing stock increased by ` 500.
(iv) Base Stock Method: Minimum quantity of stock under this method is
always held at a fixed price as reserve in the stock, to meet the state of
emergency, if it arises. This minimum stock is known as base stock and is valued
at a price at which the first lot of materials is received and remains unaffected by
subsequent price fluctuations.
This method of valuing inventory is different from other methods of valuing issues,
as the base stock of materials are valued at the original cost, whereas, materials
other than the base are valued using other methods like FIFO, LIFO etc. This method
is not an independent method as it uses FIFO or LIFO.
Advantages and disadvantages of this method depend upon the use of the other
method viz., FIFO or LIFO.
2.8.2 Average Price Methods
(i) Simple Average Price Method: Under this method, materials issued are
valued at average price, which is calculated by dividing the total of rates at which
different lot of materials are purchased by total number of lots. In this method
quantity purchased in each lot is ignored. However, the price of stock of that lot
which is completely sold out is not considered for taking average price.
Example - 1: During the month of April, a company has made five purchases
as follows:
1st April, 200 units @ `10 each;
5th April, 150 units @ `12 each;
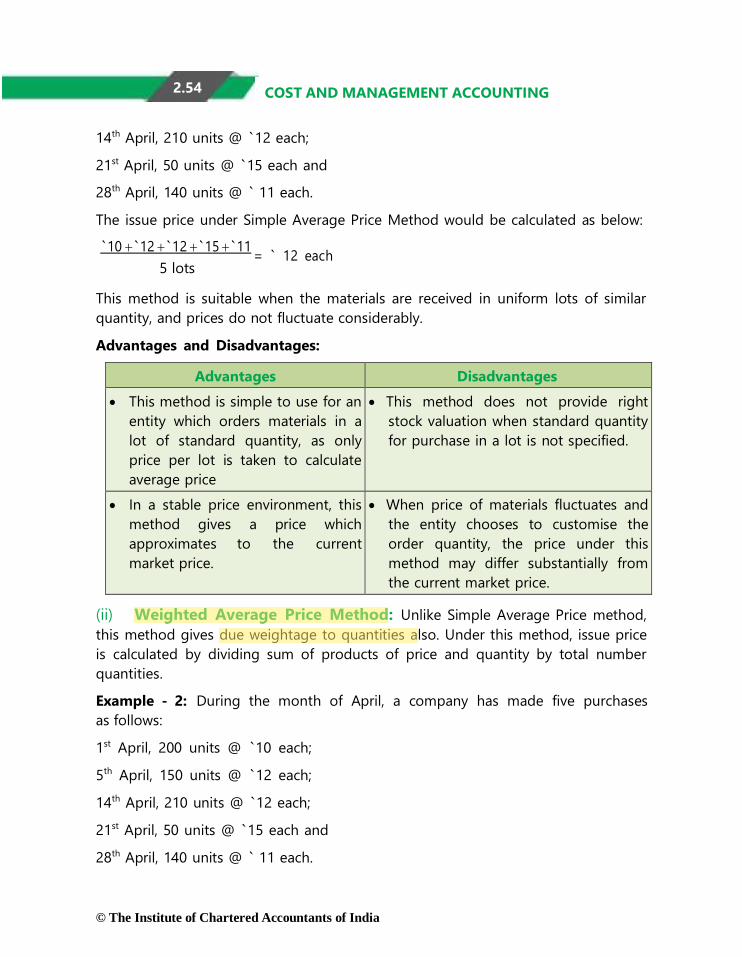
2.54 COST AND MANAGEMENT ACCOUNTING
© The Institute of Chartered Accountants of India
14th April, 210 units @ `12 each;
21st April, 50 units @ `15 each and
28th April, 140 units @ ` 11 each.
The issue price under Simple Average Price Method would be calculated as below:
`10 `12 `12 `15 `11 = ` 12 each
5 lots
This method is suitable when the materials are received in uniform lots of similar
quantity, and prices do not fluctuate considerably.
Advantages and Disadvantages:
Advantages Disadvantages
This method is simple to use for an
entity which orders materials in a
lot of standard quantity, as only
price per lot is taken to calculate
average price
This method does not provide right
stock valuation when standard quantity
for purchase in a lot is not specified.
In a stable price environment, this
method gives a price which
approximates to the current
market price.
When price of materials fluctuates and
the entity chooses to customise the
order quantity, the price under this
method may differ substantially from
the current market price.
(ii) Weighted Average Price Method: Unlike Simple Average Price method,
this method gives due weightage to quantities also. Under this method, issue price
is calculated by dividing sum of products of price and quantity by total number
quantities.
Example - 2: During the month of April, a company has made five purchases
as follows:
1st April, 200 units @ `10 each;
5th April, 150 units @ `12 each;
14th April, 210 units @ `12 each;
21st April, 50 units @ `15 each and
28th April, 140 units @ ` 11 each.

2.55 MATERIAL COST
© The Institute of Chartered Accountants of India
The issue price under Weightage Average Price Method would be calculated as
below:
{(`10×200 units)+(`12×150 units)+(`12×210 units)+(`15×50 units)+(`11×140 units)}
(200+150+210+50+140) units
` 8,610 =
750 units = ` 11.48 each
This method is useful in case when quantity purchased under each lot is different
and price fluctuates frequently.
Advantages and Disadvantages:
Advantages Disadvantages
It smoothens the price
fluctuations, if at all it is there,
due to material purchases.
Material cost does not represent
actual cost price and therefore, a
different profit or loss will arise out of
such a pricing method.
Issue prices need not be
calculated for each issue unless
new lot of materials is received.
It may be difficult to compute, since
every time lot is received, it would
require re-computation of issue
prices.
2.8.3 Market Price Methods
(i) Replacement Price Method: Replacement price is defined as the price at
which it is possible to purchase an item, identical to that which is being replaced
or revalued. Under this method, materials issued are valued at the replacement cost
of the items. This method pre-supposes the determination of the replacement cost of
materials at the time of each issue; viz., the cost at which identical materials could be
currently purchased. The product cost under this method is at current market price,
which is the main objective of the replacement price method.
This method is useful to determine true cost of production and to value material
issues in periods of rising prices, because the cost of material considered in cost of
production would be able to replace the materials at the increased price.
(ii) Realisable Price Method: Realisable price means a price at which the
material to be issued can be sold in the market. This price may be more or may
be less than the cost price at which it was originally purchased. Like replacement
price method, the stores ledger would show profit or loss in this method too.

2.56 COST AND MANAGEMENT ACCOUNTING
© The Institute of Chartered Accountants of India
2.8.4 Notional Price Methods
(i) Standard Price Method: Under this method, materials are priced at some
predetermined rate or standard price irrespective of the actual purchase cost of
the materials. Standard cost is usually fixed after taking into consideration the
following factors:
(i) Current prices,
(ii) Anticipated market trends, and
(iii) Discount available and transport charges etc.
Standard prices are fixed for each material and the requisitions are priced at the
standard price. This method is useful for controlling material cost and determining
the efficiency of purchase department. In the case of highly fluctuating prices of
materials, it is difficult to fix their standard cost on long-term basis.
Advantages Disadvantages
The use of the standard price
method simplifies the task of
valuing issues of materials.
The use of standard price does not
reflect the market price and thus
results in a different or incorrect
profit or loss.
It facilitates the control of
material cost and the task of
judging the efficiency of
purchase department.
The fixation of standard price
becomes difficult when prices
fluctuate frequently
It reduces the clerical work.
(ii) Inflated Price Method: In case material suffers loss in weight due to natural
or climatic factors, e.g., evaporation, the issue price of the material is inflated to
cover up the losses.
(iii) Re-use Price Method: When materials are rejected and returned to the
stores or a processed material is put to some other use, other than for the purpose
it is meant, then such materials are priced at a rate quite different from the price
paid for them originally. There is no final procedure for valuing use of material.
2.57 MATERIAL COST
© The Institute of Chartered Accountants of India
2.9 VALUATION OF RETURNS & SHORTAGES
2.9.1 Valuation of Materials Returned to the Vendor
Generally, materials are checked for quality, before dispatching to the store; and if
any issues arise such as not meeting the quality requirements or any specification
or are considered unfit for production due to any reason, due notice is made and
materials are returned to the vendor. However, even if any substandard quality is
noticed, before or after reaching the store, such materials can also be returned to
the vendor.
The price of the materials to be returned to the vendor should include its invoice
price plus freight, receiving and handling charges etc. Strictly speaking, the
materials returned to the vendor should be returned at the stores ledger price and
not at invoice price. But in practice, only invoice price is considered and the gap
between the invoice price and stores ledger price is charged as overhead. In stores
ledger, the defective or sub-standard materials are shown in the issue column at
the rate shown in the ledger, and the difference between issue price and invoice
cost is debited to an inventory adjustment account.
2.9.2 Valuation of Materials Returned to Stores
When materials requisitioned for a specific job or work-in progress are found to be
in excess of the requirement or are unsuitable for the purpose, they are returned
to the stores. There are two ways of treating such returns.
(1) Such returns are entered in the receipt column at the price at which they were
originally issued, and the materials are kept in suspense account, to be issued
at the same price, against the next requisition.
(2) Include the materials in stock, as if they were fresh purchases at the original
issue price.
2.9.3 Valuation of Shortages during Physical Verification
Materials found short during physical verification should be entered in the issue
column and valued at the rate as per the method adopted, i.e., FIFO or any other.
ILLUSTRATION 14:
Arnav Electronics manufactures electronic home appliances. It follows weighted average
Cost method for inventory valuation. Following are the data of component X:

2.58 COST AND MANAGEMENT ACCOUNTING
© The Institute of Chartered Accountants of India
Date Particulars Units Rate per unit (`)
15-12-19 Purchase Order- 008 10,000 9,930
30-12-19 Purchase Order- 009 10,000 9,780
01-01-20 Opening stock 3,500 9,810
05-01-20 GRN*-008 (against the
Purchase Order- 008)
10,000 -
05-01-20 MRN**-003 (against the
Purchase Order- 008)
500 -
06-01-20 Material Requisition-011 3,000 -
07-01-20 Purchase Order- 010 10,000 9,750
10-01-20 Material Requisition-012 4,500 -
12-01-20 GRN-009 (against the
Purchase Order- 009)
10,000 -
13-01-20 MRN-004 (against the
Purchase Order- 009)
400 -
15-01-20 Material Requisition-013 2,200 -
24-01-20 Material Requisition-014 1,500 -
25-01-20 GRN-010 (against the
Purchase Order- 010)
10,000 -
28-01-20 Material Requisition-015 4,000 -
31-01-20 Material Requisition-016 3,200 -
*GRN- Goods Received Note; **MRN- Material Returned Note
Based on the above data, you are required to CALCULATE:
(i) Re-order level
(ii) Maximum stock level
(iii) Minimum stock level
(iv) PREPARE Store Ledger for the period January 2020 and DETERMINE the value
of stock as on 31-01-2020.
(v) Value of components used during the month of January, 2020.
(vi) Inventory turnover ratio.

2.59 MATERIAL COST
© The Institute of Chartered Accountants of India
SOLUTION
1. Workings:
Consumption is calculated on the basis of material requisitions:
Maximum component usage = 4,500 units (Material requisition on 10-01-20)
Minimum component usage = 1,500 units (Material requisition on 24-01-20)
Lead time is calculated from purchase order date to material received
date
Maximum lead time = 21 days (15-12-2019 to 05-01-2020)
Minimum lead time = 14 days (30-12-2019 to 13-01-2020)2. Reorder quantity
(observed) = 10,000 units3.
Date Material Requisition
number
Units
06-01-2020 11 3,000
10-01-2020 12 4,500 (Maximum)
15-01-2020 13 2,200
24-01-2020 14 1,500 (Minimum)
28-01-2020 15 4,000
31-01-2020 16 3,200
Calculations:
(i) Re-order level
= Maximum usage × Maximum lead time
= 4,500 units × 21 days = 94,500 units
(ii) Maximum stock level
= Re-order level + Re-order Quantity – (Min. Usage × Min. lead time)
= 94,500 units + 10,000 units – (1,500 units × 14 days)
= 1,04,500 units – 21,000 units = 83,500 units

2.60 COST AND MANAGEMENT ACCOUNTING
© The Institute of Chartered Accountants of India
(iii) Minimum stock level
= Re-order level – (Avg. consumption × Avg. lead time)
= 94,500 units – (3,000 units × 17.5 days)
= 94,500 units – 52,500 units
= 42,000 units
(iv) Store Ledger for the month of January 2020: (Weighted Average
Method)
Date Receipts Issue Balance
GRN/
MRN
Units Rate Amt.
(‘000)
MRN
/ MR
Units Rate Amt.
(‘000)
Units Rate Amt.
(‘000)
01-01-20 - - - - - - - - 3,500 9,810 34,335
05-01-20 008 10,000 9,930 99,300 003 500 9,930 4,965 13,000 9,898 1,28,670
06-01-20 - - - - 011 3,000 9,898 29,694 10,000 9,898 98,980
10-01-20 - - - - 012 4,500 9,898 44,541 5,500 9,898 54,439
12-01-20 009 10,000 9,780 97,800 004 400 9,780 3,912 15,100 9,823 1,48,327
15-01-20 - - - - 013 2,200 9,823 21,611 12,900 9,823 1,26,716
24-01-20 - - - - 014 1,500 9,823 14,734 11,400 9,823 1,11,982
25-01-20 010 10,000 9,750 97,500 - - - - 21,400 9,789 2,09,482
28-01-20 - - - - 015 4,000 9,789 39,156 17,400 9,789 1,70,326
31-01-20 - - - - 016 3,200 9,789 31,325 14,200 9,789 1,39,001
[Note: Decimal figures may be rounded-off to the nearest rupee value
wherever required)
Value of 14,200 units of stock as on 31-01-2020 (‘000) = `1,39,001
(v) Value of components used during the month of January 2020:
Sum of material requisitions 011 to 016 (‘000)
= ` 29,694 + ` 44,541 + ` 21,611 + ` 14,734 + ` 39,156 + ` 31,325
= ` 1,81,061
(vi) Inventory Turnover Ratio
= Valueofmaterialsused
= 1,81,061
= 1,81,061
= 2.09
Averagestock value (1,39,001+34,335) / 2 86,668

2.61 MATERIAL COST
© The Institute of Chartered Accountants of India
2.10 TREATMENT OF NORMAL AND ABNORMAL
LOSS OF MATERIALS
Loss of materials during handling, storage, process may occur any of the following
forms:
(i) Waste: The portion of raw material which is lost during storage or production
and discarded. The waste may or may not have any value.
Treatment of Waste
Normal- Cost of normal waste is absorbed by good production units.
Abnormal- The cost of abnormal loss is transferred to Costing Profit and loss
account.
(ii) Scrap: The materials which are discarded and disposed-off without further
treatment. Generally, scrap has either no value or insignificant value. Sometimes, it
may be reintroduced into the process as raw material.
Treatment of Scrap
Normal- The cost of scrap is borne by good units and income arises on account of
realisable value is deducted from the cost.
Abnormal- The scrap account should be charged with full cost. The credit is given
to the job or process concerned. The profit or loss in the scrap account, on
realisation, will be transferred to the Costing Profit and Loss Account.
(iii) Spoilage: It is the term used for materials which are badly damaged in
manufacturing operations, and they cannot be rectified economically and hence
taken out of the process to be disposed off in some manner without further
processing.
Treatment of Spoilage
Normal- Normal spoilage (i.e., which is inherent in the operation) costs are
included in costs, either by charging the loss due to spoilage to the production
Obsolescence Defectives Spoilage Scrap Waste
Loss of Material

2.62 COST AND MANAGEMENT ACCOUNTING
© The Institute of Chartered Accountants of India
order or by charging it to the production overhead so that it is spread over all the
products.
Any value realised from spoilage is credited to production order or production
overhead account, as the case may be.
Abnormal- The cost of abnormal spoilage (i.e., arising out of causes not inherent
in manufacturing process) is charged to the Costing Profit and Loss Account. When
spoiled work is the result of rigid specification, the cost of spoiled work is absorbed
by good production while the cost of disposal is charged to production overhead.
(iv) Defectives: It signifies those units or portions of production which do not
meet the quality standards. Defectives arise due to sub-standard materials, bad-
supervision, bad-planning, poor workmanship, inadequate-equipment and careless
inspection.
The defectives which can be re-made as per the quality standard by using
additional materials are known as reworks. Reworks include repairs, reconditioning
and refurbishing.
Defectives which cannot be brought up to the quality standards are known as
rejects. The rejects may either be disposed- off or re-cycled for production process.
Treatment of Defectives:
Normal- An amount equal to the cost less realisable value on sale of defectives are
charged to material cost of good production.
Abnormal- Material Cost of abnormal defectives are not included in material cost
but treated as loss after giving credit to the realisable value of such defectives. The
material cost of abnormal loss is transferred to costing profit and loss account.
Reclamation of loss from defective units
In the case of articles that have been spoiled, it is necessary to take steps to reclaim
as much of the loss as possible. For this purpose:
(i) All defective units should be sent to a place fixed for the purpose;
(ii) These should be dismantled;
(iii) Goods and serviceable parts should be separated and taken back into the
stock;
(iv) Parts which can be made serviceable by further work should be separated and
sent to the workshop for the purpose and taken into stock after the defects
have been removed; and

2.63 MATERIAL COST
© The Institute of Chartered Accountants of India
(v) Parts which cannot be made serviceable should be collected in one place for
being melted or sold off.
Printed forms should be used to record quantities for all purposes aforementioned.
Difference between Waste and Scrap
Waste Scrap
1. It is connected with raw material or
inputs to the production process.
1. It is the loss connected with the
output
2. Waste of materials may be visible
or invisible.
2. Scraps are generally identifiable
and has physical substance.
3. Generally waste has no recoverable
value.
3. Scraps are termed as by-products
and has small recoverable value.
Difference between Scrap and Defectives
Scrap Defectives
1. It is the loss connected with the
output
1. This type of loss is connected with the
output as well as the input .
2. Scraps are not intended but
cannot be eliminated due to the
nature of material or process
itself.
2. Defectives also are not intended but
can be eliminated through a proper
control system.
3. Generally scraps are not used or
rectified.
3. Defectives can be used after
rectification.
4. Scraps have insignificant
recoverable value.
4. Defectives are sold at a lower value
from that of the good one.
Distinction between Spoilage and Defectives: The difference between spoilage
and defectives is that while spoilage cannot be repaired or reconditioned,
defectives can be rectified and transferred, either back to the standard production
or to the seconds.
The problem of accounting for defective work is in relation to the costs of
rectification or rework.
(v) Obsolescence: Obsolescence is defined as “the loss in the intrinsic value of
an asset due to its supersession”. In simple words, obsolescence refers to the loss
in the value of an asset due to technological advancements.

2.64 COST AND MANAGEMENT ACCOUNTING
© The Institute of Chartered Accountants of India
Treatment: Materials may become obsolete under any of the following circum-
stances:
(i) where it is a spare part or a component of a machinery that is used in
manufacturing and is now obsolete;
(ii) where it is used in the manufacturing of a product which has now become
obsolete;
(iii) where the material itself is replaced by another material due to either
improved quality or fall in price.
In all the three cases, the value of the obsolete material held in stock is a total loss
and immediate steps should be taken to dispose it off at the best available price.
The loss arising out of obsolete materials is an abnormal loss and it does not form
part of the cost of manufacture.
2.11 CONSUMPTION OF MATERIALS
Any product that is manufactured in a firm entails consumption of resources like
material, labour etc. The management for planning and control must know the cost
of using these resources in manufacturing process. The consumption of materials
takes place when it is used in the manufacturing of the product.
It is important to note that the amount of materials consumed in a period by a cost
object need not be equal to the amount of material available with the concern. For
example, during any period, the total of raw material stock available for use in
production may not be equal to the amount of materials actually consumed and
assigned to the cost object of the production. The difference between the material
available and material consumed represents the surplus stock or stock of material
at the end of the period.
2.11.1 Identification of Materials
For the identification of consumption of materials with products of cost centres the
followings points should be noted:
1. It is required that the concern should follow coding system for all materials,
so that each material is identified by unique code number.
2. It is required that each product of a cost centre should be given a unique
code number so that the direct material issued for production of particular
product of a cost centre can be collected against the code number of that
product.

2.65 MATERIAL COST
© The Institute of Chartered Accountants of India
However, it may not be possible to allocate all materials directly to individual
product of a cost centre e.g. maintenance materials, inspection and testing
materials etc. The consumption of these materials are collected for cost
centre and then charged to individual product by adopting suitable overhead
absorption rate of cost centre.
Overhead absorption rate of cost centre = Cost for cost centre
Base relating to cost centre
(e.g.labou r hrs. or machine hrs.)
3. Each issue of materials should be recorded. One way of doing this is to use a
material requisition note. This note shows the details of materials issued for
the product of cost centre or the cost centre which is to be charged with cost
of materials.
4. A material return note is required for recording the excess materials returned
to the store. This note is required to ensure that original product of cost
centre is credited with the cost of material which was not used and that the
stock records are updated.
5. A material transfer note is required for recording the transfer of materials
from one product of cost centre to other or from one cost centre to other
cost centre.
6. The cost of materials issued would be determined according to stock
valuation method used.
2.11.2 Monitoring Consumption of Materials
For monitoring consumption of materials, a storekeeper should periodically analyse
the various material requisitions, material return notes and material transfer notes.
Based on this analysis, a material abstracts or material issue analysis sheet is
prepared, which shows at a glance the value of material consumed in
manufacturing each product. This statement is also useful for ascertaining the cost
of material issued for each product.

2.66 COST AND MANAGEMENT ACCOUNTING
© The Institute of Chartered Accountants of India
Format of Material Abstract
Week Ending............
Material
requisition
or Transfer
Note or
Returned
Note No.
Amount
(`)
Product Nos. Total
for
Product
Overheads
(Indirect
Material
charged)
101 102 103 104 105 106
(`) (`) (`) (`) (`) (`) (`)
— — — — — — — — —
Total
The material abstract statement serves a useful purpose. It, in fact, shows the
amount of material to be debited to various products & overheads. The total
amount of stores debited to various products & overheads should be the same as
the total value of stores issued in any period.
2.11.3. Basis for consumption entries in Financial Accounts
Every manufacturing organisation assigns material costs to the products for two
purposes.
Firstly, for external financial accounting requirements, in order to allocate the
material costs incurred during the period between cost of goods produced and
inventories; secondly to provide useful information for managerial decision
making requirements. In order to meet external financial accounting requirements,
it may not be necessary to accurately trace material costs to individual products.
Some products costs may be overstated and others may be understated. But this
may not matter for financial accounting purposes, as long as total of individual
materials costs transactions are recorded i.e., transactions between cost centre
within the firm are recorded in a manner that facilitates analysis of costs for
assigning them to cost units.
The consumption entries in financial accounts are made on the basis of total cost of
purchases of materials after adjustment for opening and closing stock of materials.
2.67 MATERIAL COST
© The Institute of Chartered Accountants of India
Following equation is applicable here:
Consumption of Materials = Opening Stock of material + Purchases – Closing Stock of
materials
The stock of materials is taken at cost or net realisable value, whichever is less.
SUMMARY
Material Control: It is the systematic control over the procurement, storage
and usage of materials to maintain even flow of materials and avoiding at the
same time excessive investment in inventories.
Material Requisition Note: Document used to authorize and record the issue
of materials from store.
Purchase Requisition Note: Document is prepared by the storekeeper to
initiate the process of purchases.
Purchase Order: It is a written request to the supplier to supply certain specified
materials at specified rates and within a specified period.
Goods Received Note: This document is prepared by receiving department
which unpacks the goods received and verify the quantities and other details.
Material Transfer Note: This document is prepared when the material is
transferred from one department to another.
Material Return Note: It is a document given with the goods being returned
from factory back to the stores.
Bin Card: A prime entry record of the quantity of stocks, kept on in/out/balance,
held in designated storage areas.
Stores Ledger: A ledger containing a separate account for each item of material
and component stocked in store giving details of the receipts, issues and balance
both in terms of quantity and value.
Minimum Level: It is the minimum quantity, which must be retained in stock
ROL- (Avg. consumption × Avg. Lead time)
Maximum Level: It is the maximum limit up to which stock can be stored at any
time
ROL + ROQ – (Min consumption × Min Lead Time)
Re order Level: It is the level at which new order needs to be placed

2.68 COST AND MANAGEMENT ACCOUNTING
© The Institute of Chartered Accountants of India
Maximum lead time × Maximum Usage
Or
Minimum level + (Average rate of consumption × Average time to obtain fresh
supplies).
Average Inventory Level = Minimum level + 1/2 Re-order quantity
Or
= Maximum level+Minimum level
2
Danger Level: The level where normal issue of materials is stopped, and only
emergency materials are issued.
Danger level = Average consumption × Lead time for emergency purchases.
Stock-out = Stock out is said to be occurred when an inventory item could not
be supplied due to insufficient stock in the store.
Just-in-time (JIT) Inventory management = JIT is a system of inventory
management with an approach to have a zero inventories in stores. According
to this approach material should only be purchased when it is actually required
for production.
ABC analysis :Items are classified into the following categories:
A Category: Quantity less than 10 % but value more than 70 %
B Category: Quantity less than 20 % but value about 20 %
C Category: Quantity about 70 % but value less than 10%
Fast Moving, Slow Moving and Non Moving (FSN) Inventory: Under this
system, inventories are controlled by classifying them on the basis of frequency of
usage.
Vital, Essential and Desirable (VED): Under this system of inventory analysis,
inventories are classified on the basis of its criticality for the production function
and final product.
High Cost, Medium Cost, Low Cost (HML) Inventory: Under this system,
inventory is classified on the basis of the cost of an individual item, unlike ABC
analysis where inventories are classified on the basis of overall value of inventory.
Two bin system: If one bin items exhausts, new order is placed and in the mean
time, quantity from the smaller bin is used or issued.

2.69 MATERIAL COST
© The Institute of Chartered Accountants of India
First-in First-out method: The materials received first are to be issued first when
material requisition is received. Materials left as closing stock will be at the price
of the latest purchases.
Last-in First-out method: The materials purchased last are to be issued first when
material requisition is received. Closing stock is valued at the oldest available stock
price.
Simple Average Method: Material Issue Price
= Total of unit price of each purchase
Total number of Purchases
Weighted Average Price Method: This method gives due weightage to
quantities purchased and the purchase price to determine the issue price.
Weighted Average Price = Total cost of material in stock
Total quantity of materials
Various Material Losses
(a) Wastage: Portion of basic raw material lost in processing, having no
recoverable value
(b) Scrap: The incidental material residue coming out of certain manufacturing
operations, having low recoverable value.
(c) Spoilage: Goods damaged beyond rectification, to be sold off without
further processing.
Defectives: Goods which can be rectified and turned out as good units by the
application of additional labour or other services.
TEST YOUR KNOWLEDGE
MCQs based Questions
1. Direct material can be classified as
(a) Fixed cost
(b) Variable cost
(c) Semi-variable cost.
(d) Prime Cost
2. In most of the industries, the most important element of cost is

2.70 COST AND MANAGEMENT ACCOUNTING
© The Institute of Chartered Accountants of India
(a) Material
(b) Labour
(c) Overheads
(d) Administration Cost
3. Which of the following is considered to be the normal loss of materials?
(a) Loss due to accidents
(b) Pilferage
(c) Loss due to breaking the bulk
(d) Loss due to careless handling of materials.
4. In which of following methods of pricing, costs lag behind the current
economic values?
(a) Last-in-first out price
(b) First-in-first out price
(c) Replacement price
(d) Weighted average price
5. Continuous stock taking is a part of
(a) Annual stock taking
(b) Perpetual inventory
(c) ABC analysis.
(d) Bin Cards
6. In which of the following methods, issues of materials are priced at pre-
determined rate?
(a) Inflated price method
(b) Standard price method
(c) Replacement price method
(d) Market price method.
7. When material prices fluctuate widely, the method of pricing that gives
absurd results is

2.71 MATERIAL COST
© The Institute of Chartered Accountants of India
(a) Simple average price
(b) Weighted average price
(c) Moving average price
(d) Inflated price.
8. When prices fluctuate widely, the method that will smooth out the effect of
fluctuations is
(a) Simple average
(b) Weighted average
(c) FIFO
(d) LIFO
9. Under the FSN system of inventory control, inventory is classified on the basis
of:
(a) Volume of material consumption
(d) Frequency of usage of items of inventory
(c) Criticality of the item of inventory for production
(d) Value of items of inventory
10. Materials are issued to and from one process to another, on the basis of:
(a) Material Transfer Note
(b) Material Requisition Note
(c) Bill of Materials
(d) Purchase Requisition Note
Theoretical Questions
1. STATE how normal and abnormal loss of material arising during storage are
treated in Cost Accounts?
2. DISTINGUISH clearly between Bin cards and Stores Ledger.
3. DISCUSS the accounting treatment of defectives in Cost Accounts.
4. EXPLAIN the concept of "ABC Analysis" as a technique of inventory control.
5. DISTINGUISH between Re-order level and Re-order quantity.

2.72 COST AND MANAGEMENT ACCOUNTING
© The Institute of Chartered Accountants of India
6. EXPLAIN how is slow moving and non-moving item of stores detected and
what steps are necessary to reduce such stocks?
7. Write short notes on any three of the following:
(i) Danger Level
(ii) Just in Time Inventory Management
(iii) Maximum stock level and Minimum Stock level
(iv) Obsolescence
Practical Problems
1. Anil & Company buys its annual requirement of 36,000 units in 6 instalments.
Each unit costs ` 1 and the ordering cost is `25. The inventory carrying cost
is estimated at 20% of unit value. FIND the total annual cost of the existing
inventory policy. CALCULATE, how much money can be saved by Economic
Order Quantity?
2. A Company manufactures a special product which requires a component
‘Alpha’. The following particulars are collected for the year 2020:
(i) Annual demand of Alpha 8,000 units
(ii) Cost of placing an order ` 200 per order
(iii) Cost per unit of Alpha ` 400
(iv) Carrying cost p.a. 20%
The company has been offered a quantity discount of 4 % on the purchase of
‘Alpha’ provided the order size is 4,000 components at a time.
Required:
(i) COMPUTE the economic order quantity
(ii) STATE whether the quantity discount offer can be accepted.
3. The complete Gardener is deciding on the economic order quantity for two
brands of lawn fertilizer - Super Grow and Nature’s Own. The following
information is collected:
Annual demand
FERTILIZER
Super Grow Nature’s Own
2,000 bags 1,280 bags

2.73 MATERIAL COST
© The Institute of Chartered Accountants of India
Relevant ordering cost per purchase
order
` 1,200 ` 1,400
Annual relevant carrying cost per bag ` 480 ` 560
Required:
(i) COMPUTE EOQ for Super Grow and Nature’s own.
(ii) For the EOQ, WHAT is the sum of the total annual relevant ordering
costs and total annual relevant carrying costs for Super Grow and
Nature’s own?
(iii) For the EOQ, COMPUTE the number of deliveries per year for Super
Grow and Nature’s own.
4. A Company uses three raw materials A, B and C for a particular product for
which the following data apply:
Raw
Material
Usage per
unit of
Product
(Kgs.)
Re-order
quantity
(Kgs.)
Price
per
Kg.
Delivery period
(in weeks)
Re-
order
level
(Kgs)
Minimu
m level
(Kgs.)
Minimum Average Maximum
A 10 10,000 10 1 2 3 8,000 ?
B 4 5,000 30 3 4 5 4,750 ?
C 6 10,000 15 2 3 4 ? 2,000
Weekly production varies from 175 to 225 units, averaging 200 units of the
said product. COMPUTE the following quantities:
(i) Minimum stock of A,
(ii) Maximum stock of B,
(iii) Re-order level of C,
(iv) Average stock level of A.
5. (a) EXE Limited has received an offer of quantity discounts on its order of
materials as under:
Price per ton (`) Ton (Nos.)
1,200 Less than 500
1,180 500 and less than 1,000

2.74 COST AND MANAGEMENT ACCOUNTING
© The Institute of Chartered Accountants of India
1,160 1,000 and less than 2,000
1,140 2,000 and less than 3,000
1,120 3,000 and above.
The annual requirement for the material is 5,000 tons. The ordering cost
per order is ` 1,200 and the stock holding cost is estimated at 20% of
material cost per annum. You are required to COMPUTE the most
economical purchase level.
(b) WHAT will be your answer to the above question if there are no
discounts offered and the price per ton is ` 1,500?
6. From the details given below, CALCULATE:
(i) Re-ordering level
(ii) Maximum level
(iii) Minimum level
(iv) Danger level.
Re-ordering quantity is to be calculated on the basis of following information:
Cost of placing a purchase order is ` 4,000
Number of units to be purchased during the year is 5,00,000
Purchase price per unit, inclusive of transportation cost is ` 50
Annual cost of storage per unit is ` 10.
Details of lead time: Average- 10 days, Maximum- 15 days, Minimum- 5 days,
for emergency purchases- 4 days.
Rate of consumption: Average: 1,500 units per day,
Maximum: 2,000 units per day.
7. G. Ltd. produces a product which has a monthly demand of 4,000 units. The
product requires a component X which is purchased at ` 20. For every finished
product, one unit of component is required. The ordering cost is
` 120 per order and the holding cost is 10% p.a.
You are required to CALCULATE:
(i) Economic order quantity.
(ii) If the minimum lot size to be supplied is 4,000 units, what is the extra

2.75 MATERIAL COST
© The Institute of Chartered Accountants of India
cost, the company has to incur?
(iii) What is the minimum carrying cost, the company has to incur?
8. ‘AT’ Ltd. furnishes the following store transactions for September, 2020:
1-9-20 Opening balance 25 units value ` 162.50
4-9- 20 Issues Req. No. 85 8 units
6-9- 20 Receipts from B & Co. GRN No. 26 50 units @ ` 5.75 per unit
7-9- 20 Issues Req. No. 97 12 units
10-9- 20 Return to B & Co. 10 units
12-9- 20 Issues Req. No. 108 15 units
13-9- 20 Issues Req. No. 110 20 units
15-9- 20 Receipts from M & Co. GRN. No. 33 25 units @ ` 6.10 per unit
17-9- 20 Issues Req. No. 121 10 units
19-9- 20 Received replacement from B & Co.
GRN No. 38 10 units
20-9- 20 Returned from department, material of
M & Co. MRR No. 4 5 units
22-9- 20 Transfer from Job 182 to Job 187 in the
dept. MTR 6 5 units
26-9- 20 Issues Req. No. 146 10 units
29-9- 20 Transfer from Dept. “A” to
Dept. “B” MTR 10 5 units
30-9- 20 Shortage in stock taking 2 units
PREPARE the priced stores ledger on FIFO method and STATE how would you
treat the shortage in stock taking.
9. The following information is extracted from the Stores Ledger:
Material X
Opening Stock Nil
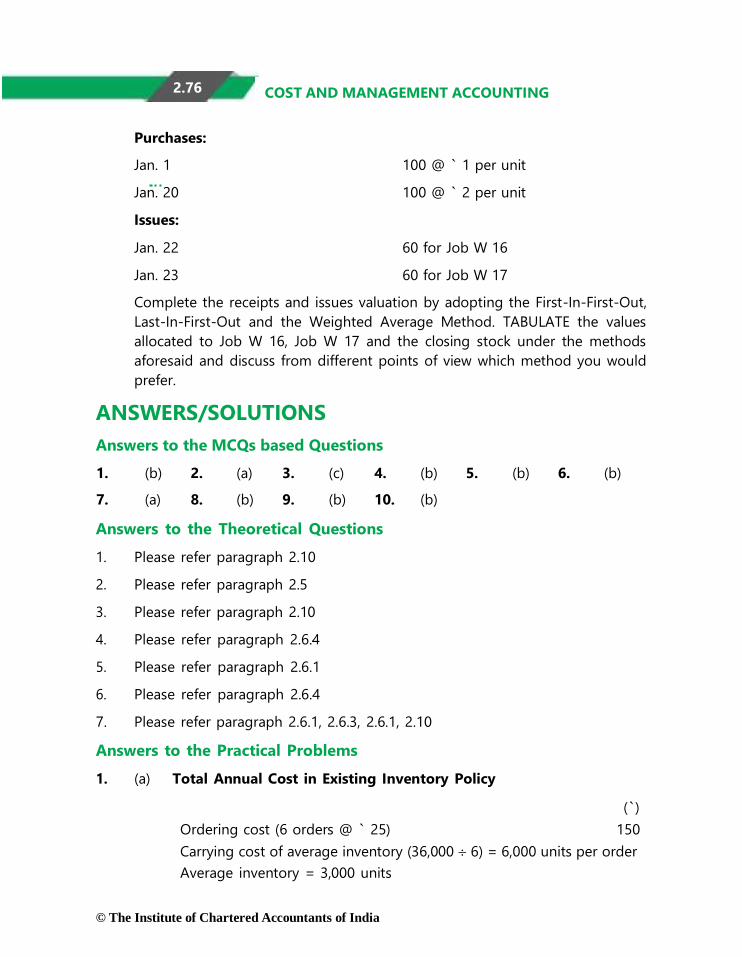
2.76 COST AND MANAGEMENT ACCOUNTING
© The Institute of Chartered Accountants of India
Purchases:
Jan. 1 100 @ ` 1 per unit
Jan. 20 100 @ ` 2 per unit
Issues:
Jan. 22 60 for Job W 16
Jan. 23 60 for Job W 17
Complete the receipts and issues valuation by adopting the First-In-First-Out,
Last-In-First-Out and the Weighted Average Method. TABULATE the values
allocated to Job W 16, Job W 17 and the closing stock under the methods
aforesaid and discuss from different points of view which method you would
prefer.
ANSWERS/SOLUTIONS
Answers to the MCQs based Questions
1. (b) 2. (a) 3. (c) 4. (b) 5. (b) 6. (b)
7. (a) 8. (b) 9. (b) 10. (b)
Answers to the Theoretical Questions
1. Please refer paragraph 2.10
2. Please refer paragraph 2.5
3. Please refer paragraph 2.10
4. Please refer paragraph 2.6.4
5. Please refer paragraph 2.6.1
6. Please refer paragraph 2.6.4
7. Please refer paragraph 2.6.1, 2.6.3, 2.6.1, 2.10
Answers to the Practical Problems
1. (a) Total Annual Cost in Existing Inventory Policy
(`)
Ordering cost (6 orders @ ` 25) 150
Carrying cost of average inventory (36,000 6) = 6,000 units per order
Average inventory = 3,000 units

2.77 MATERIAL COST
© The Institute of Chartered Accountants of India
2×36,000×25
`1×20%
2AO
C
2×8,000 units×`200
`400×20 / 100
Carrying cost = 20% of ` 1 3,000 = 3,000 0.20 600
Total cost A 750
(b) Total Annual Cost in E.O.Q
EOQ = = 3000 units
(`)
No. of orders = 36,000 ÷3,000 units = 12 orders
Ordering cost (12 ` 25) = 300
Carrying cost of average inventory (3,000 0.20) ÷ 2 = 300
Total Cost B 600
Savings due to E.O.Q ` (750 – 600) (A – B) 150
Note: As the units purchase cost of ` 1 does not change in both the
computation, the same has not been considered to arrive at total cost
of inventory for the purpose of savings.
2. (i) Calculation of Economic Order Quantity
EOQ = = = 200 units
(ii) Evaluation of Profitability of Different Options of Order Quantity
(a) When EOQ is ordered
(`)
Purchase Cost (8,000 units ` 400) 32,00,000
Ordering Cost [(8,000 units/200 units) ` 200] 8,000
Carrying Cost (200 units `400 ½ 20/100) 8,000
Total Cost 32,16,000
(b) When Quantity Discount is accepted
(`)
Purchase Cost (8,000 units ` 384*) 30,72,000
Ordering Cost [(8,000 units/4000 units) ` 200] 400
Carrying Cost (4000 units ` 384 ½ 20/100) 1,53,600
Total Cost 32,26,000

2.78 COST AND MANAGEMENT ACCOUNTING
© The Institute of Chartered Accountants of India
3. EOQ =
*Unit Cost `400
Less Quantity Discount @ 4% = 16
Purchase Cost = 400- 16 = `384
Advise – The total cost of inventory is lower if EOQ is adopted.
Hence, the company is advised not to accept the quantity
discount.
Where,
A = Annual Demand
O = Ordering cost per order
C = Inventory carrying cost per unit per annum
(i) Calculation of EOQ
Super Grow Nature’s Own
EOQ 2 2,000 1,200
480
= 10,000 or 100 bags
EOQ 2 1,280 1,400
560
= 6, 400 or or 80 bags
(ii) Total annual relevant cost = Total annual relevant ordering costs + Total
annual relevant carrying cost
Super Grow Nature’s Own
Number of Orders =
Annual Requirement
÷EOQ
= 2,000/100
=20 orders
=1,280/80
=16 orders
Ordering Cost 20 × 1200 = ` 24000 16 × 1400 = `22,400
Carrying Cost ½ × 100 × 480 =
`24,000
½ × 80 × 560 =
`22,400
Total of Ordering and
Carrying Cost
=` 24,000+ ` 24,000
= ` 48,000
` 22,400 + ` 22,400 =
` 44,800
2AO
C
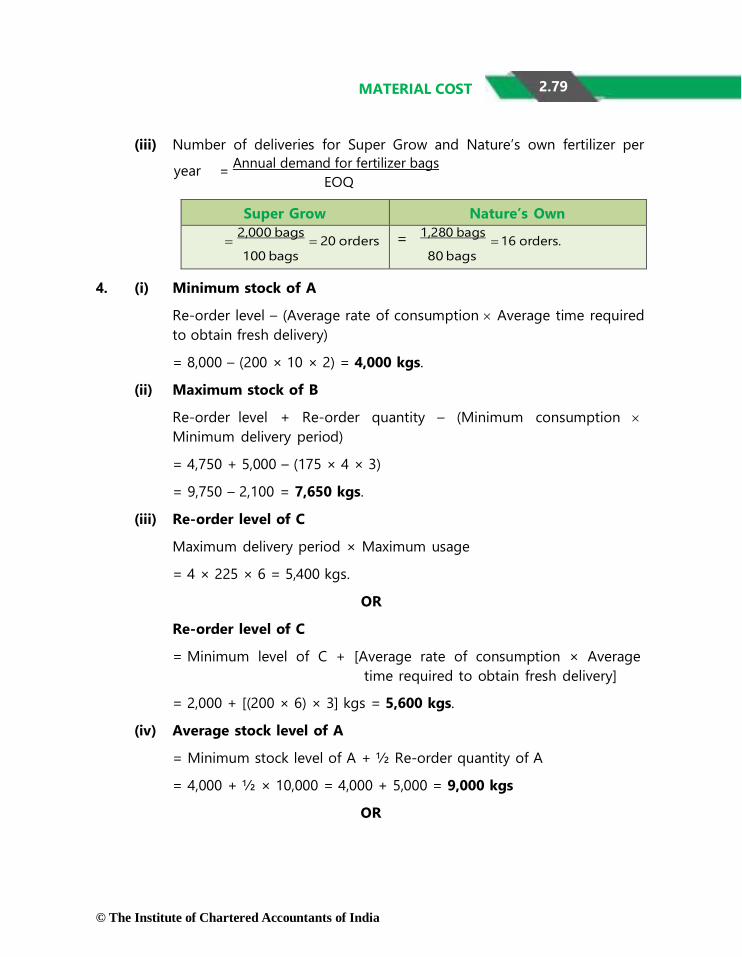
2.79 MATERIAL COST
© The Institute of Chartered Accountants of India
(iii) Number of deliveries for Super Grow and Nature’s own fertilizer per
year = Annual demand for fertilizer bags
EOQ
Super Grow Nature’s Own
2,000 bags
20 orders
100 bags
= 1,280 bags 16 orders.
80 bags
4. (i) Minimum stock of A
Re-order level – (Average rate of consumption Average time required
to obtain fresh delivery)
= 8,000 – (200 × 10 × 2) = 4,000 kgs.
(ii) Maximum stock of B
Re-order level + Re-order quantity – (Minimum consumption
Minimum delivery period)
= 4,750 + 5,000 – (175 × 4 × 3)
= 9,750 – 2,100 = 7,650 kgs.
(iii) Re-order level of C
Maximum delivery period × Maximum usage
= 4 × 225 × 6 = 5,400 kgs.
OR
Re-order level of C
= Minimum level of C + [Average rate of consumption × Average
time required to obtain fresh delivery]
= 2,000 + [(200 × 6) × 3] kgs = 5,600 kgs.
(iv) Average stock level of A
= Minimum stock level of A + ½ Re-order quantity of A
= 4,000 + ½ × 10,000 = 4,000 + 5,000 = 9,000 kgs
OR

2.80 COST AND MANAGEMENT ACCOUNTING
© The Institute of Chartered Accountants of India
Average Stock level of A
Minimum stock level of A Maximum stock level of A
2
(Refer to working note)
4,000 16,250
2 = 10,125 kgs
5. (a)
Working note:
Maximum stock of A= ROL+ ROQ – (Minimum consumption
Minimum re-order period)
= 8,000 + 10,000 – [(175 10) 1] = 16,250 kgs
Total
annual
requir
ement
(A)
Orde
r size
(Ton
ne)
(q)
No. of
orders
A/q
Cost of
inventory
A Per tonne
cost
(`)
Ordering
cost
A/q `
1200
(`)
Carrying
cost
p.t. p.a
1/2 q
20% of cost
p.t. (`)
Total
Cost
(4+5+6)
(`)
1 2 3 4 5 6 7
5,000 400 12.5
(13)*
60,00,000 15,600
48,000 60,63,600
Ton (5,000`1200) (200 ` 240)
500 10 59,00,000 12,000 59,000 59,71000
(5,000 ` 1180) (250 ` 236)
1,000 5 58,00,000 6,000 1,16,000 59,22,000
(5,000 ` 1160) (500 ` 232)
2,000 2.5
(3)*
57,00,000 3,600
2,28,000 59,31,600
(5,000` 1140) (1,000`228)
3,000 1.666
(2)*
56,00,000 2,400
3,36,000
59,38,400 (5,000` 1120) (1,500`224)
* Since number of orders cannot be in decimals, thus 12.5 orders are
taken as 13 orders, 2.5 are taken as 3 order and 1.66 orders are taken
as 2 orders.
The above table shows that the total cost of 5,000 units including
ordering and carrying cost is minimum (` 59,22,000) when the order size
is 1,000 units. Hence the most economical purchase level is 1,000 units.

2.81 MATERIAL COST
© The Institute of Chartered Accountants of India
(b) If there will are no discount offer then the purchase quantity should be
equal to EOQ. The EOQ is as follows:
EOQ =
where A = annual inventory requirement,
O= ordering cost per order and
C = carrying cost per unit per annum.
= 200 units
=
6. Basic Data:
A (Number of units to be purchased annually) = 5,00,000 units
O (Ordering cost per order) = ` 4,000
C (Annual cost of storage per unit) = ` 10
Purchase price per unit inclusive of transportation cost = ` 50
Computations:
(i) Re-ordering level (ROL)
= Maximum usage per period × Maximum
lead time
= 2,000 units per day × 15 days = 30,000 units
(ii) Maximum level = ROL + ROQ – [Min. rate of consumption ×
Min. lead time] (Refer to working notes 1 and 2)
= 30,000 units + 20,000 units – [1,000 units per
day×5 days] = 45,000 units
(iii) Minimum level = ROL–Average rate of consumption×
Average re-order-period
= 30,000 units – (1,500 units per day × 10
days) = 15,000 units
2AO
C
2×5,000units × `1,200
20% × `1,500

2.82 COST AND MANAGEMENT ACCOUNTING
© The Institute of Chartered Accountants of India
2AO
Ci
2×48,000units× `120
10%of ̀ 20
(iv) Danger level = Average consumption × Lead time for
emergency purchases
Working Notes:
= 1,500 units per day × 4 days = 6,000 units
1. Minimum rate of consumption per day
Minimum rate of+
Maximum rate of
Av. rate of =
consumption consumption
consumption 2
1,500 units per day = X units/day 2,000 units per day
2 or X = 1,000
units per day.
2. Re-order Quantity (ROQ) = �2×5,00,000 𝑢𝑛𝑢𝑢𝑡𝑠×`4,000
= 20,000 𝑢𝑛𝑢𝑢𝑡𝑠 10
7. (a) (i) Economic order quantity:
A (Annual requirement or Component ‘X’) = 4,000 units per
month × 12 months
= 48,000 units
C (Purchase cost p.u.) = ` 20
O (Ordering cost per order) = ` 120
Ci (Holding cost) = 10% per annum
E.O.Q. = = = 2,400 units
(ii) Extra cost incurred by the company:
A. Total cost when order size is equal 4,000 units:
Total cost = Total ordering cost + Total carrying cost
= A
× O + 1
Q (C )
Q 2 i

2.83 MATERIAL COST
© The Institute of Chartered Accountants of India
2
2
= 48,000 units `120
+ 1 × 4,000 units ×10% × ̀ 20
4,000 units
= ` 1,440 + ` 4,000 = ` 5,440
B. Total cost when order size is equal EOQ i.e. 2,400 units:
Total cost = 48,000 units `120
+ 1 × 2,400 units × 10% × ̀ 20
2,400 units
= ` 2,400 + ` 2,400 = ` 4,800
Extra cost that the company has to incur = (A) – (B) = ` 5,440 –
` 4,800 = ̀ 640
(iii) Minimum carrying cost: Carrying cost depends upon the size of
the order. It will be minimum on the least order size. (In this part
of the question the two order sizes are 2,400 units and 4,000 units.
Here 2,400 units is the least of the two order sizes. At this order
size carrying cost will be minimum.)
The minimum carrying cost in this case can be computed as under:
Minimum carrying cost =
8. Working Notes:
1 × 2,400 units × 10% × ` 20 = ` 2,400.
2
1. The material received as replacement from vendor is treated as fresh
supply.
2. In the absence of any information, the price of the material returned
from a user department on 20-9-20 has been taken at the price of the
latest issue made on 17-9-20. In FIFO method, physical flow of the
material is irrelevant, and issue price is based on first in first out.
3. The issue of material on 26-9-20 is made out of the material received
from a user department on 20-9-20.
4. The entries for transfer of materials from one job and department to
another on 22-9-20 and 29-9-20 respectively, do not affect the store
ledger. However, adjustment entries to calculation of cost of respective
jobs and departments are made in cost accounts.
5. The material found short as a result of stock taking has been written off
at relevant issue price.

Stores Ledger of AT Ltd. for the month of September, 2020 (FIFO Method)
RECEIPT ISSUE BALANCE
Date GRN
No
MRR
No.
Qty.
Units
Rate
(`)
Amount
(`)
Requisi-
tion No
Qty.
Units
Rate
(`)
Amount
(`)
Qty.
Units
Rate
(`)
Amount
(`)
1 2 3 4 5 6 7 8 9 10 11 12
1-9-20 — — — — — — — — 25 6.50 162.50
4-9-20 — — — — 85 8 6.50 52 17 6.50 110.50
6-9-20 26 50 5.75 287.50 — — — — 17
50
6.50
5.75 398.00
7-9-20 — — — — 97 12 6.50 78 5
50
6.50
5.75 320.00
10-9-20 — — — — Return 10 5.75 57.50 5
40
6.50
5.75 262.50
12-9-20 — — — — 108 5
10
6.50
5.75 90 30 5.75 172.50
13-9-20 — — — — 110 20 5.75 115 10 5.75 57.50
15-9-20 33 25 6.10 152.50 — — — — 10
25
5.75
6.10 210.00
17-9-20 — — — — 121 10 5.75 57.50 25 6.10 152.50
2.8
4
CO
ST
AN
D M
AN
AG
EM
EN
T A
CC
OU
NT
ING
© T
he In
stitute o
f Ch
arter
ed
Acc
ou
nta
nts o
f Ind
ia

19-9-20 38 10 5.75 57.50 — — — — 25
10
6.10
5.75 210.00
20-9-20
4
5
5.75
28.75
—
—
—
—
5
25
10
5.75
6.10
5.75
238.75
26-9-20 — — — — 146 5
5
5.75
6.10 59.25
20
10
6.10
5.75 179.50
30-9-20 — — — — Shortage 2 6.10 12.20 18
10
6.10
5.75 167.30
2.8
5
MA
TER
IAL C
OS
T
© T
he In
stitute o
f Ch
arter
ed
Acc
ou
nta
nts o
f Ind
ia
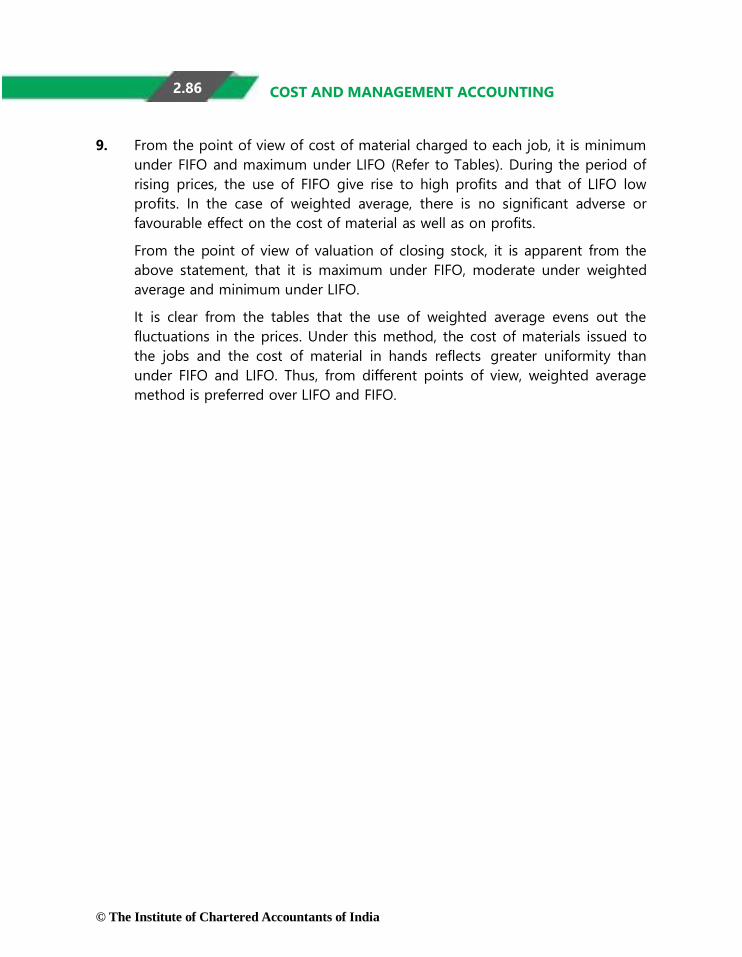
COST AND MANAGEMENT ACCOUNTING
9. From the point of view of cost of material charged to each job, it is minimum
under FIFO and maximum under LIFO (Refer to Tables). During the period of
rising prices, the use of FIFO give rise to high profits and that of LIFO low
profits. In the case of weighted average, there is no significant adverse or
favourable effect on the cost of material as well as on profits.
From the point of view of valuation of closing stock, it is apparent from the
above statement, that it is maximum under FIFO, moderate under weighted
average and minimum under LIFO.
It is clear from the tables that the use of weighted average evens out the
fluctuations in the prices. Under this method, the cost of materials issued to
the jobs and the cost of material in hands reflects greater uniformity than
under FIFO and LIFO. Thus, from different points of view, weighted average
method is preferred over LIFO and FIFO.
© The Institute of Chartered Accountants of India
2.86

Statement of receipts and issues by adopting First-in-First-Out Method
Statement of receipts and issues by adopting Last-In-First-Out method
Date Particulars Receipts Issues Balance
Units
No.
Rate
(`)
Value
(`)
Units
No.
Rate
(`)
Value
(`)
Units
No.
Rate
(`)
Value
(`)
Jan. 1 Purchase 100 1 100 — — — 100 1 100
Jan. 20 Purchase 100 2 200 — — — 100
100
1
2
100
200
Jan. 22 Issue to Job W 16 — — — 60 2 120 100
40
1
2
100
80
Jan. 23 Issue to Job W 17 — — — 40
20
2
1
80
20 80 1 80
2.8
7
MA
TER
IAL C
OS
T
© T
he In
stitute o
f Ch
arter
ed
Acc
ou
nta
nts o
f Ind
ia
Date Particulars Receipts Issues Balance
Units
No.
Rate
(`)
Value
(`)
Units
No.
Rate
(`)
Value
(`)
Units
No.
Rate
(`)
Value
(`)
Jan. 1 Purchase 100 1 100 — — — 100 1 100
Jan. 20 Purchase 100 2 200 — — — 100
100
1
2
100
200
Jan. 22 Issue to Job W 16 — — — 60 1 60 40
100
1
2
40
200
Jan. 23 Issue to Job W 17 — — — 40
20
1
2
40
40 80 2 160

Statement of Receipt and Issues by adopting Weighted Average method
Date Particulars Receipts Issues Balance
Units
No.
Rate
(`)
Value
(`)
Units
No.
Rate
(`)
Value
(`)
Units
No.
Rate
(`)
Value
(`)
Jan. 1 Purchase 100 1 100 — — — 100 1 100
Jan. 20 Purchase 100 2 200 — — — 200 1.50 300
Jan. 22 Issue to Job W 16 — — — 60 1.50 90 140 1.50 210
Jan. 23 Issue to Job W 17 — — — 60 1.50 90 80 1.50 120
Statement of Material Values allocated to Job W 16, Job 17 and Closing Stock, under aforesaid methods
FIFO
(`)
LIFO
(`)
Weighted Average
(`)
Material for Job W 16 60 120 90
Material for Job W 17 80 100 90
Closing Stock 160 80 120
300 300 300
2.8
8
CO
ST
AN
D M
AN
AG
EM
EN
T A
CC
OU
NT
ING
© T
he In
stitute o
f Ch
arter
ed
Acc
ou
nta
nts o
f Ind
ia