materials & methods t - shodhgangashodhganga.inflibnet.ac.in/bitstream/10603/6205/8/08_chapter...
TRANSCRIPT

45
.....
he research work was carried out primarily on two aspects. Firstly,
screening of antifungal properties of oil and extracts (petroleum ether,
chloroform, methanol and butanol fraction of methanol) from pericarp of
fruits of S. mukorossi collected from different sources i.e. Forest Research
Institute, Dehradun and Gyarahdevi, Pithoragarh (Uttarakhand) and
Nainatikker, Sirmaur (Himachal Pradesh) against different forest fungi.
Secondly, isolation of pure hederagenin (sapogenin moiety) was
accomplished from the butanol soluble fraction of the methanol extract of
fruit pericarp through different chromatographic methods followed by its
screening for antifungal activity. The screening was based upon the IC50,
MIC, fungicidal/fungistatic and spore/conidial germination.
3.1. The Plant: S. mukorossi Linn.
S. mukorossi, a deciduous tree of North India, also known as ‘Areetha’ to
common man. It is one of the most important trees of tropical and sub-
tropical region of Asia. It is common tree in Shivaliks and the outer
Himalayas of Uttar Pradesh, Uttarakhand, Himachal Pradesh, Haryana and
Jammu and Kashmir. S. mukorossi fruits, commonly known as soapnuts,
are used medicinally as an expectorant, emetic, contraceptive, and for
treatment of excessive salivation, epilepsy, chlorosis and migranes. It is also
used in Ayurvedic medicine for treatment of eczema, psoriasis, and for
removing freckles. Soapnut is a popular ingredient in Ayurvedic shampoos
and cleansers (Suhagia et al., 2011).
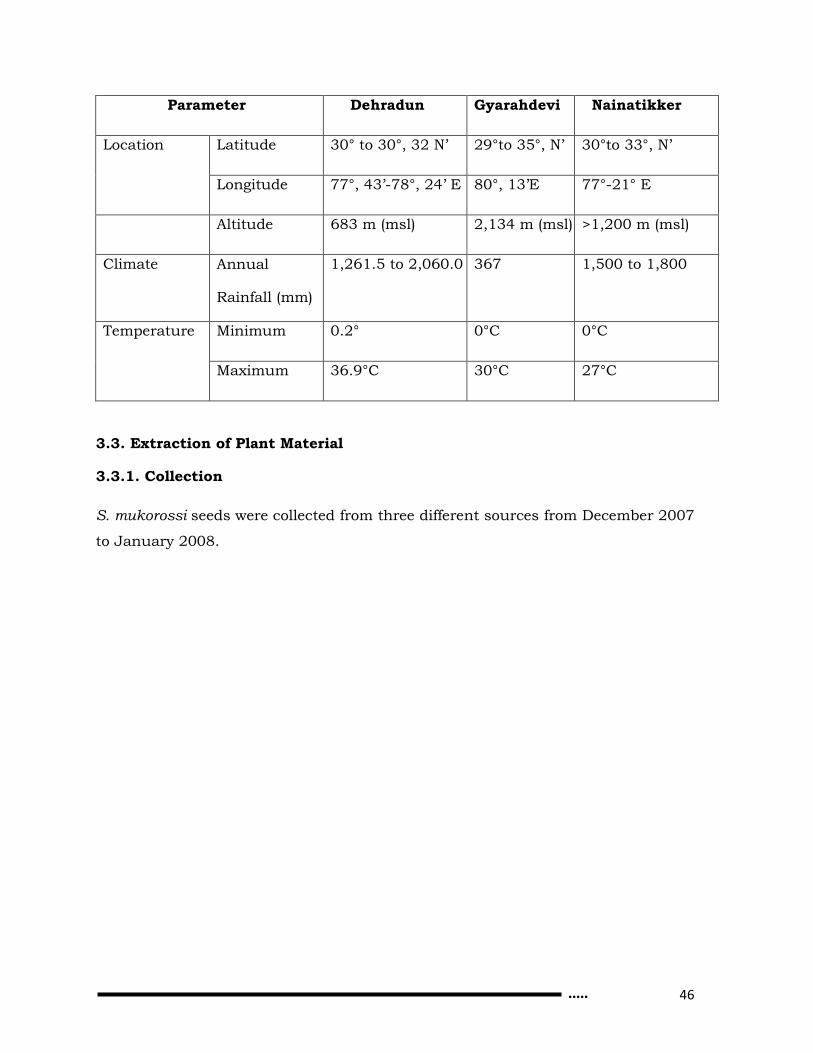
3.2. Sampling Site
The details of sampling sites are given in Table3.2.1 and Fig.3.2.1.
Table3.2.1 Details of sampling sites
T Materials & methods
46
.....
Parameter Dehradun Gyarahdevi Nainatikker
Location Latitude 30° to 30°, 32 N’ 29°to 35°, N’ 30°to 33°, N’
Longitude 77°, 43’-78°, 24’ E 80°, 13’E 77°-21° E
Altitude 683 m (msl) 2,134 m (msl) >1,200 m (msl)
Climate Annual
Rainfall (mm)
1,261.5 to 2,060.0 367 1,500 to 1,800
Temperature
Minimum 0.2° 0°C 0°C
Maximum 36.9°C 30°C 27°C
3.3. Extraction of Plant Material
3.3.1. Collection
S. mukorossi seeds were collected from three different sources from December 2007
to January 2008.

47
.....
Himachal Pradesh
Uttarakhand
S
Fig.3.2.1. S. mukorossi sampling sites (S).
Distance not to be scaled.
S
S

48
.....
3.3.2. Preparation of fatty oil and extracts
The kernels were separated from the seed coat of S. mukorossi collected
from different sources. For oil extraction, kernels were cut into small pieces
and extracted with petroleum ether and concentrated on water bath to small
volumes. Further, for preparation of extracts, pericarp was separated from
seeds. The collected pericarp was spread on blotter paper sheet and air
dried in shade. The dried pericarp was then cut into pieces and extracted
successively with the solvents of increasing polarity viz. petroleum ether,
chloroform and methanol in a Soxhlet apparatus. These extracts were
concentrated on water bath to small volumes (Singh & Tripathi, 1993). Later
on, methanol extract was fractionated into ethyl acetate and butanol
fractions. The yield of extracts was determined on moisture free basis
(Table3.3.2.1.).
Table3.3.2.1. Yield of fatty oil and extracts (%) from different sources
of S. mukorossi
3.4. Acid Hydrolysis of Butanol Fraction of Methanol Extract of
S. mukorossi Pericarp
Oil/Extract Source/Yield (%)
Dehradun Gyarahdevi Nainatikker
Oil 41.0 42.0 33.0
Petroleum ether 0.2 0.3 0.3
Chloroform 2.5 3.1 5.6
Methanol 60.0 68.7 61.8
Butanol 38.0 40.0 42.0

49
.....
Based on higher IC50 at the lower concentrations, butanol fraction of methanol
extract was selected for acid hydrolysis, so that, it could be used in further
experiments. The butanol fraction is reported to contain glycosides with
hederagenin as sapogenin/aglycone moiety. To increase the antifungal efficiency of
the saponins, sugar moiety was removed through acid hydrolysis to get hydrolyzed
saponin containing hederagenin. In the indigenously standardized method, butanol
fraction was refluxed with aqueous 2N HCl under reflux for 2 h. After reflux, the
hydrolyzed mass was neutralized by adding NaOH. It was washed with chloroform
(3-4 times) and finally, with water (4-5 times) to remove extraneous impurities. The
hydrolyzed saponin containing hederagenin was obtained and later isolated in pure
form through column chromatography.
3.5. Isolation of Pure Compound
The following analytical techniques have been used for qualitative and quantitative
isolation:
3.5.1. Column chromatography
The technique basically involves the application of the mixture of the compounds to a
homogenously packed glass column with adsorbent (silica gel, alumina, etc.) and
subsequent sequential elution of individual compounds with appropriate solvent or by
gradient elution. The column is simply a glass tube fitted with a tap at one end, with
dimensions such that the diameter to length ratio is in the range 1:10 to 1:30. The size
(volume) of the column required for any particular separation can be roughly
calculated once the weight of the mixture to be loaded to the column is known. It is
generally considered that the separation based on partitioning (most cellulose and
silica chromatography) the sample to packing ratio should be in the range of 1:50 to
1:500. The latter ratio being more appropriate to complex mixture than the former to
simple mixture (Ravindranath, 1989).
3.5.1.1. Column chromatography of hydrolyzed saponin
The hydrolyzed saponin was dissolved in minimum quantity of chloroform and
methanol mixture (4:1), adsorbed onto silica gel, dried and subjected to column

50
.....
chromatography over gel using chloroform and methanol in ratio of 3:1 as eluent. The
details of column are as follows:
Weight of extract = 15 g
Weight of silica gel for adsorbing extract = 54.95 g
Weight of silica gel used for packing column = 400 g
Solvent used for packing column = Chloroform
Retention volume of the column = 700 ml
Volume of each fraction collected = Fraction 1-110=500 ml
Fraction 111-125=2000 ml
Fraction 126- 215=100 ml
Fraction 216- 220=500 ml
Fraction 221- 280=500 ml
Different fractions of different volumes were collected and combined on the
basis of their TLC studies. The column on elution with chloroform and chloroform
methanol mixtures with increasing polarity afforded 280 fractions detailed in
Table3.5.1.1.
Table3.5.1.1. Fraction details collected from the hydrolyzed saponin
of S. mukorossi pericarp
Solvent system Fractions no. Volume (ml)
Pure Chloroform (100 %)
1-110 500
111-125 2000
Chloroform: Methanol (99:1) 126- 215 100
Chloroform: Methanol (97:3) 216- 220 500
Chloroform: Methanol (97:3) 221- 280 500
51
.....
The above fractions were examined on TLC using different solvent
systems indicating the presence of compounds present therein. The colour
of the spot was obtained by spraying with 5 per cent sulphuric acid and Rf
value was calculated as below:
Retention factor (Rf) value =
The compound i.e. hederagenin was eluted in fraction no. 216 to 220 and
was collected as colourless crystals in pure form. Later on, hederagenin
collected from different sources was used for evaluation of antifungal
properties.
3.6. Identification of Hederagenin
3.6.1. Ultraviolet Visible Spectroscopy Range
Ultraviolet and visible spectroscopy deals with the recording of the
absorption of radiations in the ultraviolet and visible region of the
electromagnetic spectrum. UV of colourless compounds are measured in the
range of 200-400 nm and for coloured compounds in the range of 400-700
nm. UV-VIS spectroscopy mainly used for detecting the presence and
elucidating the nature of the conjugated multiple bonds or aromatic rings. A
solvent widely used for UV spectroscopy is 95 per cent ethanol. Other
solvents employed are water, methanol, hexane, petroleum ether (Yadav,
1995 and Harborne, 1998).
Chemito, 2700 Spectrophotometer (India) was used to confirm the absence
of conjugated bonds in the pure compound through UV spectroscopy.
3.6.2. Infrared Spectroscopy
IR spectra may be measured on plant substances in an automatic recording
IR Spectrophotometer either in solution in chloroform or carbon
tetrachloride (1-5%), as a mull with nujol oil or in the solid state, mixed with
potassium bromide. The range of measurement is from 4,000 to 667 cm-1
Distance travelled by solvent
Distance travelled by spot

52
.....
shows spectral bands or peaks due to the vibrations of individual bonds or
functional groups in the molecule under examination. The region below
1,200 cm-1 shows bands due to the vibrations of the whole molecule and
because of its complexity is known as the ‘fingerprint region’. IR
spectroscopy can also usefully contribute to structural elucidation, when
new compounds are encountered in plants (Harborne, 1998).
Shimadzu, FTIR 8400 Spectrophotometer (Japan) was used to detect
the characteristic absorptions of pure compound in IR spectrum.
3.6.3. Nuclear Magnetic Resonance Spectrosopy (NMR)
NMR spectroscopy is the conventional method for the structure
determination of natural products. The 1H and 13C NMR spectra reflect the
distribution of electrons surrounding the hydrogen and carbon nuclei and
are sensitive techniques to provide evidences for configurational and
conformational characteristics. The introduction of Fourier transformational
(FT) technique in the pulsed NMR in 1966 by Ernst and Anderson (Ernst,
1966) started a new era in this branch of spectroscopy.
3.6.3.1. 1H-NMR Spectroscopy
Proton NMR spectroscopy essentially provides a means of determining the
structure of an organic compound by measuring the moments of its
hydrogen atoms. In most compounds, hydrogen atoms are attached to
different groups (as –CH2, -CH3, -CHO, -NH2, >CHOH, etc.) and the proton
NMR spectrum provides a record of the number spectrum appears in the
range 0-10 ppm downfield from the reference signal of tetramethylsilane
(TMS). The structural information that proton NMR provides is based on two
physical phenomena, chemical shift (ppm) and scalar coupling constants
(J). These data are frequently applied to assign relative stereochemistry and
to analyze the conformation of natural products.
3.6.3.2. 13C-NMR Spectroscopy
The most abundant isotope 12C has no overall nuclear spin, having an equal
number of protons and neutrons. The 13C isotope, however, does have spin

53
.....
1/2, but is only 1 per cent abundant. 13C chemical shift has a range of about
220 ppm relative to the resonance of TMS. 13C-NMR spectra are more highly
resolved and, in most cases, each carbon within the molecule can be
assigned to a separate signal. Different substituted carbon atoms give shifts
within specific ranges, for example, aliphatic carbon atoms give shifts
between 0 to 40 ppm and aromatic carbon atoms give shifts between 110 to
150 ppm. This procedure is widely used in structural analysis, although the
need to have a sample weighing about 10 mg is still a limitation (Harborne,
1998).
The δ values of the 1H-NMR and 13C NMR spectrum of pure compound
were detected through NMR spectroscopy.
3.7.High-Performance Thin-layer Chromatography Densitometric
Quantification of Hederagenin
HPTLC is a versatile, powerful but basically a simple separation technique.
HPTLC provides the rapid and positive analysis of plant constituents leading
to semi quantitative/quantitative information on chief constituents of the
formulation. It can provide fingerprinting for monitoring the identity and
purity of plant constituents.
Today HPTLC has a firm place among various analytical techniques as
a reliable method for quantification at micro, nano and even at pictogram
level, even when present in complex formulations. HPTLC has its own
specific value, the economic considerations do weigh in favor of HPLTC
(Sethi, 1996).
3.7.1. Apparatus
(a) Spotting device-Linomat 5 automatic sample applicator (CAMAG,
Switzerland).
(b) Syringe-100 µL.
(c) HPTLC chamber-20 x 10 cm plates; HPTLC aluminium sheet pre-coated with
silica gel 60F254, Merck KGaA, Germany).

54
.....
(d) Densitometer- TLC scanner3 linked to win CATS software (CAMAG). Scanner
mode- Scanning wavelength: 254 nm; lamp: Tungsten; measurement type:
remission; measurement mode: absorption; optical filter: second-order; detection
mode: automatic.
Scanner settings- Slit dimension: 5.00 x 0.45 mm, micro; optimize optical system
for max: light; scanning speed: 20 mm/s; data resolution: 100 µm/step.
Experimental conditions : Temperature, 25°C± 2°C.
3.7.2. Preparation of sample solution
Two grams of the powdered pericarp of S. mukorossi from different sources
were hydrolyzed with 50 ml of 3.5 M aqueous sulfuric acid under reflux for
6 h at 100°C on a water bath. The solution was then allowed to cool to room
temperature and filtered. The marc was washed with water, neutralized with
10 per cent sodium carbonate solution, washed with water again, and dried
in hot air oven at a temperature not exceeding 50°C. After drying, the marc
was extracted with chloroform under reflux (25 ml X 4) on a water bath for a
period of 1 h. The combined chloroform extract was concentrated to dryness
under vacuum (Kalola et al., 2008).
3.7.3. Preparations of sample solutions of hederagenin
Different solutions of hederagenin as obtained above from different sources
were prepared by dissolving 10 mg of hederagenin in 5 ml (Dehradun) and
10 ml (Gyarahdevi and Nainatikker) of mixture of 4 per cent of methanol in
chloroform. Ten grams of standard hederagenin was also dissolved in 10 ml
of mixture of 4 per cent of methanolic chloroform.
3.7.4. Preparation of the calibration graph of hederagenin
Ten microlitres of the standard solution of hederagenin (200 to 300 ng/spot) from
Dehradun source and 16 micro litres from Gyarahdevi and Nainatikker sources
were applied in duplicate alternatively with 2 to 8 micro litres of standard solution
of hederagenin (200 to 800 ng/spot) onto a pre-coated HPTLC plate using the
automatic samples plotter (band length: 6 mm, distance between the tracks: 13
mm). The plate was developed in an HPTLC chamber containing the mobile phase
55
.....
i.e. methanolic chloroform (8%), at 25° ±2°C. The plate was developed to a distance
of 80 mm. It was dried at room temperature. The bands were scanned at 254 nm
and a calibration graph was constructed by plotting area under the peaks vs. the
corresponding standard concentrations of hederagenin.
3.7.5. Quantification of hederagenin in the samples
The peak areas were recorded. The amount of hederagenin in samples from
different sources was calculated using the linear regression equation derived from
the calibration graph of hederagenin.
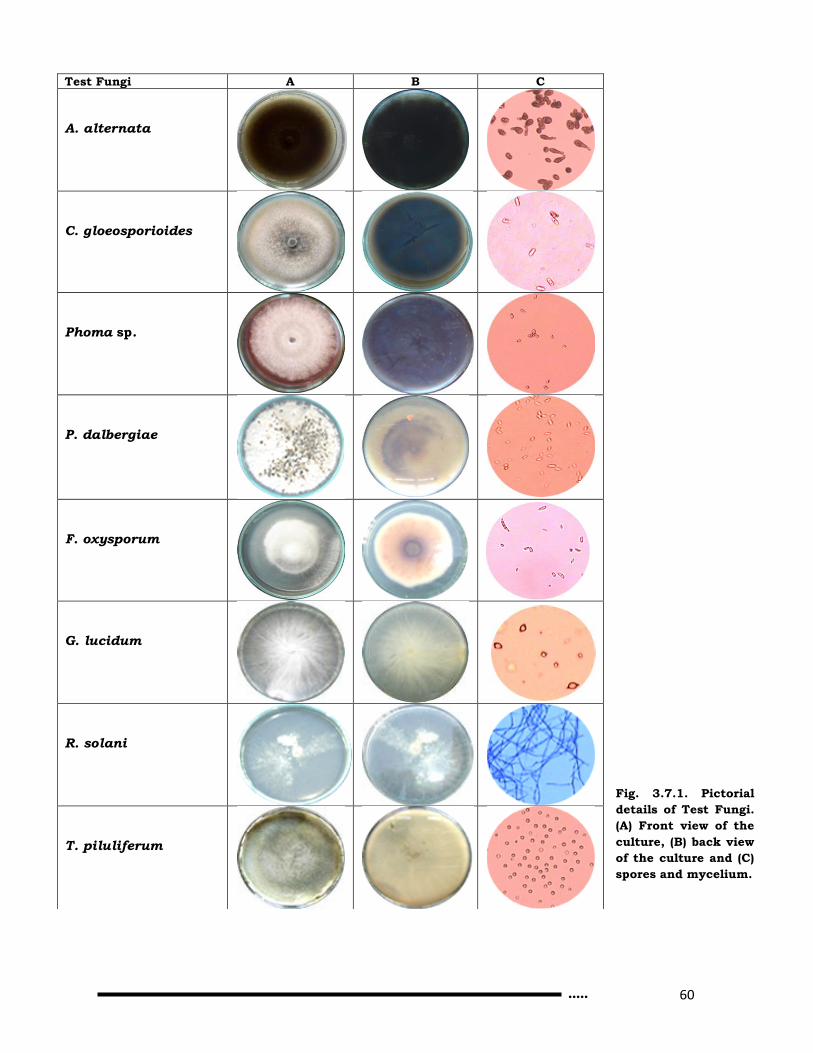
3.8. Test Fungi
Eight forest fungi were selected for bioassay viz. Alternaria alternata, Colletotrichum
gloeosporioides, Phoma sp., Phomopsis dalbergiae, Ganoderma lucidum, Fusarium
oxysporum, Rhizoctonia solani and Trichoderma piluliferum. The rationale for short-
listing these fungi is ecological, host specificity, plant part infectivity, wider
presence, economic loss, etc. The cultural details are as follows:
3.8.1. Alternaria alternata
Family: Pleosporeaceae
Host: Populus deltoides
Disease symptoms: Leaf spot
Characteristics: Alternaria is a genus of ascomycete fungi. Alternaria species are
known as major plant pathogen. It is commonly recognized as a ubiquitous,
cosmopolitan species. Colonies are dark olive green to brown, floccose to velvety
(heavily sporulating, Fig.3.7.1.). Colonies become pleomorphic over time, and lose
the ability to sporulate with subsequent transfer. Plant pathogen most commonly
found on weakened plants, soil, dead organic debris, on food stuffs and textiles
(Rotem, 1994).
3.8.2. Colletotrichum gloeosporioides
Family: Glomerallaceae

56
.....
Host: Dalbergia sissoo Roxb.
Disease symptoms: Leaf spot and blight
Characteristics: Colletotrichum and its telemorph Glomerella have been implicated
in plant diseases. Colonies variable, greyish white to dark grey (Fig.3.7.1.); aerial
mycelium even and felted or in tufts associated with conidiomata, reverse unevenly
white to grey or darker especially with age; appressoria clavate, ovate, obovate,
sometimes lobed, sepia brown, 6-20 x 4-12 m; conidia formed in pale salmon
masses, straight, cylindrical, apex obtuse, base truncate, 12-17 x 3.5-6.0 m;
conidia typically elongated with rounded ends and characteristically, slightly
narrow in the middle than at the end; produced dark brown long setae in the
acervulus (Sutton, 1992).
3.8.3. Phoma sp.
Family: Sphaeropsidaceae
Host: P. deltoides
Disease symptom: Leaf spot
Characteristics: It is prominent during late monsoon (September– October).
Septate hyphae, pycnidia, conidia, and sometimes, chlamydospores are present.
Hyphae are septate to brown while pycnidia are the fruiting bodies that are large,
dark in colour, round to pyriform in shape with size ranging from 70-100 µm in
diameter, and with one to several openings called the ostioles on their surface from
which the conidia are released outside (Fig.3.7.1.). Conidia are hyaline, oval-
shaped, unicellular and each conidum usually has two oil droplets inside;
chlamydospores are brown, may appear in long chains or solitary, and may either
be unicellular or multicellular and alternarioid, which resembles Alternaria in
appearance (Boerema, et al., 2004).
3.8.4. Phomopsis dalbergiae
Family: Valsaceae

57
.....
Host: D. sissoo
Disease symptom: Leaf spot
Characteristics: Pycnidia dark olivaceous to dark brown, globose, innate, finally
erumpent, glabrous, 96.9-220.4 m in diameter, average 136 m, ostiole round to
somewhat oval, centric, usually about 20 m in diameter, occasionally up to 40 m
diameter; stylospores hyaline, single-celled, smooth, elongated filiform usually bent
or hooked, and acute to obtuse 6.0-13.2 x 1.2-2.5 m, average 11.1 x 1.5 m;
conidiophores simple; conidia single celled, hyaline ovoid to cylindrical, smooth,
ends usually obtuse, 4.0-6.7 x 1.3-3.33 m, average 5.7 x 2.3 m (Fig.3.7.1.;
Rensberg et al., 2006).
3.8.5. Fusarium oxysporum
Family: Nectriaceae
Host: Acacia nilotica (L.) Willd. ex Delile
Disease symptom: Wilt
Characteristics: Colonies fast growing on PDA; mycelium delicate white or peach
but usually with a purple tinge, sparse to abundant than floccose, becoming felted
and sometimes wrinkled in older cultures (Fig.3.7.1.); conidia of two types,
microconidia generally abundant, variable, oval – ellipsoid cylindrical, straight to
curved, 5-12 x 2.2-3.5 m, borne on simple philades arising laterally on the
hyphae or from short sparsely branched conidiophores; macroconidia thin walled,
generally 3-5 septate, fusoid- subulate and pointed at both ends; occasionally
fusoid-falcate macroconidia are found with a somewhat hooked apex and a
pedicellate base: 3-septate 27-46 x 3-5 m, 5-septate 35-0 x 3-5 m; pointed at
both ends; chlamydospores, both smooth and rough walled, generally abundant,
terminal and intercalary, generally solitary but occasionally formed in pairs or in
chains (Shanmugam et al., 2006).
3.8.6. Ganoderma lucidum

58
.....
Family: Ganodermataceae
Host: D. sissoo
Disease symptom: Root rot
Characteristics: Growth slow to rapid; advancing zone: white, even appressed;
hyphae hyaline, thin-walled branched; aerial mycelium; hyphae
as in advancing zone, thin to slightly thick walled; fibre hyphae hyaline, branched
aseptate, with narrow lumen, 1.4–2.9 m in dia; with frequent clamp connections
(Fig.3.7.1.); chlamydospores hyaline, slightly thick-walled, terminal to intercalary,
ellipsoid, sometime in chains, 8.8–11.8 m x 3.7–5.9 m; cuticular cells from
crustose layer hyaline to light brown, round to irregular in shape, closely packed;
staghorn hyphae with projections, hyphal system is usually trimitic, occasionally
dimitic, generative hyphae, hyaline, thin walled, branched, septate or not, and
clamped; basidiospores, ovoid or ellipsoid-ovoid, occasionally cylindric-ovoid and
always truncate at the apex; colony, white to pale yellow and even, felty to floccose
at optimum temperature on PDA (Flood et al., 2000).
3.8.7. Rhizoctonia solani
Family: Ceratobasidiaceae
Host: Eucalyptus hybrid
Disease symptom: Post - emergence damping - off
Characteristics: Colony white, hyphae broad and coarse (8-12 m in dia),
colourless when young, but turning dark brown with age (Fig.3.7.1.); young
branches inclined at angles of 45°– 90° from the direction of growth of the parent
hyphae and usually constricted at the point of origin; a septum or cross-wall
always present near the base of the branch; sclerotia germinate by hyphal growth;
persists in soil as hyphae or sclerotia; infection often starts from sclerotia; hyphae
penetrate living cells through susceptible dead tissues or invade directly through
cracks and wounds; invading hyphae grow rapidly through the host tissue causing
it to turn brown and collapse (Garcia et al., 2006).

59
.....
3.8.8. Trichoderma piluliferum
Family: Hypocreaceae
Host: Isolated from rhizosphere of D. sissoo
Characteristics: Colonies grow rather slowly at room temperature and form a
smooth surfaced and almost translucent or watery white sparse mycelial mat over
the surface of the medium (Fig.3.7.1.); mycelium composed of smooth-walled,
septate and colourless hyphae up to 10 m dia; chlamydospores infrequent; main
branches of the conidiophores, 5- 7 m dia, produce many side branches; the apex
of each branch terminated by a phialide; highly ramified conidiophores usually
arise in compact tufts; phialides short and plump, flask shaped to almost pyriform,
narrower at the base than the middle and attenuate abruptly into slender conical
necks, 4.5-6.5 x 2.8–3.5 m but the terminal phialide may attain 10 m; arise in
somewhat irregular whorls of two to five immediately beneath the terminal
phialides; the phialospores globose; 2.5–3.5 m dia; base of the spore usually
appear as a truncate apiculus (El-Meleigy et al., 2010).
3.9. Testing of Fatty Oil, Extracts and Hederagenin
The essential oil extracts and hederagenin of S. mukorossi were tested for their
toxicity against fungal pathogens by the Poisoned Food Technique (Grover &
Moore, 1962) on the basis of Inhibitory Concentration (IC50). Minimum Inhibitory
Concentration (MIC) of hederagenin was worked out by same technique. The
nature of the toxicity (fungicidal & fungistatic) of the hederagenin was determined
following methodology of Iqbal et al. (2004). Hederagenin also exhibited marked
effect on germination of fungal spores/conidia by the slide germination method
(Ogbebor & Adekunle, 2005).
60
.....
Fig. 3.7.1. Pictorial
details of Test Fungi.
(A) Front view of the
culture, (B) back view
of the culture and (C)
spores and mycelium.
Test Fungi A B C
A. alternata
C. gloeosporioides
Phoma sp.
P. dalbergiae
F. oxysporum
G. lucidum
R. solani
T. piluliferum

61
.....
3.9.1. Inhibitory Concentration (IC50)
The toxicity of extracts (petroleum ether, chloroform, methanol & butanol) of
pericarp of S. mukorossi from different sources was determined against eight test
fungi. Further, the toxicity of hederagenin from different sources was determined
against three test fungi i.e. Phoma sp., R. solani and T. piluliferum.
A culture of the test fungi was grown on Potato Dextrose Agar (PDA) medium
for certain period (generally 7 days) at the optimum temperature (25°±1°C) for
growth. Petroleum ether and chloroform extracts from all three sources were
dissolved in acetone solvent to prepare the concentration (per cent). Methanol and
butanol extracts from all three sources were dissolved in sterilized distilled water to
make concentration (per cent). The solvents used for dissolving were taken on the
basis of polarity. PDA supplemented with different plant extracts at four
concentrations (0.5, 1.0, 1.5 & 2.0 %) and hederagenin at five concentrations (200,
400, 600, 800 & 1000 ppm) were poured in the petri plates under aseptic
conditions.
During experimentation, it was observed that hederagenin has severe
solubility problem. It was practically insoluble in water and soluble only in
chloroform-alcohol mixture. Further, it precipitated soon after pouring into
medium, PDA. The dissolution was also attempted in acetone in which, it was
insoluble. The compound was soluble in DMSO, however, it precipitated out in
PDA. After repeated trails in different solvents it was observed that the compound
is soluble in ethyl alcohol after constant shaking at a temperature of 78oC for 1 hr.
Therefore, hederagenin was dissolved into ethyl alcohol in following ratio i.e. 200
ppm in 1 ml, 400 ppm in 2 ml and so on. As hederagenin is slowly soluble in ethyl
alcohol, therefore, vial containing the mixture was placed in water bath for few
minutes at 90°C. Then, it was mixed with PDA. These plates were left in laminar air
flow for two days, so that, the solvent evaporated over time. This precaution was
observed to avoid any adverse effect of the solvent on the fungal growth. After that,
inoculation of test fungi was done.

62
.....
After solidification, small disc (0.7 cm dia) of the 10-day-old fungus culture
was cut with a sterile cork borer and transferred aseptically upside down at the
centre of a Petri dish. Suitable checks were maintained where the culture discs
were grown under same conditions on PDA without extract/hederagenin. Solvent
checks (a solvent which is used for dissolving extract i.e. acetone for extracts and
alcohol for hederagenin) were maintained to check out the inhibitory effect of
solvent on fungi. Petri plates were incubated at 25°±1°C. The radial growth of
fungus colony was measured after every twenty-four hours till the fungus in the
control plate completely occupied it. Three replications were maintained. The
antifungal activity was evaluated by measuring the relative growth of fungus in
treatment vis-a-vis control.
The percent growth inhibition over control was worked out using the
formula of Vincent (1927).
I = C-T/C x 100
Where,
I is inhibition per cent,
C is colony diameter in control (mm) and
T is colony diameter in treatment (mm).
3.9.2. Minimum Inhibitory Concentration (MIC)
The MIC was determined as that concentration above which the fungal
growth was totally suppressed and below which the fungus resumed growth.
Hederagenin isolated from Gyarahdevi source was used to find out the
minimum inhibitory concentration. Experiments were carried out by above
mentioned poisoned food technique using different concentrations of
compound i.e. hederagenin against all eight fungi. Also, hederagenin from
rest of the two sources i.e. Dehradun and Nainatikker were tested at the
MIC achieved by Gyarahdevi source.

63
.....
3.9.3. Fungicidal and fungistatic activity
The nature of the toxicity (fungicidal & fungistatic) of hederagenin isolated
from different sources against the eight test fungi was determined The
fungal discs from the MIC Petri plates of all three sources were transferred
to PDA and incubated at 25°±1°C for seven days. Plate showing growth after
the incubation period represented fungistatic activity and no growth on
plate indicated fungicidal nature of toxicity of the hederagenin.
3.9.4. Spore/conidial germination
Spores/conidia from 10- day- old culture of A. alternata, C. gloeosporioides,
Phoma sp., P. dalbergiae, G. lucidum, F. oxysporum, R. solani and T.
piluliferum on PDA plates were taken. Conidial suspensions were made in 10
ml sterilized distilled water. The spores/conidia 30µmlwere examined and
counted with the help of haemocytometer (Aneja, 2003). The number of
spores/conidia of fungi in one ml of sterilized distilled water were as follows:
Table3.8.4. Count of spores/conidia (no./ml of sterilized distilled
water) of different test fungi
Fungus Spores/Conidia (no./ml)
A. alternata 2.50 x 10⁶
C. gloeosporioides 1.25 x 10⁶
Phoma sp. 2.25 x 10⁶
P. dalbergiae 1.05 x 10⁶
F. oxysporum 1.85 x 10⁶
G. lucidum 1.40 x 10⁶
T. piluliferum 2.05 x 10⁶
Hederagenin isolated from of S. mukorossi pericarp of Gyarahdevi
source was dissolved in alcohol. Different concentrations of hederagenin
were placed in the cavity of the depression slide and allowed to air dry.
Spore suspension of fungi was prepared in sterilized distilled water. The
suspension was added to the dried hederagenin and thoroughly mixed. The
cavity slides were incubated in Petri dish moist chamber. Three replications

64
.....
were maintained for each treatment. The spore suspension in solvent
(alcohol) and sterilized distilled water (without compound) served as control.
The spores were observed for germination in four different microscopic fields
(under 40X) and recorded after twenty-four and forty-eight hours to
calculate percent inhibition of spores/conidia germination using Vincent
formula (1927).
I = C-T/C x 100
I = Inhibition of spore germination,
C= germination in control and
T = germination in treatment.
3.10. Statistical Analysis
Data were analyzed using Genstat software (GEN532-2). Complete
Randomized Design (CRD) was followed for statistical analysis. Two-way
analyses were used for the data of extracts, hederagenin and spore
germination. All the data was analyzed after angular (arc-sin)
transformation of values. Treatment means were compared using CD at 5
per cent level of significance.