materials packet · 2019-03-20 · 2 introduction the materials packet contains the originals for...
TRANSCRIPT
MATERIALS PACKET
The Dynamics of Climate
A Teacher Professional Development Toolkit
for Climate Science
Daniel P. Shepardson and Dev Niyogi
Purdue University
Departments of Curriculum and Instruction and Earth, Atmospheric, and Planetary Sciences Purdue University 100 N. University St. West Lafayette, IN 47907-2098
This teacher professional development program and toolkit were developed with a grant from the National Science Foundation, Geoscience Education program with support from the Departments of Curriculum and Instruction, Earth, Atmospheric, and Planetary Sciences, and Agronomy, Purdue University.
Copyright ©2013
The work reported in this document was supported by the National Science Foundation (NSF), award number GEO-1034821. The opinions, findings, and conclusions or recommendations expressed in this document are those of the authors and do not necessarily reflect the views of the NSF.
1
Project Directors
• Dan Shepardson (PI), Professor of Geoenvironmental and Science Education,
Departments of Curriculum and Instruction and Earth, Atmospheric, and Planetary
Sciences, Purdue University
• Dev Niyogi (CoPI), Indiana State Climatologist and Associate Professor, Departments of
Agronomy and Earth, Atmospheric, and Planetary Sciences, Purdue University
Development Team
• Adam Baker, Meteorologist, National Weather Service- Indianapolis, IN
• Cheryl Bell, External Evaluator, Bell Academic Opportunities Inc., Schererville, IN
• Mary Cutler, Naturalist, Tippecanoe County Parks & Recreation, IN
• Olivia Kellner, Graduate Student, Earth, Atmospheric, and Planetary Sciences, Purdue
University. Meteorologist, National Weather Service – Milwaukee/Sullivan, WI
• Mark Koschmann, Science Teacher, St. John’s Lutheran School, Midland, MI
• Ted Leuenberger, Retired science teacher
• Ian Pope, Graduate Research Assistant, Earth, Atmospheric, and Planetary Sciences,
Purdue University
• Hans Schmitz, Purdue Extension, Gibson County, Agriculture and Natural Resources
Extension Educator
• Jan Sneddon, Director of Community Partnerships, Earth Force
Tippecanoe County
Park & Rec. Dept.

2
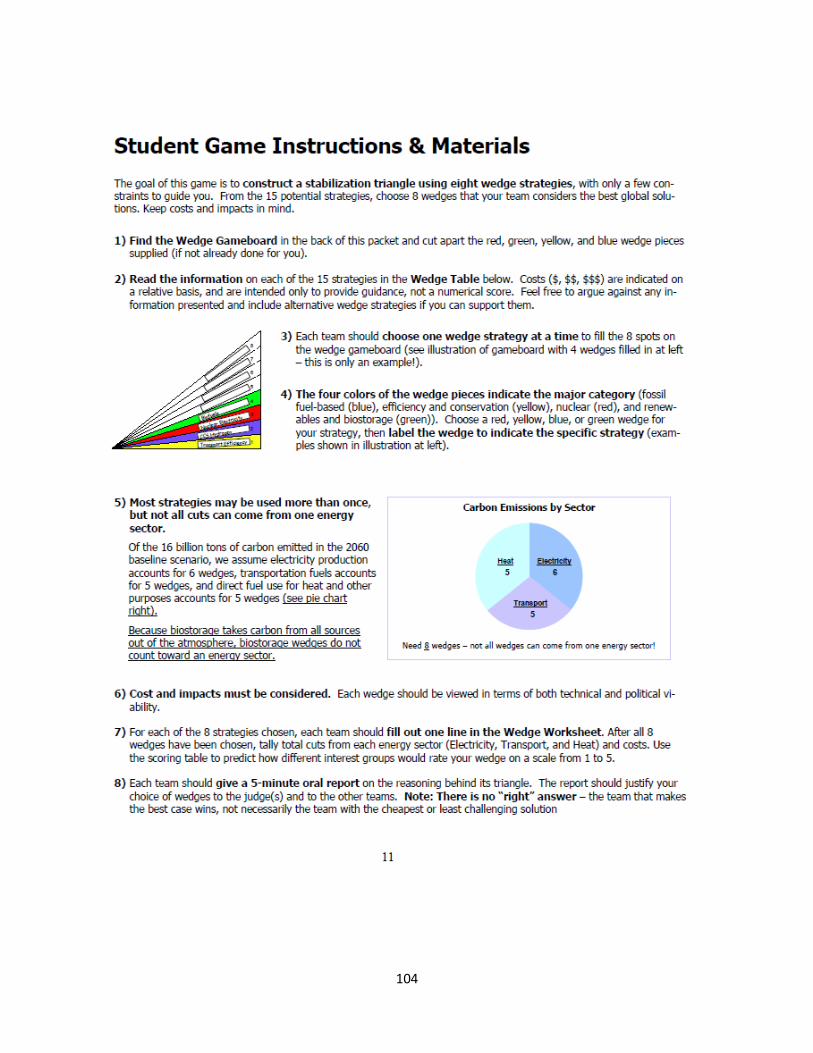
Introduction The Materials Packet contains the originals for printing the handouts, data sets, activity materials, and
assessment instruments for use in the professional development workshop. The Presenter Guide
provides a detailed description of the workshop and PowerPoint program, highlighting the main points
of each slide and providing an outline for each activity. It is designed to assist the presenter (facilitator)
in implementing the workshop. The workshop activities engage participants in analyzing and
interpreting climatic data sets and visualizations. Pedagogically, the workshop promotes active learning
and collaboration. The manual, The Dynamics of Climate: A Teacher Professional Development
Toolkit for Climate Science, provides an overview of the toolkit, guidelines for conducting effective
workshops, and a listing of available resources and background readings.
Workshop Materials Checklist
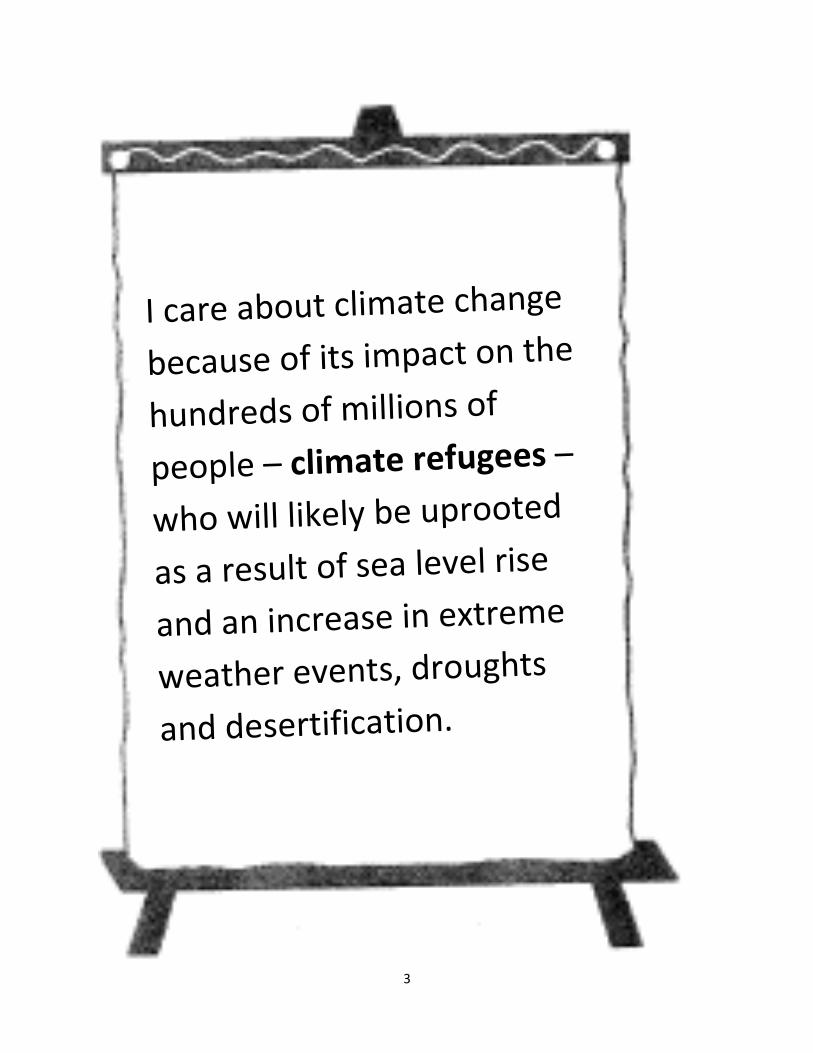
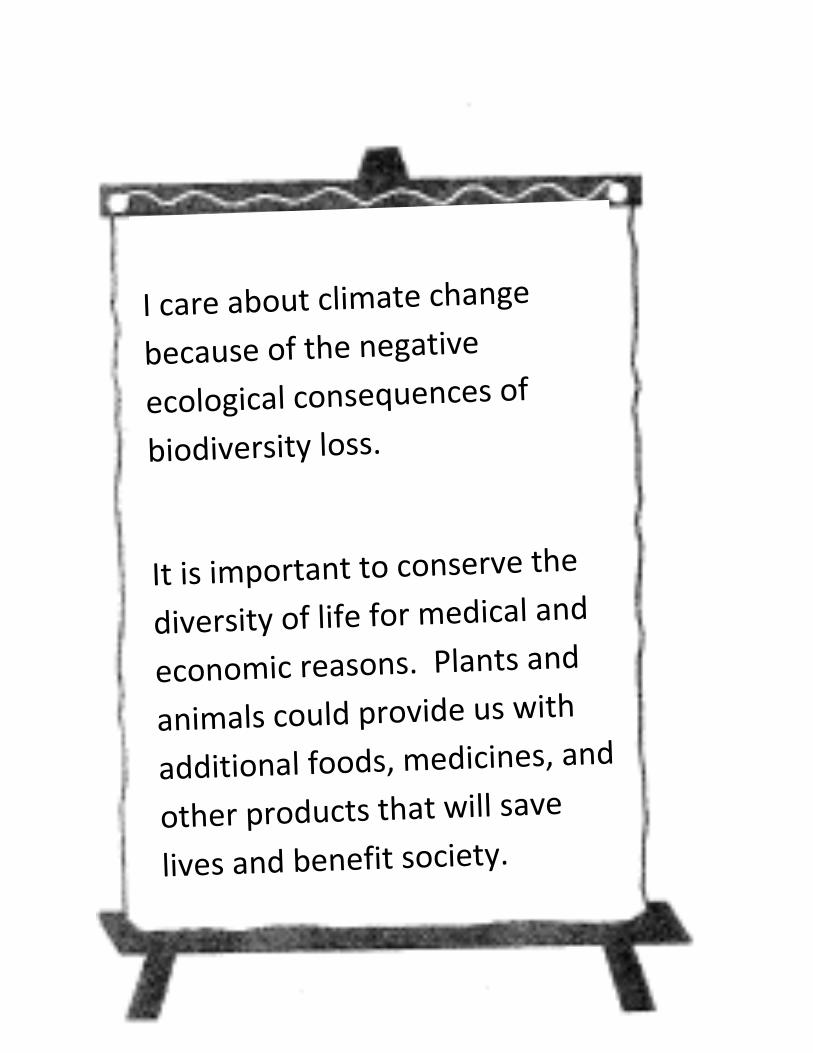
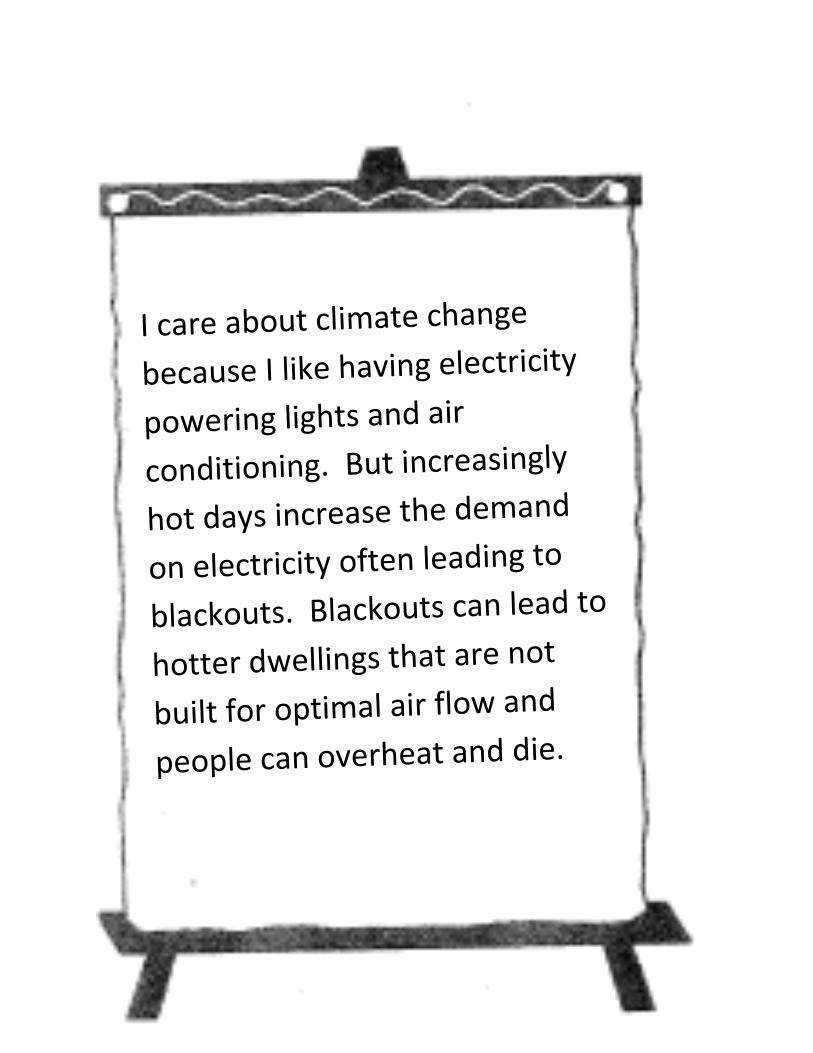
Sign-in sheet Statements about climate change, “Why Care about Climate Change?”
Masking tape, chart paper and markers for “Draw a Climate System” activity
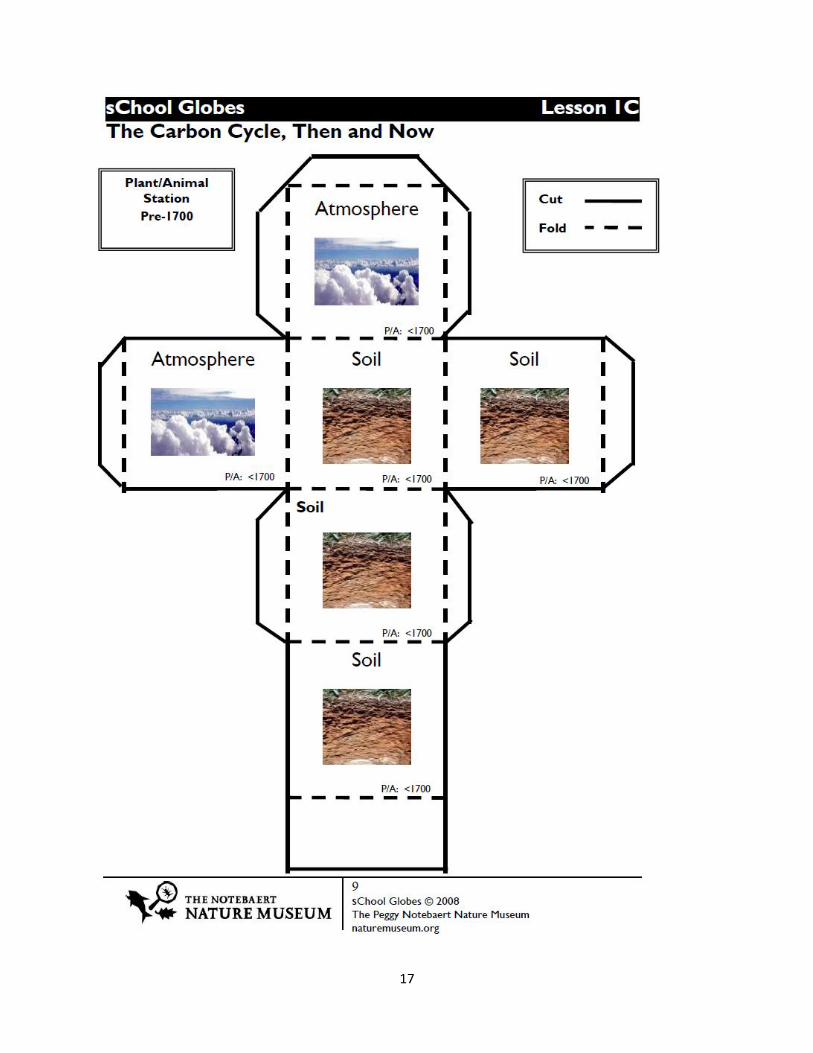
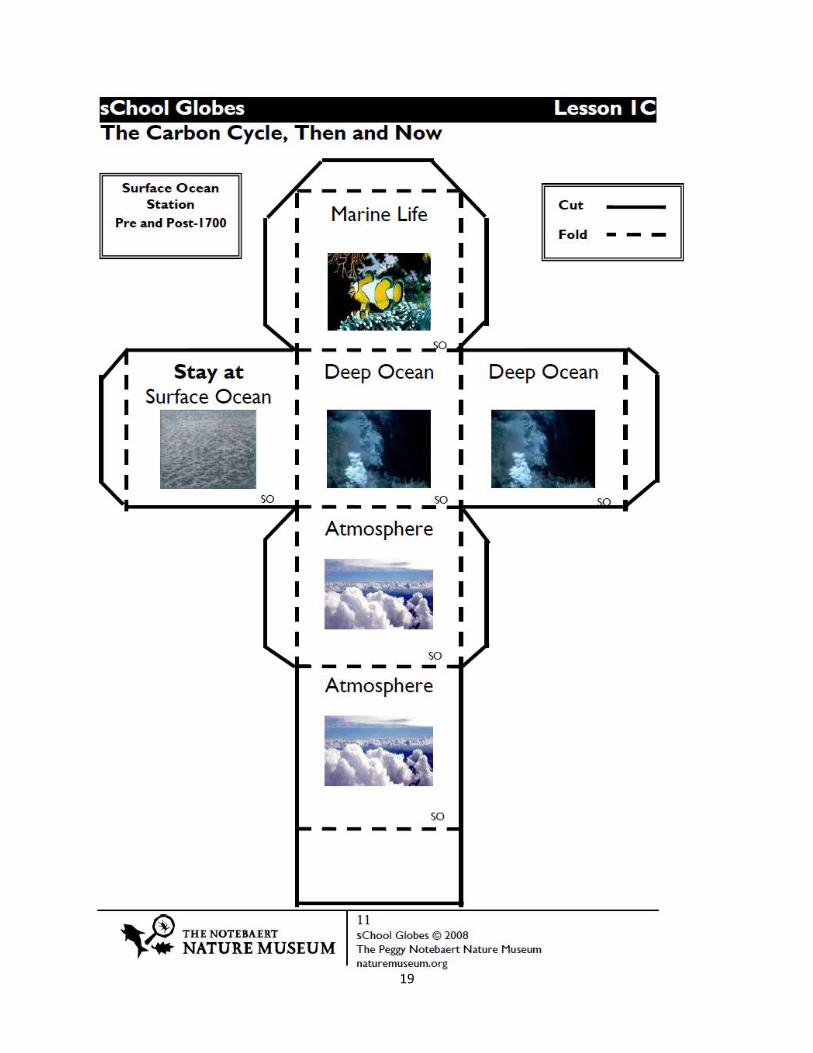
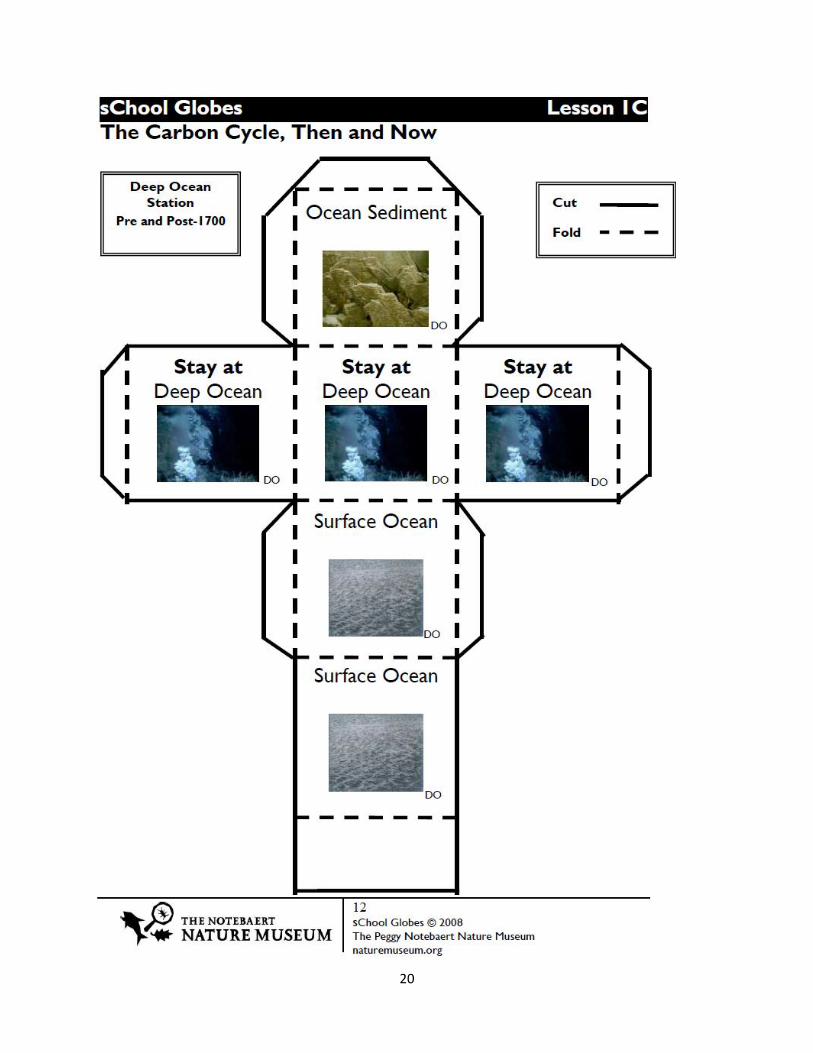
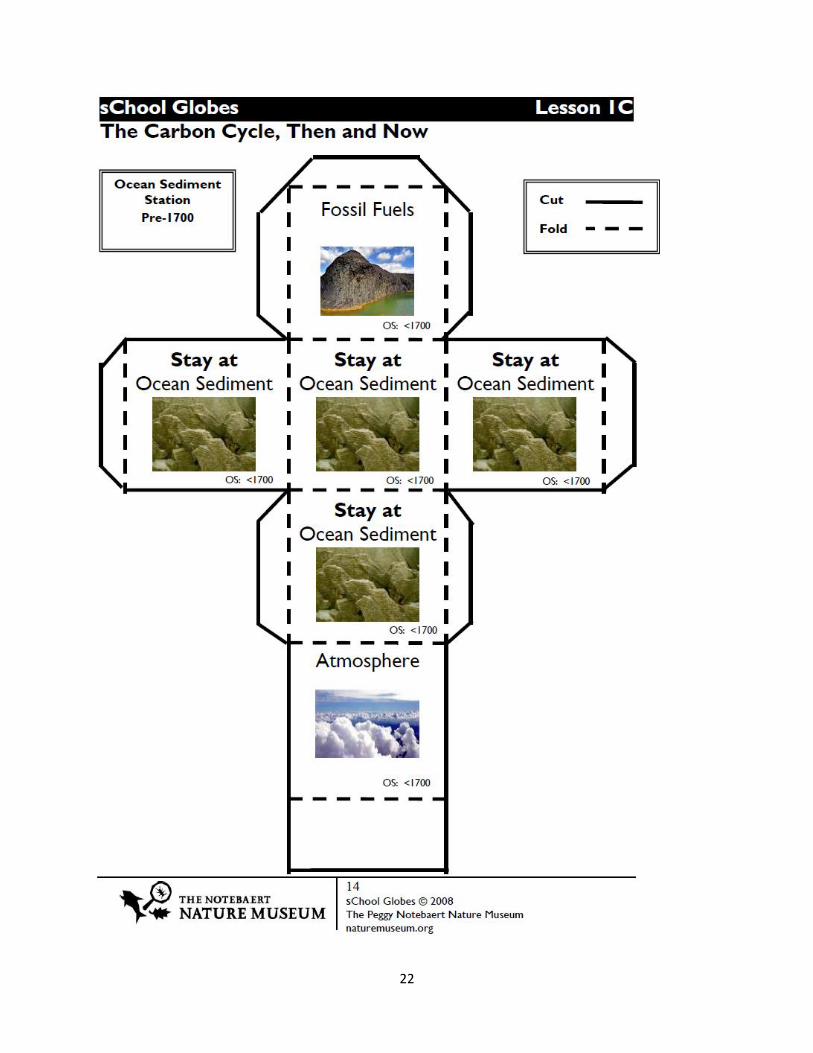
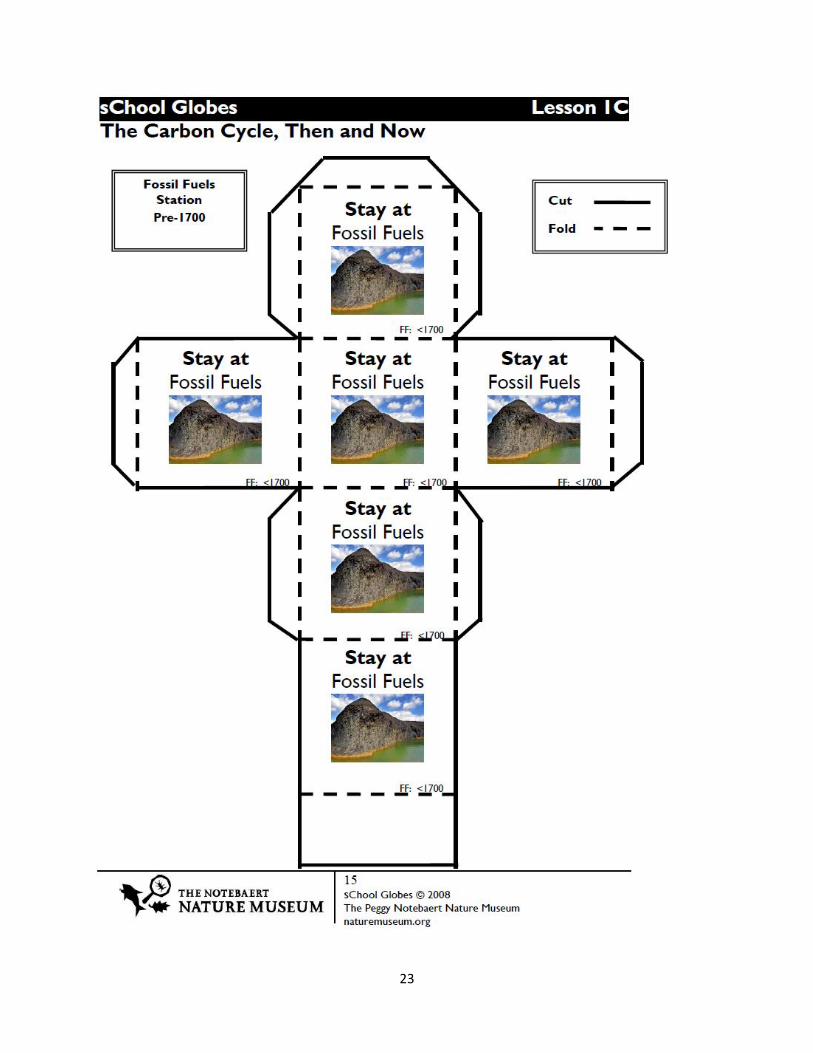
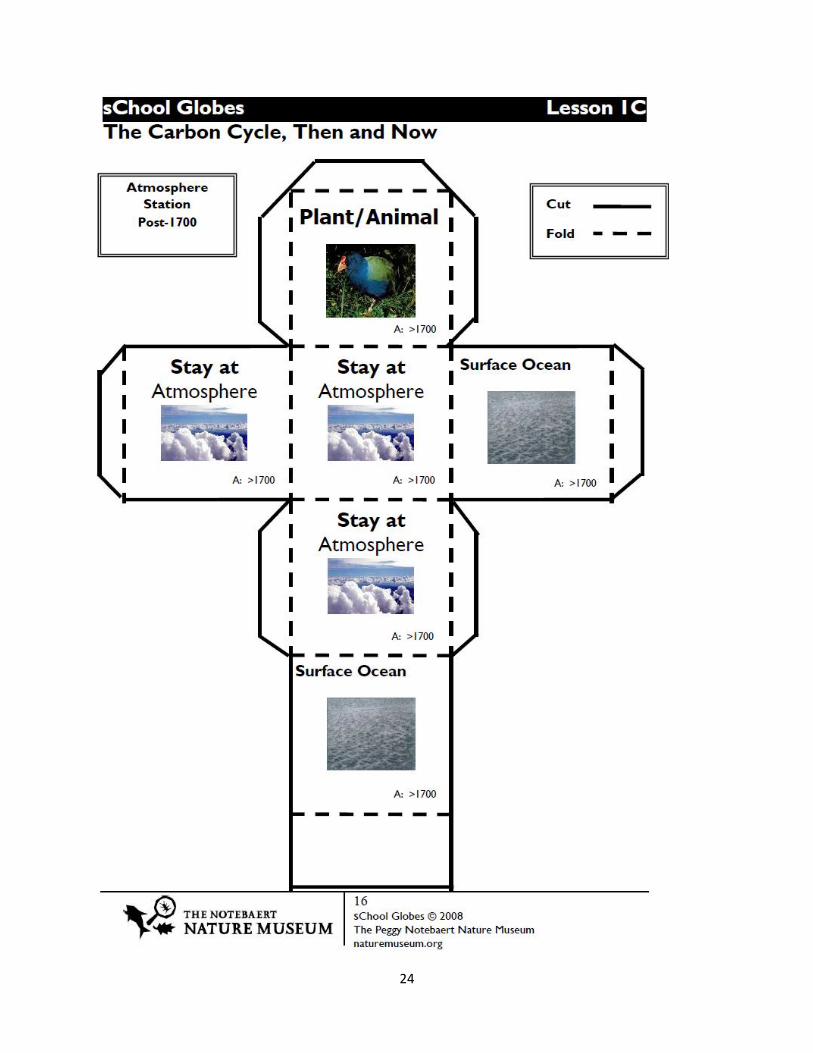
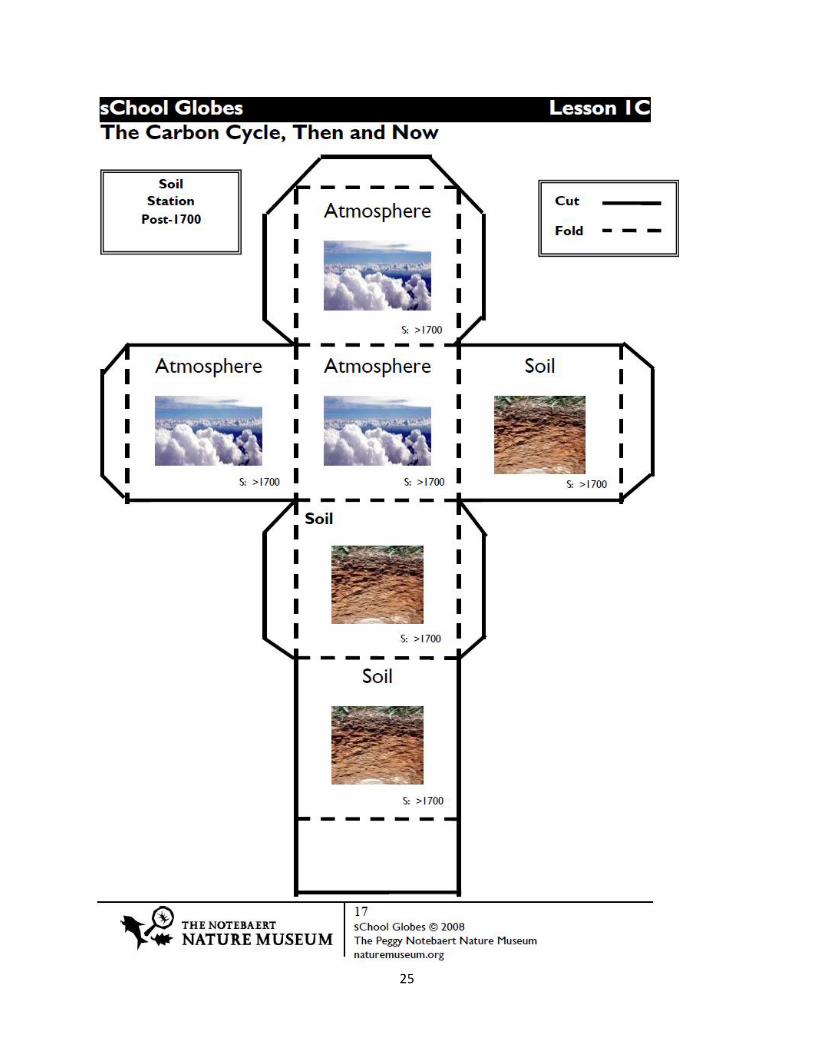
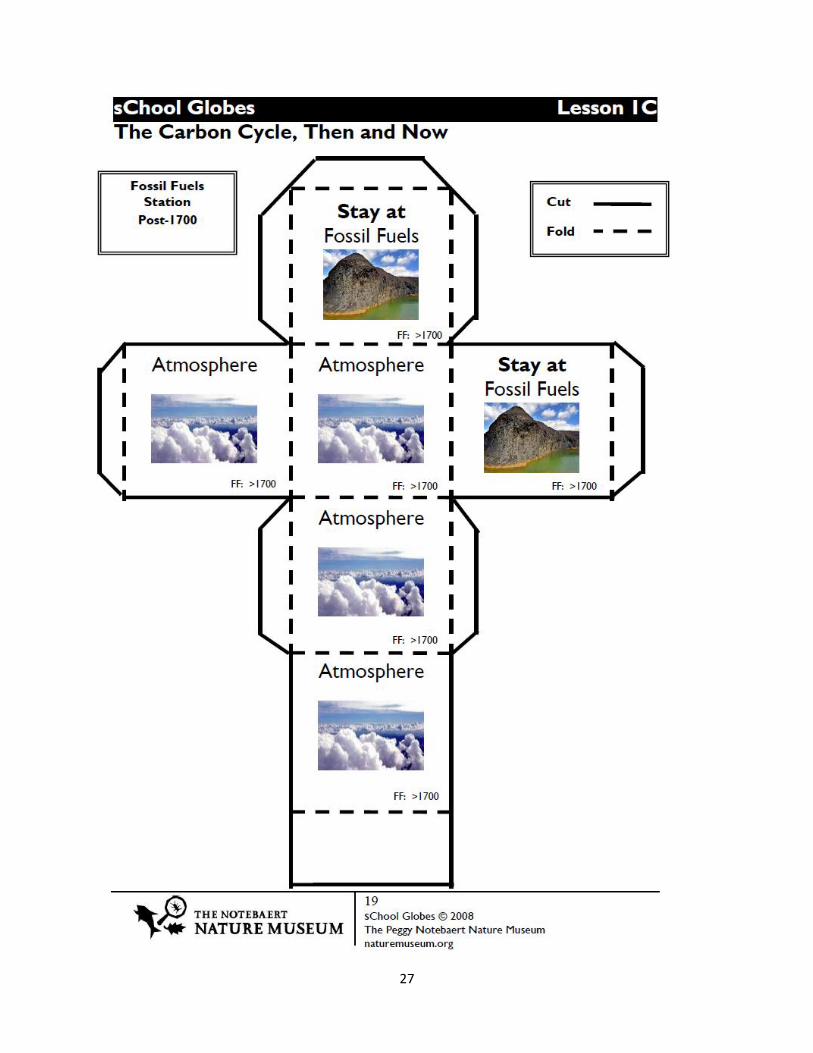
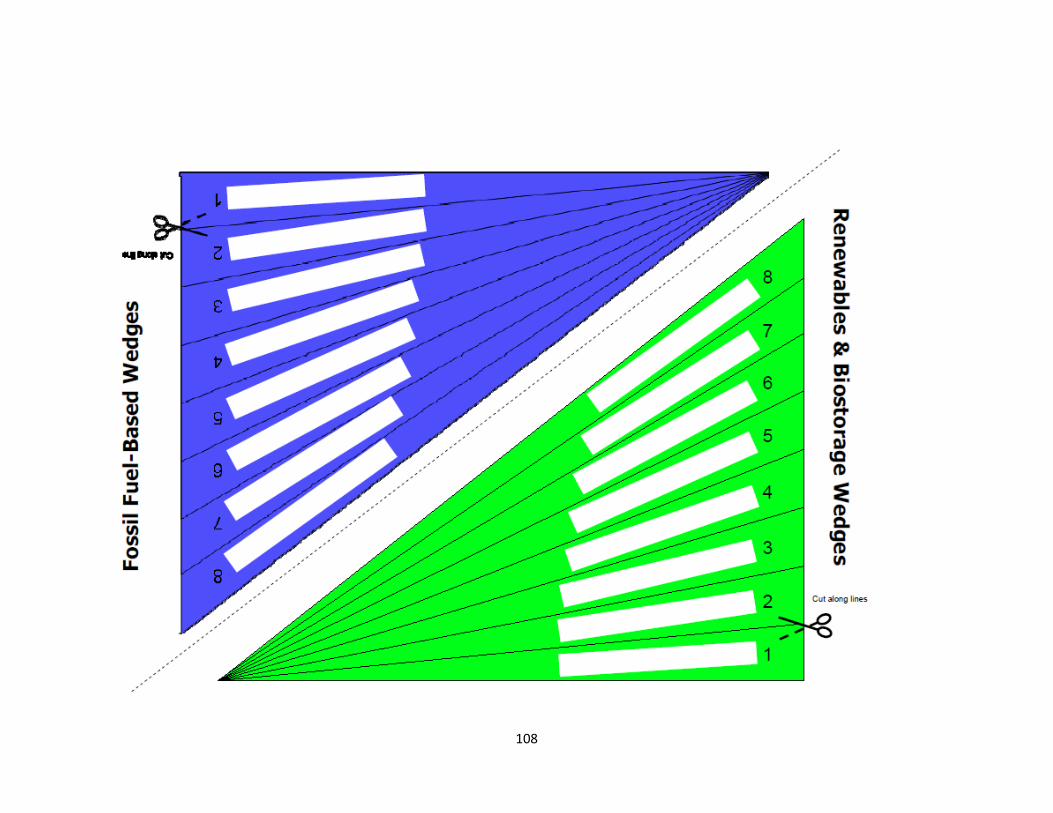
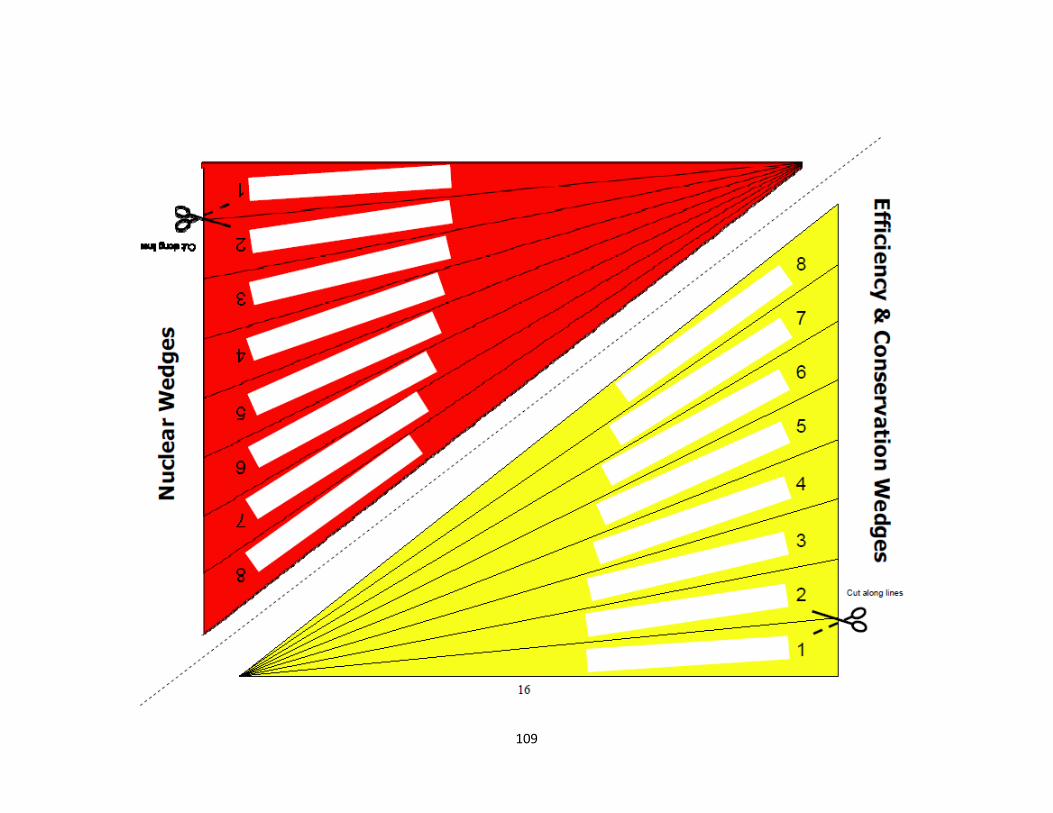
Carbon Cycle activity materials Light meter and color construction paper (white = snow/ice/clouds, green = vegetation, blue = water/oceans, brown = land) for albedo activity Changes in the Climate System data handouts and response sheets Wedge Game handouts and materials Case study handouts and materials Climate education resources handouts Climate glossary handout Assessment
3
4

5

6
7
8
9

10

11
12

13

14

15

16
17

18
19
20

21
22
23
24
25

26
27

28
29

30
31

32
Changes to the Climate System: ICE
How has the component changed?
What is the evidence of this change?
What relationship might this have with global warming?
Describe how the other components of the climate system impact the component:
Land
Vegetation
Atmosphere
Ocean
Describe how changes to the component might impact the other components of the climate system:
Land
Vegetation
Atmosphere
Ocean
How might these changes impact climate?

33
Changes to the Climate System: Ocean
How has the component changed?
What is the evidence of this change?
What relationship might this have with global warming?
Describe how the other components of the climate system impact the component:
Land
Vegetation
Atmosphere
Ice
Describe how changes to the component might impact the other components of the climate system:
Land
Vegetation
Atmosphere
Ice
How might these changes impact climate?
34
Changes to the Climate System: Land
How has the component changed?
What is the evidence of this change?
What relationship might this have with global warming?
Describe how the other components of the climate system impact the component:
Ice
Vegetation
Atmosphere
Ocean
Describe how changes to the component might impact the other components of the climate system:
Ice
Vegetation
Atmosphere
Ocean
How might these changes impact climate?
35
Changes to the Climate System: Vegetation
How has the component changed?
What is the evidence of this change?
What relationship might this have with global warming?
Describe how the other components of the climate system impact the component:
Land
Ice
Atmosphere
Ocean
Describe how changes to the component might impact the other components of the climate system:
Land
Ice
Atmosphere
Ocean
How might these changes impact climate?

36
Changes to the Climate System: Atmosphere
How has the component changed?
What is the evidence of this change?
What relationship might this have with global warming?
Describe how the other components of the climate system impact the component:
Land
Vegetation
Ice
Ocean
Describe how changes to the component might impact the other components of the climate system:
Land
Vegetation
Ice
Ocean
How might these changes impact climate?
37
Ice

38
http://www.nat-park.com/grinnell-glacier-glacier-national-park/
39

40
http://www.eea.europa.eu/data-and-maps/indicators/greenland-ice-sheet/greenland-ice-sheet-assessment-published
41

42
43
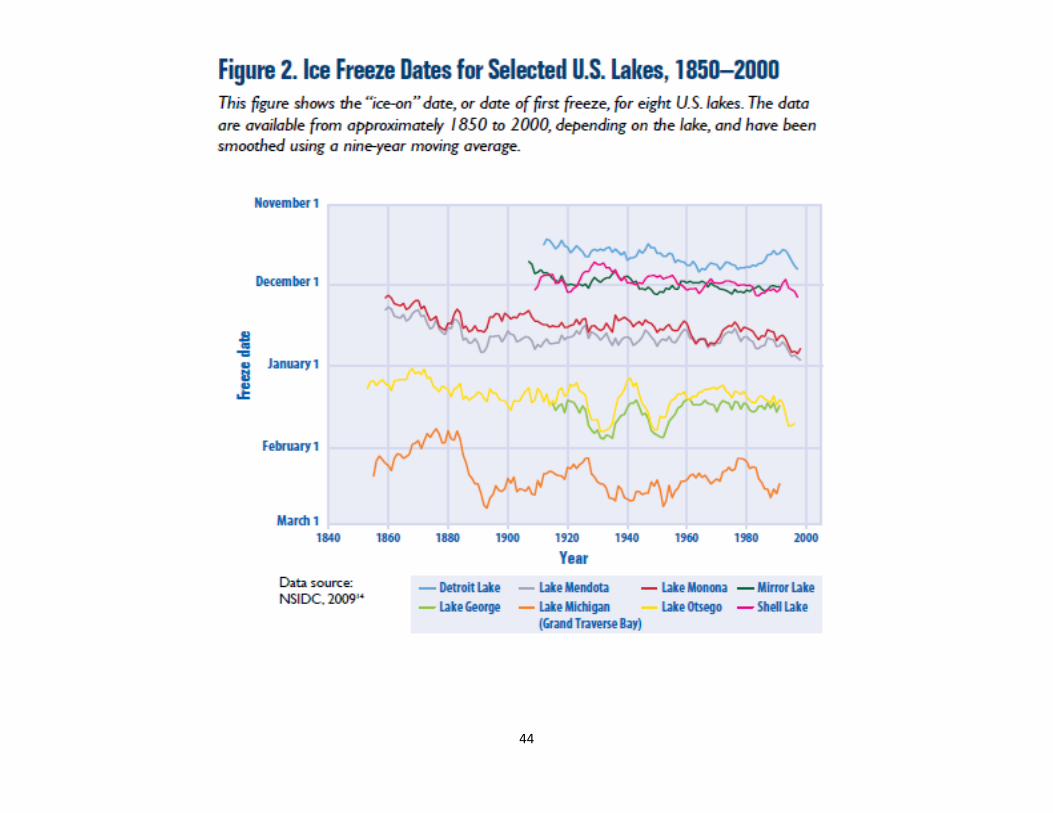
44

45
46
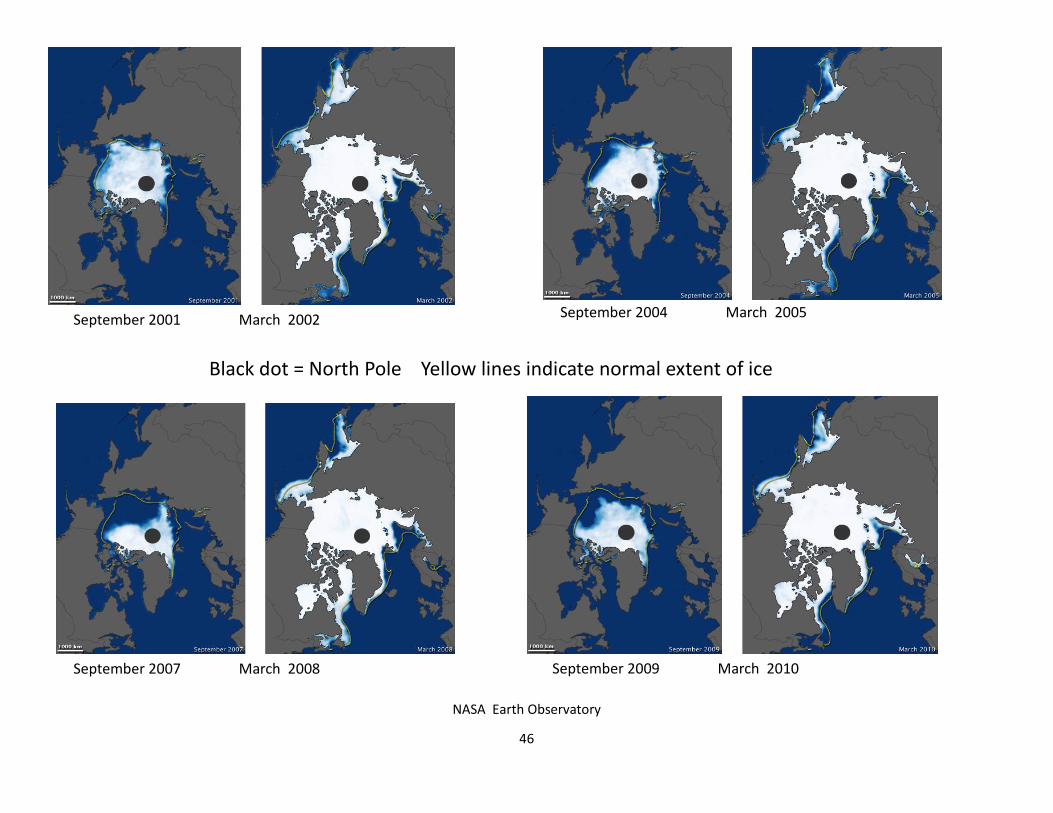
NASA Earth Observatory
Black dot = North Pole Yellow lines indicate normal extent of ice
September 2001 March 2002 September 2004 March 2005
September 2007 March 2008 September 2009 March 2010
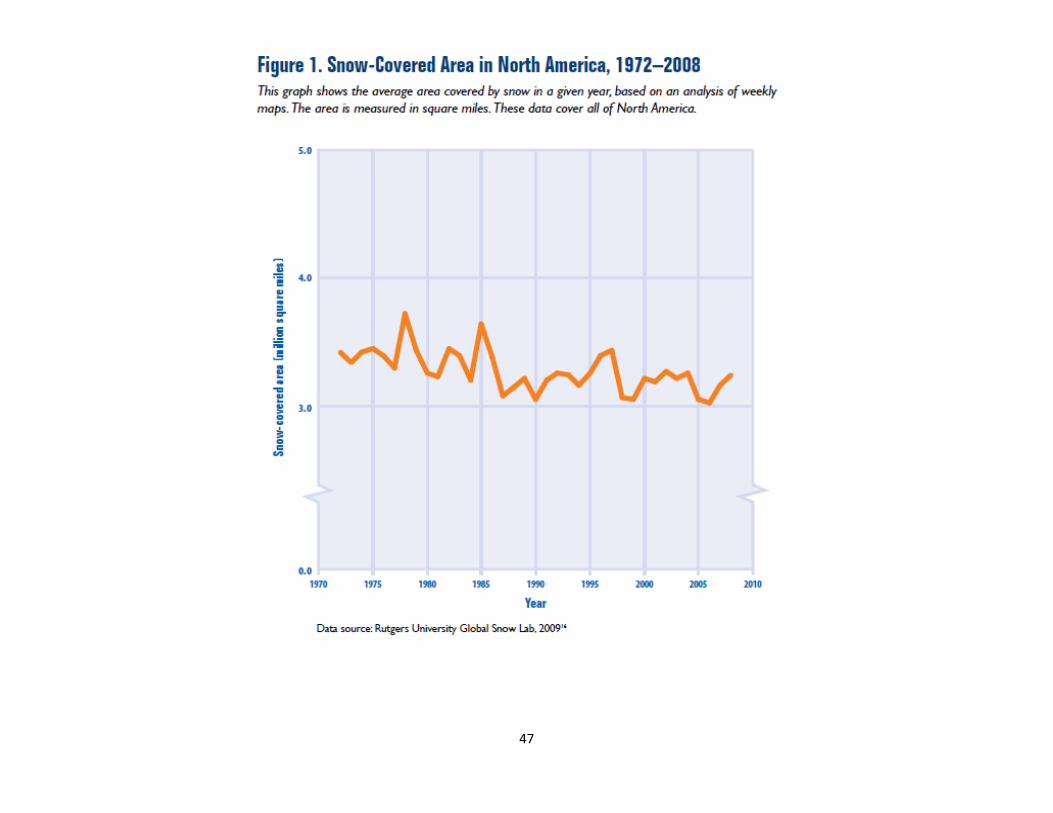
47
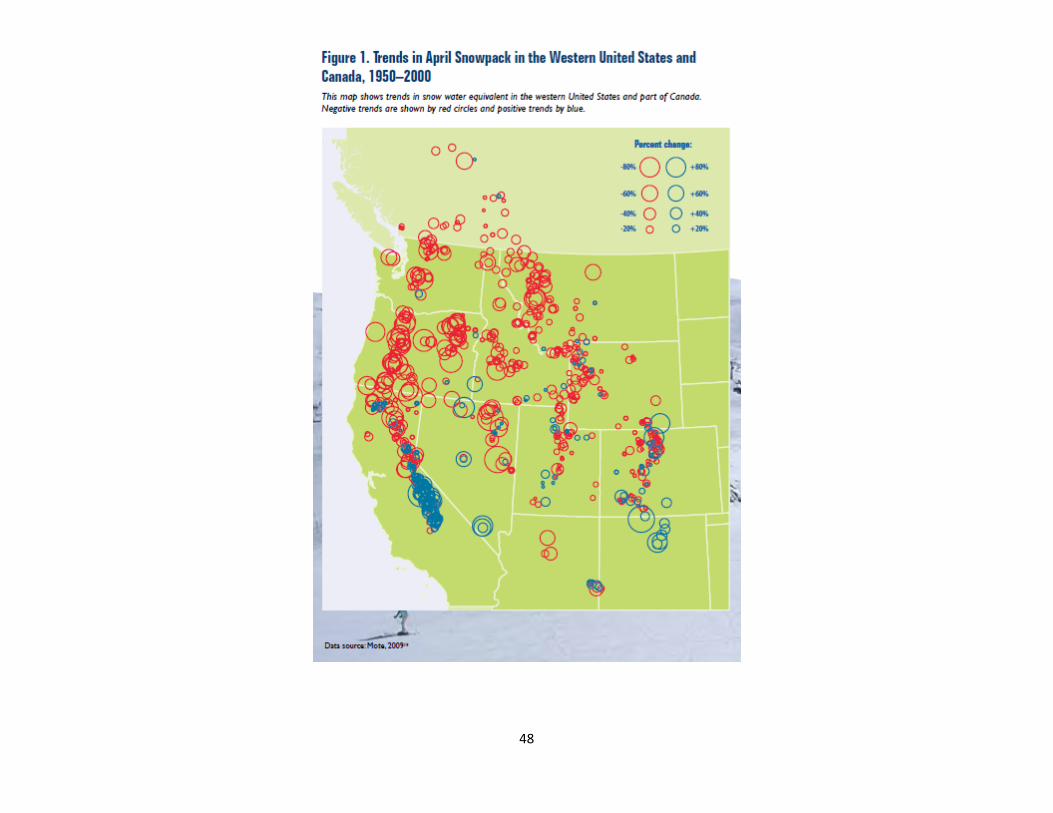
48
49
Oceans
50
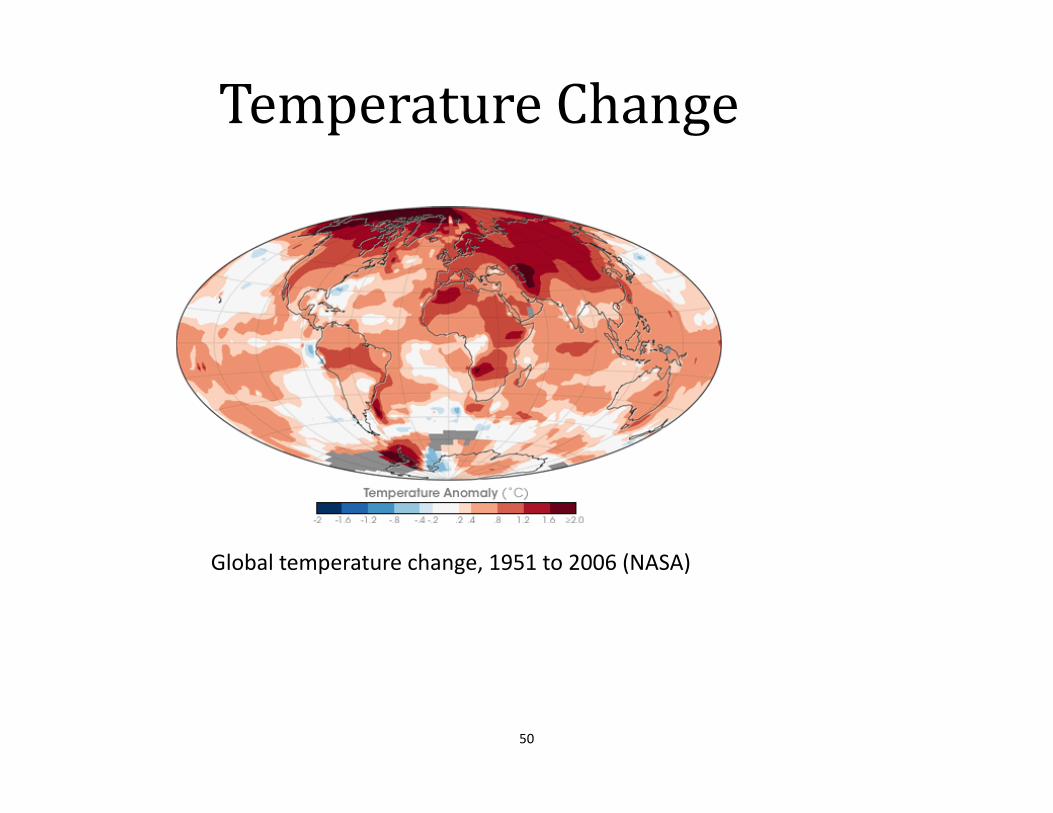
Temperature Change
Global temperature change, 1951 to 2006 (NASA)
51
52
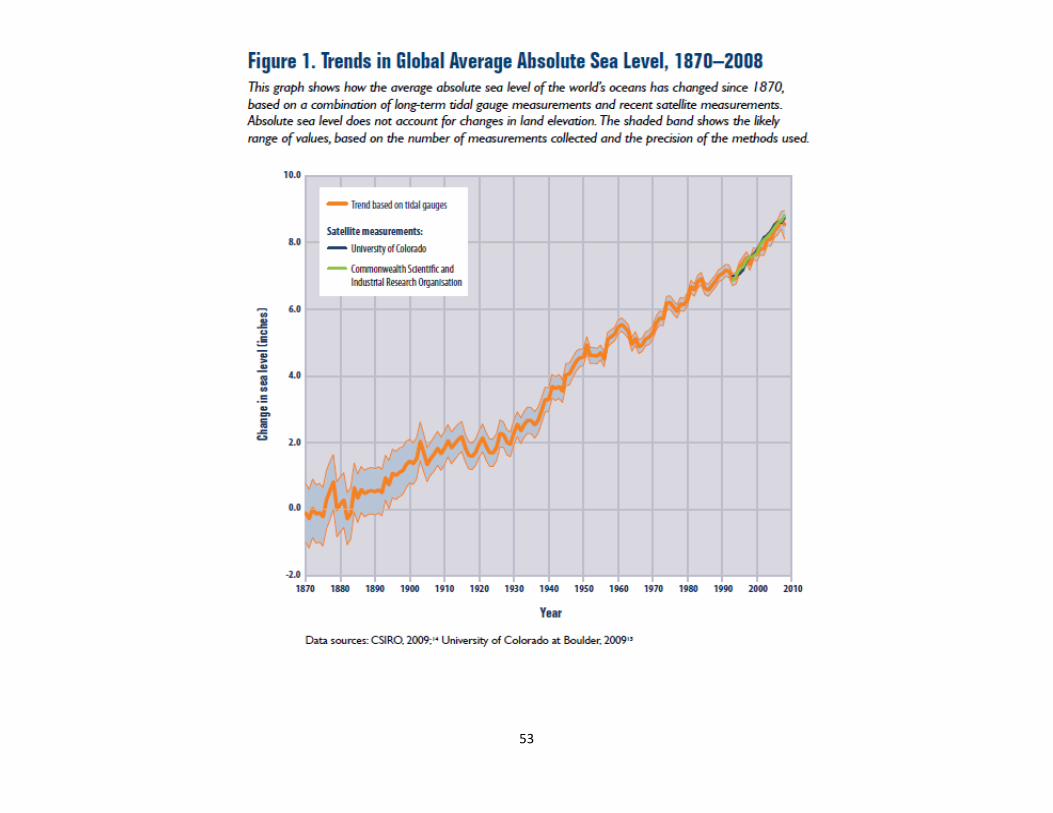
53
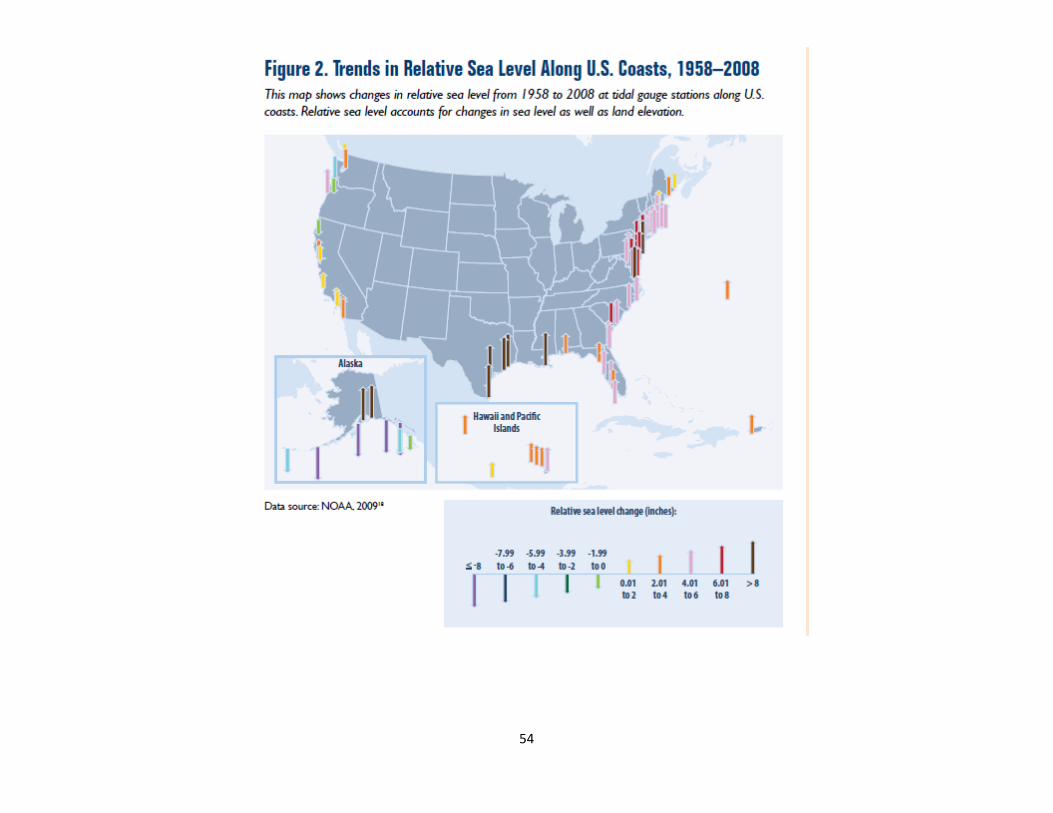
54
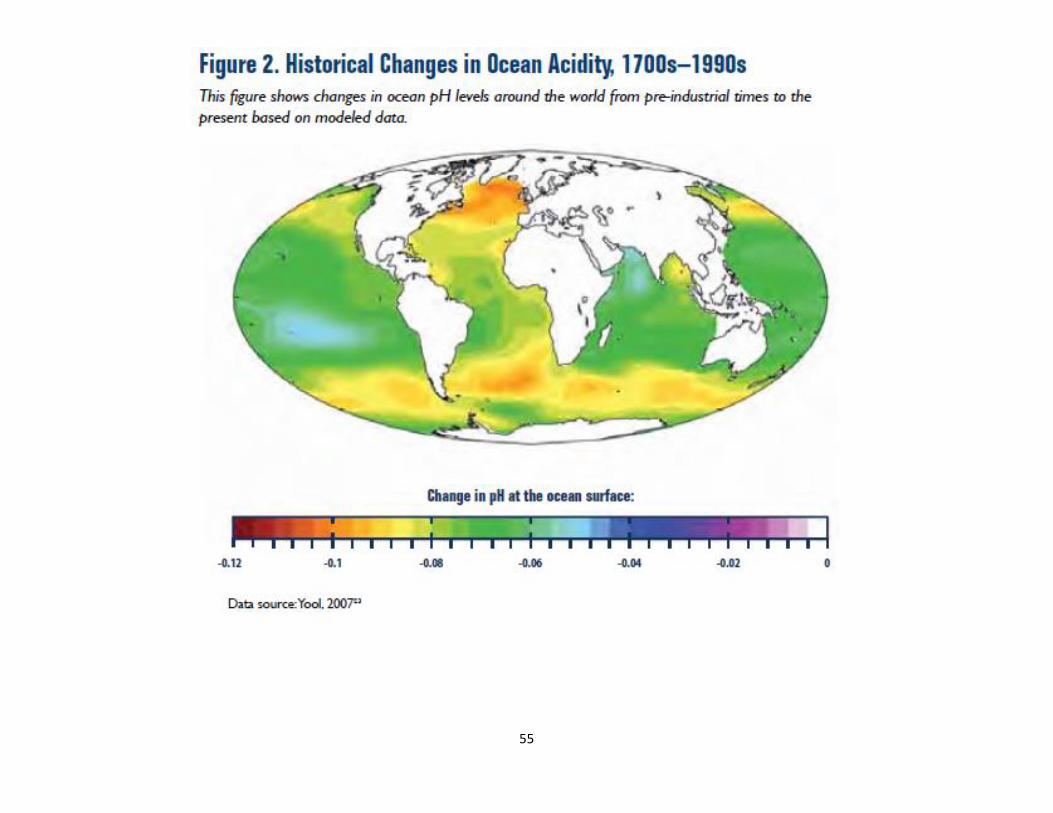
55
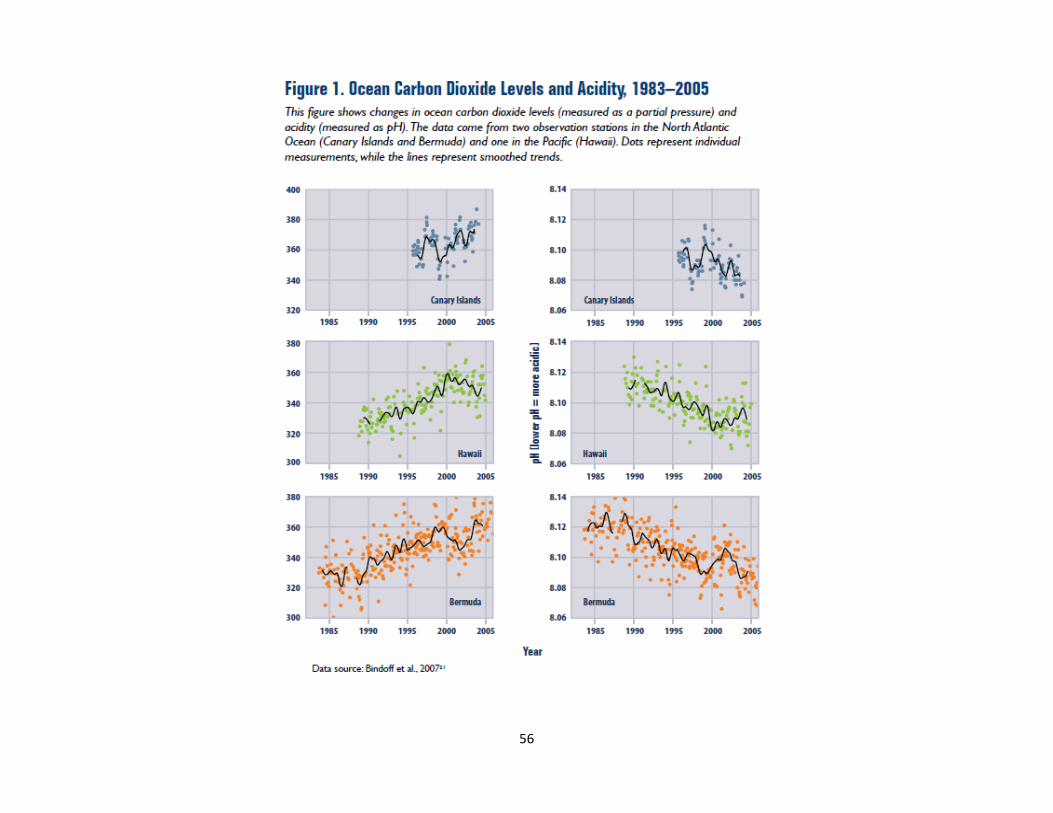
56
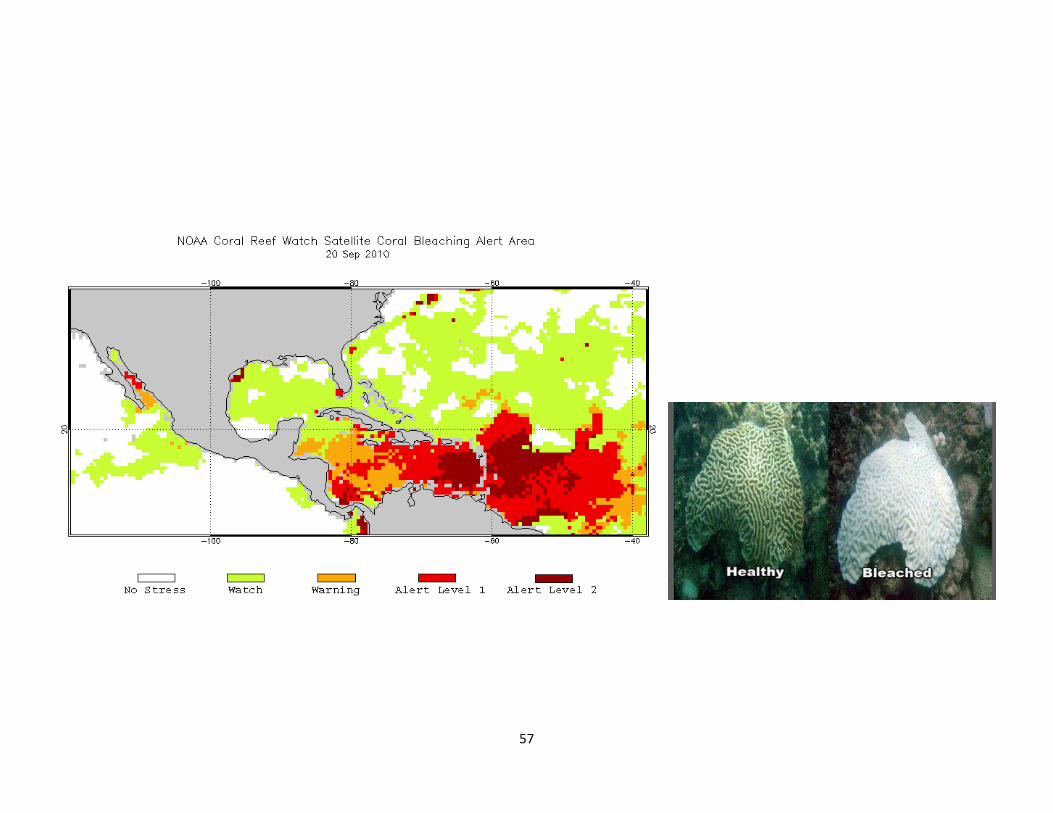
57
58
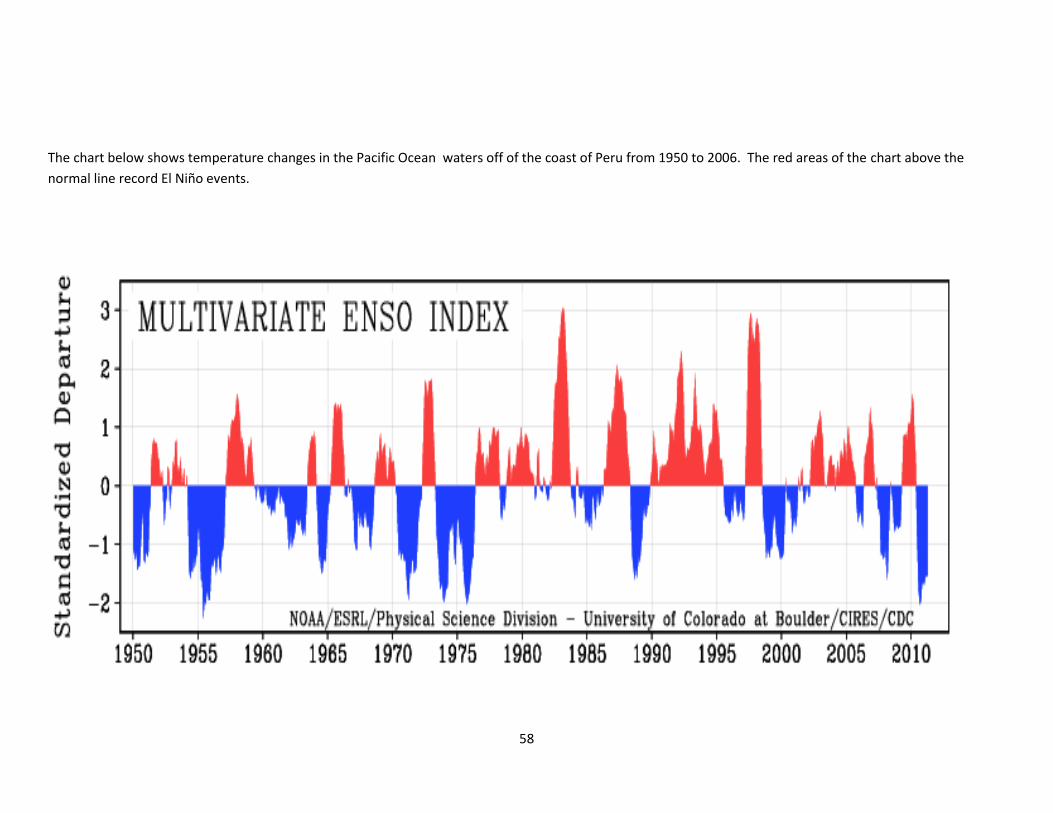
The chart below shows temperature changes in the Pacific Ocean waters off of the coast of Peru from 1950 to 2006. The red areas of the chart above the
normal line record El Niño events.

59
Vegetation

60
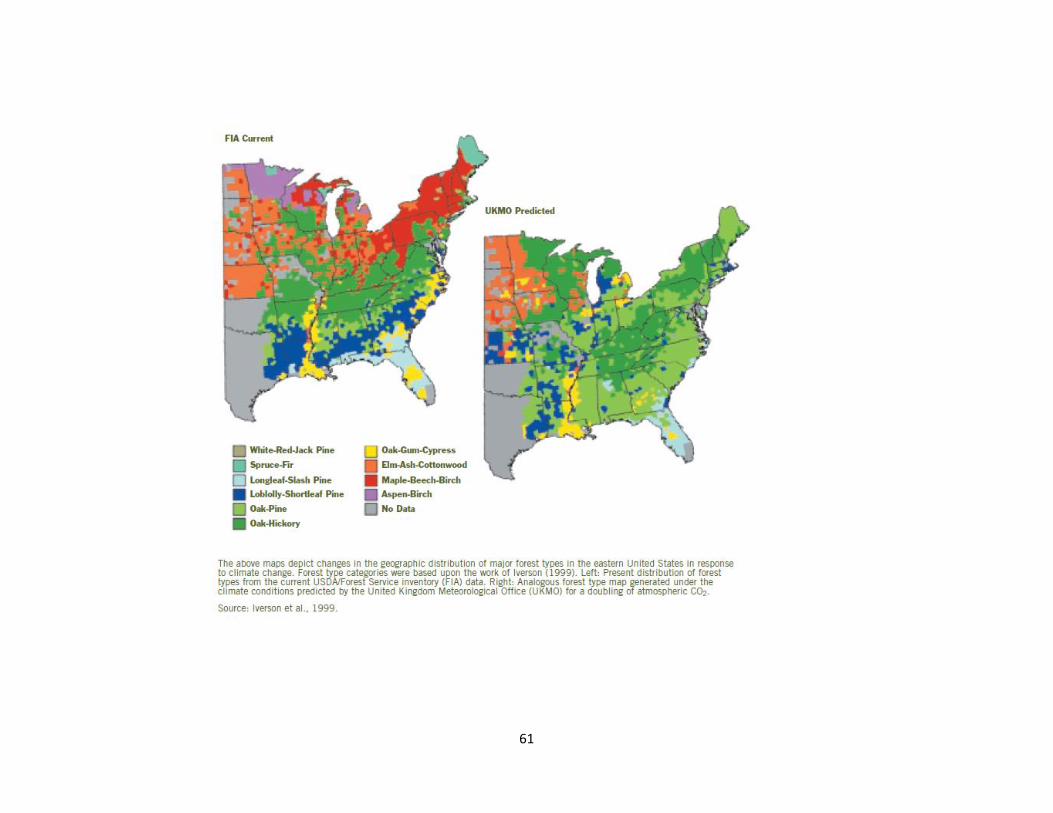
61
62
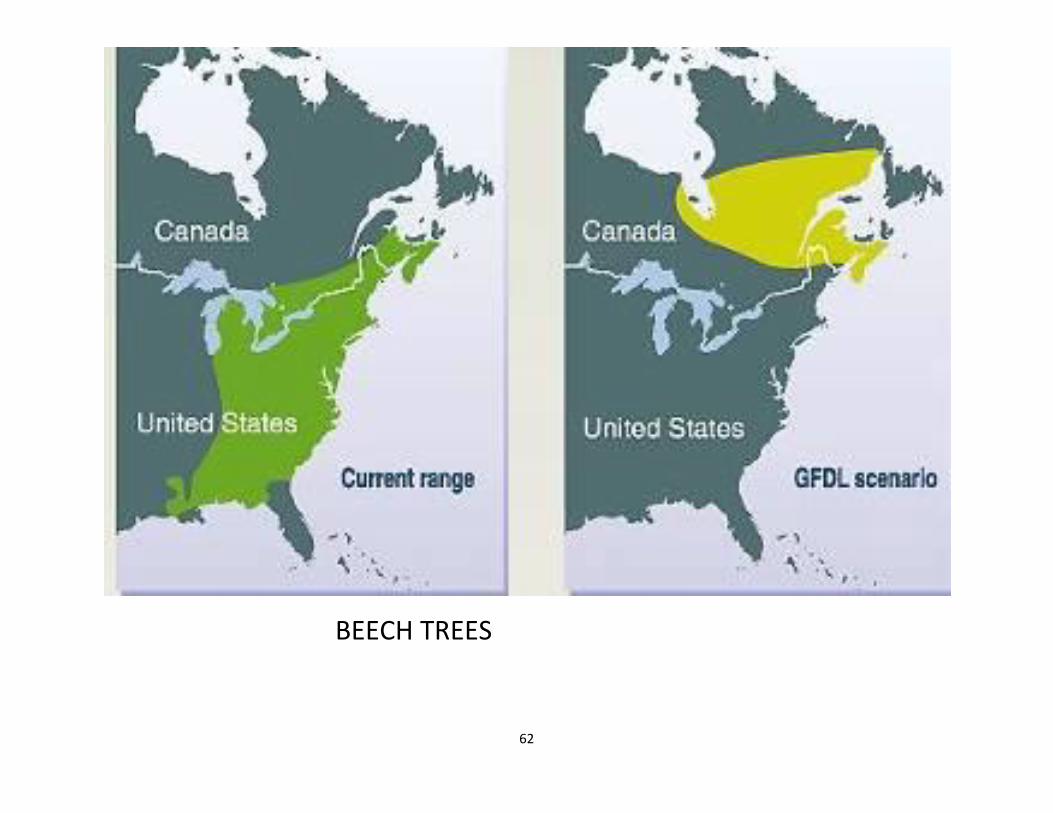
BEECH TREES

63
Loblolly Pine predicted range with temperature increases. Green: High productive areas Yellow: Average productive areas Red: Low productive areas Niche model geographic range prediction sequence for loblolly pine under a climate scenario of geographically uniform increase in mean, maximum, and minimum annual temperature, by half degree increments. http://www.colorado.edu/research/cires/banff/pubpapers/104/
64
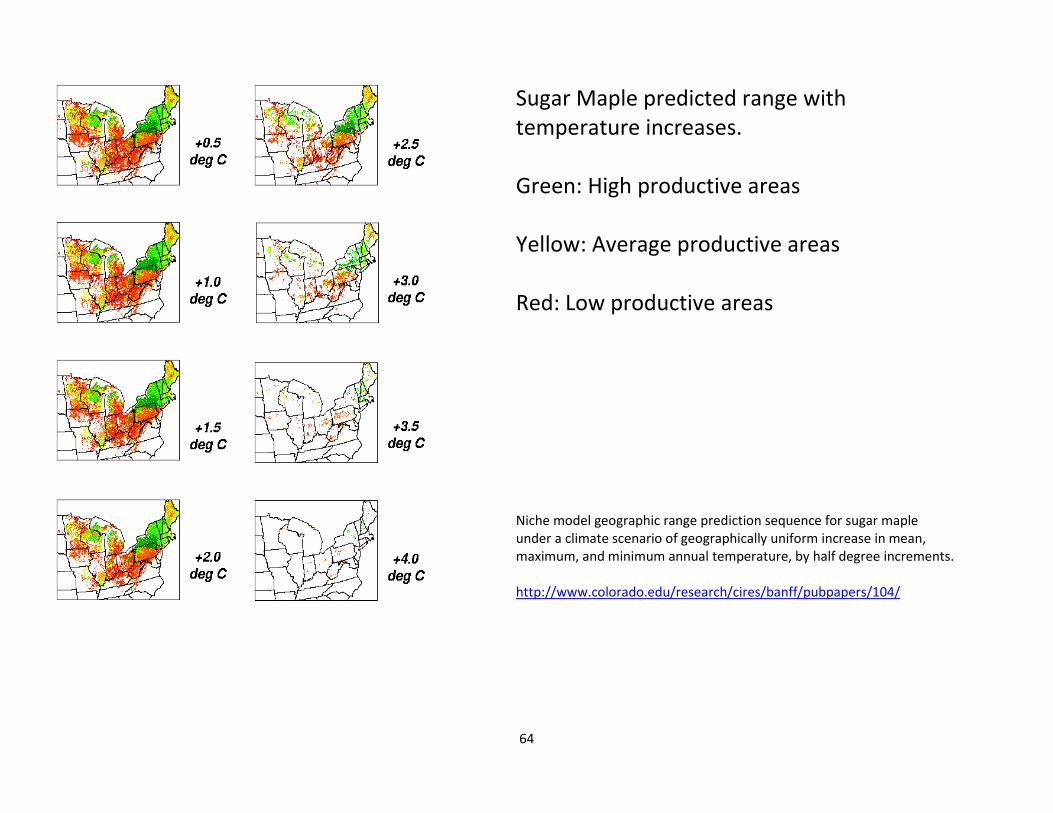
Sugar Maple predicted range with temperature increases. Green: High productive areas Yellow: Average productive areas Red: Low productive areas Niche model geographic range prediction sequence for sugar maple under a climate scenario of geographically uniform increase in mean, maximum, and minimum annual temperature, by half degree increments. http://www.colorado.edu/research/cires/banff/pubpapers/104/
65
66
67
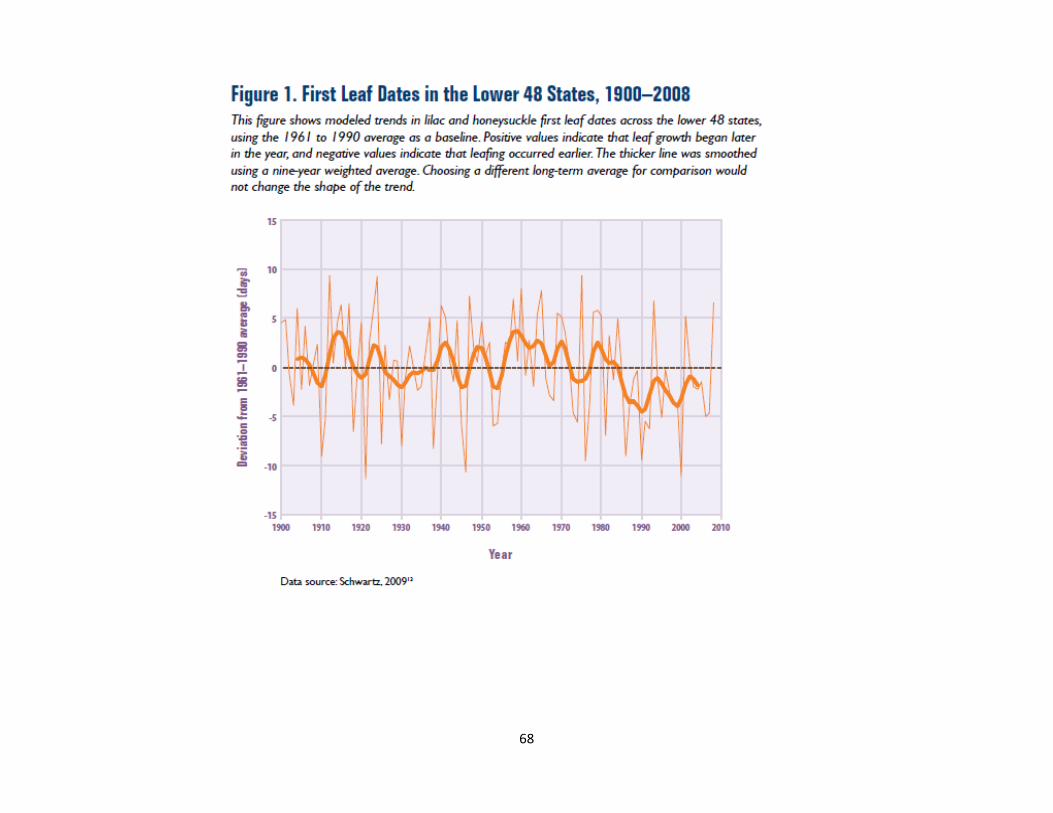
68
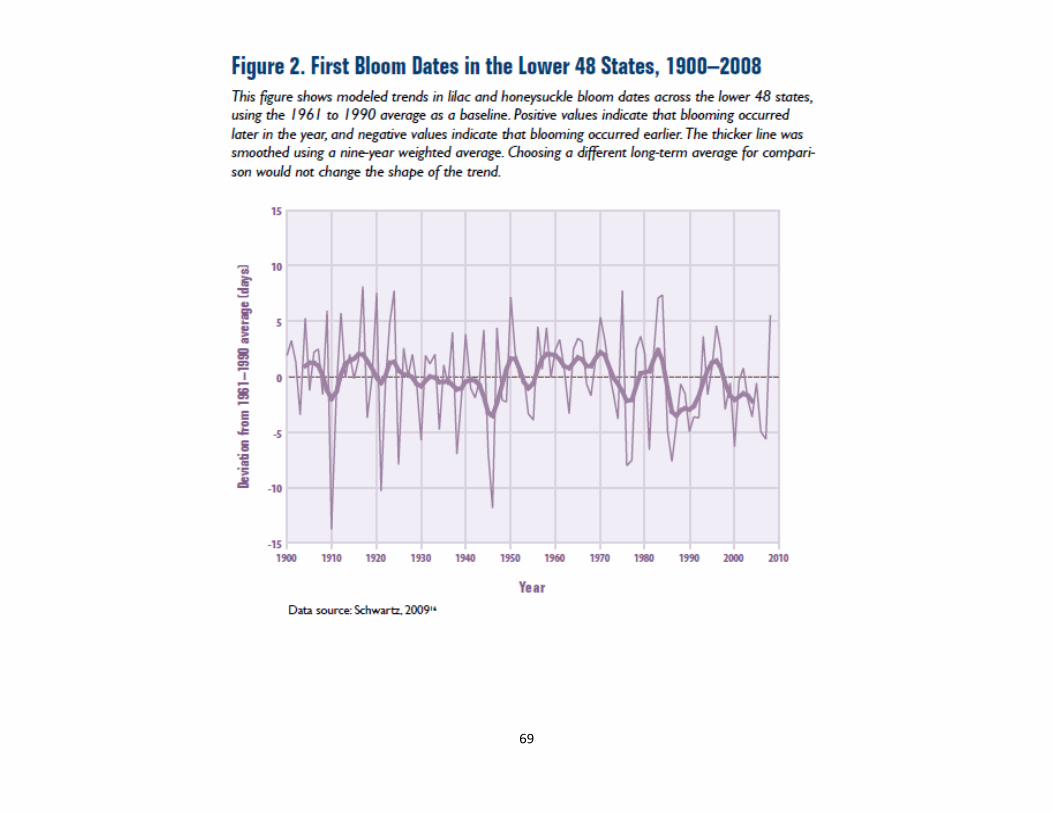
69
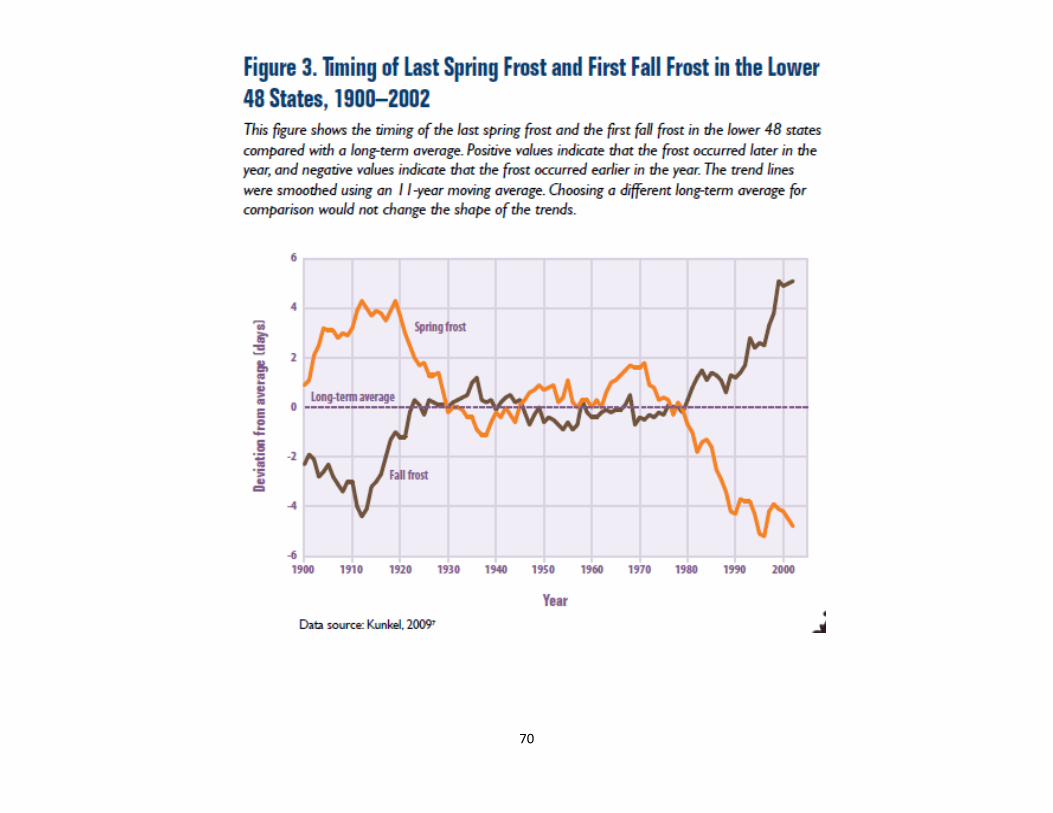
70

71
72
Land
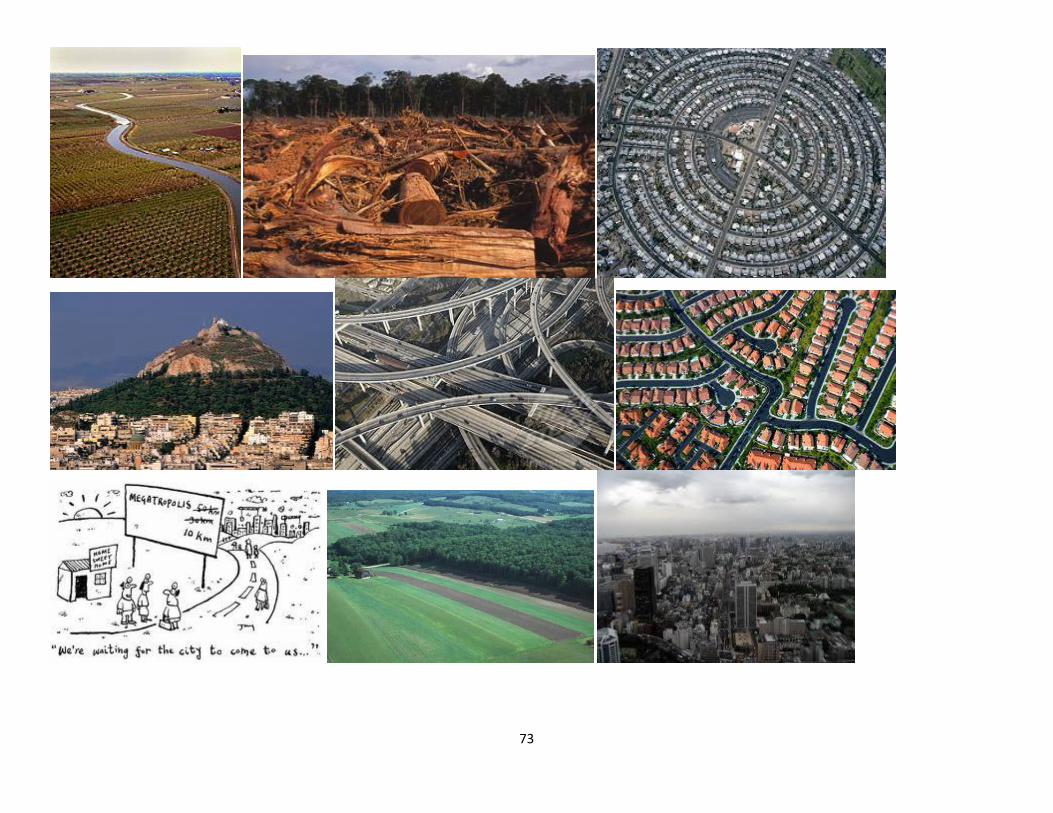
73

74
Source: Center for International Earth Science Information Network (CIESIN), Columbia University and Centro International de Agriculture Tropical (CIAT)

75
76
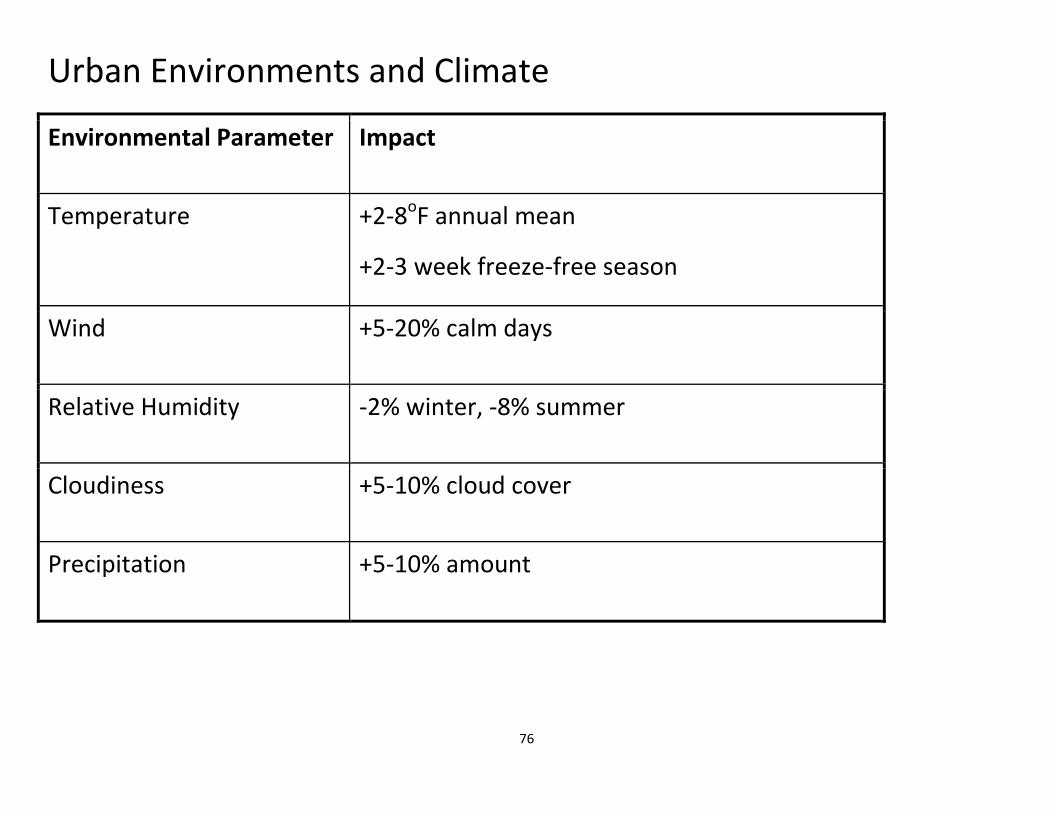
Urban Environments and Climate
Environmental Parameter Impact
Temperature +2-8oF annual mean
+2-3 week freeze-free season
Wind +5-20% calm days
Relative Humidity -2% winter, -8% summer
Cloudiness +5-10% cloud cover
Precipitation +5-10% amount

77

78
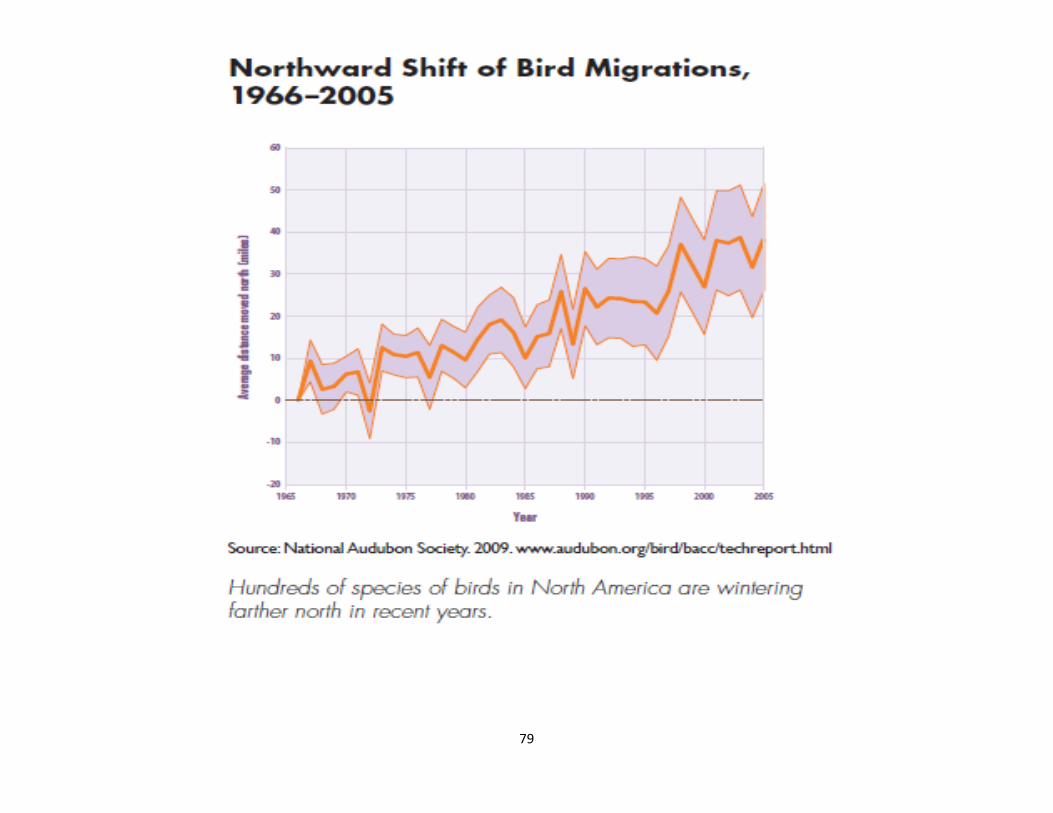
79

80
Atmosphere

81
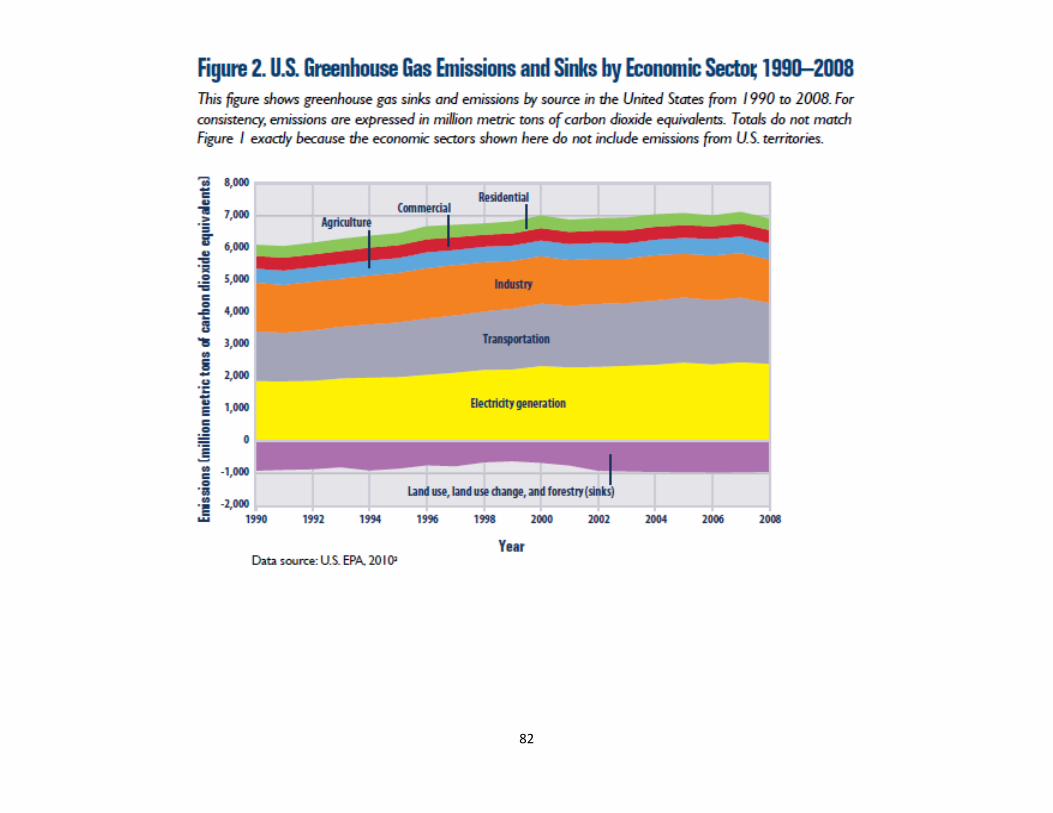
82
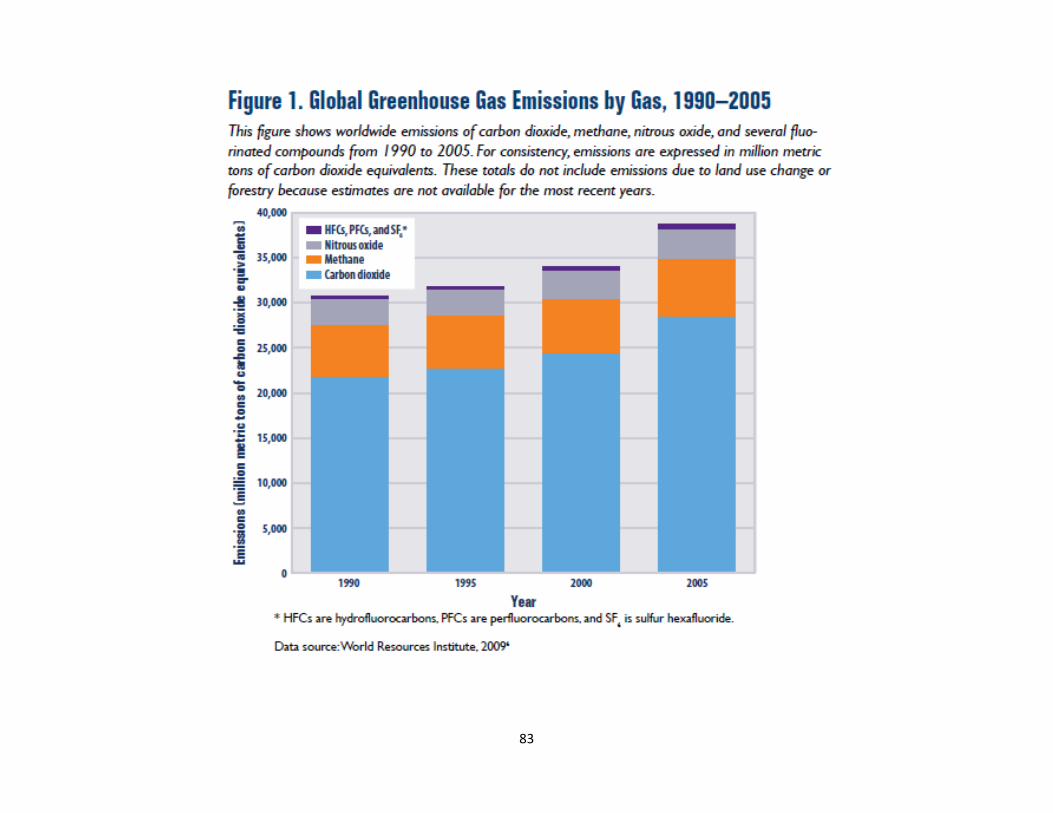
83
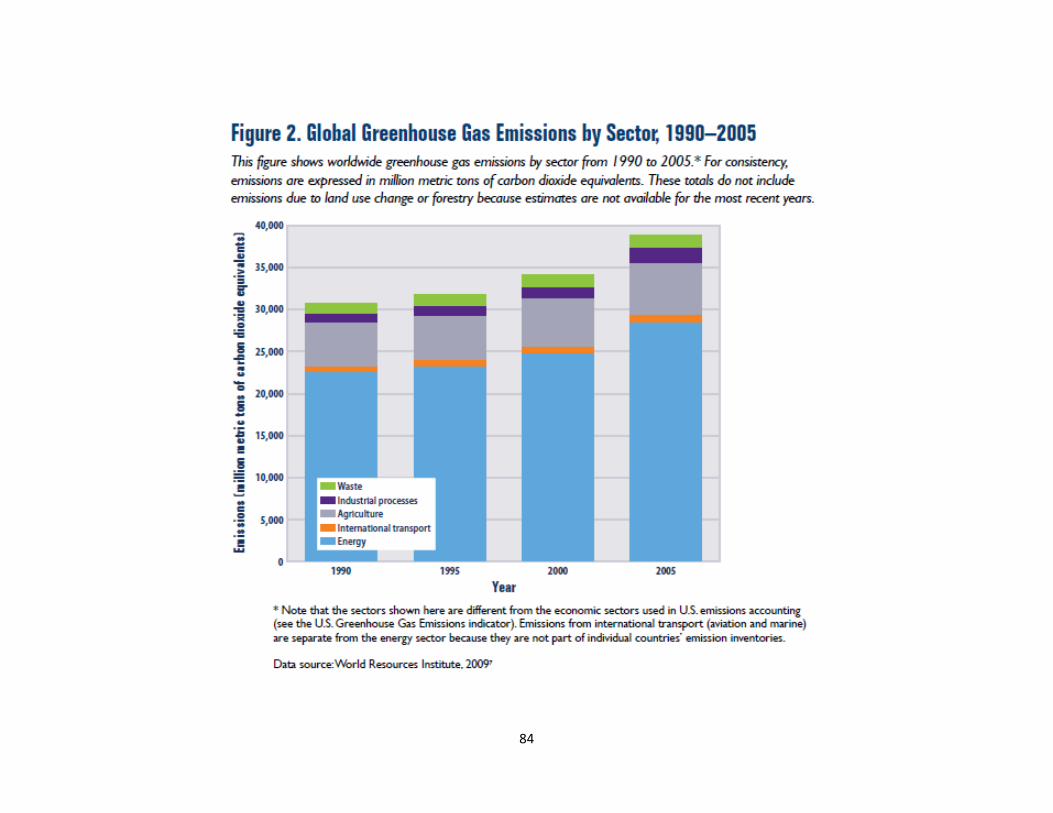
84
85
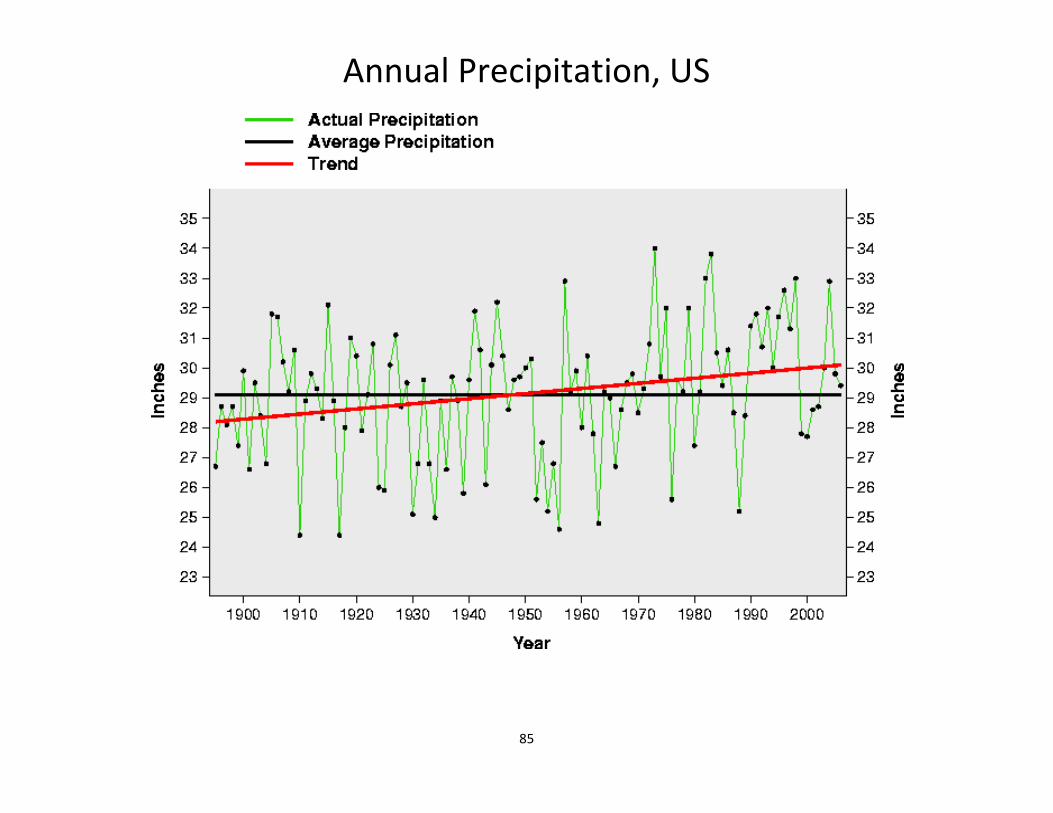
Annual Precipitation, US
86
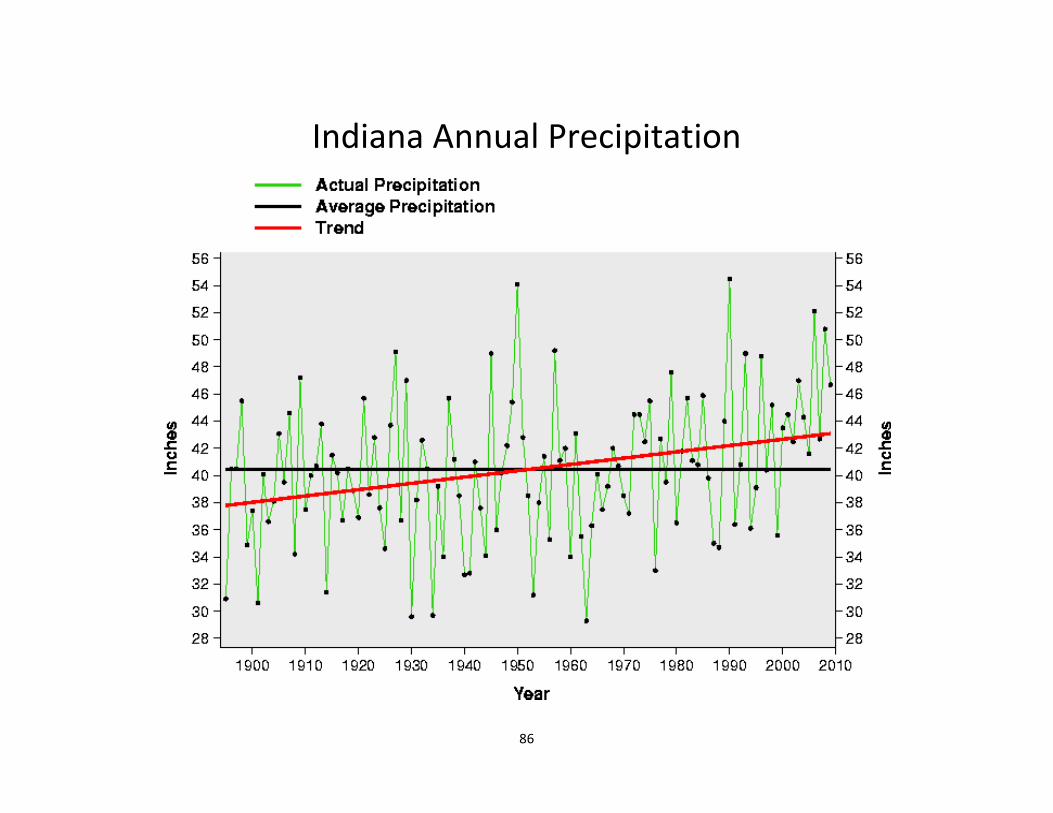
Indiana Annual Precipitation

87

88

89
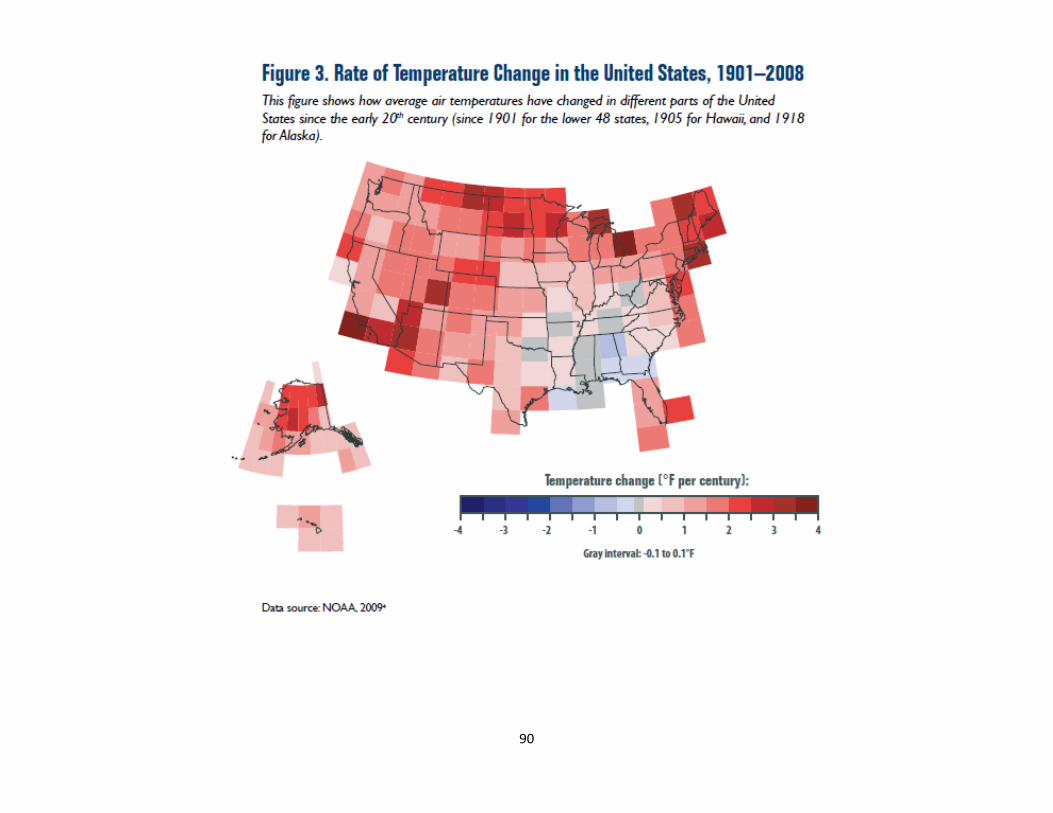
90
91
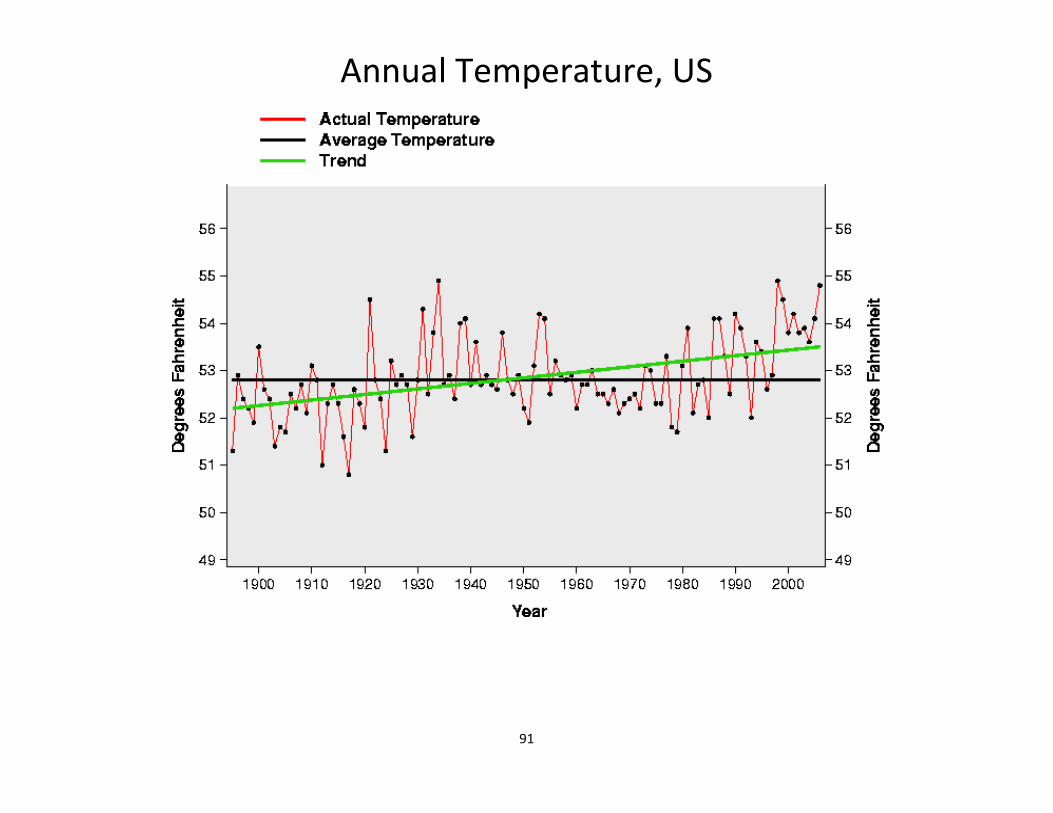
Annual Temperature, US
92
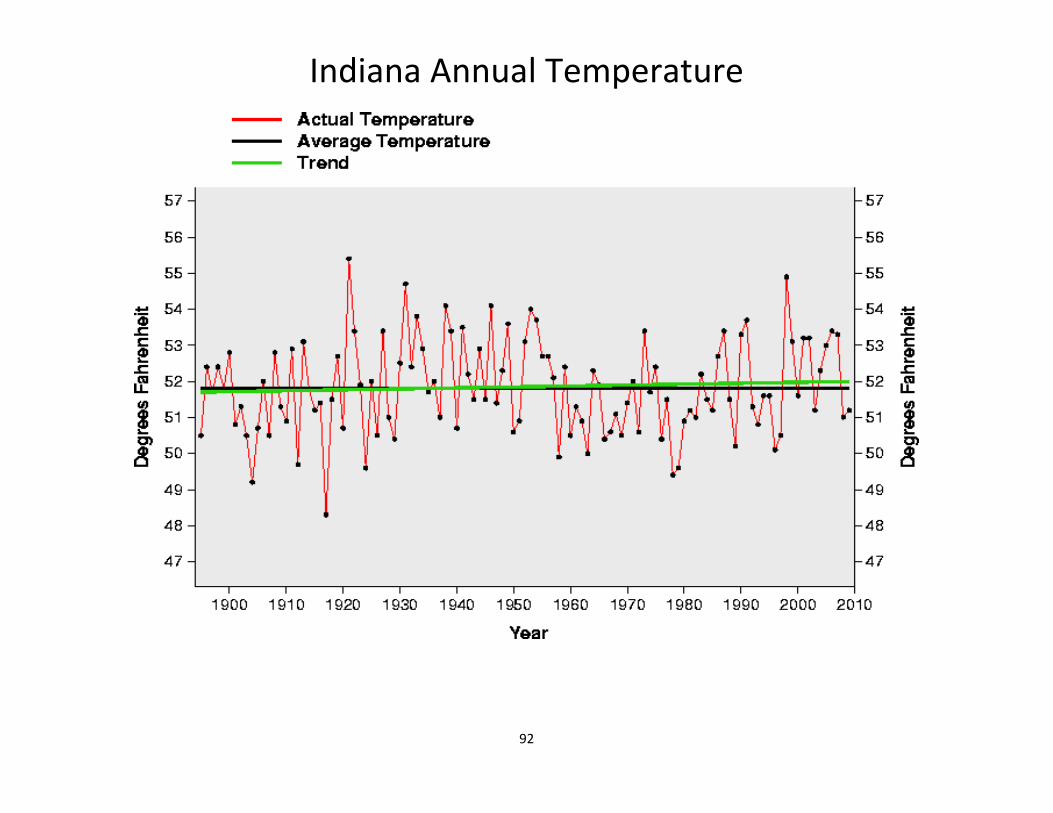
Indiana Annual Temperature
93
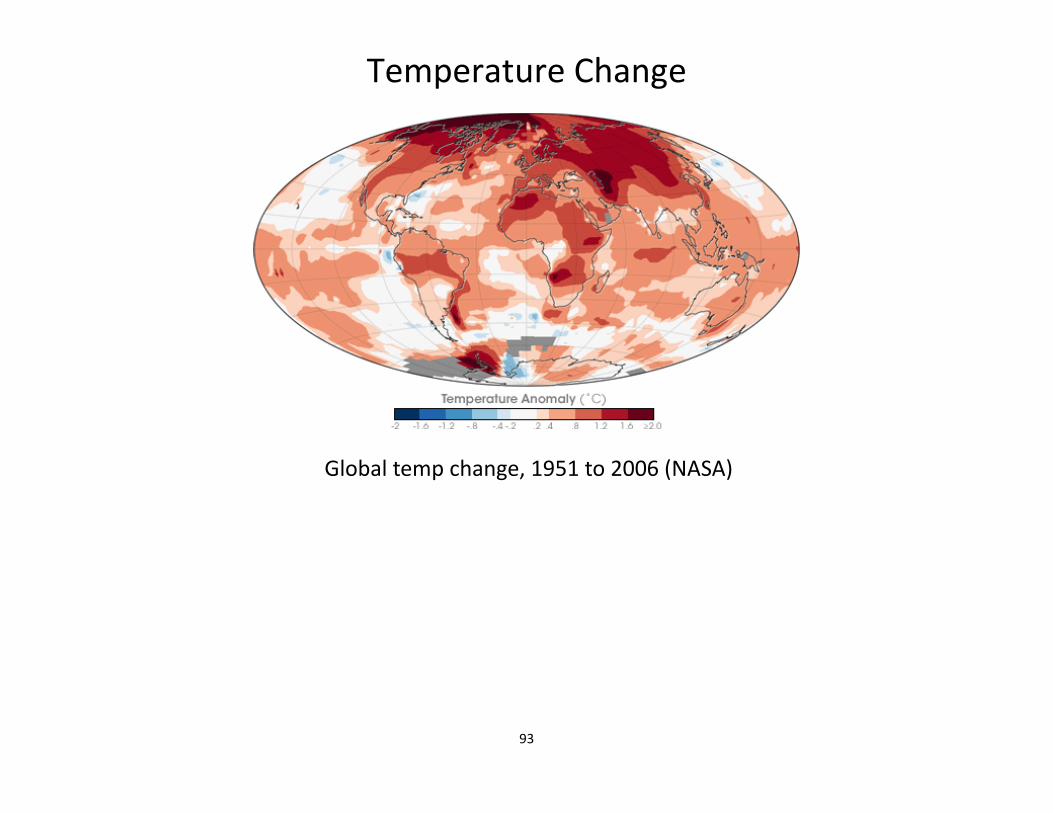
Temperature Change
Global temp change, 1951 to 2006 (NASA)

94

95

96

97

98
99
100

101
102
103
104
105
106
107
108
109

110
Community Action Scenario
Denver Neighborhood Climate Prosperity Project
Denver, Colorado
The goal of Denver’s Neighborhood Climate Prosperity Project is to reduce greenhouse
gas (GHG) emissions at the neighborhood level. The project consists of four elements:
Greening small businesses
Expanding neighborhood sustainable mobility options
Providing incentives to support clean energy
Engaging residents to reduce GHG emissions
To support the greening of local small businesses, the City of Denver provided
workshops and education resources, developed energy action plans across business districts, and
assisted small businesses through a "start-to-finish" energy-assistance package. The City also
worked with businesses to expand sustainable mobility options in neighborhoods. To achieve
this goal, the project promoted local non-auto routes, helped businesses provide incentives to
reduce vehicle travel, and promoted alternative fuels.
In addition, the project promoted the voluntary purchases of renewable energy and travel
GHG emission offsets through a community "Energy Makeover" program. Neighborhoods that
met targets for purchasing renewable energy or travel offsets received funding for energy
efficiency upgrades or a renewable energy system at a local school or community building.
Finally, the city engaged residents to reduce GHG emissions from their homes. Through
Denver's Neighborhood Energy Action Partnership, residents in high-need neighborhoods gained
access to programs including: free curbside recycling, free tree planting, free CFL porch bulbs,
energy audits, home weatherization for low-income families, and utility rebates.
The benefits of the Climate Prosperity Project included a reduction in GHG emissions by
improving residential energy efficiency, reducing commercial energy use, promoting green
power, and reducing transportation GHG emissions. The project realized social benefits by
supporting green jobs and by educating residents, students, and small business owners while
influencing behavioral changes necessary for the long-term achievement of environmental
objectives.
Program Results:
Expected GHG Reductions: 28,745 metric tons CO2 annually
GHG Reductions (as of 6/11): 11,302 metric tons CO2 annually
Expected Electricity Savings: 325 MWh annually
Businesses Reached (as of 6/11): 245
Residences Reached (as of 6/11): 26,927 visits, 6,716 program sign-ups
111
The Denver Neighborhood Climate Prosperity Project, now known as the Denver Energy
Challenge, reached over 25,000 households in 16 neighborhoods through outreach efforts as of
June 2011. Nearly 20% of households (4,958 households) have pledged to take climate action.
Approximately 500 households have signed up for Xcel Energy's Windsource program, a
voluntary renewable energy program where customers can specify which part of their electricity
should be generated by wind energy. This increase in Windsource participation will result in
approximately $12,000 in additional funding from Xcel Energy for Denver Public Schools'
(DPS) energy initiatives. The project team has also fully launched their energy outreach efforts
for small businesses. As of June 2011, 245 businesses have signed up to participate in the Denver
Energy Challenge. Thanks to the outreach and education efforts support by this grant coupled
with the financial incentives offered through the DOE Better Buildings grant, more than 80
businesses have completed energy efficient projects which are expected to eliminate nearly one
million kilowatt hours of energy consumption per year.
Questions for Discussion
1. Which activity/activities could you engage in and why?
2. Which activity/activities would be difficult for you to do and why?
3. Which activities could your community implement and why?
Source: EPA http://www.epa.gov/statelocalclimate/local/showcase/index.html
112
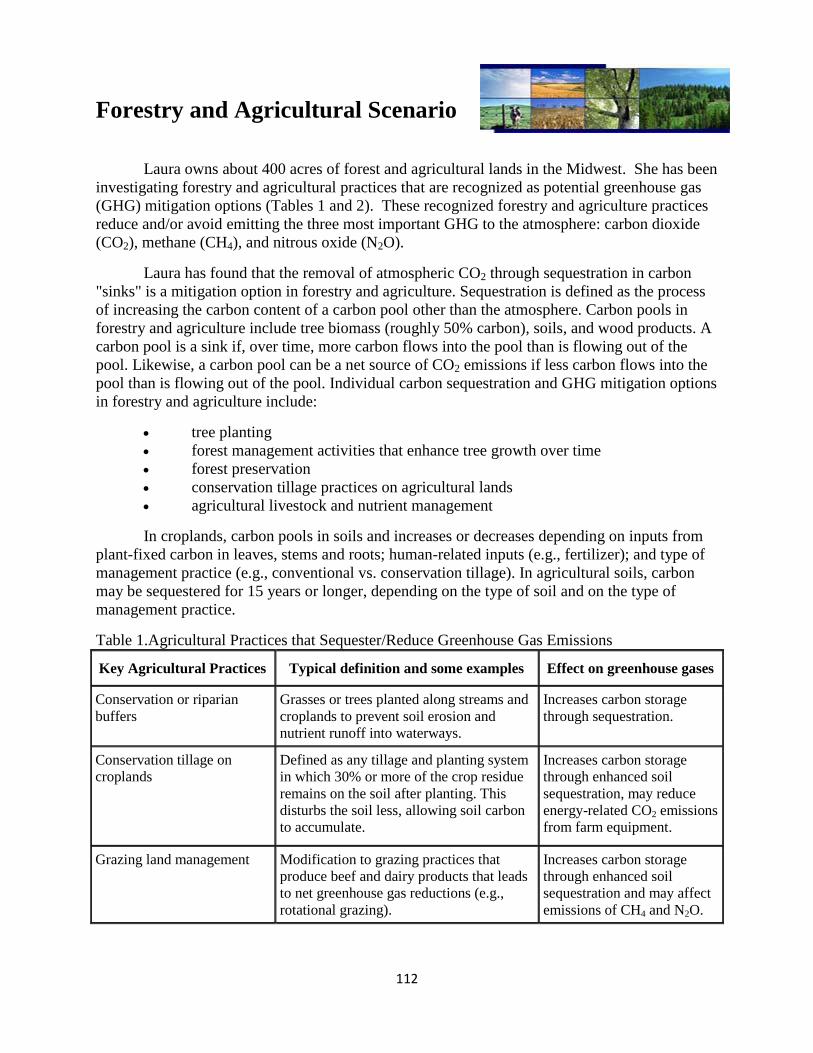
Forestry and Agricultural Scenario
Laura owns about 400 acres of forest and agricultural lands in the Midwest. She has been
investigating forestry and agricultural practices that are recognized as potential greenhouse gas
(GHG) mitigation options (Tables 1 and 2). These recognized forestry and agriculture practices
reduce and/or avoid emitting the three most important GHG to the atmosphere: carbon dioxide
(CO2), methane (CH4), and nitrous oxide (N2O).
Laura has found that the removal of atmospheric CO2 through sequestration in carbon
"sinks" is a mitigation option in forestry and agriculture. Sequestration is defined as the process
of increasing the carbon content of a carbon pool other than the atmosphere. Carbon pools in
forestry and agriculture include tree biomass (roughly 50% carbon), soils, and wood products. A
carbon pool is a sink if, over time, more carbon flows into the pool than is flowing out of the
pool. Likewise, a carbon pool can be a net source of CO2 emissions if less carbon flows into the
pool than is flowing out of the pool. Individual carbon sequestration and GHG mitigation options
in forestry and agriculture include:
tree planting
forest management activities that enhance tree growth over time
forest preservation
conservation tillage practices on agricultural lands
agricultural livestock and nutrient management
In croplands, carbon pools in soils and increases or decreases depending on inputs from
plant-fixed carbon in leaves, stems and roots; human-related inputs (e.g., fertilizer); and type of
management practice (e.g., conventional vs. conservation tillage). In agricultural soils, carbon
may be sequestered for 15 years or longer, depending on the type of soil and on the type of
management practice.
Table 1.Agricultural Practices that Sequester/Reduce Greenhouse Gas Emissions
Key Agricultural Practices Typical definition and some examples Effect on greenhouse gases
Conservation or riparian
buffers
Grasses or trees planted along streams and
croplands to prevent soil erosion and
nutrient runoff into waterways.
Increases carbon storage
through sequestration.
Conservation tillage on
croplands
Defined as any tillage and planting system
in which 30% or more of the crop residue
remains on the soil after planting. This
disturbs the soil less, allowing soil carbon
to accumulate.
Increases carbon storage
through enhanced soil
sequestration, may reduce
energy-related CO2 emissions
from farm equipment.
Grazing land management Modification to grazing practices that
produce beef and dairy products that leads
to net greenhouse gas reductions (e.g.,
rotational grazing).
Increases carbon storage
through enhanced soil
sequestration and may affect
emissions of CH4 and N2O.
113
In forests, carbon may be sequestered over decades, until mature ecosystems reach
carbon saturation; however, natural decay and disturbances such as fire or harvesting may release
carbon into the atmosphere. Carbon from forests may be stored in wood products like furniture
and housing lumber for decades. When the carbon in wood products decays, it is released as
CO2 back to the atmosphere.
Nationally, forests and croplands sequester over 600 teragrams (Tg) of CO2 equivalent
per year. This current sequestration offsets about 12% of the total U.S. CO2 emissions from the
energy, transportation, and industrial sectors. Internationally, 20% of the world's annual CO2
emissions result from land use change, primarily deforestation in Central and South America,
Africa, and Asia. This change in land use shifts naturally high-carbon sink forests to generally
lower-carbon sink crop and grazing lands or urban areas.
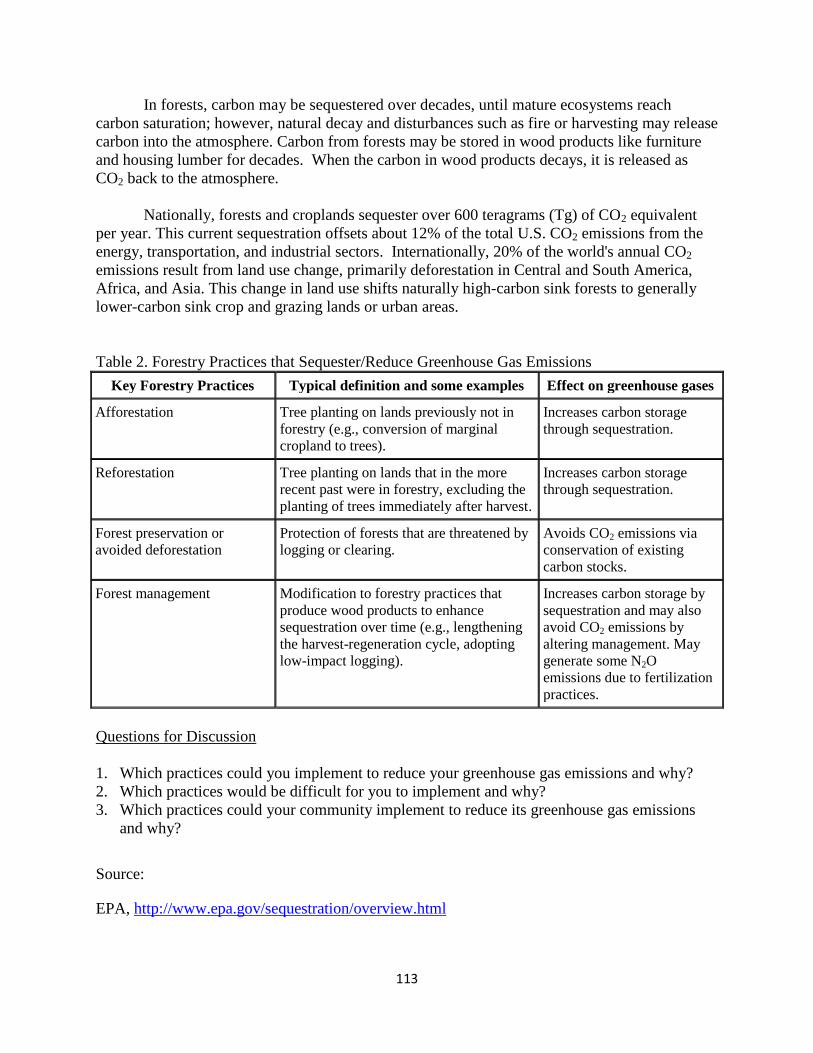
Table 2. Forestry Practices that Sequester/Reduce Greenhouse Gas Emissions
Key Forestry Practices Typical definition and some examples Effect on greenhouse gases
Afforestation Tree planting on lands previously not in
forestry (e.g., conversion of marginal
cropland to trees).
Increases carbon storage
through sequestration.
Reforestation Tree planting on lands that in the more
recent past were in forestry, excluding the
planting of trees immediately after harvest.
Increases carbon storage
through sequestration.
Forest preservation or
avoided deforestation
Protection of forests that are threatened by
logging or clearing.
Avoids CO2 emissions via
conservation of existing
carbon stocks.
Forest management Modification to forestry practices that
produce wood products to enhance
sequestration over time (e.g., lengthening
the harvest-regeneration cycle, adopting
low-impact logging).
Increases carbon storage by
sequestration and may also
avoid CO2 emissions by
altering management. May
generate some N2O
emissions due to fertilization
practices.
Questions for Discussion
1. Which practices could you implement to reduce your greenhouse gas emissions and why?
2. Which practices would be difficult for you to implement and why?
3. Which practices could your community implement to reduce its greenhouse gas emissions
and why?
Source:
EPA, http://www.epa.gov/sequestration/overview.html
114
Human Health and Global Warming
Scenario
Dr. Julie Andrews is the epidemiologist for the county health
department. She has become concerned about how well the county is
prepared for local health issues associated with global warming and climate change. She is one
of the few, for only five states have prepared public health response plans related to global
warming and climate change. Her concerns center on increased temperatures and extreme
weather events, specifically flooding. She recalls the July 1995 Chicago heat wave where the
heat index peaked at 119 degrees Fahrenheit. Thousands of Chicagoans developed severe heat-
related illnesses, and paramedics and hospitals were unable to keep up with emergencies. As a
result, 465 people died from heat-related illnesses. Many of these individuals were elderly, in
poor health, lived in poverty, lived alone, and lacked air conditioning. In 1999 Chicago once
again experienced extreme heat conditions. This time they issued heat warnings, opened cooling
centers and provided free transportation to them, and went door-to-door contacting the elderly
that lived alone. This action reduced the number of heat-related deaths to 110.
As shown in Chicago, human health is closely related to local climatic conditions;
however, few individuals are aware of this link. For example, warmer temperatures may result
in:
the direct loss of life from heat exhaustion.
changes in the range and distribution of parasites, increasing infectious diseases.
increases in air and water pollution, which may impact human health.
Global warming may lead to more extreme summer heat waves. Chicago is projected to
experience 25 percent more frequent heat waves and Los Angeles a four-to-eight-fold increase in
heat wave days. Heat exposure has a range of health effects, from mild heat rashes to deadly
heat stroke. Heat exposure can aggravate chronic cardiovascular and respiratory disease. The
results can be severe and result in increased illness and death. In these communities, and others,
individuals with heart problems and asthma, the elderly and very young, and the homeless may
be especially vulnerable to extreme heat. Other extreme weather events, such as floods and
thunderstorms, may also impact human health, causing more human deaths and injuries, as well
as property damage. Over a longer time period, increased temperatures may cause droughts.
Long term drought conditions may strain agricultural productivity, resulting in increased food
prices and food shortages.
Global warming is likely to cause air quality problems, exacerbating respiratory disorders
as a result of more frequent smog (ground-level ozone) events and particulate air pollution.
Higher temperatures and heat waves increase demand for electricity and thus the combustion of
fossil fuels, generating more airborne particulates and indirectly increasing respiratory disease.
Higher temperatures also result in an increase in ground-level ozone concentrations, causing
direct lung injury and increasing the severity of respiratory diseases such as asthma and chronic
obstructive pulmonary disease.

115
There is some concern that warmer temperatures will increase the risk and spread of
infectious diseases transmitted by mosquitoes and other insects, including malaria, dengue fever,
yellow fever, and encephalitis. In locations where these diseases already exist, there is the
possibility that warmer temperatures, in combination with increased rainfall, could prolong the
transmission season. Lyme
disease, which is transmitted
by ticks, may increase in
regions where temperature
and humidity levels are
optimized, and may expand
northward into Canada. The
dynamics of disease
migration are complex, and
temperature is just one
factor affecting the
distribution of these
diseases.
The severity of
human health problems
caused by global warming
and climate change will
likely depend on the
effectiveness and
preparedness of local, public
health systems.
Questions for Discussion
1. What actions could you take to reduce human health issues related to global warming?
2. What actions could you take to prepare for human health issues related to global
warming?
3. What actions could your community take to prepare for human health issues related to
global warming?
Sources:
EPA. http://www.epa.gov/climatechange/effects/health.html
IPCC (2007). Climate Change 2007: Impacts, Adaptation, and Vulnerability. Contribution of
Working Group II to the Fourth Assessment Report of the Intergovernmental Panel on
Climate Change. Cambridge University Press, Cambridge, United Kingdom.
CDC. http://www.cdc.gov/climatechange/

116
Solid Waste,
Greenhouse
Gases, and
Global
Warming
Scenario
Allen, like
most people, was
surprised to learn
that solid waste
reduction and
recycling helps
address global
warming. He knew, as an informed consumer, that the manufacturing, distribution, and use of
products resulted in the emission of greenhouse gases. What he did not know was that the
disposal of solid waste also results in the emission of greenhouse gases. Allen wanted to know
more about how solid waste produces greenhouse gases. What he found was that the disposal of
solid waste produces greenhouse gases from the:
anaerobic decomposition of solid waste in landfills, which produces methane, a
greenhouse gas 21 times more potent than carbon dioxide.
incineration of solid waste, which produces carbon dioxide as a by-product
transportation of solid waste to disposal sites, which produces greenhouse gas emissions
from the combustion of the fuel used in the equipment.
replacement of disposed waste material by new products, which requires the use of fossil
fuels to obtain raw materials and to manufacture the new items, thus producing
greenhouse gas emissions from the combustion of the fuel.
As a responsible consumer, Allen wanted to know what practical solid waste
management strategies he could implement that would reduce his personal greenhouse gas
emissions. What he learned was that waste prevention and recycling—referred to as waste
reduction—is the best way to manage the solid waste he generates, reducing his greenhouse gas
emissions:
Waste reduction diverts solid wastes from landfills, reducing the methane released when
these materials decompose.
Recycling and waste prevention decreases the amount of waste being incinerated and thus
reduces greenhouse gas emissions from the combustion of solid waste.
Recycling saves energy. Manufacturing goods from recycled materials uses less energy
than producing goods from virgin materials. Waste prevention is even more effective at
saving energy. When people reuse products less energy is needed to extract, transport,
117
and process raw materials and to manufacture products. When less energy is used, fewer
fossil fuels are burned and less carbon dioxide is emitted to the atmosphere.
Waste prevention and recycling of paper products allow more trees to remain standing in
the forest, where they continue to remove carbon dioxide from the atmosphere and store
it as wood, called "carbon sequestration."
To reduce, reuse, and recycle, Allen identified the following waste reduction strategies he
could implement at home and work:
Reduce food waste by using up food before buying more food.
Donate little used or slightly worn clothing to charities and shelters.
Reuse items around the house such as rags and wipes, empty jars and mugs, party
decorations, and gift wrap.
Buy products in concentrate, bulk, and in refillable containers, reducing packaging waste
Check product labels to determine an item's recyclability and whether it was made from
recycled materials. Buying recycled encourages manufacturers to make more recycled-
content products.
Recycle paper, newspapers, magazines, beverage containers and glass jars.
Use canvas/cloth tote bags when shopping instead of a store’s plastic bag.
Stop buying bottled water; use a reusable thermos.
Compost grass clippings and yard waste.
Reduce waste by using two-sided printing and copying, and recycle used printer
cartridges.
As a result of implementing these strategies, Allen greatly reduced his greenhouse gas
emissions. He pondered the idea of forming a neighborhood coalition for reducing solid waste.
Questions for Discussion
1. Which activity/activities could you engage in and why?
2. Which activity/activities would be difficult for you to do and why?
3. Which activities could your community or neighborhood implement and why?
4. What strategies could you implement to involve your neighbors in reducing their solid
waste?
Source:
EPA http://www.epa.gov/climatechange/wycd/waste/generalinfo.html

118
Handout: Climate Education Websites
The websites listed provide both classroom-based instructional activities and materials and climate science content background. In addition, the following websites provide information on climate literacy and climate change:
Climate Literacy: The Essential Principles of Climate Science http://www.climatescience.gov/Library/Literacy/ Intergovernmental Panel on Climate Change (IPCC) http://www.ipcc.ch/
Website Link
Activities for Conceptualizing Climate and Climate Change
http://climate.agry.purdue.edu/climate/ccc/
CoCoRaHS observing network for precipitation reports (rain, hail, snow, drought, significant weather)
www.cocorahs.org
NOAA Education http://www.education.noaa.gov/index.html
NOAA Climate Education Resources http://www.education.noaa.gov/Climate/
The USGS and Science Education http://education.usgs.gov/
NASA Education http://www.nasa.gov/offices/education/about/index.html
US Environmental Protection Agency http://www.epa.gov/climatechange/index.html
Digital Library for Earth System Education http://dlese.org/library/index.jsp
Climate Change at the National Academies http://dels.nas.edu/climatechange/ecological-impacts.shtml
NASA Earth Observatory http://earthobservatory.nasa.gov/
PBS http://www.pbs.org/now/classroom/globalwarming.html
Center for Integrated Study of the Human Dimensions of Global Change
http://hdgc.epp.cmu.edu/teachersguide/teachersguide.htm
Global Warming: Understanding the Forecast http://geoflop.uchicago.edu/forecast/docs/lectures.html
Climate Literacy Catalog http://serc.carleton.edu/climatechange/climate_literacy_search.html
Smithsonian Institution-Climate Change http://www.smithsonianconference.org/climate/teachers/
The Globe Program http://classic.globe.gov/
Earth Watch Institute http://www.earthwatch.org/aboutus/education/lessonideas/
Global Climate Change-Climate kids http://climate.nasa.gov/kids/index.cfm
The Ultimate Guide to Weather and Climate Resources Online
http://www.guidetoonlineschools.com/library/weather-resources
Climate Prediction Center, Educational Materials http://www.cpc.ncep.noaa.gov/products/outreach/education.shtml

119
Handout: Climate and Climate Change Resources The following websites provide: 1) answers to the most often asked questions about climate and climate change, 2) links to short video casts and other media resources, and 3) access to climate data for individual analysis or classroom use. Answers to Frequently Asked Questions about Climate and Climate Change
Climate FAQs (NCDC): http://www.ncdc.noaa.gov/faqs/index.html UCAR (University Corporation for Atmospheric Research) Global Warming and Climate Change
FAQs: http://www2.ucar.edu/climate/faq Climate glossary: http://www.cpc.ncep.noaa.gov/products/outreach/glossary.shtml
Multimedia Resources
UCAR Podcasts (brief 3-5 min general descriptions by experts on main questions): http://www.ucar.edu/webcasts/voices/#
Additional UCAR multimedia: http://www2.ucar.edu/news/understanding-climate-change-multimedia-gallery
NOAA Climate Services (videos and articles of updated topics): http://www.climate.gov/#climateWatch
Access to Climate Data
National Climatic Data Center (NCDC). National station specific temperature and precipitation data: http://www.ncdc.noaa.gov/oa/ncdc.html
NCDC Climate Program Office data and products (quick access to NCDC data and climatological normals, i.e. Climate-At-A-Glance): http://www.climate.noaa.gov/index.jsp?pg=./data_products/data_index.jsp&data=catalog
Climate Prediction Center (CPC):
monitoring and data index: http://www.cpc.ncep.noaa.gov/products/MD_index.shtml
weather and climate data: http://www.cpc.ncep.noaa.gov/products/precip/CWlink/
global regional climate maps (temp and precipitation): http://www.cpc.ncep.noaa.gov/products/analysis_monitoring/regional_monitoring/
monthly atmospheric and SST indices: http://www.cpc.ncep.noaa.gov/data/indices/
regional climate maps: http://www.cpc.ncep.noaa.gov/products/analysis_monitoring/regional_monitoring/usa.shtml
U.S. temp and precip trends: http://www.cpc.ncep.noaa.gov/charts.shtml
Northern hemisphere snow cover: http://www.cpc.ncep.noaa.gov/data/snow/ Southern Climate Impacts Planning Program (SCIPP):
data tools: http://www.southernclimate.org/data.php
annual monthly graphs: http://www.southernclimate.org/products/temp_precip.php
graphs by season: http://www.southernclimate.org/products/trends.php
graphs by station: http://www.southernclimate.org/products/climo_graph.php
120
Handout: Background Readings on Climate and Climate Change
The following NASA Earth Observatory articles provide excellent background reading on climate and
climate change:
Climate and Earth’s Energy Budget : http://earthobservatory.nasa.gov/Features/EnergyBalance/
Global Warming:
http://earthobservatory.nasa.gov/Features/GlobalWarming/global_warming_2007.pdf
The Carbon Cycle: http://earthobservatory.nasa.gov/Features/CarbonCycle/carbon_cycle2001.pdf
The Greenhouse Effect:
http://earthobservatory.nasa.gov/Experiments/PlanetEarthScience/GlobalWarming/GW_Movie3.php
Oceans and Climate:
http://earthobservatory.nasa.gov/Features/OceanClimate/

121
Glossary of Common Climate Terms
(from CPC, IPCC, EPA, and NWS)
Adaptation – A change in the way one lives due to the influence of the environment. Moreover, how we cope with changes in climate.
Aerosol – A system of colloidal particles dispersed in a gas, such as smoke or fog.
Albedo – Reflectivity; the fraction of radiation striking a surface that is reflected by that surface (calculated by dividing reflective light by the incident (incoming) light).
Anomaly - The deviation of a measurable unit, (e.g., temperature or precipitation) in a
given region over a specified period from the long-term average, often the thirty year
mean, for the same region.
Carbon sink - A carbon pool is a sink if, over time, more carbon flows into the pool than is flowing out of the pool.
Carbon source - A carbon pool can be a net source of CO2 emissions if less carbon flows into the pool than is flowing out of the pool.
Chlorofluorocarbons (CFCs) - Manufactured substances used as coolants and computer
chip cleaners. When these products break down they destroy stratospheric ozone, creating
the Antarctic Ozone Hole in the Southern Hemisphere spring (Northern Hemisphere fall).
While no longer in use, their long lifetime will lead to a very slow removal from the atmosphere.
Climate - The average of weather over at least a 30-year period. Note that the climate
taken over different periods of time (30 years, 1000 years) may be different. The old saying
is climate is what we expect and weather is what we get.
Climate Change - A non-random change in climate that is measured over several decades or longer. The change may be due to natural or human-induced causes.
Climate Model - Mathematical model for quantitatively describing, simulating, and
analyzing the interactions between the atmosphere and underlying surface (e.g., ocean, land, and ice).
Climate Outlook - A climate outlook gives probabilities that conditions, averaged over a
specified period, will be below-normal, normal, or above-normal.
Climate System - The system consisting of the atmosphere (gases), hydrosphere (water),
lithosphere (solid rocky part of the Earth), and biosphere (living) that determine the Earth's climate.
Climate Variability – Fluctuations of conditions in the Earth’s climate over various time
scales, commonly observed from season to season with abnormally wet/dry or warm/cool
periods. The ENSO cycle is also an example of climate variability.
122
Climatology - (1) The description and scientific study of climate. (2) A quantitative description of climate showing the characteristic values of climate variables over a region.
Convection - In meteorology, the term is used specifically to describe vertical transport of
heat and moisture in the atmosphere, especially by updrafts and downdrafts in an unstable
atmosphere. The terms "convection" and "thunderstorms" often are used interchangeably, although thunderstorms are only one form of convection.
CPC – Climate Prediction Center
Drought - Drought is a deficiency of moisture that results in adverse impacts on people,
animals, or vegetation over a sizeable area. NOAA together with its partners provides short- and long-term Drought Assessments.
El Niño - El Niño, a phase of ENSO, is a periodic warming of surface ocean waters in the
eastern tropical Pacific along with a shift in convection in the western Pacific further east
than the climatological average. These conditions affect weather patterns around the world.
El Niño episodes occur roughly every four-to-five years and can last up to 12-to-18 months.
The preliminary CPC definition of El Niño is a phenomenon in the equatorial Pacific Ocean
characterized by a positive sea surface temperature departure from normal, averaged over
three months, greater than or equal in magnitude to 0.5oC in a region defined by the Niño 3.4 dataset.
Ensemble Forecast - Multiple predictions from an ensemble of slightly different initial
conditions and/or various versions of models. The objective is to improve the accuracy of
the forecast through averaging the various forecasts, which eliminates non-predictable
components, and to provide reliable information on forecast uncertainties from the diversity
amongst ensemble members. Forecasters use this tool to measure the likelihood of a
forecast.
ENSO (El Niño-Southern Oscillation) - Originally, ENSO referred to El Niño/ Southern
Oscillation, or the combined atmosphere/ocean system during an El Niño warm event. The
ENSO cycle includes La Niña and El Niño phases as well as neutral phases, or ENSO cycle, of
the coupled atmosphere/ocean system though sometimes it is still used as originally
defined. The Southern Oscillation is quantified by the Southern Oscillation Index (SOI).
Evaporation - The physical process by which a liquid or solid is changed to a gas; the opposite of condensation.
Forecasts - A weather forecast, or prediction, is an estimation based on special knowledge
of the future state of the atmosphere with respect to temperature, precipitation, and wind.
Weather forecasts are now routinely provided for up to 14 days in advance and outlooks for
seasonal and longer timescales.
Global Warming - Certain natural and human-produced gases prevent the sun's energy
from escaping back to space leading to an overall rise in the temperature of the Earth's atmosphere.
Greenhouse Effect (GHE) - The atmosphere allows solar radiation to reach the earth
relatively easily. The atmosphere absorbs the infrared radiation emitted by the Earth's
surface and radiates it back to the Earth in much the same way a greenhouse traps heat as

123
the sun's rays pass through the glass, and the heat generated does not pass back through
the glass. The "greenhouse effect" causes the surface of the Earth to be much warmer that
it would be without the atmosphere 60oF). Without the greenhouse effect, life as we know it might not exist on Earth.
Greenhouse Gas (GHG) - Certain gases, such as water vapor, carbon dioxide, and methane, that more effectively trap heat affecting the Earth's surface temperature.
IPCC – Intergovernmental Panel on Climate Change
Jet Stream - Strong winds concentrated within a narrow zone in the atmosphere in the
upper troposphere, about 30,000 feet aloft that generally move in an easterly direction that
drive weather systems around the globe. In North America jet streams are more
pronounced in winter.
Keeling Curve – The trend of atmospheric carbon dioxide levels over time.
La Niña - La Niña, a phase of ENSO, is a periodic cooling of surface ocean waters in the
eastern tropical Pacific along with a shift in convection in the western Pacific further west
than the climatological average. These conditions affect weather patterns around the world.
The preliminary CPC definition of La Niña is a phenomenon in the equatorial Pacific Ocean
characterized by a negative sea surface temperature departure from normal (for the 1971-
2000 base period), averaged over three months, greater than or equal in magnitude to 0.5oC in a region defined by the Niño 4 dataset.
Meteorology - The scientific study of the physics, chemistry, and dynamics of the Earth's
atmosphere, especially weather and climate.
Mitigation – A human intervention to reduce the sources or enhance the sinks of
greenhouse gases.
NCAR –National Center for Atmospheric Research
NOAA – National Oceanic and Atmospheric Administration
Normal - To understand whether precipitation and temperature is above or below normal
for seasons and longer timescales, normal is defined as the average weather over 30 years.
These averages are recalculated every ten years. The National Weather Service has just recalculated the baseline period for normal from 1971 to 2000 to 1981 to 2010.
NWS – National Weather Service
Ozone - A molecule consisting of three oxygen atoms that is formed by a reaction of
oxygen and ultraviolet radiation. In the stratosphere, ozone has beneficial properties where
it forms an ozone shield that prevents dangerous radiation from reaching the Earth's
surface. Closer to the planet's surface, ozone is considered an air pollutant that adversely affects humans, plants and animals as well as a greenhouse gas.
Ozone Hole - A severe depletion of stratospheric ozone over Antarctica that occurs each
spring. The possibility exists that a hole could form over the Arctic as well. The depletion is
124
caused by a chemical reaction involving ozone and chlorine, primarily from human produced sources, cloud particles, and low temperatures.
Sea Surface Temperatures (SSTs) - The term refers to the mean temperature of the ocean in the upper few meters.
Stratosphere - The region of the atmosphere extending from the top of the troposphere to
the base of the mesosphere, an important area for monitoring stratospheric ozone.
Teleconnection - A strong statistical relationship between weather in different parts of the
globe. For example, there appears to be a teleconnection between the tropics and North America during El Niño.
Thermocline - As one descends from the surface of the ocean, the temperature remains
nearly the same as it was at the surface, but at a certain depth temperature starts
decreasing rapidly with depth. This boundary is called the thermocline. In studying the
tropical Pacific Ocean, the depth of 20oC water ("the 20oC isotherm") is often used as a
proxy for the depth of the thermocline. Along the equator, the 20oC isotherm is typically
located at about 50m depth in the eastern Pacific, sloping downwards to about 150 m in the western Pacific.
Troposphere - The lowest portion of the atmosphere which lies next to the earth's surface where most weather occurs.
Ultraviolet (UV) (or Ultraviolet Radiation) - Ultraviolet radiation from the sun plays a
role in the formation of the ozone layer by acting as a catalyst for a chemical reaction that
breaks apart oxygen molecules which then recombine to form ozone. The absorption of UV
by stratospheric ozone and atmospheric oxygen prevents very little ultraviolet radiation to reach earth's surfaces where it can detrimental effects on human health and property.
Weather-The present condition of the atmosphere, including temperature, humidity, wind,
precipitation, among other meteorological elements and their variations over relatively short
time periods (hours and days).