mathematics and science in schools in sub-saharan africa · 2018-02-26 · creep demo the...
TRANSCRIPT

Mathematics and Science in
Schools in Sub-Saharan Africa

MATERIAL SCIENCE
Introduction to Material Properties

What Material Scientists Do

Physical Properties
Melting & Boiling Points Magnetism
Color

Physical Properties
Density

Lab: Density Determination

Lab: Density Determination
Material
Sample
Density
(g/ml)
Material
Sample
Density
(g/ml)
A H
B I
C J
D K
E L
F M
G N
Data Chart

Lab: Density Determination
Material
Sample
Density
(g/ml)
Material
Sample
Density
(g/ml)
Walnut 0.64 Phenolic 1.32
Oak 0.75 PVC 1.37
Maple 0.77 Acetyl 1.42
Polypropylene 0.90 PTFE 2.20
Polyethylene 0.92 Aluminum 2.71
Nylon 1.15 Brass 8.56
Acrylic 1.17 Copper 8.91
Material Density Chart

Lab: Density Determination
Material
Sample
Material
Identity
Material
Sample
Material
Identity
A H
B I
C J
D K
E L
F M
G N
Analysis Chart

Density
Density = Mass/Volume

Physical Properties
Viscosity
Viscosity is an internal property of a fluid that
offers resistance to flow .

Thickness

Viscosity Determination
Calculations
Viscosity = п = 2(Δp)ga^2/9v
Δp = difference in density
between glass marble and test
liquid
g = rate of free fall = 9.81 m/s^2
a = radius of sphere
v = velocity

Viscosity Testing
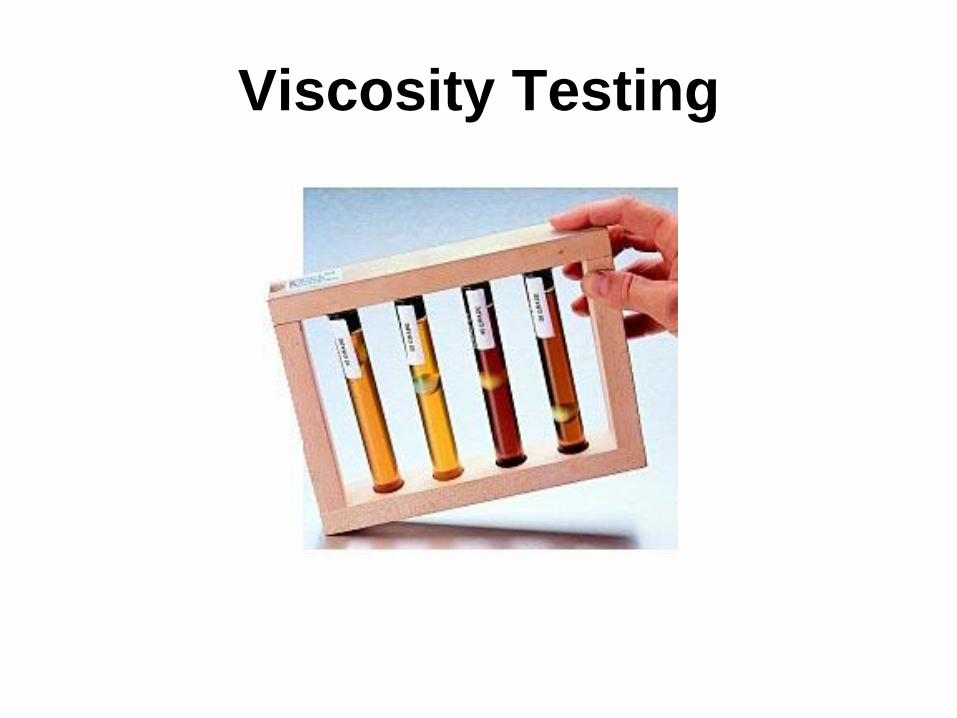
Viscosity Testing

Viscosity Units
ISO
International Standards Organization
Viscosity Grade Numbers
Society of Automotive Engineers
Viscosity Grade Numbers
SAE


Lab: Viscosity Determination

Viscosity Testing

Lab: Viscosity DeterminationData Chart
Tube Time (s)
Red
Blue
Green
Grey
Black

Lab: Viscosity DeterminationCalculations
Tube ISO
Red 10
Blue 32
Green 46
Grey
Black

Lab: Viscosity Explorer

Lab: Viscosity ExplorerData Chart
Olive Oil Temperature Drop Time
0°C
10°C
20°C
30°C
40°C
50°C
60°C
70°C
80°C
90°C


10W-40
10W = Oil’s Viscosity at
0°F
40 = Oil’s Viscosity at
212°F


Lab: Dilatant Material

Dilatant Material

Dilatant Material

Silly Putty

Automotive

Thixotropic

Thixotropic

Construction


Advanced Thixotropic Metallurgy

Military


Medicine


Lab: Japan Sand

Chemical Properties
Burning
Reaction to Acids & Water
Corrosion

Thermal Properties
Conductivity

Lab: Macho Conduction

Lab: Macho Conduction

Lab: Macho Conduction
Metal Time (s)
Aluminum
Brass
Copper
Steel
X
Data Chart

Thermal Properties
Thermal Expansion
Conductivity


Lab: Linear Expansion of a Metal

Lab: Linear Expansion of a MetalData Chart
Metal Sample Expansion after 10 minutes
Aluminum
Brass
Steel

Thermal Properties
Thermal Expansion Specific Heat
Conductivity

Specific Heat
3,470 J/Kg°C
4.187J/Kg°C
0.217 J/Kg°C

Lab: Heat Capacity of Metals

Lab: Heat Capacity of MetalsData Chart
Metal
Sample
Mass
(g)
Δtemp
(°C)
Water Mass
(g)
Δtemp
(°C)
Silver 20.0 30.0
Gold 20.0 30.0
Copper 20.0 30.0
Iron 20.0 30.0
X 20.0 30.0
Y 20.0 30.0

Lab: Heat Capacity of MetalsCalculation Table
Metal
Sample
Heat Gained
(joules)
Heat Lost
(joules)
Specific Heat
(J/g x K)
Silver
Gold
Copper
Iron
X
Y

Lab: Heat Capacity of MetalsCalculations
Heat Energy Gained by Water =
Heat Energy Lost by Metal
Heat Gained by Water =
Mass X Δtemp X 4.18
Specific Heat of Metal = Heat Energy Gained
Mass X Δtemp

Mechanical Properties
Hardness Workability

Mechanical Properties
Strength Elasticity

Elasticity is not Flexibility

Elasticity is not Stretch-ability

Elasticity
A material’s ability to return to its original
shape after being deformed.

Vocabulary


Deformation
Change in shape of an object.

Strain

Stress
Applied Force / Original Area

Tension & Compression

Shear
When 2 forces, acting like a pair of shears, cut a
body between them.

Shear Testing

Hydrostatic
Stress unilaterally applied to an object.

Material Testing Device
Extensometer

Extensometer
An extensometer measures the elongation of a
material while applying tension.

Instrom

Instrom


Stress Strain Curve

Elastic Limit


Young’s Modulus

Composite Material Testing
Fiberglass, Kevlar & Carbon Fiber


Kevlar

Fiberglass

Carbon Fiber

Lab: Youngs’ Modulus of a Spring

Lab: Youngs’ Modulus of a SpringData Chart
Stress Strain

Stress Strain Curve

Ultimate Stress

Lab: Ultimate Stress

Lab: Ultimate StressData Chart
Stress Strain

Tensile Strength
Tensile strength is defined as the highest stress a
material can withstand before failure occurs.


Stress
Strain
Ceramics
Metals
Polymers
Stress Strain Curve Interpretation
Demo

Ductility
Ductility is measured by the amount of elongation
that can be applied to a material before failure
occurs.


Toughness
Toughness is defined as the total area under the
stress strain curve. It indicates the amount of energy
absorbed before failure.


Which Material Is Stronger?
Which Material Is Tougher?
Which Material Is More Ductile?

Stress Strain Curve Interpretation
Construction
Materials
Stainless Steel

Stress Strain Curve Interpretation
Anisotropic Behavior of Bone

Creep
Demo
The deformation that occurs at elevated temperature
under constant load.

Testing Energy Absorption

Coefficient of Restitution

0
5
10
15
20
25
30
35
40
10cm 20cm 30cm 40cm 50cm
bounce
Coefficient of Restitution

Lab: Core of Restitution

Lab: Core of Restitution
Ball Drop Height Rebound Height COR
Soccer
Golf
Tennis
Basketball
Racket
Field Hockey
Ping Pong
Wiffle
Softball
Baseball
Happy Ball
Sad Ball
Data Chart

Friction
Force that opposes motion.

Resistance caused by 2 objects in
contact with each other.

Static Friction
Friction between 2 nonmoving objects.

Coefficient of Static Friction

Coefficient Determination
µ static = tan (angle of tilt)

Lab: Static Friction

Lab: Static Friction
Type of
Footwear
Angle of
Elevation
Coefficient of
Static Friction
Data Chart

Sliding Friction
Kinetic Friction

Sliding Friction
Friction between moving object(s).

Coefficient of Kinetic Friction


Lab: Sliding Friction

Lab: Sliding Friction
Surface
Table Top
F(gravity)
(N)
F(friction)
(N)
Coefficient of
Sliding Friction
Wood
Sandpaper
Cardboard
Plastic
Data Chart

Friction Tester

Color, Density, Size, Magnetism,
Melting and Boiling points,
Crystal Structure, Luster, Viscosity
Workability, Brittleness, Hardness, Elasticity,
Plasticity, Toughness,
Strength
Conductivity, Specific Heat,
Thermal Expansion
Burning
Reaction to Acids/Water
Corrosion/OxidationReduction
Properties of Materials
Chemical Properties Physical Properties
Thermal Properties Mechanical Properties

Material Science Bowling

Object of the Game
In this activity,
you will be bowling with
words.

I F I C
A R T
A L
I
Each of the ten pins shown is a
letter.

I F I C
A R T
A L
I
If You Make a 10 Letter Word
A R T I F I C I A L

You have a STRIKE!

I F I C
A R T
A L
I
If You Make 2 Words Using
All 10 Letters..

You may use
SCIENCE & NONSCIENCE
words!

Frame 1
S E I T
R E P
O R
P

Frame 1
P R O P E R T I E S

Frame 2
N O I T
N O C
D U
N

Frame 2
C O N D U C T I O N

Frame 3
C Y I T
S A L
T I
E

Frame 3
E L A S T I C I T Y

Frame 4
B O I N
U M C
S O
T

Frame 4
C O M B U S T I O N

Frame 5
S O I T
R A N
O B
P

Frame 5
A B S O R P T I O N

Frame 6
M I E A
T V U
O T
O

Frame 6
A U T O M O T I V E

Frame 7
S A K T
B E A
L L
B

Frame 7
B A S K E T B A L L

Frame 8
C Y I T
N L N
D A
A

Frame 8
D I L A N T A N C Y

Frame 9
R C I T
L E E
A L
C

Frame 9
E L E C T R I C A L

Frame 10
H E C M
I N A
A C
L

Frame 10
M E C H A N I C A L

Frame 10
O R I T
S U L
A N
S

Frame 10
I N S U L A T O R S

Frame 10
M E A T
R Y G
L L
U

Frame 10
M E T A L L U R G Y