mathematics - paterson public schools curriculum guides/ap...ap calculus ab is a course in...
TRANSCRIPT
1 | P a g e
MATHEMATICS
AP Calculus
Unit 2: Limits & Continuity
2 | P a g e
Course Philosophy/Description
AP Calculus AB is a course in single-variable calculus that includes techniques and applications of the derivative, techniques and applications of the
definite integral, and the Fundamental Theorem of Calculus. It is equivalent to at least a semester of calculus at most colleges and universities,
perhaps to a year of calculus at some. Algebraic, numerical, and graphical representations are emphasized throughout the course.
By the end of the course students will have learned Limits and Continuity; the Fundamental Theorems of Calculus; Definition of the Derivative of a
Function and Techniques of Differentiation; Applications of the Derivative to maximize or minimize a function; the Chain Rule, Mean Value
Theorem; Rate of Change problems; Curve Sketching; Definite and Indefinite integration of algebraic, trigonometric, and transcendental functions.
The connections between numerical, graphical, analytical, and verbal communication of Calculus topics are a major theme in the class along
with the overall conceptual understanding of the Calculus topics covered. The use of technology reinforces these approaches to confirm and interpret
the results. Calculus is a transition course linking the mathematical and algebraic procedures taught in previous classes with the higher-level skills
required in post-secondary technical programs.
PREREQUISITES:
Before studying Calculus, all students must successfully complete coursework for Algebra I, Geometry, Algebra II, and Pre-Calculus. Students must
be familiar with the properties, the algebra, the graphs and the language of functions. Attitude prerequisites include a willingness to work both in and
out of class, a willingness to collaborate with classmates to foster mutual understanding, and a sincere intent to place out of the first semester of
college calculus rather than repeat it.
3 | P a g e
ESL Framework
This ESL framework was designed to be used by bilingual, dual language, ESL and general education teachers. Bilingual and dual language
programs use the home language and a second language for instruction. ESL teachers and general education or bilingual teachers may use this
document to collaborate on unit and lesson planning to decide who will address certain components of the SLO and language objective. ESL teachers
may use the appropriate leveled language objective to build lessons for ELLs which reflects what is covered in the general education program. In this
way, whether it is a pull-out or push-in model, all teachers are working on the same Student Learning Objective connected to the Common Core
standard. The design of language objectives are based on the alignment of the World-Class Instructional Design Assessment (WIDA) Consortium’s
English Language Development (ELD) standards with the Common Core State Standards (NJSLS). WIDA’s ELD standards advance academic
language development across content areas ultimately leading to academic achievement for English learners. As English learners are progressing
through the six developmental linguistic stages, this framework will assist all teachers who work with English learners to appropriately identify the
language needed to meet the requirements of the content standard. At the same time, the language objectives recognize the cognitive demand
required to complete educational tasks. Even though listening and reading (receptive) skills differ from speaking and writing (expressive) skills
across proficiency levels the cognitive function should not be diminished. For example, an Entering Level One student only has the linguistic ability
to respond in single words in English with significant support from their home language. However, they could complete a Venn diagram with single
words which demonstrates that they understand how the elements compare and contrast with each other or they could respond with the support of
their home language (L1) with assistance from a teacher, para-professional, peer or a technology program.
http://www.state.nj.us/education/modelcurriculum/ela/ELLOverview.pdf
4 | P a g e
Pacing Chart – Unit 2
# Student Learning Objective NJSLS
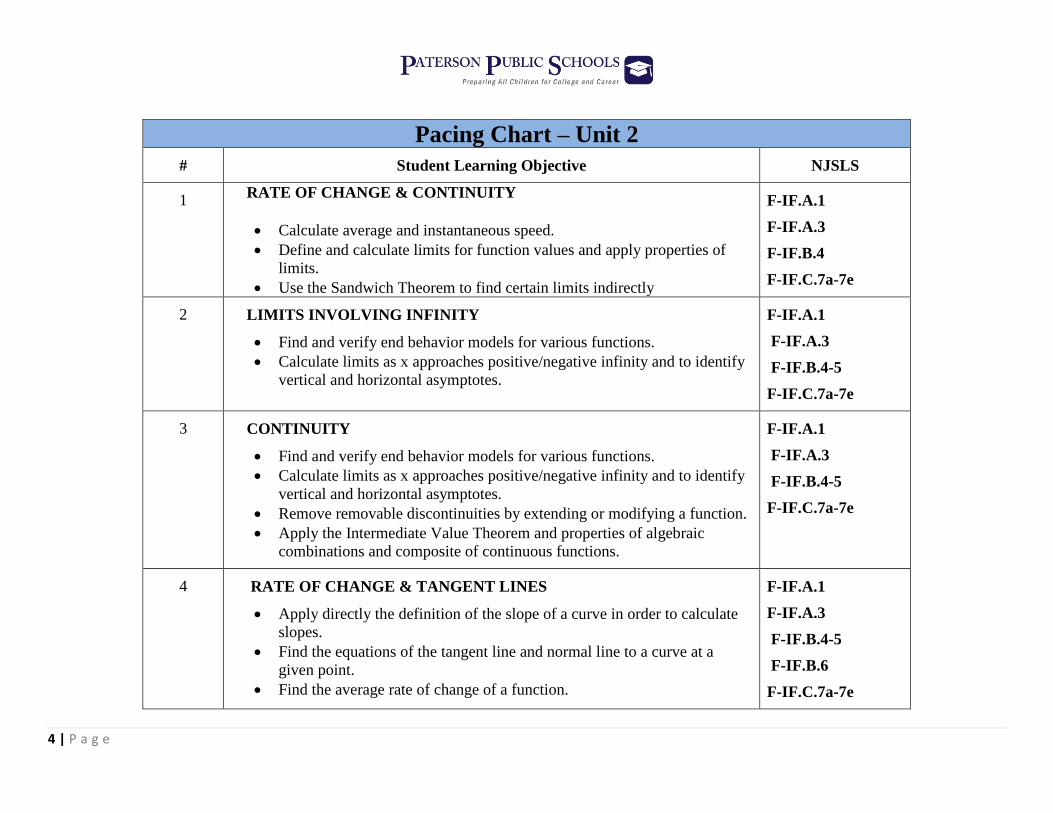
1 RATE OF CHANGE & CONTINUITY
Calculate average and instantaneous speed.
Define and calculate limits for function values and apply properties of
limits.
Use the Sandwich Theorem to find certain limits indirectly
F-IF.A.1
F-IF.A.3
F-IF.B.4
F-IF.C.7a-7e
2 LIMITS INVOLVING INFINITY
Find and verify end behavior models for various functions.
Calculate limits as x approaches positive/negative infinity and to identify
vertical and horizontal asymptotes.
F-IF.A.1
F-IF.A.3
F-IF.B.4-5
F-IF.C.7a-7e
3 CONTINUITY
Find and verify end behavior models for various functions.
Calculate limits as x approaches positive/negative infinity and to identify
vertical and horizontal asymptotes.
Remove removable discontinuities by extending or modifying a function.
Apply the Intermediate Value Theorem and properties of algebraic
combinations and composite of continuous functions.
F-IF.A.1
F-IF.A.3
F-IF.B.4-5
F-IF.C.7a-7e
4 RATE OF CHANGE & TANGENT LINES
Apply directly the definition of the slope of a curve in order to calculate
slopes.
Find the equations of the tangent line and normal line to a curve at a
given point.
Find the average rate of change of a function.
F-IF.A.1
F-IF.A.3
F-IF.B.4-5
F-IF.B.6
F-IF.C.7a-7e
5 | P a g e
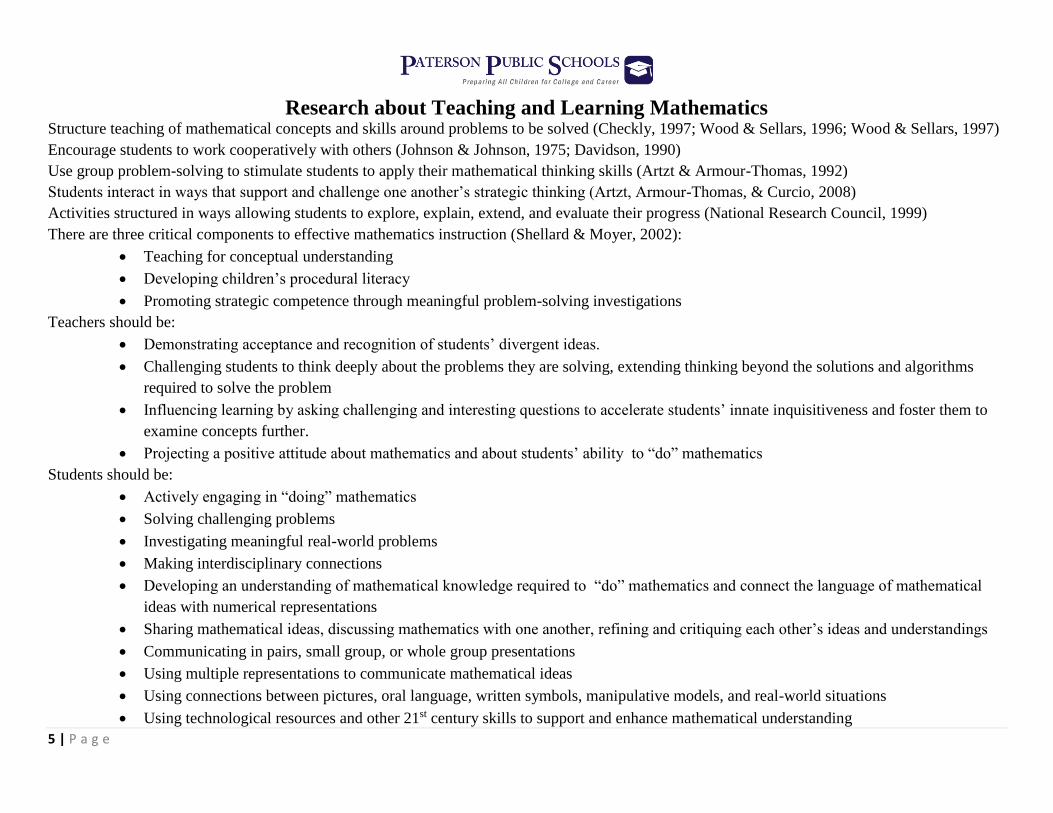
Research about Teaching and Learning Mathematics Structure teaching of mathematical concepts and skills around problems to be solved (Checkly, 1997; Wood & Sellars, 1996; Wood & Sellars, 1997)
Encourage students to work cooperatively with others (Johnson & Johnson, 1975; Davidson, 1990)
Use group problem-solving to stimulate students to apply their mathematical thinking skills (Artzt & Armour-Thomas, 1992)
Students interact in ways that support and challenge one another’s strategic thinking (Artzt, Armour-Thomas, & Curcio, 2008)
Activities structured in ways allowing students to explore, explain, extend, and evaluate their progress (National Research Council, 1999)
There are three critical components to effective mathematics instruction (Shellard & Moyer, 2002):
Teaching for conceptual understanding
Developing children’s procedural literacy
Promoting strategic competence through meaningful problem-solving investigations
Teachers should be:
Demonstrating acceptance and recognition of students’ divergent ideas.
Challenging students to think deeply about the problems they are solving, extending thinking beyond the solutions and algorithms
required to solve the problem
Influencing learning by asking challenging and interesting questions to accelerate students’ innate inquisitiveness and foster them to
examine concepts further.
Projecting a positive attitude about mathematics and about students’ ability to “do” mathematics
Students should be:
Actively engaging in “doing” mathematics
Solving challenging problems
Investigating meaningful real-world problems
Making interdisciplinary connections
Developing an understanding of mathematical knowledge required to “do” mathematics and connect the language of mathematical
ideas with numerical representations
Sharing mathematical ideas, discussing mathematics with one another, refining and critiquing each other’s ideas and understandings
Communicating in pairs, small group, or whole group presentations
Using multiple representations to communicate mathematical ideas
Using connections between pictures, oral language, written symbols, manipulative models, and real-world situations
Using technological resources and other 21st century skills to support and enhance mathematical understanding
6 | P a g e
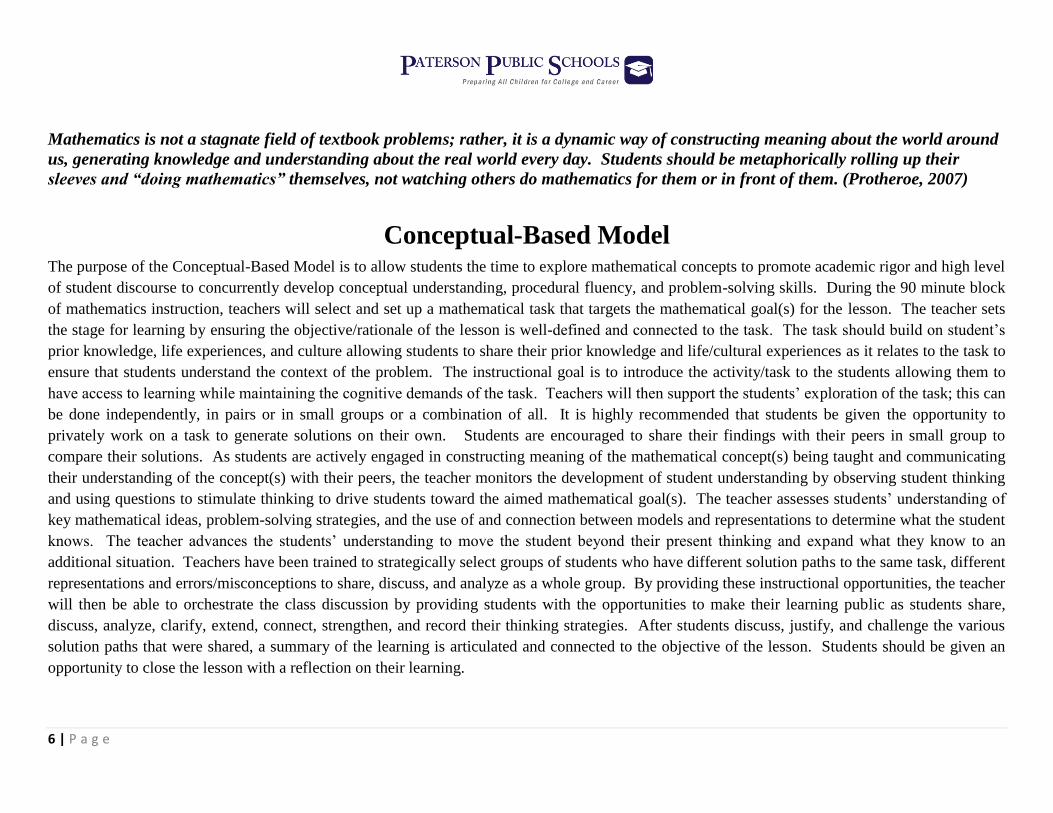
Mathematics is not a stagnate field of textbook problems; rather, it is a dynamic way of constructing meaning about the world around
us, generating knowledge and understanding about the real world every day. Students should be metaphorically rolling up their
sleeves and “doing mathematics” themselves, not watching others do mathematics for them or in front of them. (Protheroe, 2007)
Conceptual-Based Model
The purpose of the Conceptual-Based Model is to allow students the time to explore mathematical concepts to promote academic rigor and high level
of student discourse to concurrently develop conceptual understanding, procedural fluency, and problem-solving skills. During the 90 minute block
of mathematics instruction, teachers will select and set up a mathematical task that targets the mathematical goal(s) for the lesson. The teacher sets
the stage for learning by ensuring the objective/rationale of the lesson is well-defined and connected to the task. The task should build on student’s
prior knowledge, life experiences, and culture allowing students to share their prior knowledge and life/cultural experiences as it relates to the task to
ensure that students understand the context of the problem. The instructional goal is to introduce the activity/task to the students allowing them to
have access to learning while maintaining the cognitive demands of the task. Teachers will then support the students’ exploration of the task; this can
be done independently, in pairs or in small groups or a combination of all. It is highly recommended that students be given the opportunity to
privately work on a task to generate solutions on their own. Students are encouraged to share their findings with their peers in small group to
compare their solutions. As students are actively engaged in constructing meaning of the mathematical concept(s) being taught and communicating
their understanding of the concept(s) with their peers, the teacher monitors the development of student understanding by observing student thinking
and using questions to stimulate thinking to drive students toward the aimed mathematical goal(s). The teacher assesses students’ understanding of
key mathematical ideas, problem-solving strategies, and the use of and connection between models and representations to determine what the student
knows. The teacher advances the students’ understanding to move the student beyond their present thinking and expand what they know to an
additional situation. Teachers have been trained to strategically select groups of students who have different solution paths to the same task, different
representations and errors/misconceptions to share, discuss, and analyze as a whole group. By providing these instructional opportunities, the teacher
will then be able to orchestrate the class discussion by providing students with the opportunities to make their learning public as students share,
discuss, analyze, clarify, extend, connect, strengthen, and record their thinking strategies. After students discuss, justify, and challenge the various
solution paths that were shared, a summary of the learning is articulated and connected to the objective of the lesson. Students should be given an
opportunity to close the lesson with a reflection on their learning.

7 | P a g e
Effective Pedagogical Routines/Instructional Strategies
Collaborative Problem Solving
Connect Previous Knowledge to New Learning
Making Thinking Visible
Develop and Demonstrate Mathematical Practices
Inquiry-Oriented and Exploratory Approach
Multiple Solution Paths and Strategies
Use of Multiple Representations
Explain the Rationale of your Math Work
Quick Writes
Pair/Trio Sharing
Turn and Talk
Charting
Gallery Walks
Small Group and Whole Class Discussions
Student Modeling
Analyze Student Work
Identify Student’s Mathematical Understanding
Identify Student’s Mathematical Misunderstandings
Interviews
Role Playing
Diagrams, Charts, Tables, and Graphs
Anticipate Likely and Possible Student Responses
Collect Different Student Approaches
Multiple Response Strategies
Asking Assessing and Advancing Questions
Revoicing
Marking
Recapping
Challenging
Pressing for Accuracy and Reasoning
Maintain the Cognitive Demand

8 | P a g e
Educational Technology
Standards
8.1.12.A.4, 8.1.12.D.5, 8.1.12.E.1, 8.1.12.F.1
Technology Operations and Concepts
Construct a spreadsheet workbook with multiple worksheets, rename tabs to reflect the data on the worksheet, and use mathematical
or logical functions, charts and data from all worksheets to convey the results.
Example: Students will use appropriate digital tools and software to problem solve, check for accuracy and support answers.
Digital Citizenship
Analyze the capabilities and limitations of current and emerging technology resources and assess their potential to address personal,
social, lifelong learning and career needs.
Example: Students will be able to use critical thinking skills to plan, conduct, research, manage projects, solve problems, and make
informed decisions using appropriate digital tools and resource.
Research and Information Literacy
Produce a position statement about a real world problem by developing a systematic plan of investigation with peers and experts
synthesizing information from multiple sources.
Example: Students will produce a position statement about a real world problem by developing a systematic plan of investigation
with peers and experts synthesizing information from multiple sources.
Design: Critical Thinking, Problem Solving, and Decision Making
Evaluate the strengths and limitations of emerging technologies and their impact on educational, career, personal and or social needs.
Example: A problem-solving approach will allow students to construct their own idea about mathematics and to take responsibility for
their own learning.
9 | P a g e
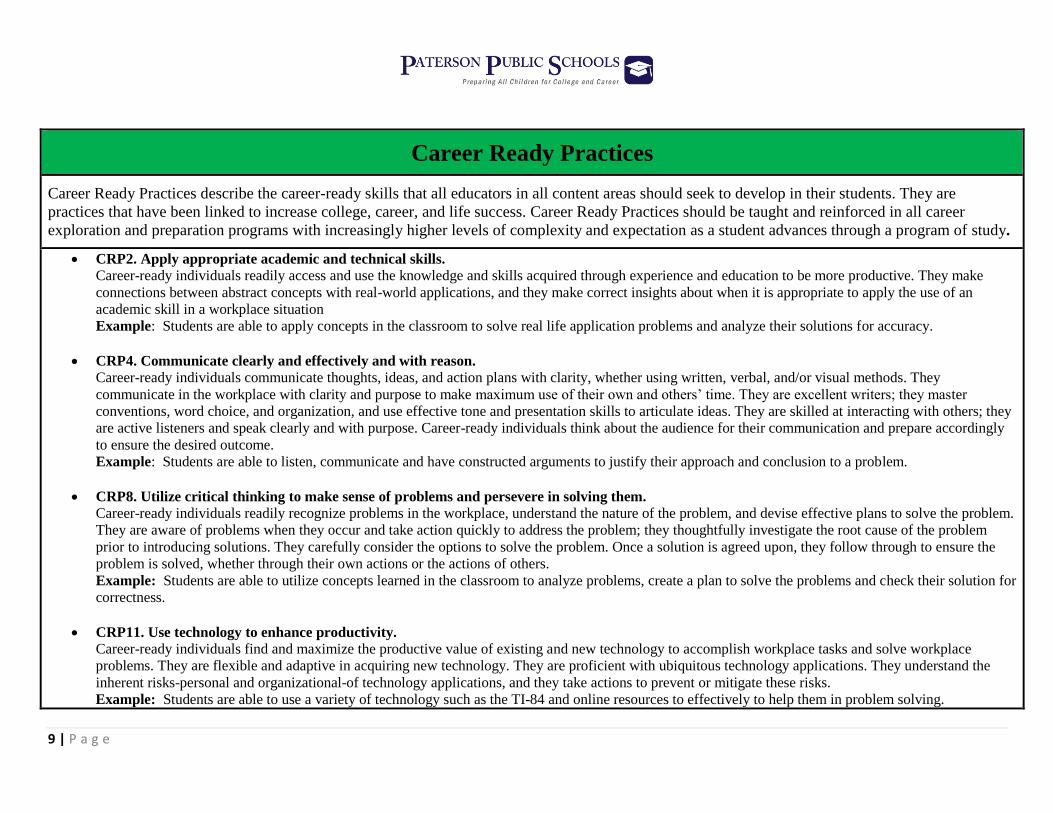
Career Ready Practices
Career Ready Practices describe the career-ready skills that all educators in all content areas should seek to develop in their students. They are
practices that have been linked to increase college, career, and life success. Career Ready Practices should be taught and reinforced in all career
exploration and preparation programs with increasingly higher levels of complexity and expectation as a student advances through a program of study.
CRP2. Apply appropriate academic and technical skills.
Career-ready individuals readily access and use the knowledge and skills acquired through experience and education to be more productive. They make
connections between abstract concepts with real-world applications, and they make correct insights about when it is appropriate to apply the use of an
academic skill in a workplace situation
Example: Students are able to apply concepts in the classroom to solve real life application problems and analyze their solutions for accuracy.
CRP4. Communicate clearly and effectively and with reason.
Career-ready individuals communicate thoughts, ideas, and action plans with clarity, whether using written, verbal, and/or visual methods. They
communicate in the workplace with clarity and purpose to make maximum use of their own and others’ time. They are excellent writers; they master
conventions, word choice, and organization, and use effective tone and presentation skills to articulate ideas. They are skilled at interacting with others; they
are active listeners and speak clearly and with purpose. Career-ready individuals think about the audience for their communication and prepare accordingly
to ensure the desired outcome.
Example: Students are able to listen, communicate and have constructed arguments to justify their approach and conclusion to a problem.
CRP8. Utilize critical thinking to make sense of problems and persevere in solving them.
Career-ready individuals readily recognize problems in the workplace, understand the nature of the problem, and devise effective plans to solve the problem.
They are aware of problems when they occur and take action quickly to address the problem; they thoughtfully investigate the root cause of the problem
prior to introducing solutions. They carefully consider the options to solve the problem. Once a solution is agreed upon, they follow through to ensure the
problem is solved, whether through their own actions or the actions of others.
Example: Students are able to utilize concepts learned in the classroom to analyze problems, create a plan to solve the problems and check their solution for
correctness.
CRP11. Use technology to enhance productivity.
Career-ready individuals find and maximize the productive value of existing and new technology to accomplish workplace tasks and solve workplace
problems. They are flexible and adaptive in acquiring new technology. They are proficient with ubiquitous technology applications. They understand the
inherent risks-personal and organizational-of technology applications, and they take actions to prevent or mitigate these risks.
Example: Students are able to use a variety of technology such as the TI-84 and online resources to effectively to help them in problem solving.

10 | P a g e
WIDA Proficiency Levels
At the given level of English language proficiency, English language learners will process, understand, produce or use
6- Reaching
Specialized or technical language reflective of the content areas at grade level
A variety of sentence lengths of varying linguistic complexity in extended oral or written discourse as
required by the specified grade level
Oral or written communication in English comparable to proficient English peers
5- Bridging
Specialized or technical language of the content areas
A variety of sentence lengths of varying linguistic complexity in extended oral or written discourse,
including stories, essays or reports
Oral or written language approaching comparability to that of proficient English peers when presented with
grade level material.
4- Expanding
Specific and some technical language of the content areas
A variety of sentence lengths of varying linguistic complexity in oral discourse or multiple, related
sentences or paragraphs
Oral or written language with minimal phonological, syntactic or semantic errors that may impede the
communication, but retain much of its meaning, when presented with oral or written connected discourse,
with sensory, graphic or interactive support
3- Developing
General and some specific language of the content areas
Expanded sentences in oral interaction or written paragraphs
Oral or written language with phonological, syntactic or semantic errors that may impede the
communication, but retain much of its meaning, when presented with oral or written, narrative or expository
descriptions with sensory, graphic or interactive support
2- Beginning
General language related to the content area
Phrases or short sentences
Oral or written language with phonological, syntactic, or semantic errors that often impede of the
communication when presented with one to multiple-step commands, directions, or a series of statements
with sensory, graphic or interactive support
1- Entering
Pictorial or graphic representation of the language of the content areas
Words, phrases or chunks of language when presented with one-step commands directions, WH-, choice or
yes/no questions, or statements with sensory, graphic or interactive support
11 | P a g e
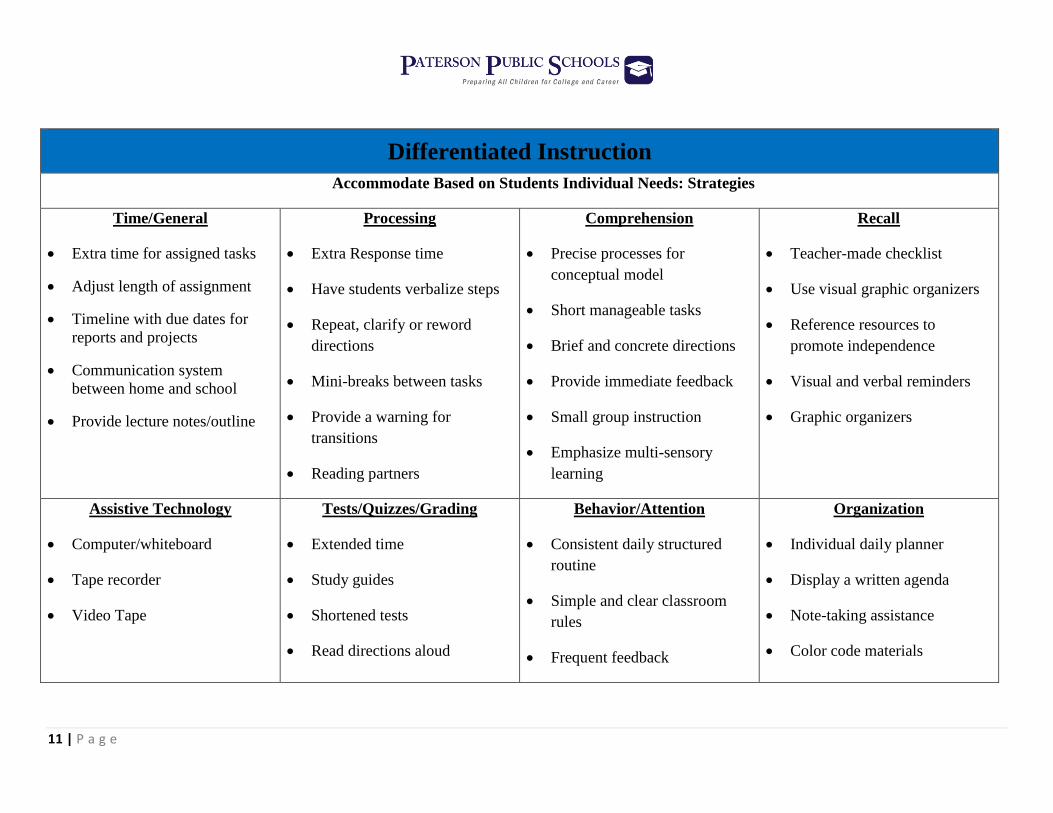
Differentiated Instruction
Accommodate Based on Students Individual Needs: Strategies
Time/General
Extra time for assigned tasks
Adjust length of assignment
Timeline with due dates for
reports and projects
Communication system
between home and school
Provide lecture notes/outline
Processing
Extra Response time
Have students verbalize steps
Repeat, clarify or reword
directions
Mini-breaks between tasks
Provide a warning for
transitions
Reading partners
Comprehension
Precise processes for
conceptual model
Short manageable tasks
Brief and concrete directions
Provide immediate feedback
Small group instruction
Emphasize multi-sensory
learning
Recall
Teacher-made checklist
Use visual graphic organizers
Reference resources to
promote independence
Visual and verbal reminders
Graphic organizers
Assistive Technology
Computer/whiteboard
Tape recorder
Video Tape
Tests/Quizzes/Grading
Extended time
Study guides
Shortened tests
Read directions aloud
Behavior/Attention
Consistent daily structured
routine
Simple and clear classroom
rules
Frequent feedback
Organization
Individual daily planner
Display a written agenda
Note-taking assistance
Color code materials

12 | P a g e
Interdisciplinary Connections
Model interdisciplinary thinking to expose students to other disciplines.
Social Studies Connection: NJSLS 6.1.8.B.1.a, 6.1.8.C.1.b, 6.1.8.D.1.a, 6.1.8.B.2.a
Name of Task:
Logistic Growth Model
https://www.illustrativemathematics.org/content-standards/tasks/804
Improving Archimedes' Method
http://illuminations.nctm.org/Lesson.aspx?id=2500
Science Connection: NJSLS HS-PS2-2, HS-PS2-5, HS-PS4-1
Name of Task:
Sky Math
http://www.eo.ucar.edu/skymath/
Water Tank
http://media.collegeboard.com/digitalServices/pdf/ap/ap16_calculus_bc_q1.pdf
13 | P a g e
Enrichment
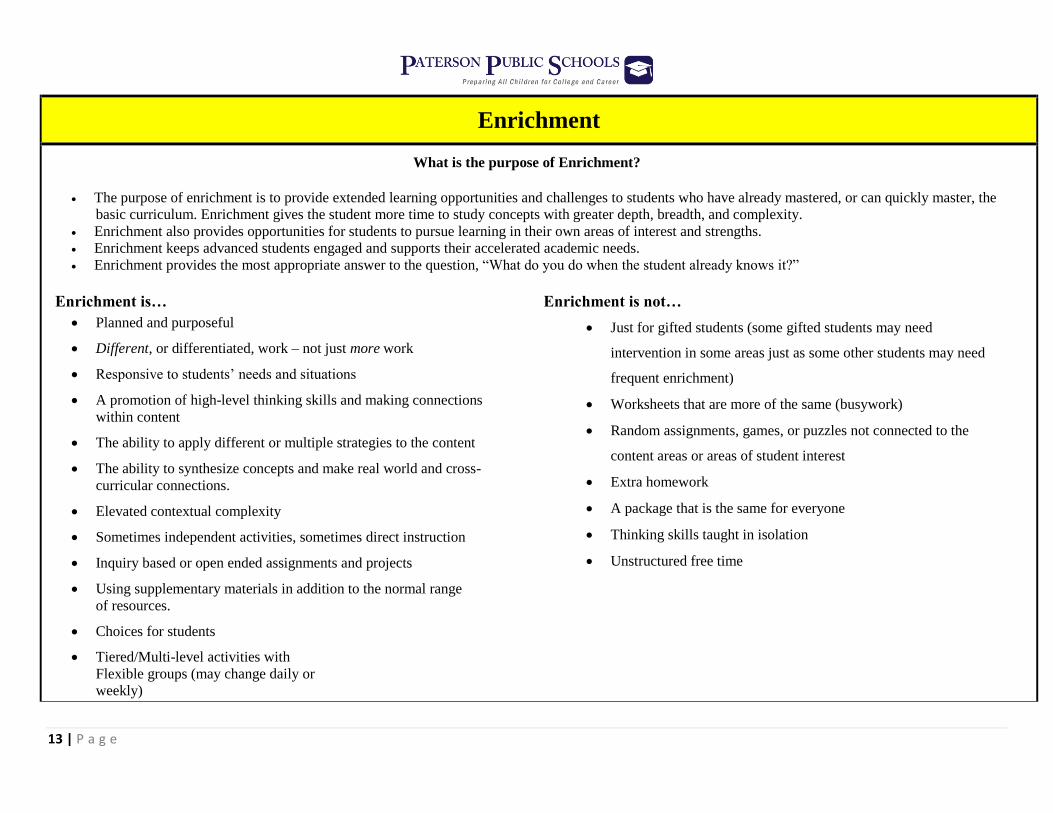
What is the purpose of Enrichment?
The purpose of enrichment is to provide extended learning opportunities and challenges to students who have already mastered, or can quickly master, the
basic curriculum. Enrichment gives the student more time to study concepts with greater depth, breadth, and complexity.
Enrichment also provides opportunities for students to pursue learning in their own areas of interest and strengths.
Enrichment keeps advanced students engaged and supports their accelerated academic needs.
Enrichment provides the most appropriate answer to the question, “What do you do when the student already knows it?”
Enrichment is…
Planned and purposeful
Different, or differentiated, work – not just more work
Responsive to students’ needs and situations
A promotion of high-level thinking skills and making connections
within content
The ability to apply different or multiple strategies to the content
The ability to synthesize concepts and make real world and cross-
curricular connections.
Elevated contextual complexity
Sometimes independent activities, sometimes direct instruction
Inquiry based or open ended assignments and projects
Using supplementary materials in addition to the normal range
of resources.
Choices for students
Tiered/Multi-level activities with
Flexible groups (may change daily or
weekly)
Enrichment is not…
Just for gifted students (some gifted students may need
intervention in some areas just as some other students may need
frequent enrichment)
Worksheets that are more of the same (busywork)
Random assignments, games, or puzzles not connected to the
content areas or areas of student interest
Extra homework
A package that is the same for everyone
Thinking skills taught in isolation
Unstructured free time

14 | P a g e
Assessments
Required District/State Assessments SGO Pre Assessment
SGO Post Assessment
Suggested Formative/Summative Classroom Assessments Describe Learning Vertically
Identify Key Building Blocks
Make Connections (between and among key building blocks)
Short/Extended Constructed Response Items
Multiple-Choice Items (where multiple answer choices may be correct)
Drag and Drop Items
Use of Equation Editor
Quizzes
Journal Entries/Reflections/Quick-Writes
Accountable talk
Projects
Portfolio
Observation
Graphic Organizers/ Concept Mapping
Presentations
Role Playing
Teacher-Student and Student-Student Conferencing
Homework

15 | P a g e
New Jersey Student Learning Standards (NJSLS)
F-IF.A.1: Understand that a function from one set (called the domain) to another set (called the range) assigns to each element of the domain exactly
one element of the range. If f is a function and x is an element of its domain, then f(x) denotes the output of f corresponding to the input x. The graph
of f is the graph of the equation y = f(x).
F-IF.A.3: Recognize that sequences are functions, sometimes defined recursively, whose domain is a subset of the integers. For example, the Fibonacci sequence
is defined recursively by f(0) = f(1) = 1, f(n+1) = f(n) + f(n-1) for n ≥ 1.
F-IF.B.4: For a function that models a relationship between two quantities, interpret key features of graphs and tables in terms of the quantities, and
sketch graphs showing key features given a verbal description of the relationship. ★
F.IF.B.5: Relate the domain of a function to its graph and, where applicable, to the quantitative relationship it describes. For example, if the function
h(n) gives the number of person-hours it takes to assemble n engines in a factory, then the positive integers would be an appropriate domain for the
function.★
F-IF.B.6: Calculate and interpret the average rate of change of a function (presented symbolically or as a table) over a specified interval. Estimate the
rate of change from a graph.★
F-IF.C.7: Graph functions expressed symbolically and show key features of the graph, by hand in simple cases and using technology for more
complicated cases. ★
F-IF.C.7a: Graph linear and quadratic functions and show intercepts, maxima, and minima.
F-IF.C.7b: Graph square root, cube root, and piecewise-defined functions, including step functions and absolute value functions.
F-IF.C.7c: Graph polynomial functions, identifying zeros when suitable factorizations are available, and showing end behavior.
F-IF.C.7d: Graph rational functions, identifying zeros and asymptotes when suitable factorizations are available, and showing end behavior.
F-IF.C.7e: Graph exponential and logarithmic functions, showing intercepts and end behavior, and trigonometric functions, showing period, midline, and
amplitude.
16 | P a g e
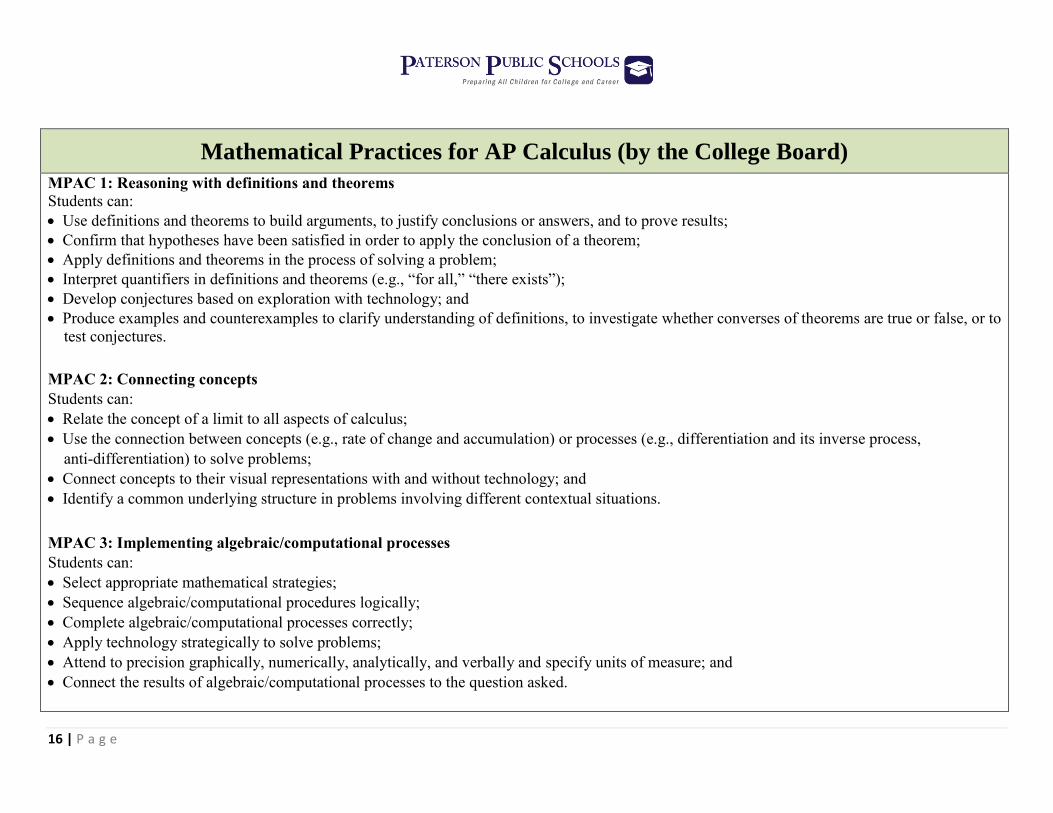
Mathematical Practices for AP Calculus (by the College Board)
MPAC 1: Reasoning with definitions and theorems Students can:
Use definitions and theorems to build arguments, to justify conclusions or answers, and to prove results;
Confirm that hypotheses have been satisfied in order to apply the conclusion of a theorem;
Apply definitions and theorems in the process of solving a problem;
Interpret quantifiers in definitions and theorems (e.g., “for all,” “there exists”);
Develop conjectures based on exploration with technology; and
Produce examples and counterexamples to clarify understanding of definitions, to investigate whether converses of theorems are true or false, or to
test conjectures.
MPAC 2: Connecting concepts
Students can:
Relate the concept of a limit to all aspects of calculus;
Use the connection between concepts (e.g., rate of change and accumulation) or processes (e.g., differentiation and its inverse process,
anti-differentiation) to solve problems;
Connect concepts to their visual representations with and without technology; and
Identify a common underlying structure in problems involving different contextual situations.
MPAC 3: Implementing algebraic/computational processes
Students can:
Select appropriate mathematical strategies;
Sequence algebraic/computational procedures logically;
Complete algebraic/computational processes correctly;
Apply technology strategically to solve problems;
Attend to precision graphically, numerically, analytically, and verbally and specify units of measure; and
Connect the results of algebraic/computational processes to the question asked.
17 | P a g e
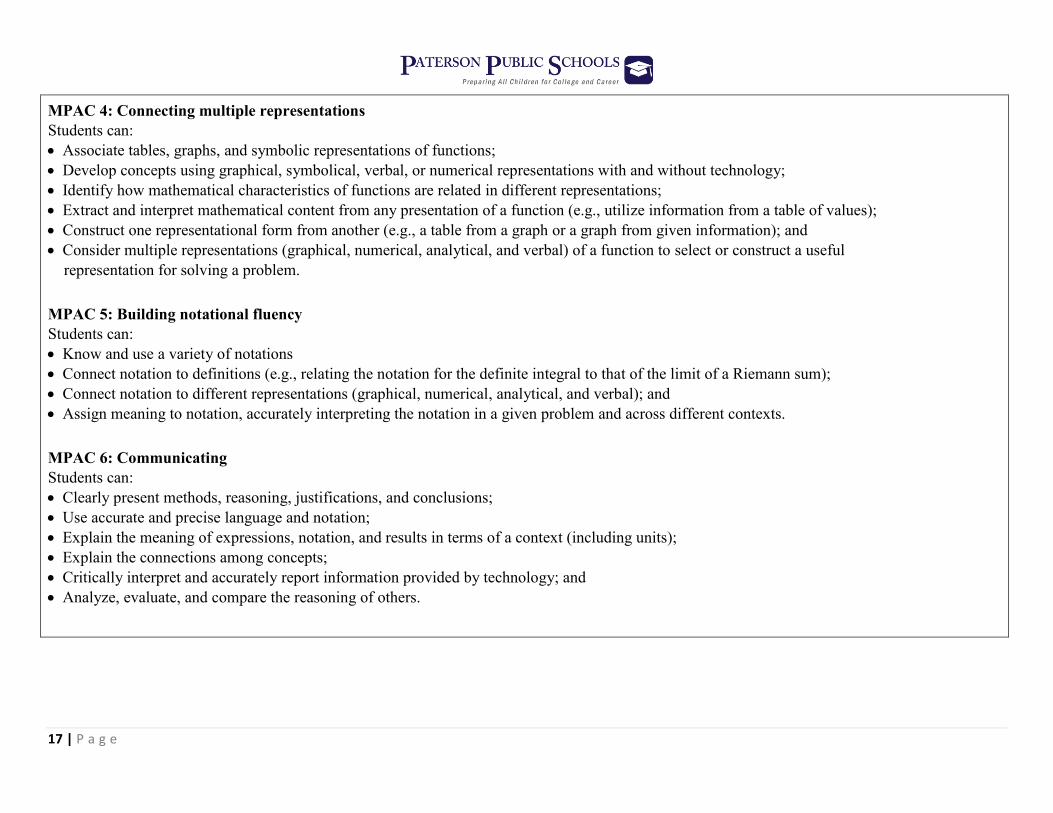
MPAC 4: Connecting multiple representations
Students can:
Associate tables, graphs, and symbolic representations of functions;
Develop concepts using graphical, symbolical, verbal, or numerical representations with and without technology;
Identify how mathematical characteristics of functions are related in different representations;
Extract and interpret mathematical content from any presentation of a function (e.g., utilize information from a table of values);
Construct one representational form from another (e.g., a table from a graph or a graph from given information); and
Consider multiple representations (graphical, numerical, analytical, and verbal) of a function to select or construct a useful
representation for solving a problem.
MPAC 5: Building notational fluency
Students can:
Know and use a variety of notations
Connect notation to definitions (e.g., relating the notation for the definite integral to that of the limit of a Riemann sum);
Connect notation to different representations (graphical, numerical, analytical, and verbal); and
Assign meaning to notation, accurately interpreting the notation in a given problem and across different contexts.
MPAC 6: Communicating
Students can:
Clearly present methods, reasoning, justifications, and conclusions;
Use accurate and precise language and notation;
Explain the meaning of expressions, notation, and results in terms of a context (including units);
Explain the connections among concepts;
Critically interpret and accurately report information provided by technology; and
Analyze, evaluate, and compare the reasoning of others.
18 | P a g e
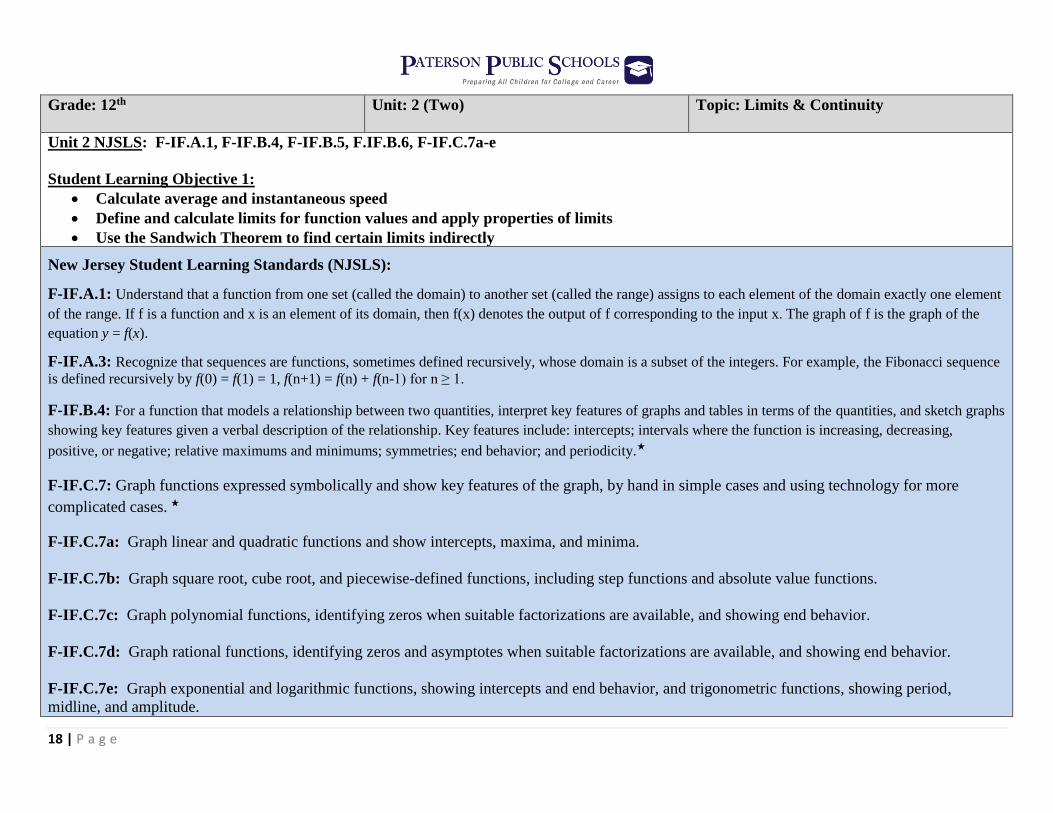
Grade: 12th
Unit: 2 (Two) Topic: Limits & Continuity
Unit 2 NJSLS: F-IF.A.1, F-IF.B.4, F-IF.B.5, F.IF.B.6, F-IF.C.7a-e
Student Learning Objective 1:
Calculate average and instantaneous speed
Define and calculate limits for function values and apply properties of limits
Use the Sandwich Theorem to find certain limits indirectly
New Jersey Student Learning Standards (NJSLS):
F-IF.A.1: Understand that a function from one set (called the domain) to another set (called the range) assigns to each element of the domain exactly one element
of the range. If f is a function and x is an element of its domain, then f(x) denotes the output of f corresponding to the input x. The graph of f is the graph of the
equation y = f(x).
F-IF.A.3: Recognize that sequences are functions, sometimes defined recursively, whose domain is a subset of the integers. For example, the Fibonacci sequence
is defined recursively by f(0) = f(1) = 1, f(n+1) = f(n) + f(n-1) for n ≥ 1.
F-IF.B.4: For a function that models a relationship between two quantities, interpret key features of graphs and tables in terms of the quantities, and sketch graphs
showing key features given a verbal description of the relationship. Key features include: intercepts; intervals where the function is increasing, decreasing,
positive, or negative; relative maximums and minimums; symmetries; end behavior; and periodicity.★
F-IF.C.7: Graph functions expressed symbolically and show key features of the graph, by hand in simple cases and using technology for more
complicated cases. ★
F-IF.C.7a: Graph linear and quadratic functions and show intercepts, maxima, and minima.
F-IF.C.7b: Graph square root, cube root, and piecewise-defined functions, including step functions and absolute value functions.
F-IF.C.7c: Graph polynomial functions, identifying zeros when suitable factorizations are available, and showing end behavior.
F-IF.C.7d: Graph rational functions, identifying zeros and asymptotes when suitable factorizations are available, and showing end behavior.
F-IF.C.7e: Graph exponential and logarithmic functions, showing intercepts and end behavior, and trigonometric functions, showing period,
midline, and amplitude.
19 | P a g e
MPs Skills, Strategies & Concepts Essential Understandings/
Questions
Tasks/Activities
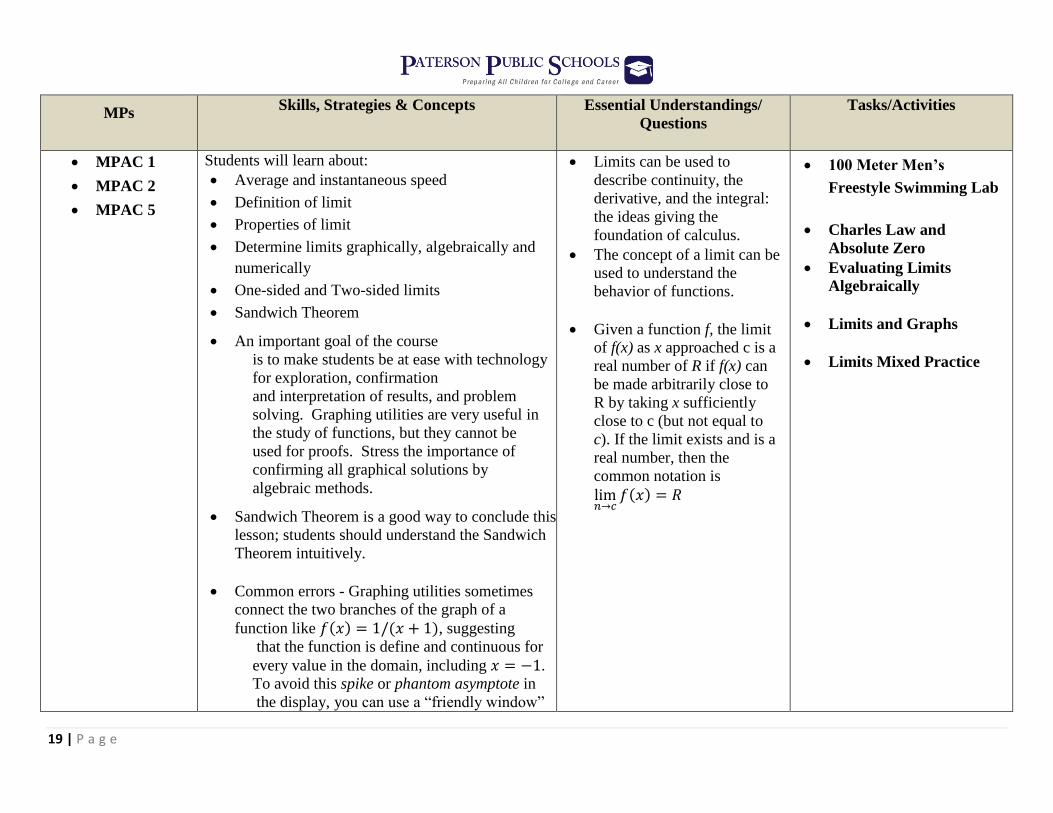
MPAC 1
MPAC 2
MPAC 5
Students will learn about:
Average and instantaneous speed
Definition of limit
Properties of limit
Determine limits graphically, algebraically and
numerically
One-sided and Two-sided limits
Sandwich Theorem
An important goal of the course
is to make students be at ease with technology
for exploration, confirmation
and interpretation of results, and problem
solving. Graphing utilities are very useful in
the study of functions, but they cannot be
used for proofs. Stress the importance of
confirming all graphical solutions by
algebraic methods.
Sandwich Theorem is a good way to conclude this
lesson; students should understand the Sandwich
Theorem intuitively.
Common errors - Graphing utilities sometimes
connect the two branches of the graph of a
function like 𝑓(𝑥) = 1/(𝑥 + 1), suggesting
that the function is define and continuous for
every value in the domain, including 𝑥 = −1.
To avoid this spike or phantom asymptote in
the display, you can use a “friendly window”
Limits can be used to
describe continuity, the
derivative, and the integral:
the ideas giving the
foundation of calculus.
The concept of a limit can be
used to understand the
behavior of functions.
Given a function f, the limit
of f(x) as x approached c is a
real number of R if f(x) can
be made arbitrarily close to
R by taking x sufficiently
close to c (but not equal to
c). If the limit exists and is a
real number, then the
common notation is
lim𝑛→𝑐
𝑓(𝑥) = 𝑅
100 Meter Men’s
Freestyle Swimming Lab
Charles Law and
Absolute Zero
Evaluating Limits
Algebraically
Limits and Graphs
Limits Mixed Practice
20 | P a g e
or “decimal window” (that is, a window in
which the pixels correspond to exactly 1, 0.1,
0.2,…, or us the dot mode format for display of
graphs of such functions.
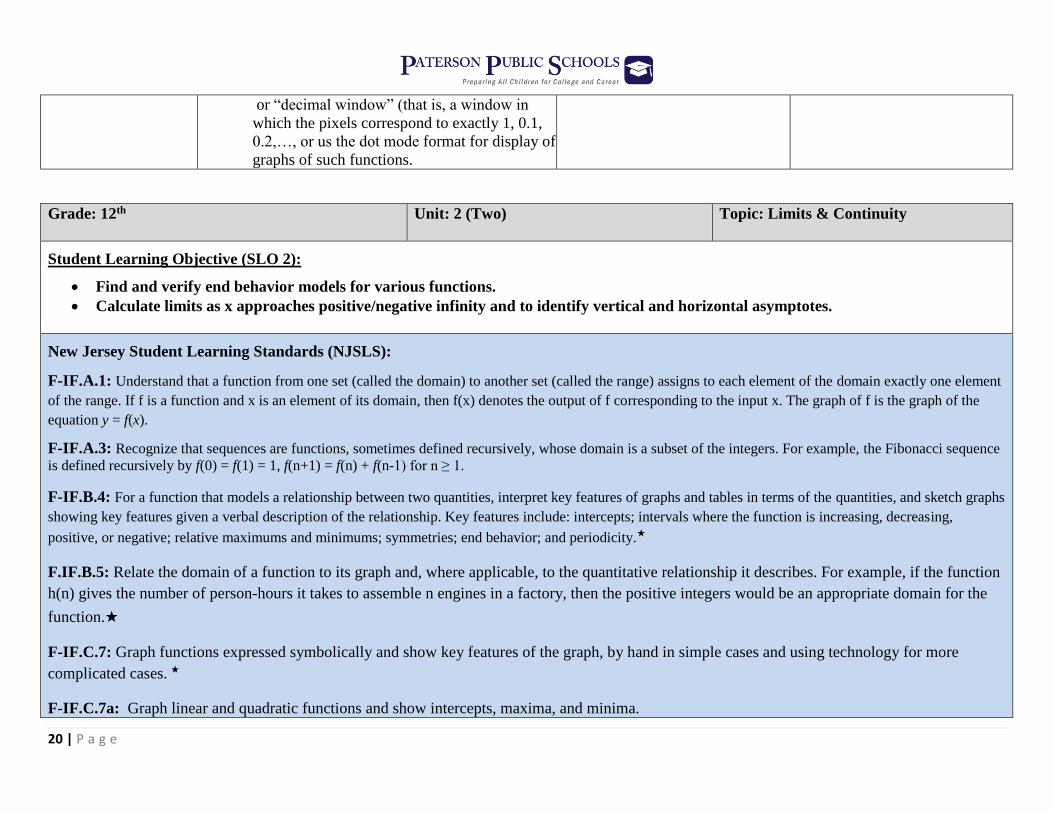
Grade: 12th
Unit: 2 (Two) Topic: Limits & Continuity
Student Learning Objective (SLO 2):
Find and verify end behavior models for various functions.
Calculate limits as x approaches positive/negative infinity and to identify vertical and horizontal asymptotes.
New Jersey Student Learning Standards (NJSLS):
F-IF.A.1: Understand that a function from one set (called the domain) to another set (called the range) assigns to each element of the domain exactly one element
of the range. If f is a function and x is an element of its domain, then f(x) denotes the output of f corresponding to the input x. The graph of f is the graph of the
equation y = f(x).
F-IF.A.3: Recognize that sequences are functions, sometimes defined recursively, whose domain is a subset of the integers. For example, the Fibonacci sequence
is defined recursively by f(0) = f(1) = 1, f(n+1) = f(n) + f(n-1) for n ≥ 1.
F-IF.B.4: For a function that models a relationship between two quantities, interpret key features of graphs and tables in terms of the quantities, and sketch graphs
showing key features given a verbal description of the relationship. Key features include: intercepts; intervals where the function is increasing, decreasing,
positive, or negative; relative maximums and minimums; symmetries; end behavior; and periodicity.★
F.IF.B.5: Relate the domain of a function to its graph and, where applicable, to the quantitative relationship it describes. For example, if the function
h(n) gives the number of person-hours it takes to assemble n engines in a factory, then the positive integers would be an appropriate domain for the
function.★
F-IF.C.7: Graph functions expressed symbolically and show key features of the graph, by hand in simple cases and using technology for more
complicated cases. ★
F-IF.C.7a: Graph linear and quadratic functions and show intercepts, maxima, and minima.

21 | P a g e
F-IF.C.7b: Graph square root, cube root, and piecewise-defined functions, including step functions and absolute value functions.
F-IF.C.7c: Graph polynomial functions, identifying zeros when suitable factorizations are available, and showing end behavior.
F-IF.C.7d: Graph rational functions, identifying zeros and asymptotes when suitable factorizations are available, and showing end behavior.
F-IF.C.7e: Graph exponential and logarithmic functions, showing intercepts and end behavior, and trigonometric functions, showing period,
midline, and amplitude.
MPs Skills, Strategies & Concepts Essential Understandings/
Questions
Tasks/Activities
MPAC 1
MPAC 2
MPAC 4
MPAC 5
Students will learn about:
Finding and verifying end behavior models for
various functions
Calculating limits as 𝑥 → ±∞ and identify vertical
and horizontal asymptotes
Discuss asymptotes/unbounded behavior in terms
of graphical behavior as well as in terms of limits.
Compare unbounded growth and rates of change
Discuss the end behavior of three types of rational
functions, that is, rational functions where the
degree of the numerator is less than, equal to, and
greater than the degree of the denominator,
respectively.
Common errors- Many students will have trouble
with limits involving the indeterminate forms of
Limits can be used to describe
the behavior of functions for
numbers large in absolute
value.
A limit might not exist for
some functions at particular
values of x. Some ways that a
limit might not exist are if the
function is unbounded, if the
function is oscillating near this
value, or if the limit from the
left does not equal to the limit
from the right.
The mathematical meaning of
the symbol ∞ should be
understood in the context of
the phrase "𝑥 → ∞", meaning
that in a function of 𝑥, the x-
value increases without bound.
Infinite Limits
Limits Involving Infinity
Limits with infinity
Unbounded limits-
graphical

22 | P a g e
0
0,
∞
∞, 𝑎𝑛𝑑 0 × ∞
L’Hopital’s Rule can be introduce as a rigorous
approach- NOTE THIS CONCEPT WAS
RECENTLY ADDED TO 2018 AP
CALCULUS EXAM
Asymptotic and unbounded
behavior of functions can be
explained and described using
limits.
Grade: 12th
Unit: 2 (Two) Topic: Limits & Continuity
Student Learning Objective (SLO 3):
Find and verify end behavior models for various functions.
Calculate limits as x approaches positive/negative infinity and to identify vertical and horizontal asymptotes.
Remove removable discontinuities by extending or modifying a function.
Apply the Intermediate Value Theorem and properties of algebraic combinations and composite of continuous functions.
New Jersey Student Learning Standards (NJSLS):
F-IF.A.1: Understand that a function from one set (called the domain) to another set (called the range) assigns to each element of the domain exactly one element
of the range. If f is a function and x is an element of its domain, then f(x) denotes the output of f corresponding to the input x. The graph of f is the graph of the
equation y = f(x).
F-IF.A.3: Recognize that sequences are functions, sometimes defined recursively, whose domain is a subset of the integers. For example, the Fibonacci sequence
is defined recursively by f(0) = f(1) = 1, f(n+1) = f(n) + f(n-1) for n ≥ 1.
F-IF.B.4: For a function that models a relationship between two quantities, interpret key features of graphs and tables in terms of the quantities, and sketch graphs
showing key features given a verbal description of the relationship. Key features include: intercepts; intervals where the function is increasing, decreasing,
positive, or negative; relative maximums and minimums; symmetries; end behavior; and periodicity.★
F.IF.B.5: Relate the domain of a function to its graph and, where applicable, to the quantitative relationship it describes. For example, if the function
h(n) gives the number of person-hours it takes to assemble n engines in a factory, then the positive integers would be an appropriate domain for the

23 | P a g e
function.★
F-IF.C.7: Graph functions expressed symbolically and show key features of the graph, by hand in simple cases and using technology for more
complicated cases. ★
F-IF.C.7a: Graph linear and quadratic functions and show intercepts, maxima, and minima.
F-IF.C.7b: Graph square root, cube root, and piecewise-defined functions, including step functions and absolute value functions.
F-IF.C.7c: Graph polynomial functions, identifying zeros when suitable factorizations are available, and showing end behavior.
F-IF.C.7d: Graph rational functions, identifying zeros and asymptotes when suitable factorizations are available, and showing end behavior.
F-IF.C.7e: Graph exponential and logarithmic functions, showing intercepts and end behavior, and trigonometric functions, showing period,
midline, and amplitude
MPs Skills, Strategies & Concepts Essential Understandings/
Questions
Tasks/Activities
MPAC 1
MPAC 2
MPAC 3
MPAC 4
MPAC 5
Students will learn about:
Identifying the intervals upon which a given
function is continuous and understanding the
meaning of continuous functions.
Removable discontinuity by extending or
modifying a function.
The Intermediate Value Theorem and the
properties of algebraic combinations and
composites of continuous functions.
Common errors – students often have
difficulty recognizing the difference between
Continuous functions are use to
describe how a body moves
thorough space and how the
speed of chemical reactions
changes with time.
Students must understand the
definition of continuity if they
are to be successful in this
course. They should be able to
distinguish between continuity
at an interior point in the
domain (which involves two-
sided limits) and continuity at
an endpoint (which involves
Continuity Parts 1-3
Big Theorems
Continuity, Min, Max
Intermediate Value
Theorem
Joys of IMVT
Moving a particle and its
position x-axis
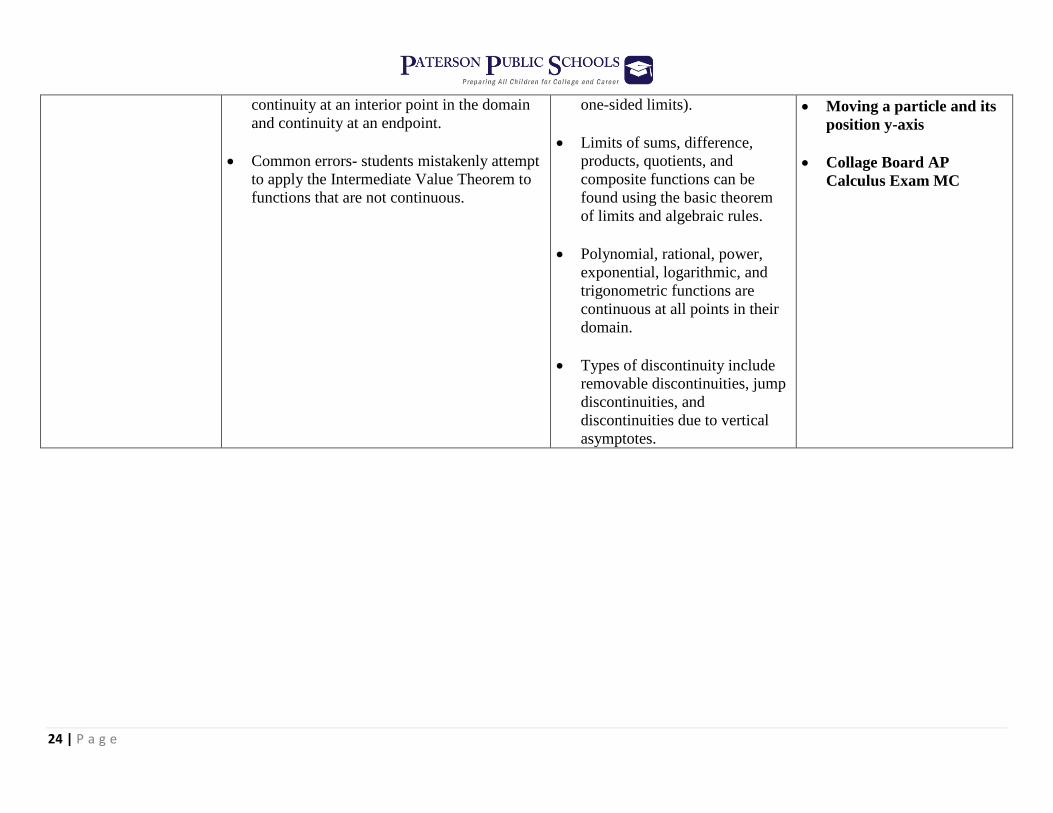
24 | P a g e
continuity at an interior point in the domain
and continuity at an endpoint.
Common errors- students mistakenly attempt
to apply the Intermediate Value Theorem to
functions that are not continuous.
one-sided limits).
Limits of sums, difference,
products, quotients, and
composite functions can be
found using the basic theorem
of limits and algebraic rules.
Polynomial, rational, power,
exponential, logarithmic, and
trigonometric functions are
continuous at all points in their
domain.
Types of discontinuity include
removable discontinuities, jump
discontinuities, and
discontinuities due to vertical
asymptotes.
Moving a particle and its
position y-axis
Collage Board AP
Calculus Exam MC

25 | P a g e
Grade: 12th
Unit: 2 (Two) Topic: Limits & Continuity
Student Learning Objective (SLO 4):
Apply directly the definition of the slope of a curve in order to calculate slopes.
Find the equations of the tangent line and normal line to a curve at a given point.
Find the average rate of change of a function.
New Jersey Student Learning Standards (NJSLS):
F-IF.A.1: Understand that a function from one set (called the domain) to another set (called the range) assigns to each element of the domain exactly one element
of the range. If f is a function and x is an element of its domain, then f(x) denotes the output of f corresponding to the input x. The graph of f is the graph of the
equation y = f(x).
F-IF.A.3: Recognize that sequences are functions, sometimes defined recursively, whose domain is a subset of the integers. For example, the Fibonacci sequence
is defined recursively by f(0) = f(1) = 1, f(n+1) = f(n) + f(n-1) for n ≥ 1.
F-IF.B.4: For a function that models a relationship between two quantities, interpret key features of graphs and tables in terms of the quantities, and sketch graphs
showing key features given a verbal description of the relationship. Key features include: intercepts; intervals where the function is increasing, decreasing,
positive, or negative; relative maximums and minimums; symmetries; end behavior; and periodicity.★
F.IF.B.5: Relate the domain of a function to its graph and, where applicable, to the quantitative relationship it describes. For example, if the function
h(n) gives the number of person-hours it takes to assemble n engines in a factory, then the positive integers would be an appropriate domain for the
function.★
F-IF.B.6: Calculate and interpret the average rate of change of a function (presented symbolically or as a table) over a specified interval. Estimate the
rate of change from a graph.★
F-IF.C.7: Graph functions expressed symbolically and show key features of the graph, by hand in simple cases and using technology for more
complicated cases. ★
F-IF.C.7a: Graph linear and quadratic functions and show intercepts, maxima, and minima.
F-IF.C.7b: Graph square root, cube root, and piecewise-defined functions, including step functions and absolute value functions.

26 | P a g e
F-IF.C.7c: Graph polynomial functions, identifying zeros when suitable factorizations are available, and showing end behavior.
F-IF.C.7d: Graph rational functions, identifying zeros and asymptotes when suitable factorizations are available, and showing end behavior.
F-IF.C.7e: Graph exponential and logarithmic functions, showing intercepts and end behavior, and trigonometric functions, showing period,
midline, and amplitude
MPs Skills, Strategies & Concepts Essential Understandings/
Questions
Tasks/Activities
MPAC 1
MPAC 2
MPAC 3
MPAC 4
MPAC 5
Students will learn about:
To directly apply the definition of the slope of
a curve in order to calculate the slopes
Finding the equations of the tangent lines and
normal line to a curve at a given point
Finding the average rate of change of a
function
Estimating instantaneous rates of change from
graphs
Graphing a curve along with its normal and
tangent lines at a point. Stress that the graph
in a square viewing window can be used to
visually confirm that the calculations were
carried out correctly
Common errors- Many students are prone to
algebraic error while calculating the slopes of
curves. Encourage students to understand their
own mistakes so that they will be less likely to
make these mistakes in the future.
The average rate of change
introduced in this lesson
provides an application related
to limits or rational functions.
They are related to limits or
rational functions. They are
also related to derivatives,
although we do not use the
word derivative in this lesson.
A line through two points on a
curve is a secant to the curve.
The average rate of change of a
quantity over a period of time is
the amount of change divided
by the time it takes.
The tangent line determines the
direction of a body’s motion at
every point along its path.
Rates of Change and
tangent Lines 1 -3
Slope of a Curve at a
Point
Slope, Tangent, and
Normal Lines
Slopes and Graphs of
Tangent Lines
Tangent and Normal
Lines
Tangent Line AP
Calculus 2008
Tangent Line AP
Calculus 2012
27 | P a g e
Vocabulary
Area below the curve
Area between the curve
Area under the curve
Asymptote
Average rate of change
Axis of rotation
Bounds of integration
Chain rule
Concave up
Concave down
Continuous function
Continuous differentiable function
Critical number
Critical point
Critical value
Curve sketching
Cylindrical Shell Method
Decreasing function
Definite Integral
Definite integral rules
Derivative
Derivative of a Power Series
Derivative Rules
Discontinuity
Disk method
Divergent Sequence and Series
Explicit Differentiation
Extreme Value Theorem
Factorial
First Derivative Test
Fundamental Theorem of Calculus
Higher Derivative
Implicit Differentiation
Infinite Limit
Inflection Point
Instantaneous Velocity
Integral
Integration by parts
Integration by substitution
Intermediate Value Theorem
L’Hopital’s Rule
Limit
Right Limit/ Left Limit
Local maximum/ Local minimum
Mean Value Theorem
One-sided limit
Product Rule
Projectile Motion
Quotient Rule
Relative maximum/ Relative minimum
Riemann Sum
Rolle’s Theorem
Sandwich Theorem
U-Substitution
Volume by parallel cross section

28 | P a g e
References & Suggested Instructional Websites
https://www.ixl.com/standards/new-jersey/math/high-school
http://www.mathwords.com/index_calculus.htm
http://apcentral.collegeboard.com/apc/public/courses/index.html
http://schoolcenter.hilton.k12.ny.us/education/components/docmgr/default.php?sectiondetailid=16535&catfilter=6
541#showDoc
http://www.hershey.k12.pa.us/Page/3607
https://sites.google.com/a/evergreenps.org/ms-griffin-s-math-classes/calculus-notes-worksheets-and-classroom-
policies
https://sites.google.com/site/dgrahamcalculus/ap-calculus-ab/calculus-worksheets
http://home.cvc.org/math/apcalc/apcalc.htm
http://www.mathwithmrwood.com/ap-calculus
http://apcentral.collegeboard.com/apc/members/exam/exam_information/232050.html
http://www.analyzemath.com/ap_calculus.html
https://secure-media.collegeboard.org/digitalServices/pdf/ap/ap-calculus-ab-practice-exam-2012.pdf
https://online.math.uh.edu/apcalculus/exams/
https://www.khanacademy.org/math/ap-calculus-ab
29 | P a g e
Field Trips
SIX FLAGS GREAT ADVENTURE: This educational event includes workbooks and special science and math related shows throughout the day.
Your students will leave with a better understanding of real world applications of the material they have learned in the classroom. Each student will
have the opportunity to experience different rides and attractions linking mathematical and scientific concepts to what they are experiencing.
www.sixflags.com
MUSEUM of MATHEMATICS: Mathematics illuminates the patterns that abound in our world. The National Museum of Mathematics strives to
enhance public understanding and perception of mathematics. Its dynamic exhibits and programs stimulate inquiry, spark curiosity, and reveal the
wonders of mathematics. The Museum’s activities lead a broad and diverse audience to understand the evolving, creative, human, and aesthetic
nature of mathematics.
www.momath.org
LIBERTY SCIENCE CENTER: An interactive science museum and learning center located in Liberty State Park. The center, which first opened
in 1993 as New Jersey's first major state science museum, has science exhibits, the largest IMAX Dome Theater in the United States, numerous
educational resources, and the original Hoberman sphere.
http://lsc.org/plan-your-visit/
30 | P a g e
Marking Period 2 – Suggested Project * Projects begin at the start of the marking period and finishes at the end.
AP Calculus Project: Investigating the Nurse-to-Doctor Ratio in the U.S
Health organizations need to forecast the ratio of nurses to doctors in the future to determine whether it is sufficient to maintain minimum essential
public health and clinical services. In 1993, the World Bank’s World Development Report advocated that the ratio of nurses to doctors should
exceed 2-to-1 as a minimum standard. A ratio of 4-to-1 or higher is considered more satisfactory for quality and cost effective care. You might
expect the nurse-to-doctor ratio to increase with the large and growing nurse population, but a graph of the ratio quickly dispels this notion.
Even though the number of nurses is growing, the number of nurses per doctor is decreasing because the growth in nurses is not keeping up with
the growth in doctors. Note that the ratio is between 3-to-1 and 3.3-to-1, so that the ratio is above the minimum level advocated by the World Bank.
However, the ratio is below the 4-to-1 level that is associated with quality and cost effective care. It appears that the ratio will continue to decrease
and perhaps level off.
Model the nurse-to-doctor ratio in the state you have been assigned to determine if your state will ever reach the ideal ratio of 4-to-1 recommended
by the World Bank, or ever fall below the World Bank minimum ratio of 2-to-1. If either of these occur, I would like to know the year in which it
is estimated to occur. I would also like to know the ratio you predict the number of nurses per doctor will level off at if current trends continue over
a long period of time. If you model the ratio of nurses to doctors as a ratio of two linear regression models, you should be able to accomplish these
goals.
* See MP 2 Project Folder for full project and rubric.
31 | P a g e
AP Calculus Test Preparation Strategies
The exam is 3 hours and 15 minutes long and has two sections — multiple choice and free-response. A graphing calculator is required for
parts of the exam (see below). You may not take both the Calculus AB and Calculus BC exams within the same year.
Section I: Multiple Choice | 45 Questions | 1 hour and 45 minutes | 50% of Final Exam Score
Part A — 30 questions | 60 minutes (calculator not permitted)
Part B — 15 questions | 45 minutes (graphing calculator required)
Section II: Free-Response | 6 Questions | 1 hour and 30 minutes | 50% of Final Exam Score
Part A — 2 problems | 30 minutes (graphing calculator required)
Part B — 4 problems | 60 minutes (calculator not permitted)
Completing Section II: Free-Response Questions During the second timed portion of the free-response section (Part B), you are permitted to continue work on problems in Part A, but you are
not permitted to use a calculator during this time. For more information, see this course’s calculator policy and the list of approved graphing
calculators.
As you begin each part of Section II, you may wish to look over the questions before starting to work on them. It is not expected that
everyone will be able to complete all parts of all questions.
Show all of your work, even though a question may not explicitly remind you to do so. Clearly label any functions, graphs, tables, or other
objects that you use. Justifications require that you give mathematical reasons, and that you verify the needed conditions under which relevant
theorems, properties, definitions, or tests are applied. Your work will be scored on the correctness and completeness of your methods as well
as your answers. Answers without supporting work will usually not receive credit.
Your work must be expressed in standard mathematical notation rather than calculator syntax. For example, may not be written as
fnInt(X2, X, 1, 5).
Unless otherwise specified, answers (numeric or algebraic) need not be simplified. If you use decimal approximations in calculations, your
work will be scored on accuracy. Unless otherwise specified, your final answers should be accurate to three places after the decimal point.
Unless otherwise specified, the domain of a function f is assumed to be the set of all real numbers x for which f(x) is a real number.

32 | P a g e
AP Calculus Test Preparation Strategies
Keep an eye on your time. Monitor your time carefully. Make sure not to spend too much time on any one question so you’ll have enough time to answer all of them. If you do work that you think is
incorrect, simply put an “X” through it instead of spending time erasing it completely: crossed-out work won’t be graded.
Show your work, even when you’re using a calculator. Show all the steps you took to reach your solution on questions involving calculations. The exam reader wants to see if you know how to solve the problem. If you use your
calculator to solve an equation, compute a numerical derivative, or find a definite integral, then be sure to write the equation, derivative, or integral first: an answer without this
information might not get full credit, even if the answer is correct. Remember to write your work in standard notation (e.g. ) rather than calculator syntax
(e.g. fnInt(X2,X,1,5), as calculator syntax is not acceptable.
Try to solve each part of the question. Many free-response questions are divided into parts such as (a), (b), (c), and (d), with each part calling for a different response. Credit for each part is awarded independently, so
you should attempt to solve each part. For example, you may receive no credit for your answer to part (a), but still receive full credit for part (b), (c), or (d). If the answer to a later
part of a question depends on the answer to an earlier part, you may still be able to receive full credit for the later part, even if that earlier answer is wrong.
Be sure to fully answer the question being asked. For example, if a question asks for the maximum value of a function, do not stop after finding the x-value at which the maximum value occurs. Be sure to express your answer in
correct units if units are given and always provide a justification when it is asked for.
When asked to justify or to explain an answer, think about how that can be done. For example, if you are asked to justify a point of inflection, you need to show that the sign of the second derivative changes. Simply saying that the second derivative equals zero
or is undefined is not a justification.
Do not round partial answers. Store partial answers in your calculator so that you can use them unrounded in further calculations.
Practice! Answering free-response questions from previous AP Exams is a great way to practice: it allows you to compare your own responses with those that have already been evaluated
and scored. Free-response questions and scoring guidelines are available on the Exam Practice page for AP Calculus AB.