max india limited · pdf file• max india limited ... inr 142 billion+ revenues 9.2 mn...
TRANSCRIPT

Max India Limited
Investor Presentation
November 2016
www.maxindia.com

Max Group Vision “To be the most admired corporate for service excellence”
Sevabhav
Excellence
Credibility
• Positive social impact
• Helpfulness
• Culture of Service
• Mindfulness
• Expertise
• Dependability
• Entrepreneurship
• Business performance
• Transparency
• Integrity
• Respect
• Governance
1

Evolution of Max Group—Strong history of entrepreneurship and nurturing successful businesses (1/2)
2
1985 1993 1995 2000 2005 2007 2008 2009…
Entry into bulk
pharma business;
commenced
operations with
production of
penicillin based drug
intermediary
Enters telecom in JV
with Hutchison
JV with Gist Brocades
and becomes Asia’s
largest manufacturer of
drug intermediaries
JV with Comsat to launch
satellite communication
services
JV with Atotech BV for
manufacturing printed
circuit board plating
Paradigm shift from
B2B to B2C model –
enters healthcare, life
insurance and
clinical research
Warburg Pincus
invests Rs. 200 Crore
and Rs. 140 Crore in
Max India and Max
Healthcare
Raises Rs. 1,000
Crore through QIP
placement to fund
continued
expansion; Raises
Rs 300 Cr from IFC
for MHC expansion
JV with BUPA
Finance Plc, UK to
enter health
insurance business
Enters next phase of
growth in healthcare
- 4 new facilities
planned in the NCR
and nearby regions
over the course of
next few years
Hutchison
COMSAT
ATOTECH
3
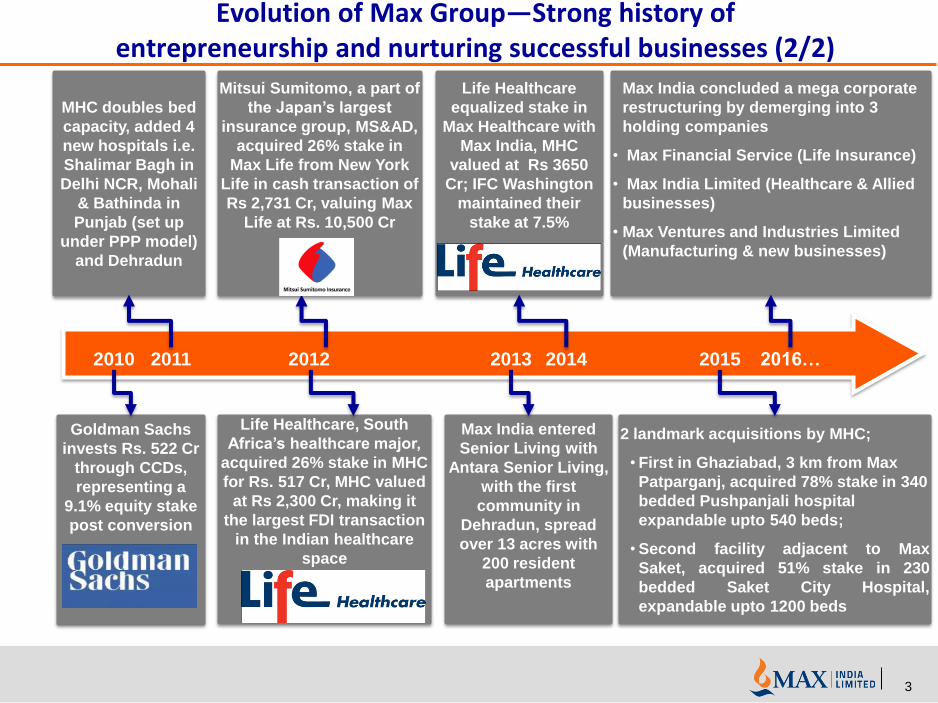
2010 2011 2012 2013 2014 2015 2016…
Goldman Sachs
invests Rs. 522 Cr
through CCDs,
representing a
9.1% equity stake
post conversion
MHC doubles bed
capacity, added 4
new hospitals i.e.
Shalimar Bagh in
Delhi NCR, Mohali
& Bathinda in
Punjab (set up
under PPP model)
and Dehradun
Life Healthcare, South
Africa’s healthcare major,
acquired 26% stake in MHC
for Rs. 517 Cr, MHC valued
at Rs 2,300 Cr, making it
the largest FDI transaction
in the Indian healthcare
space
Mitsui Sumitomo, a part of
the Japan’s largest
insurance group, MS&AD,
acquired 26% stake in
Max Life from New York
Life in cash transaction of
Rs 2,731 Cr, valuing Max
Life at Rs. 10,500 Cr
Max India entered
Senior Living with
Antara Senior Living,
with the first
community in
Dehradun, spread
over 13 acres with
200 resident
apartments
Life Healthcare
equalized stake in
Max Healthcare with
Max India, MHC
valued at Rs 3650
Cr; IFC Washington
maintained their
stake at 7.5%
2 landmark acquisitions by MHC;
• First in Ghaziabad, 3 km from Max
Patparganj, acquired 78% stake in 340
bedded Pushpanjali hospital
expandable upto 540 beds;
• Second facility adjacent to Max
Saket, acquired 51% stake in 230
bedded Saket City Hospital,
expandable upto 1200 beds
Max India concluded a mega corporate
restructuring by demerging into 3
holding companies
• Max Financial Service (Life Insurance)
• Max India Limited (Healthcare & Allied
businesses)
• Max Ventures and Industries Limited
(Manufacturing & new businesses)
Evolution of Max Group—Strong history of entrepreneurship and nurturing successful businesses (2/2)

Health & Allied
Business
Life Insurance
Business*
Max Group – Corporate Structure
4
Max Group (in the business of Life)
Manufacturing &
Other businesses
Ho
ldin
g
Co
mp
anie
s O
pe
rati
ng
C
om
pan
ies
70%
46%
51%
100%
99%
Group CSR Arm
30.5% 40.9% 40.4%
Promoter holdings in Max Group holding companies
* MFS Board has approved the 3 way merger of Max Life into MFS, demerger of life insurance undertaking from MFS and merger of the said undertaking with HDFC Life and merger of residual MFS entity into Max India
100%
100%
100%

Max Group Overview
INR 142 billion+ Revenues… 9.2 Mn Customers… 22,000 Employees… ~65,000 Agents*…
2,600 Doctors*…
Strong growth trajectory even in challenging times; a resilient & diversified business model
Steady revenue growth and cost rationalization leads to strong financial performance
Well established board governance….internationally acclaimed domain experts inducted
Diversified ownership…..marquee investor base
Superior brand recall with a proven track record of service excellence
Strong history of entrepreneurship and nurturing successful business partnerships
1
2
3
4
5
6
7
5
* Based on Sep’16 numbers

Max Group : Continues to grow from strength to strength
FY 2016 Summary: • Revenue at Rs 10,875 Cr, up 14%,
PBT at Rs 465 Cr, up 9% • MCEV at Rs 5,617 Cr, up 17%; • New Business Margin at 18.3% • Long term renewal of partnership
with Axis Bank • #1 in claims settlement and
Premium Conservation
FY 2016 Summary: • PBT at Rs 28 Cr, up 46% • Investment vertical kick started
with proposed investment in Azure Hospitality, which runs pan-Asian restaurant chains
• New Bopp line being set-up to expand capacity to 75,000 TPA
FY 2016 Summary:
• Group Revenues: Rs 14,237 Cr up 12%
• EBITDA: Rs 717 Cr up 16%. PBT at Rs 420 Cr up 27%
• Asset Under Management: Rs 36,390 Cr up 15%
• 9 Million Customers; 22,500 employees; 58,000 Agents; 240 offices
FY 2016 Summary: • MHC network turn profitable.
EBITDA grows 26% to Rs 215 Cr. • 2 acquisitions give MHC a platform
to double bed strength to over 5,000
• MAX Bupa GWP grows 28%. Distribution alliance with Bank of Baroda
• Antara all set to commence Dehradun operations next quarter
6

Max India: High pedigree investor base
Goldman Sachs
Ward Ferry
International Finance Corporation
New York Life Insurance
Temasek Holdings
Nomura Singapore
Invesco Mutual Fund
Reliance Mutual Fund
ICICI Prudential Mutual Fund
DSP Blackrock Mutual Fund
Mirae Mutual Fund
Shareholding concentrated with Marquee Investors
Number of outstanding shares : 26.70 Cr.
Promoters 40.4%
Goldman Sachs 15.3%
IFC 3.1%
FII/ FPI 17.7%
Mutual Funds 14.8%
Others 8.7%
Shareholding Pattern as on Sep, 2016
7

www.maxhealthcare.in www.maxindia.com
MAX INDIA LIMITED
MAX HEALTHCARE
8

Indian healthcare industry is expected to reach ~$400 billion fuelled by multiple demand drivers
Sources: India Brand Equity Foundation – Healthcare report, 2012; BofA Merrill Lynch Global Research, IBEF Mar'15
60 79 102
280
2010 2012 2015 2020 2025
Indian healthcare sector*
Estimated size, Bn USD
Demand drivers for growth
* Healthcare sector includes hospitals, pharmaceuticals, and medical technology sub-sectors
~500 mn
additional middle
class by 2025
~45%
Insurance
penetration by 2020
~134 mn
population > 60
years by 2020
~$8 bn
medical tourism
market size by 2020
~320 mn
at risk of dying due
to NCDs by 2020
~2 mn
beds required by
2025
CAGR
11.2%
CAGR
14.6%
^
350 - 450
^ Depending upon public spending levels, insurance proliferation, and success of public-private partnerships by 2025
9

Hospitals constitute ~70% of Indian healthcare market with increasingly dominant role of private sector
Sources: BofA Merrill Lynch Global Research, IBEF Mar'15
Private players have established a dominating presence in tertiary /
quaternary care
70% 63% 60% 78% 80%
30% 37% 40% 22% 20%
Market Share Beds Inpatients Outpatients Doctors
Private sector Public sector
70%
20%
10%
Hospitals
Pharmaceuticals
Medical technology / Others
Indian healthcare sector*
Market share %
Market size of private hospitals is expected to reach ~$ 120 bn by 2020
22 36
50
120
2009 2012 2015 2020
Private sector hospitals
Estimated size, Bn USD
CAGR
~14.7%
CAGR
~19.2%
* Includes hospitals, pharmaceuticals & medical technology / other companies
10
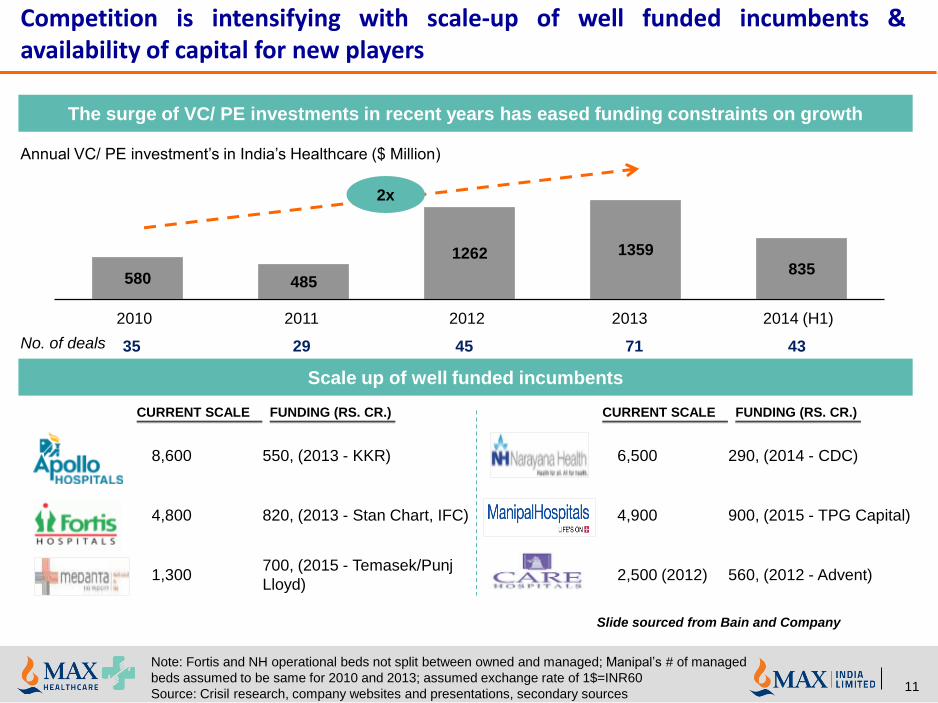
Competition is intensifying with scale-up of well funded incumbents & availability of capital for new players
The surge of VC/ PE investments in recent years has eased funding constraints on growth
Annual VC/ PE investment’s in India’s Healthcare ($ Million)
580 485
1262 1359
835
2011 2010 2013 2012 2014 (H1)
No. of deals 35 29 45 71 43
Scale up of well funded incumbents
8,600 550, (2013 - KKR)
4,800 820, (2013 - Stan Chart, IFC)
1,300 700, (2015 - Temasek/Punj
Lloyd)
CURRENT SCALE FUNDING (RS. CR.)
6,500 290, (2014 - CDC)
4,900 900, (2015 - TPG Capital)
2,500 (2012) 560, (2012 - Advent)
CURRENT SCALE FUNDING (RS. CR.)
2x
Note: Fortis and NH operational beds not split between owned and managed; Manipal’s # of managed
beds assumed to be same for 2010 and 2013; assumed exchange rate of 1$=INR60
Source: Crisil research, company websites and presentations, secondary sources
Slide sourced from Bain and Company
11
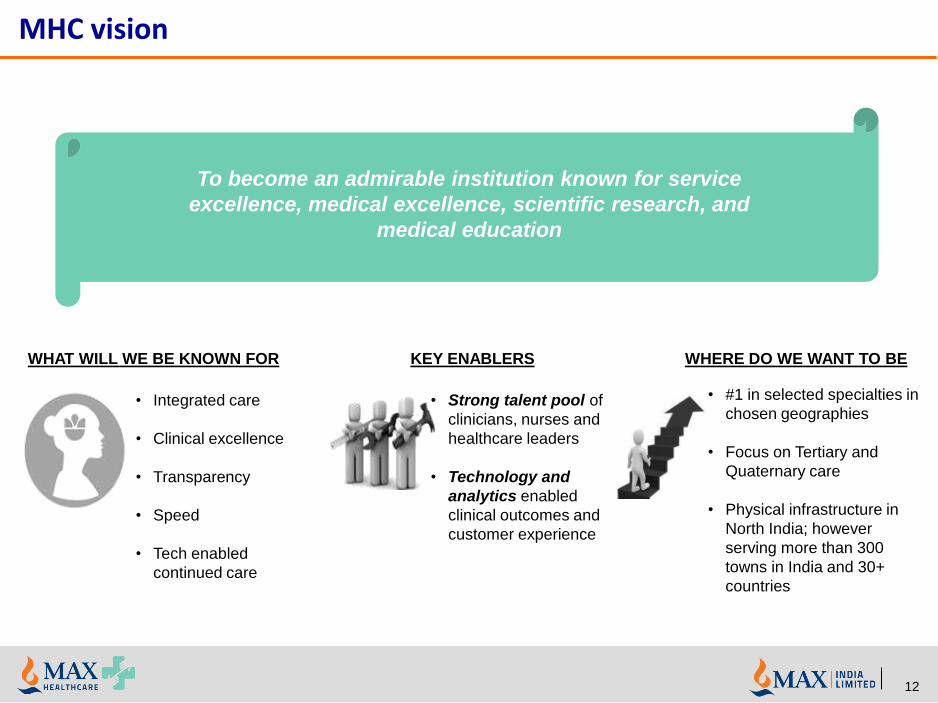
MHC vision
KEY ENABLERS WHERE DO WE WANT TO BE WHAT WILL WE BE KNOWN FOR
• Strong talent pool of
clinicians, nurses and
healthcare leaders
• Technology and
analytics enabled
clinical outcomes and
customer experience
• Integrated care
• Clinical excellence
• Transparency
• Speed
• Tech enabled
continued care
• #1 in selected specialties in
chosen geographies
• Focus on Tertiary and
Quaternary care
• Physical infrastructure in
North India; however
serving more than 300
towns in India and 30+
countries
To become an admirable institution known for service
excellence, medical excellence, scientific research, and
medical education
12

MHC has a strong focus on North India
70
402
535
Saket Noida
Gurgaon
Vaishali
Shalimar Bagh
Saket City
Pitampura
46
64
OUTSIDE NCR NCR
Patparganj
215
Mohali
Bathinda
Dehradun
186
168
260
224
275
2400+ available
beds across the
network
13

MHC has invested in state of the art equipment to achieve clinical excellence (1/2)
Advanced robotics provides high precision, and
minimum invasive surgery across multiple
specialities such as Oncology, Neurology
High dose radiation with extreme
precision (~ 0.5 mm accuracy)
Advanced image guided surgery -
provides real-time views and automated
image processing
Provides precise correlation and facilitates
proper treatment for Oncology, surgical
planning and radiation therapy
Ro
bo
tics
B
rain
su
ite
No
valis
LIN
AC
P
ET
-CT
14

MHC has invested in state of the art equipment to achieve clinical excellence (2/2)
Robotic radio-surgery (non-invasive) system for
both cancerous & non-cancerous systems
Designed for revolutionary single incision
laproscopic surgery through catheter-based,
flexible instruments
Economical digital storage and convenient access to medical
images from multiple modalities
Cyb
erK
nif
e*
Picture Archiving & Communication System - PACS
SP
IDE
R
* planned
15

MHC has a robust service excellence & quality framework which has resulted into enhanced customer experience
• “Sevabhav” trainings and Reward &
Recognition platform has led to
positive shift in mindset
• Structural Interventions through Six
Sigma and other methodologies has
resulted into business impact of over 15
Mn USD
57%
68%
FY`15 FY`16
11%
Top 2 Box Rating*
* MHC is the only healthcare company who has deployed a third party
(IMRB) to conduct Satisfaction survey 16

MHC strong Governance Model helps us bring alignment and improve accountability
Executive Committee
Unit Heads
Unit Management Committee (MANCO)
Group Medical Advisory Council
(GMAC)
Hospital Medical Executive Council
(HMEC)
Doctor’s council
Managerial Clinical
Administration
Nomination &
remuneration Audit
Investment &
performance
review
Medical
excellence &
compliance
Service
excellence
Scientific
projects &
technology
Corporate
social
responsibility
Board & 7 committees
Governance
17

MHC have a proven record of building an institution
NABL/
NABH
accredited
ISO
9001:2000
& ISO
14001: 2004
certified
DL Shah
National
Award on
‘Economics
of Quality’
FICCI
Excellence
Awards -
Operational
Excellence
Leadership
positions in
NatHealth
and CII -
healthcare
First MHC
hospital started in
2002
MHC is one of the
top 3 healthcare
chains in India
Strengthened capabilities to provide comprehensive
tertiary & quaternary care
Network of highly qualified doctors, nurses and medical
personnel
Organic growth through expansion of hospital
network
JV with Life Healthcare, South Africa, extending
expertise and global reach
Business
World
Healthcare
Award in Patient
Experience &
Safety
18

Awarded on 17th Jan, 2013
Past winners: www.mahindra.com and
www.volkswagon.co.in
MHC won among 200 Nominations in the Award
Category
IAMAI jury evaluated entries based on :
• Content
• Structure and Navigation
• Visual Design
• Functionality
• Interactivity
• Overall Experience
Accreditations and Awards
Achievements: 2012-13:
MSSH: Shalimar Bagh: NABH New Accreditation
MSSH, Mohali: NABH New Accreditation (awaited
shortly)
MSSH, Saket: NABH Reaccreditation
MSSH, Patparganj: NABH Surveillance Accreditation
Blood Bank: MSSH, Patparganj: NABH Reaccreditation
Pathology Lab: MSSH, Patparganj: NABL
Reaccreditation
Pathology Lab, MSSH, Gurgaon: NABL Reaccreditation
National Standards:
Mark of Excellence :
636 aspects are addressed:
•Patient Rights: respect,
transparency, consent
•Standardized protocols in all
departments: over 200 SOPs
•Patient safety
•Measurement & Evaluation
• Staff Training and safety: on all
SOPs
NABH / NABL Accreditation
MHC is committed to ensure that all units are
complaint to the National Standards
Centre of Excellence Recognition to MHC for
Treatment of Heart Attacks
By Lumen Global 2013
Under leadership of Dr. Roopa Salwan
Radiation Therapy Radiation Oncology
Department, Saket:
Recognition of Quality Standards conforming to
International Atomic Energy Agency / World
Health Organization
Under leadership of Dr Anil K Anand & Mr.
Munjal
Dr. Arati Verma selected as Co-Chairperson of
Technical Committee of NABH
ISO 14001:2004 & 18001:2007 at
Patparganj , Pitampura & Shalimar Bagh
ISO 9001:2008 at Max Heart & Vascular
Institute, Patparganj, Noida, Pitampura,
Shalimar Bagh, Panchsheel Park &
Home Office.
Best Corporate Website
– maxhealthcare.in
3rd India Digital
Awards by Internet &
Mobile Association of
India
FICCI Healthcare
Excellence
Awards-2015
Patient Safety Award: Max Super Speciality Hospital,
Saket
Customer Service: Max Super Speciality Hospital,
Saket
Improvement Award
(Private)
19

Healthy revenue growth driven by new & mature hospitals
686810
1,002 1,0951,283
1,423
147
312
461
759
2,181
FY14 FY13
1,149
1,744
FY12
823
14
FY15
1,407
FY16
0
686
FY11
26%
New Units,
< 5 Years
Mature Units,
> 5 Years
MHC Annual Gross Revenues by hospital age
Rs. Cr.
CAGR, FY13-16
Mature Units 12%
New Units 73%
Total, MHC 24%
20

Steady margin expansion driven by cost efficiencies, build-up in mature units, and revenue scale-up at new units
52
166190
50
115 125
(43)(37)
31
0
FY11
52 12
FY12
7
112 71
221
FY14
-14
FY13
34% 173
FY16 FY15
< 5 Years > 5 Years MHC EBITDA by hospital age
Rs. Cr.
% EBITDA Margin, < 5 Yrs. xx % EBITDA Margin, MHC xx
7.7 1.5 6.4 8.2 10.1 10.5
% EBITDA Margin, > 5 Yrs. xx
7.7 6.2 11.8 12.0 13.4 14.0
n/a -277 -30 -4.4 1.5 4.1
ROCE for mature units at 17.3% (FY16) vs. -1.5%
for new units (FY16)
NOTE: FY16 EBITDA excludes Rs. 6 Cr. of one time expenses towards the Pushpanjali and Saket City acquisitions;
FY15 excludes Rs 3 Cr of one off expenses
21

Strong momentum across all volume and value levers in last 5 years
Maintained healthy occupancy levels despite strong bed
addition momentum Steady growth in Revenue per occupied bed
Sharper focus on key tertiary tower specialities Consistent improvement in Average Length of Patient
Stay
Figures in Rs. Thousands Per OBD
908 1,094 1,235 1,283394
445 502
680312
992
1,680 1,472
378 1,302
FY14 FY13 FY12 FY16
1,785
+16%
FY15
+7% 42 39
FY14
35 35
FY15 FY13 FY12 FY16
32
+3%
3.3
FY15
3.4
FY14
3.6
FY13 FY16
3.5
FY12
3.5
Figures in Number of days
Number of available beds xx NOTE: FY16 excluding Vaishali and Saket City Hospital
55%
FY15
14%
6%
13%
FY16
13%
10%
2%
56%
13%
10%
4% 4%
14%
3%
10%
3%
15%
FY12
14%
9%
9%
6% 48%
7%
4% 5%
51%
7%
3% 53%
10%
12%
10%
8%
FY13 FY14
11%
10%
MAMBS Onco Renal Neuro Cardiac Ortho
74% 72% 74% 70% 69%
Avg. occupied
beds
Avg. unoccupied
beds
Occupancy (%)
22

MHC growing faster than competition; profitability ratios to improve with maturity of beds and further expansion
All figures for FY16 Max Healthcare Fortis Apollo*** Narayana
Health
Operational Beds (No.) 2,200 3,600 6,600 5,200
Capital Employed (Rs. Cr.) 2,147 6,306 4,329 1,431
Net Revenue (Rs. Cr.) 2,098 Cr.,+24% 3,450 Cr, +8% 4,596 Cr., +10% 1,618 Cr, +18%
International Rev./ Qtr. 192 Cr, +15%,
8.8% of revenue 343 Cr, +9%
9.9% of revenue N.A 5% of Revenue
Operating EBITDA (Rs. Cr.)
221* 50.8/507.8** 697 187
EBITDA Margin (%) 10.5*% 1.5%/14.7%** 15.2% 11.6%
EBITDA Growth (%) 30% 11% 6% 44%
ROCE (%) 4.6%
(Mature Units -17.3%) 1.3% 11.2% 7.8%
EBITDAR per OBD (Rs. lacs) 18.0
(excl. acquisitions – 20.0) 19.8 18.8 8.1
ALOS (days) 3.26 3.56 4.17 4.32
ARPOB/p.a (Rs. Cr.) 1.48 1.37 1.09 0.64
Top Specialties Cardiac 13%, Onco 13%, Ortho 10%, Neuro 10%,
Renal 7%
Cardiac 25%, Ortho 9%, Neuro 8%,
Renal 7%, Onco 5%
Cardiac 23%, Ortho 10%, Neuro 12%,
Renal 4%, Onco 8%
NA
* EBITDA (FY16) at Rs. 215 Cr. (10.2% margin) after including Rs. 6 Cr. of one time acquisition expenses ** EBITDA Before Net BT Costs *** Apollo Revenues adjusted for doctor fees and depreciation (assumed 85% pertains to hospitals) 23

Four dimensions to value creation for MHC
• Innovative/scaleable patient care model driven by our belief that patients are increasingly seeking access to personalized treatment
• Identified as one of most attractive alternate business opportunity
• Allows MHC to leverage strengths while looking outwards
• Potential to add 2500+ beds to reach 5000+ beds in end state
• Healthy mix of old and new beds to be maintained over next 5 years of growth
• Improve profitability of mature, at-scale hospitals through improvements in specialty/channel mix and cost structures
A. Optimize current network
B. Create additional
bed capacity
D. Launch Oncology Day care centres
C. Expand Pathology business outside of hospitals
24

A Increasing share of preferred channels to improve profitability
As the new units in the network mature, the share of preferred channels will increase in the revenue
mix and tend to mirror the share in current mature units
Action plan in place to further increase the share of preferred channels in the mature units
19.4% 20.6%16.9%
25.6%19.4% 16.2%
18.9%15.6%
37.0%36.3%36.6%
100.0%
14.0%
12.9%
MHC
100.0%
1.6%
Mature
Units
9.1% International
New
Units
100.0%
Institutional/PSU
TPA
Walk-In
MAC
Preferred
Channels
Non-preferred
Channels Healthcare revenue channel share*, FY16
Percent
* Does not include Max Smart
Walk-in Inter-
national
• Sustained brand effort / experience
delivery on new positioning
• ATL/BTL campaigns for key specialties
• Strengthen ER capabilities
TPA
• Seek new engagement models in the
prevention/ wellness space
• Assess co-development of product targeted
at new customer segments
• Establish direct presence and
digital footprint in select markets
• Expand in attractive new markets
• JCI Accreditation at flagship units
MAC
Institutional
• Maintain share & improve quality of
business via upcountry channel
• Deprioritize; profitability
improvement through focus on
collections, material cost, and ALOS
25
TRANS-
PLANT
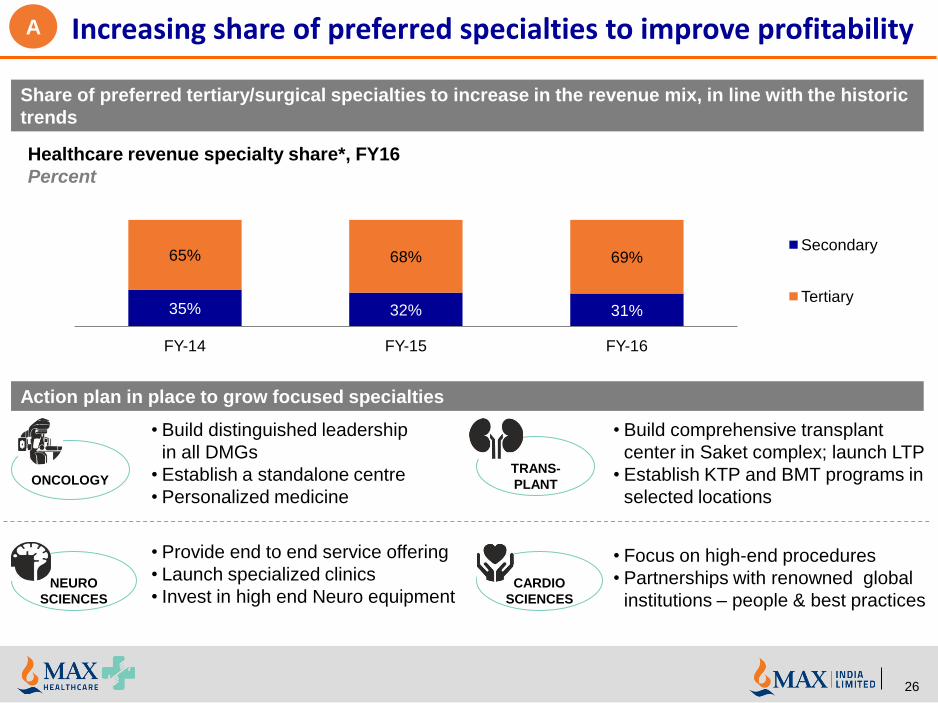
Increasing share of preferred specialties to improve profitability
Share of preferred tertiary/surgical specialties to increase in the revenue mix, in line with the historic
trends
Action plan in place to grow focused specialties
Healthcare revenue specialty share*, FY16
Percent
• Build distinguished leadership
in all DMGs
• Establish a standalone centre
• Personalized medicine
ONCOLOGY
• Provide end to end service offering
• Launch specialized clinics
• Invest in high end Neuro equipment
NEURO
SCIENCES
CARDIO
SCIENCES
• Build comprehensive transplant
center in Saket complex; launch LTP
• Establish KTP and BMT programs in
selected locations
• Focus on high-end procedures
• Partnerships with renowned global
institutions – people & best practices
35% 32% 31%
65% 68% 69%
FY-14 FY-15 FY-16
Secondary
Tertiary
A
26

Focus on structural cost efficiency built up through a programmatic approach
Rs. ~40 Cr. of cost saving achieved during FY16
Rs. 40 Cr. of further cost efficiency built up being
targeted for FY17
Focus on structural improvements
• Procurement efficiency and
formulary driven substitutions
• Materials management and control,
spl. In PSU cases
• Contract negotiations and
optimization
• Organization restructuring
• Physician compensation re-
modelling
• Contract negotiations
• Work optimization by leveraging
benchmarks
Build strength in procurement
• Best in class cost
• Optimized formulary
• Support low cost
supplier/vendor eco-system
Invest in technology / digital
• Best in class manpower
productivity (Smart Kiosks,
e-ICU etc.)
• Leverage technology to
provide health services
outside of hospital
Re-engineer/simplify processes
• Reduce manpower and
other indirect costs through
elimination of wasteful
steps
MATERIAL
COST
CLINICIAN
COST
PERSONNEL
COST
OTHER
INDIRECT
COST
A
27

MHC poised to derive strong growth from healthy mix of mature and New units
2,471
5,075
84 - 106 184
650 -
1,580
FY 16 FY 17 FY 18 FY 19 FY 20 FY 21 FY 22 FY 23 & beyond Total
Smart : 44
Vaishali: 40
S.Bagh: 104
Mohali: 80
Smart: 650
Mullanpur: 400
Gr. Noida: 380
Smart: 350
Saket: 250
PPG: 200
1346 1430 737 675 859 1509 1024 2520
1125 1125 1818 1986 1986 1986 2471
2555
FY 16 FY 17 FY 18 FY 19 FY 20 FY 21 FY 22 FY 23 and beyond
> 5 years < 5 years
B
28
2,471 2,555 2,555 2,661 2,845 3,495 3,495
5,075
Vaishali
: 106

• Founded by prominent Delhi clinician; operational since 2010
• Strategically situated on National Highway 24; 5 minutes from
Max PPG - Potential to dominate the E. Delhi and Western UP
• Large asset with potential to grow
• 340 beds, expandable to 540
• Built on a plot size of 3.46 acres with 0.4 mn. sq. ft.
Builtup
• Infrastructure matching MHC’s LTFS standards
Rechristened MHC Vaishali
Post acquisition
The
Acquisition
Financial Turnaround
Q2FY16 H2FY16 H1FY17
12.2
0.6
5%
67%
15.5
2.6
17%
64%
17.0
2.4
14%
70%
Revenue* (cr)
EBITDA* (cr)
EBITDA (%)*
Occupancy
* Figures are monthly average
Higher EBITDA in H2FY16 is due to exceptional items in Mar16
During FY16, MHC acquired the 340 bedded Pushpanjali hospital in NCR, with potential to grow up to 540 beds
B
29

State-of-the-art transplant centre – for all
transplants incl. heart, liver, kidney, bone marrow
Asia’s premier quaternary care with 7 centres of
excellence
India's first international patient centre
Largest private facility in India
Dec 16 H1FY17
13.6
-0.8
-7%
69%
16.2
1.45
9%
75%
Revenue* (cr)
EBITDA* (cr)
EBITDA (%)*
Occupancy
~2000 beds in fully built state
Complex spread across 11.5 acres
300 – 500 beds dedicated to Cancer
Infrastructure to support all 6 tower
specialties
Adjoining 7.1 acres land to be
developed to offer complementary,
allied healthcare services such as
Rehab, assisted living etc. by
GMHRC
Enterprise Value of Rs. 1,025 Cr. (Equity Value Rs. 325 Cr. for 51% stake and debt of Rs. 325 Cr;
Rs. 375 Cr. (+12% p.a.) to be paid within 3 years for the balance 49% stake)
13.8
-0.52
-4%
66%
Q4FY16
30
Saket City Acquisition: Opportunity to create one of Asia’s largest Medicity in the heart of South Delhi
B
* Figures are monthly average

Max Lab : Looking outwards while leveraging our strengths
• Significant demand:
• Path market in NCR poised to grow 3X
by 2020 – INR 2100 Cr to ~Rs 6,200 Cr
• Supportive supply situation:
• Organized players (CAGR ~ 26%)
outpacing industry growth
• Very few organized players currently.
No significant consolidation expected
• Attractive entry model
• Possible for MHC to enter B2C & B2C
business models with low-capex by
leveraging existing infrastructure
• Encouraging financials
• Existing players have EBITDA margins
of 20%+,, EBITDA on incremental
revenues for MHC expected to be
significantly higher (> 35%)
Why will MHC succeed?
Physician
Clinic
Hospital
tie-ups
Govt
hospital/PPP
Hospital
lab
Home sample
collection
POC Collection
center
MAX LABS 24X7
Consumer
Clinicians/
Institutions
Rs. ~250 Cr. of Revenues from in-house
IPD/OPD Pathology services (FY16)
C
31

Cancer Day Care Centre – Launching an innovative patient care model in Q1 FY17
Actual design
images Actual design
images
Our belief Our differentiators
Patients are increasingly seeking access
to a more personalized treatment (vis-à-
vis at a hospital) along with a unique
adjunctive ambience/experience and a
high focus on efficiency
1. Led by a stalwart Med. Oncologist
2. End to end design partnership with GE
3. Staff expertise and iron clad processes
4. Comforting ambience
D
32

www.maxbupa.com www.maxindia.com
MAX INDIA LIMITED
MAX BUPA HEALTH INSURANCE LIMITED
33

A symbiotic partnership in health insurance
Leveraging the strengths of both partners to build a robust and profitable enterprise with focus on service excellence
India’s leading conglomerate
Successful track record of building market leading businesses
Expertise in life insurance, health insurance & healthcare businesses
Group revenues in FY 2016 – INR 142 billion
In-depth understanding of the Indian market
Strong DNA of service excellence
Strong track record of creating value and sharing it with its strategic partners
51:49 JV of Max and Bupa
Perfect blend of global expertise and local knowledge of Healthcare and Insurance
Started in Apr 2010
JV to be Indian owned and controlled with Bupa contributing it’s global expertise in Health Risk Management & product development and Max contribution on other aspects such as people, policies, regulatory etc.
Largest independent health insurance provider in UK
Global Expertise in health insurance and healthcare
Group revenues in 2015 - ~£9.8 billion
32 million customers in over 190 countries
Largest global provider network for international healthcare coverage
–11,500 hospitals
–750,000 medical professionals
Voted as best international health care provider globally
34

Our Vision and Mission
35
To be the most admired health
insurance company in
India
To help customers live healthier, more successful lives
Vision Mission

Industry landscape
36
Health insurance market (including PA, Travel & contribution by life insurers)
FY 15-16
2,800
Travel &
LI contribution 2
PA
FY10-11
Retail
50,000
1,600
Government
sponsored
9,100
Corporate
FY19-20
(Estimated)
23,600
17,500
4,500
GWP in Rs cr
27,362
Low penetration and coverage HI penetration (premium as % of GDP) is only
~0.2% Only 15% of population has any kind of health
insurance
Increasing affluence and awareness Rise in income levels and healthcare spend per
capita Middle class expected to increase to 41% of
population by 2025 (from 5% in 2005)1
Rise in health care costs Medical inflation over 10% High out-of-pocket expenses (62% v/s ~10% in
US/UK & ~30% in China)
Rise in incidence of chronic diseases (viz. Cancer, heart diseases) & lifestyle related diseases (diabetes)
Regulatory & policy level interventions IRDAI’s consumer-centric approach Higher tax saving incentives on HI
Key drivers of growth
Indian health insurance market is likely to grow by 20-25% CAGR in next 5 years
1 Mckinsey report ‘Tracking the growth of India’s middle class’ in 2007
2 Growth rates for Travel & LI contribution of HI not available (Assumed at 16% same as 5 year CAGR of PA)

Recent industry developments
Religare Apollo MBHI Cigna Star
SAHIs are the fastest growing section in the industry…
…led by distribution expansion as well as product launches
GWP in Rs cr • Heavy investments to add capacity
- SAHI players (Apollo, Star, Religare) have been adding capacity in agency channel over last 2 years – branches as well as frontline sales force
- Banca tie-ups over last 2 years, adding significant capacity to their network
• Multiple product launches
- Niche proposition like Cancer care, Dengue care, Maternity specific, Health savings product etc.
- Increased focus on health & wellness offerings (Cigna, ICICI Lombard, Aditya Birla Health)
• Industry continues to attract new entrants
- Kotak General – paid-up capital of Rs 150 cr with initial focus on motor and health retail segment)
- Aditya Birla Health Insurance commenced business
- Edelweiss Financial Services to enter GI space
• Stake sale
- Foreign insurers are raising stake (Mitsui Sumitomo – Chola MS, Fairfax Holdings – ICICI Lombard, Cigna – Cigna TTK)
- HDFC ERGO General Insurance acquired 100% shares of L&T General Insurance for Rs 551 cr
Source: GI council; Market intelligence, team analysis
+21%
27,362
22,580
2,928
6,148
13,503
4,154
6,901
16,308
SAHIs
+42%
+21%
Pvt GIPSUs
+12%
FY 14-15
FY 15-16
22
373276
785
1,473
144
476503
1,022
2,008
+36%
+82%
+555%
+28%
+30%
FY 14-15
FY 15-16
GWP in Rs cr
Overall HI industry
37
Key recent trends

Journey since inception
38
FY10-11
FY11-12
FY12-13
FY14-15
FY15-16
GWP, Rs cr
FY13-14 99
207
308
373
Ch
ann
el
Serv
ice
mo
del
• B2C
• Agency • Direct channels • TPD
• In-house claims processing
• Entered B2G - First RSBY scheme won
• Entered B2B business
• Launched ‘Walk for Health’, annual brand property
• First Banca partnership (Deutsche bank)
• Rationalized TPD2
1. Does not include rural lives | 2. From ~70 partners to top 5 | 3. As of 30th Sep’16
• Reached ~3,100 network providers
• 30-min claims settlement (92% cases)
• Launched three more banca partnerships
• Prioritized B2C
296%
108%
53%
18%
47
215
454
681
799
Lives, ‘0001
xx% Y-o-y growth
80%
CAGR
476
1,010
• CRM launched • Walk for Health
went national touching 33 MM lives
• Launched 4 partners (Sarv UP, Muthoot, Coverfox, Bank Bazaar)
26
Segm
ent
H1FY16-173
• Launched Bank of Baroda serving more than 5,400 branches
• Standing Instruction for auto renewal,
• First ‘embedded’ product launched at Federal
28%
260
1,148

Healthy premium growth with consistent improvement in combined ratio
39
Max Bupa’s focus has been on the B2C segment since inception
While it is harder to build a B2C book (linear customer acquisition vs. lumpy demand of B2B or B2G), Max Bupa has grown faster than market (market growth ~16% CAGR)
B2C focus driven operating model choices and some execution challenges have resulted in higher upfront opex spend
80%
Year 2 Year 4 Year 3 Year 5 Year 1 Year 6 (2015-16) (2010-11)
(2015-16) (2010-11)
Co
mb
ined
Rati
o*
(%) 553%
212%
151% 142% 127% 115%
Year 1 Year 2 Year 3 Year 4 Year 5 Year 6
Gro
ss w
ritt
en
pre
miu
m
Rs C
r
* Combined ratio = Claim ratio (Net claim incurred / Net Earned premium) +Opex ratio (Opex / GWP) + Commission ratio (Net commissions / GWP)
25 77
162 245
354 466
22
38
56
17
6
-
8
8
1
4
B2C B2B B2G
25 99 207 308 373 476

Comprehensive product suite
40
Heartbeat
Hospitalization costs including:
Room and ICU
Day Care Treatment e.g. dialysis
Coverage for tests/treatment linked to current ailment 30 days prior and 60 days post hospitalization.
Living organ donation transplant
Doctor and nursing fees
Emergency ambulance
Features
Flexible options for coverage: 3Lacs, 5Lacs, 7.5Lacs & 10Lacs
Refill/reinstatement benefit
Accidental death benefit of twice sum insured
20% co-payment on OPD/non-network hospitals
Deductibles of 1Lacs, 2Lacs, 3Lacs, 5Lacs & 10Lacs
Health Companion
Hospitalization costs including:
Room and ICU
Day Care Treatment e.g. dialysis
Coverage for tests/treatment linked to current ailment 30 days prior and 60 days post hospitalization.
Living organ donation transplant
Doctor and nursing fees
Emergency ambulance
AYUSH treatment
Features
Domiciliary Hospitalization
Refill benefit
Vaccination for Animal bite
Hospital cash (optional)
No Claim bonus
Deductibles of 1Lacs, 2Lacs, 3Lacs, 5Lacs & 10Lacs (optional)
Health Assurance
Accident Care:
Accidental death benefit of 100% of allocated coverage
Accidental Permanent Total Disability benefit of 125% of allocated coverage
Accidental Permanent Partial Disability benefit
Child education benefit
Funeral expenses
Optional: Temporary Total Disability & Accident Hospitalization benefit
Critical Illness:
Covers 20 critical illnesses
Option 1: Lump sum
Option 2 : Lump sum + staggered pay-out for 5 years
Hospital Cash:
Daily cash benefit of Rs 1000/2000/3000/4000
ICU cash benefit of double the daily cash benefit
Group Business
Group Health Insurance:
Group Indemnity Cover
Group Hospital Cash Cover
Group Critical Illness Cover
Group OPD Treatment Cover
Group Health Check-up Cover
Group Named Illness Cover
Maternity benefits options
Domiciliary Treatment
Corporate Floater
Group Personal Accident:
Accidental Death
Permanent Total Disability
Permanent Partial Disability
Temporary Total Disability
Accidental Medical Reimbursement
Education Allowance for children
Family Transportation
Broken Bones coverage
Last rites Expenses

Distribution architecture
41
Largest distribution channel for the company
Spanning 27 branches across 17 cities
Over 50% contribution of overall revenue
Frontline sales force of 405 Agency Managers ~14,000 agents
One of the most productive agency force amongst SAHIs (Standalone Health Insurers)
6 Banca partnerships (2 foreign banks, 3 Indian banks and 1 rural bank), highest amongst SAHIs
Network of 7,400 bank branches across the country
290 FOS (Feet-on-street)
2 NBFC tie-ups (Muthoot, Bajaj Finserv)
Brokers (Bajaj Capital, NJ Brokers, Shriram)
Rural business (RSBY)
One of the largest captive tele-sales set-up in industry
Capacity of 140 out-bound tele-callers
State-of-the-art technology infrastructure (Dialer / CRM) with secure environment
Online sales through MBHI website & web aggregators (6 partners, including Policy Bazaar – a leading industry player)
Dedicated sales-force
88 full-time employees to address high-net worth individuals’ needs
Spread across top 4 metros
Agency
Banca & Alliances
Digital
DST

Brand The only Health Insurer to be listed as a Superbrand in 2015-16
Most Trusted Health Insurer (third time in a row) in the Brand Trust Report 2016
IT E-Governance BFSI Leadership Awards 2015 - Best Solution for Data management
Model Asia Insurer of the Year 2016 for best IT practice (CRM implementation)
Customer Service
‘Claim Service Leader of the Year’ at the 5th Indian Insurance Awards 2015
‘Best Customer Service’ at Customer Experience Management Asia Summit 2015
Product Innovation of the Year (Heartbeat) at the Golden Peacock Awards 2015
External recognition
42
Max Bupa today
For the period ended Sept 30, 2016
43
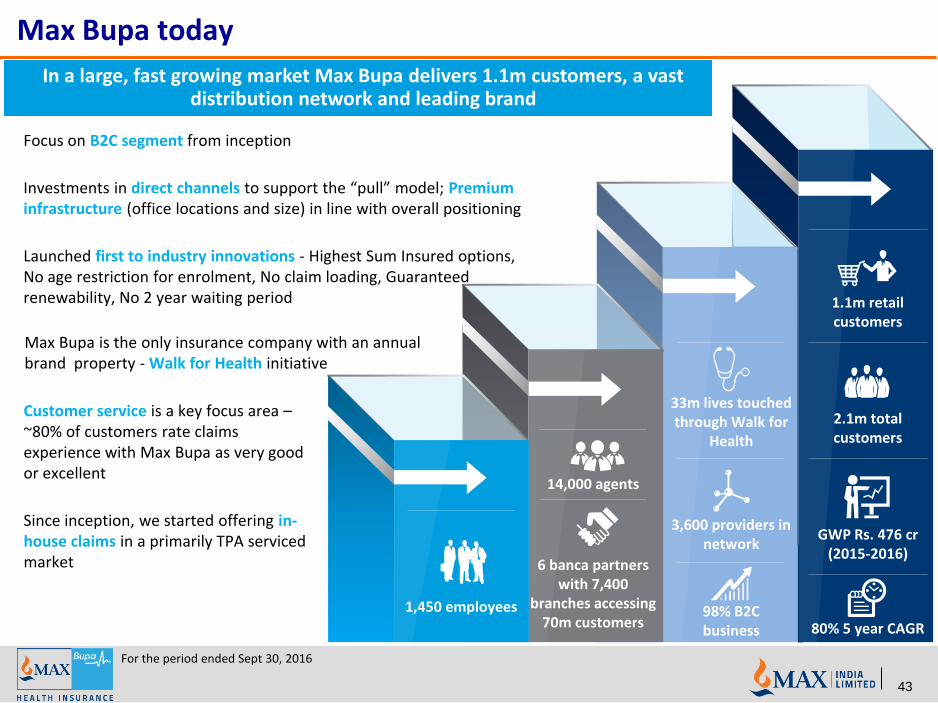
In a large, fast growing market Max Bupa delivers 1.1m customers, a vast distribution network and leading brand
1,450 employees
6 banca partners with 7,400
branches accessing 70m customers
14,000 agents
98% B2C business
3,600 providers in network
33m lives touched through Walk for
Health
1.1m retail customers
2.1m total customers
GWP Rs. 476 cr (2015-2016)
80% 5 year CAGR
Focus on B2C segment from inception
Investments in direct channels to support the “pull” model; Premium infrastructure (office locations and size) in line with overall positioning
Launched first to industry innovations - Highest Sum Insured options, No age restriction for enrolment, No claim loading, Guaranteed renewability, No 2 year waiting period
Max Bupa is the only insurance company with an annual brand property - Walk for Health initiative
Customer service is a key focus area – ~80% of customers rate claims experience with Max Bupa as very good or excellent
Since inception, we started offering in-house claims in a primarily TPA serviced market

Strategic priorities – strengthening the foundation
Portfolio management approach to renewals & profitable growth
Compelling product proposition
Build Digital
Enable the workforce
1
2
3
4
5
6
Optimize expenses & robust claims management
Strengthen processes & technology
44
A
B
C
D Digitally enable end to end customer journey
Build a Customer centric, Compliant & Cost conscious Culture
Broad base the franchise with partnerships & alliances
Provider of choice in the Affluent segment in urban India

Disclaimer This presentation has been prepared by Max India Limited (the “Company”). No representation or warranty, express or implied, is made and
no reliance should be placed on the accuracy, fairness or completeness of the information presented or contained in the presentation. The
past performance is not indicative of future results. Neither the Company nor any of its affiliates, advisers or representatives accepts liability
whatsoever for any loss howsoever arising from any information presented or contained in the presentation. The information presented or
contained in these materials is subject to change without notice and its accuracy is not guaranteed.
The presentation may also contain statements that are forward looking. These statements are based on current expectations and
assumptions that are subject to risks and uncertainties. Actual results could differ materially from our expectations and assumptions. We do
not undertake any responsibility to update any forward looking statements nor should this be constituted as a guidance of future
performance.
This presentation does not constitute a prospectus or offering memorandum or an offer to acquire any securities and is not intended to
provide the basis for evaluation of the securities. Neither this presentation nor any other documentation or information (or any part thereof)
delivered or supplied under or in relation to the securities shall be deemed to constitute an offer of or an invitation.
No person is authorised to give any information or to make any representation not contained in and not consistent with this presentation
and, if given or made, such information or representation must not be relied upon as having been authorised by or on behalf of the Company
any of its affiliates, advisers or representatives.
The Company’s Securities have not been and are not intended to be registered under the United States Securities Act of 1993, as amended
(the “Securities Act”), or any State Securities Law and unless so registered may not be offered or sold within the United States or to, or for
the benefit of, U.S. Persons (as defined in Regulations S under the Securities Act) except pursuant to an exemption from, or in a transaction
not subject to, the registration requirements of the Securities Act and the applicable State Securities Laws.
This presentation is highly confidential, and is solely for your information and may not be copied, reproduced or distributed to any other
person in any manner. Unauthorized copying, reproduction, or distribution of any of the presentation into the U.S. or to any “U.S. persons”
(as defined in Regulation S under the Securities Act) or other third parties ( including journalists) could prejudice, any potential future
offering of shares by the Company. You agree to keep the contents of this presentation and these materials confidential.
45

ANNEXURES
46

Mr. Rahul Khosla (Chairman)
President – Max Group
Over 30 years of global experience in Banking and
Financial markets.
Mr. Mohit Talwar
Managing Director at Max India Ltd. & Max Financial
Services Ltd., Over 30 years of experience in Corporate
Finance and Investment Banking.
Dr. Omkar Goswami
Economist and Leading Academic
Serves on Board of many Indian MNCs as Dr Reddy’s,
Infosys, IDFC, Crompton Greaves, Cairn India Ltd. etc
Mr. Kummamuri Murthy Narasimha
Independent Director; Leading Finance professional
associated with the development of Cost &
Management Information Systems for over 150 firms
Mr. Rajit Mehta
Managing Director & CEO- Max Healthcare
Over 20 years of experience in financial services.
Previously Chief Operating Officer at Max Life
Insurance.
Dr. Ajit Singh
Partner at Artiman Ventures, focusing on early-
stage technology & life science investments
PhD in Computer Science from Columbia University
Dr. Pradeep Kumar Chowbey, Padmashri
Director of Max Institute of Minimal Access,
Metabolic and Bariatric Surgery. More than 35 yrs
of experience in Lap Surgery, completed 70,000
major Lap procedures
Mr. Andre Meyer
Chief Executive Officer, Life Healthcare Group
Extensive experience at executive level in employee
benefits and healthcare sectors
Ms. Madhabi Puri Buch
Founder of Agora Partners PVt Ltd
Previously Head of Singapore office at Greater
Pacific Capital and was also the CEO of ICICI
Securities.
MHC - Board of Directors
47
Mr. Adam Pyle
Non Executive Director and Group Executive, Strategy
and Investor relations, Life Healthcare Group
Commerce and Law graduate and currently
responsible at LHC for driving the international (Poland,
India and other territories) strategy, South Africa
strategy and managing Investor relationship
Mr. Pieter Van Der Westhuizen
Non Executive Director and Chief Financial Officer, Life
Healthcare
Part of the LHC group for last 17 years and has fulfilled
various financial roles

Mr. Rajit Mehta
Managing Director & CEO- Max Healthcare
Over 20 years of experience in financial services.
Previously Chief Operating Officer at Max Life
Insurance.
Mr. Yogesh Sareen
Senior Director & Chief Financial Officer
Over 20 years of experience in across all facets of
finance; previously CFO of Fortis Healthcare.
Mr. Rohit Kapoor
Senior Director & Chief Growth Officer
18 years of diverse experience across industry and
management consulting with McKinsey & Company
Mr. Rohit Varma
Director- Human Resources & Chief People Officer
Over 25 years of HR industry experience in
organisations like NIIT, Headstrong, Genpact
Mr. Anil Vinayak
Director & Zonal Head – NCR 1
Over 23 years of experience in Business Management
and Sales & Marketing; previously with Amex
Mr. Anas Wajid
Director- Sales & Marketing
More than 17 years of experience in diverse fields such
as advertising, retail , healthcare and media. Previously
Head, Sales and Marketing at Fortis Healthcare
Dr. Sandeep Buddhiraja
Director- Clinical Directorate & Institute of Internal Med.
Over 23 years of experience in the field of Internal
Medicine
Mr. Rakesh Prusti
Director - Legal, Compliance and Regulatory Affairs
Over 19 years of experience in diverse sectors such as
Trading, IT, Export and Manufacturing; previously with
Carrefour and NIIT
Mrs. Vinita Bhasin
Senior Vice President & Head of Service Excellence
More than 19 years of in-depth experience across the
Financial Services sector; previously with Max Life
Insurance
Mr. Sumit Puri
Chief Information Officer
Over 21 years of experience in varied industries
such as Health/ Life Insurance, IT/ITES, and
Consulting; previously CIO of Prudential Life
Assurance
MHC – Management Team
48

Key Physicians
49
Dr. Harit Chaturvedi
Chairman – Cancer Care, Director & Chief Consultant -
Surgical Oncology
Over 25 years of experience in Surgical Oncology.
Dr. Sandeep Buddhiraja
Director - Clinical Directorate & Institute of Internal Med.
Over 23 years of experience in the field of Internal
Medicine
Strong consultant bench strength of 350+
across specialities :
Cardiac – 100+
Oncology – 50+
Orthopaedics – 50+
Neurosciences – 50+
Renal – 50+
MAMBS – 25+
Dr. Sunil Choudhary
Director - Max Institute of Aesthetic & Reconstructive
Surgery
Over 20 years of work experience in the field of
advanced cosmetic and re-constructive surgery.
Dr. Anurag Krishna
Director- Paediatrics & Paediatrics Surgery
Over 20 years of experience in Paediatric surgery -
complex congenital malformations
Dr. A.K. Singh
Director – Max Institute of Neurosciences, Dehradun
Renowned Neurosurgeon having 40 years experience
Recipient of the BC Roy award
Dr. Pradeep Kumar Chowbey, Padmashri
Director of Max Institute of Minimal Access, Metabolic
and Bariatric Surgery.
More than 35 yrs of experience in Lap Surgery,
completed 70K+ major Lap procedures
Dr. K. K. Talwar
Chairman - Cardiology, Max Healthcare
Clinical experience of more than 39 years
Former Head, Department of Cardiology, AIIMS
Dr. Anant Kumar
Chairman - Urology,Renal Transplant, Robotics(Max
Saket Complex) and Uro-Oncology Max Saket
2200 Kidney Transplantations in the last 25 years
and over 1500 lap donors nephrectomy

50
Rs Cr MHC Network* – Performance Dashboard (H1FY17 & FY16)
*The above results are for MHC Network of hospitals and includes results for Max Super Specialty Hospital, Saket, unit of Devki Devi Foundation, Max Super Speciality Hospital, Patparganj, unit of Balaji Medical and Diagnostic Research Centre & Saket City Hospital unit of
Gujarmal Modi Hospital & Research Centre; ^ on the basis of net revenue
Sep-16 Sep-15 Mar-16 Mar-15
a) Financial Performance
Revenue (Gross) 1,300 1,032 26% 2,181 1,744 25%
Revenue (Net) 1,248 994 26% 2,098 1,688 24%
Direct Costs
Material Cost 319 272 17% 558 468 19%
Clincian Payout 102 83 24% 169 137 23%
Contribution 827 639 29% 1,372 1,083 27%
Contribution Margin^ 66.3% 64.3% 193 bps 65.4% 64.1% 130 bps
Indirect Costs
Personnel Cost 404 319 27% 678 536 26%
Other Indirect overheads 222 173 28% 364 292 25%
HO Costs 60 50 21% 115 85 34%
EBITDA 140 97 44% 215 170 26%
EBITDA Margin^ 11.2% 9.8% 143 bps 10.2% 10.1% 10 bps
Finance Cost 70 37 88% 100 85 17%
Cash Profit 71 60 17% 115 86 35%
Depreciation 60 48 24% 105 92 15%
Profit /(loss) before tax 11 12 -12% 10 (6) 264%
b) Financial Position
Net Worth 1,108 780 42% 1,071 749 43%
Net Debt 1,078 732 47% 1,056 563 88%
Tangible Fixed Assets - Gross Block 1,985 1,257 58% 1,944 1,421 37%
Key Business Drivers Half Year Ended Y-o-Y
Growth
Year Ended Y-o-Y
Growth

51
MHC Network* – Performance Dashboard (H1FY17 & FY16)
*The above results are for MHC Network of hospitals and includes results for Max Super Specialty Hospital, Saket, unit of Devki Devi Foundation, Max Super Speciality Hospital, Patparganj, unit of Balaji Medical and Diagnostic Research Centre & Saket City Hospital unit of
Gujarmal Modi Hospital & Research Centre; ^ on the basis of net revenue
Sep-16 Sep-15 Mar-16 Mar-15
a) Patient Transactions (Nos in lacs)
Inpatient Discharges 0.99 0.78 26% 1.64 1.32 24%
Day care Procedures 0.25 0.14 79% 0.35 0.26 35%
Outpatient Footfalls 33.49 26.76 25% 55.38 44.48 25%
Total 34.73 27.68 25% 57.37 46.06 25%
b) Average Inpatient Operational Beds 2,337 1,878 24% 2,279 1,680 36%
c) Average Inpatient Occupancy 74.7% 73.3% 137 bps 71.1% 73.5% -240 bps
d) Average Length of Stay (days) 3.24 3.02 -7% 3.26 3.42 5%
e) Average Revenue/Occupied Bed Day (Rs) 40,696 43,557 -7% 40,902 38,594 6%
f) Other Operational Data
Physicians 2,571 2,283 13% 2,858 2,224 29%
Employees 8,436 6,517 29% 8,159 6,373 28%
Customer Base (in lacs) 32.9 27.0 22% 29.7 24.7 21%
Key Business Drivers Half Year Ended Y-o-Y
Growth
Year Ended Y-o-Y
Growth
52
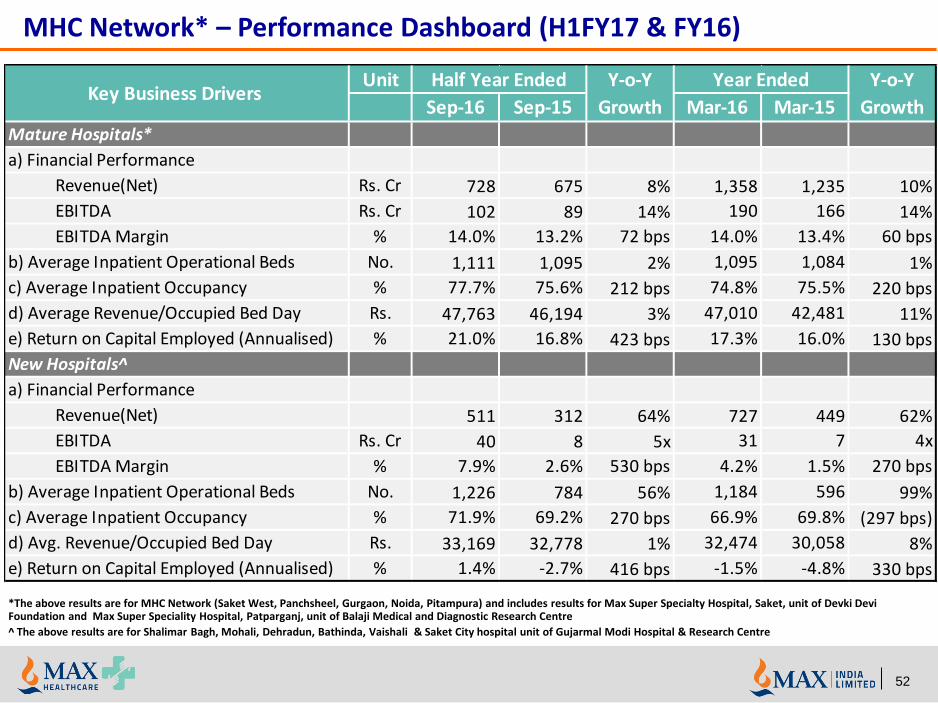
MHC Network* – Performance Dashboard (H1FY17 & FY16)
*The above results are for MHC Network (Saket West, Panchsheel, Gurgaon, Noida, Pitampura) and includes results for Max Super Specialty Hospital, Saket, unit of Devki Devi Foundation and Max Super Speciality Hospital, Patparganj, unit of Balaji Medical and Diagnostic Research Centre
^ The above results are for Shalimar Bagh, Mohali, Dehradun, Bathinda, Vaishali & Saket City hospital unit of Gujarmal Modi Hospital & Research Centre
Unit
Sep-16 Sep-15 Mar-16 Mar-15
Mature Hospitals*
a) Financial Performance
Revenue(Net) Rs. Cr 728 675 8% 1,358 1,235 10%
EBITDA Rs. Cr 102 89 14% 190 166 14%
EBITDA Margin % 14.0% 13.2% 72 bps 14.0% 13.4% 60 bps
b) Average Inpatient Operational Beds No. 1,111 1,095 2% 1,095 1,084 1%
c) Average Inpatient Occupancy % 77.7% 75.6% 212 bps 74.8% 75.5% 220 bps
d) Average Revenue/Occupied Bed Day Rs. 47,763 46,194 3% 47,010 42,481 11%
e) Return on Capital Employed (Annualised) % 21.0% 16.8% 423 bps 17.3% 16.0% 130 bps
New Hospitals^
a) Financial Performance
Revenue(Net) 511 312 64% 727 449 62%
EBITDA Rs. Cr 40 8 5x 31 7 4x
EBITDA Margin % 7.9% 2.6% 530 bps 4.2% 1.5% 270 bps
b) Average Inpatient Operational Beds No. 1,226 784 56% 1,184 596 99%
c) Average Inpatient Occupancy % 71.9% 69.2% 270 bps 66.9% 69.8% (297 bps)
d) Avg. Revenue/Occupied Bed Day Rs. 33,169 32,778 1% 32,474 30,058 8%
e) Return on Capital Employed (Annualised) % 1.4% -2.7% 416 bps -1.5% -4.8% 330 bps
Key Business Drivers Half Year Ended Y-o-Y
Growth
Year Ended Y-o-Y
Growth

MBHI - Board of Directors
53
Rajesh Sud Chairman & Director
Rahul Khosla Co-Vice Chairman & Director
Ashish Mehrotra MD & CEO
Mohit Talwar Director
• Mohit has an experience of over 30 years in Corporate Finance and Investment Banking.
• Ashish has over two decades of extensive banking experience with exposure to consumer, commercial and private client
• Rahul Khosla is the Managing Director of Max India group. He is a seasoned business leader with 30 years of experience in India & globally.
• Rajesh Sud is the CEO and Managing Director of Max Life Insurance, one of the first three private life insurers to start operations in 2001
K Narasimha Murthy Director
• Mr. Murthy entered the Profession of Cost & Management Accountancy in 1983. He is associated with the development of Cost & MIS for more than 150 companies.
Joy Linton Director
• Joy is the CFO of Bupa Plc. She has over 25 years’ experience in financial and strategic roles in Australia and the UK.
David Fletcher Co-Vice Chairman & Director
• David Fletcher joined Bupa as Chief Internal Auditor in March 2014 and has been Managing Director of Bupa International Development Markets (IDM) since Sep 2014
Pradeep Pant Director
• Pradeep is a highly experienced senior business leader, now involved in business consulting and education
John Howard Lorimer Director
• John joined Bupa's Board as a Non-Executive Director in July 2011. He is Chairman of Bupa's Audit Committee and a member of Bupa's Risk Committee and UK Regulated Entities Board.
Marielle Theron Director
• Ms.Theron is a Principal of Erlen Street Corporation, Switzerland, a company that specialises in strategic investment and management consulting solutions
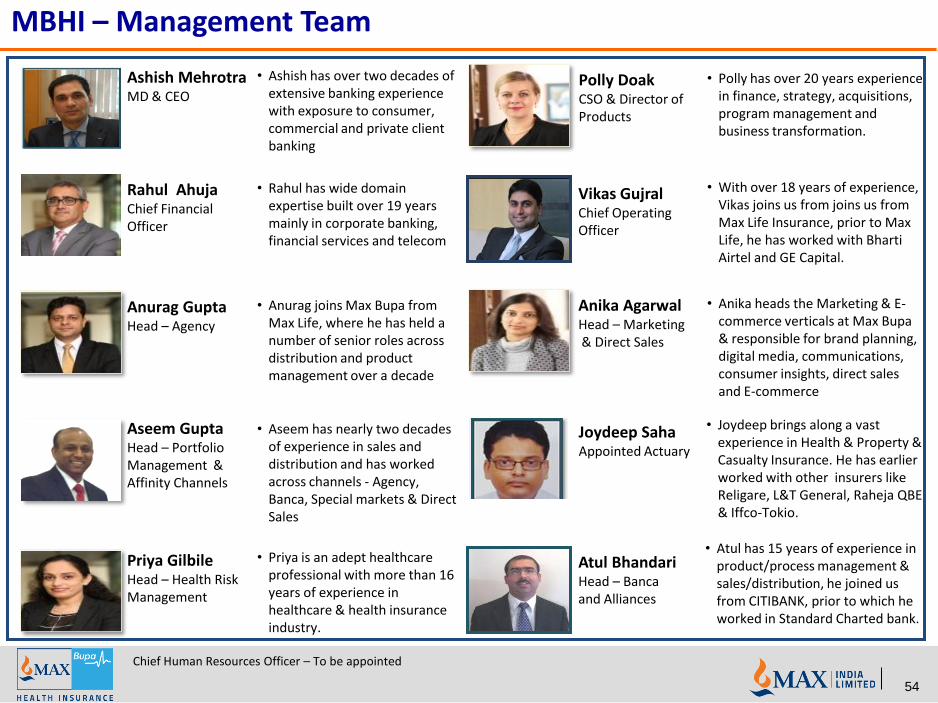
MBHI – Management Team
54
Ashish Mehrotra MD & CEO
Rahul Ahuja Chief Financial Officer
Anurag Gupta Head – Agency
Aseem Gupta Head – Portfolio Management & Affinity Channels
• Aseem has nearly two decades of experience in sales and distribution and has worked across channels - Agency, Banca, Special markets & Direct Sales
• Anurag joins Max Bupa from Max Life, where he has held a number of senior roles across distribution and product management over a decade
• Rahul has wide domain expertise built over 19 years mainly in corporate banking, financial services and telecom
• Ashish has over two decades of extensive banking experience with exposure to consumer, commercial and private client banking
Polly Doak CSO & Director of Products
• Polly has over 20 years experience in finance, strategy, acquisitions, program management and business transformation.
Priya Gilbile
Head – Health Risk Management
• Priya is an adept healthcare professional with more than 16 years of experience in healthcare & health insurance industry.
Anika Agarwal Head – Marketing & Direct Sales
• Anika heads the Marketing & E-commerce verticals at Max Bupa & responsible for brand planning, digital media, communications, consumer insights, direct sales and E-commerce
Joydeep Saha
Appointed Actuary
• Joydeep brings along a vast experience in Health & Property & Casualty Insurance. He has earlier worked with other insurers like Religare, L&T General, Raheja QBE & Iffco-Tokio.
Atul Bhandari Head – Banca and Alliances
• Atul has 15 years of experience in product/process management & sales/distribution, he joined us from CITIBANK, prior to which he worked in Standard Charted bank.
Vikas Gujral Chief Operating Officer
• With over 18 years of experience, Vikas joins us from joins us from Max Life Insurance, prior to Max Life, he has worked with Bharti Airtel and GE Capital.
Chief Human Resources Officer – To be appointed

Max Bupa – Performance Dashboard (H1FY17 & FY16)
55
^ Higher Net Earned premium and PBT due to change in Unearned premium accounting from 1/365 method to 50% of net written
premium
Sep-16 Sep-15 Mar-16 Mar-15
a) Gross written premium income
First year premium 92 81 13% 180 145 24%
Renewal premium 168 130 29% 296 228 30%
Total 260 212 23% 476 373 28%
b) Net Earned Premium^ 260 184 41% 393 315 24%
c) Net Loss^ 18 (40) 144% (68)* (93) 30%
d) Claim Ratio(B2C Segment, normalized) 57% 61% 7% 56%** 50% -600 bps
e) Avg. premium realization per life (B2C) 6,937 6,816 2% 6,800 6,364 7%
f) Conservation ratio (B2C Segment) 84% 81% 4% 83% 81% 200 bps
g) Lives In force in millions (including RSBY) 2.2 1.9 2.1 1.8 11%
h) Number of agents 14,705 11,717 12,581 8,909 41%
i) Paid up Capital 926 831 898 791 14%
Key Business Drivers Half Year Ended Y-o-Y
Growth
Year Ended Y-o-Y
Growth
*Net Loss before one off items Rs 66 Cr
**Adjusted for abnormal past claims for the previous year amounting to Rs. 7 Cr., settled in the current year
Rs Cr

MAX INDIA LTD. Max House, Okhla, New Delhi – 110 020
Phone: +91 11 26933601-10 Fax: +91 11 26933619
Website: www.maxindia.com