may 2008 menu labeling as a potential strategy for
TRANSCRIPT

Mandated posting of calorie information on menus and menu boards at fast food and other large chain restaurants has garnered growing public and legislative support as a potential strategy for addressing the obesity epidemic. However, no studies to our knowledge have sought to quantify the potential impact of this strategy on the epidemic. To address this gap, we conducted a health impact assessment of menu labeling, as proposed in California’s Senate Bill 120 in 2007 and in the current Senate Bill 1420, on the obesity epidemic in Los Angeles County.
Data on population weight gain from the California Department of Education Physical Fitness Testing Program and the Los Angeles County Health Survey were used to quantify the obesity epidemic in Los Angeles County. Additional data to estimate the number of meals served annually at large chain restaurants in the county, the percentage of restaurant patrons that would order reduced calorie meals as a result of menu labeling, and the amount of calorie reductions that would result from patron response to calorie postings were examined using published and unpublished data sources. Multiple scenarios of restaurant patron response to calorie postings were examined to estimate a plausible range of impacts of menu labeling on the obesity epidemic.
Using conservative assumptions that calorie postings would result in 10% of large chain restaurant patrons ordering reduced calorie meals, with an average reduction of 100 calories per meal, and no compensatory increase in other food consumption, menu labeling would avert 38.9% of the 6.75 million pound average annual weight gain in the county population aged 5 years and older. Substantially larger impacts would be realized if higher percentages of restaurant patrons ordered reduced calorie meals or average per meal calorie reductions increased. These findings suggest that mandated menu labeling at fast food and other large chain restaurants could have a sizable salutary impact on the obesity epidemic, even with only modest changes in consumer behavior.
Menu Labeling as a Potential Strategy for Combating the Obesity Epidemic A Health Impact AssessmentPaul Simon, Christopher J. Jarosz, Tony Kuo, and Jonathan E. Fielding
What is a Health Impact Assessment?
A health impact assessment is a combination of procedures, methods, and tools by which a policy, program, or project may be judged in terms of its potential effects on the health of a population, and the distribution of those effects within the population.†
† Health Impact Assessment: Main Concepts and Suggested Approach. Brussels, Belgium: European Centre for Health Policy. World Health Organization Regional Office for Europe: 1999. Gothenburg Consensus Paper. Available at : http://www.euro.who.int/document/PAE/Gothenburgpaper.pdf. Accessed March 25, 2008.
May 2008
Executive Summary

Menu Labeling: Health Impact Assessment
The obesity epidemic constitutes one of the most significant public health threats facing Los Angeles County and the nation. Adults who are obese are at increased risk for a variety of chronic health conditions, including type 2 diabetes, hypertension, heart disease, stroke, arthritis, fatty liver disease, gallbladder disease, sleep apnea, and some forms of cancer (e.g., breast, uterine, and colon).
Children who are obese have a much greater likelihood of being obese as adults. Obesity during childhood may lead to more immediate adverse health effects, including hypertension, high blood cholesterol levels, type 2 diabetes, insulin resistance (a precursor of type 2 diabetes), orthopedic problems, liver damage, sleep apnea, and asthma. Children who are obese are also more likely than their non-obese counterparts to be the target of stigmatization and discrimination, and to suffer from low self-esteem and depression.
The obesity epidemic also exerts an enormous economic burden. Between 1987 and 2001, the rising obesity rate and related medical conditions accounted for more than one-quarter of the growth in health care spending in the United States.1 In addition, lost productivity costs attributable to obesity have been estimated to be even greater than health care costs.2 Together, these costs are likely to rise at an escalating rate over the next generation as the swelling ranks of obese children reach adulthood and begin developing obesity-related diseases at progressively younger ages.
While the underlying cause of the obesity epidemic appears to be straightforward — a chronic excess of
calories consumed versus calories burned among a large percentage of the population — identifying effective strategies and interventions to address the epidemic has been frustratingly difficult. This difficulty reflects to a large degree the complex array of individual, family, community, and societal factors that powerfully influence people’s dietary practices and levels of physical activity. Given this complexity, it is clear that success in reversing the epidemic will require a broad range of interventions operating at multiple levels and involving multiple segments of society.
One area of recent interest as a potential strategy to
reduce the obesity epidemic is the provision of calorie information on restaurant menus and menu boards at fast food and full-service chain restaurants. This interest is based on several considerations. First, the trajectory of the obesity epidemic in the U.S. has been remarkably similar to the growth in consumption of restaurant foods over the past several decades.3, 4 Second, during this period, super-sizing of food and beverage portions at restaurants has become widespread and, unlike the mandated calorie and other nutrition information provided on packaged food products, such information is not generally available at the point of purchase in restaurants. While some restaurant chains provide this information on Web sites and brochures, it is unlikely that the vast majority of consumers would access this information prior to their menu item selections.
Third, studies have shown that most people, including nutritionists, greatly underestimate the caloric content of restaurant menu items and, therefore, could benefit from having readily accessible information on
Introduction
the calorie content of menu items.5, 6
Despite the growing interest in menu labeling and the passage of menu labeling ordinances in some jurisdictions (e.g., New York City, Seattle, and San Francisco), no studies to our knowledge have sought to quantify the potential impact of this strategy on the obesity epidemic. To address this gap, we conducted a health impact assessment of menu labeling, as proposed in California’s Senate Bill 120 in 2007 and in the current Senate Bill 1420 (2008), to estimate a plausible range of impacts this strategy would have on the obesity epidemic in Los Angeles County. Both bills require that restaurant chains with 15 or more outlets across the state post calorie and other nutrition information next to each item on the menu. For menu boards, only calorie information is required to be posted. The 2007 bill was approved by the state legislature but vetoed by the Governor, and the 2008 bill is currently under consideration by the legislature.
Methods
Quantifying the magnitude of the obesity epidemic in Los Angeles County
The obesity epidemic among adults (>18 years old) in Los Angeles County was quantified using data from the 1997 and 2005 Los Angeles County Health Surveys. The two surveys collected health data, including self-reported height and weight, on a random sample of 8,004 and 8,648 adults, respectively, through a structured telephone interview. The response rate for each survey was 52% and 47%, respectively. The data were weighted to reflect the demographic characteristics of the county’s adult population using census-based population estimates.
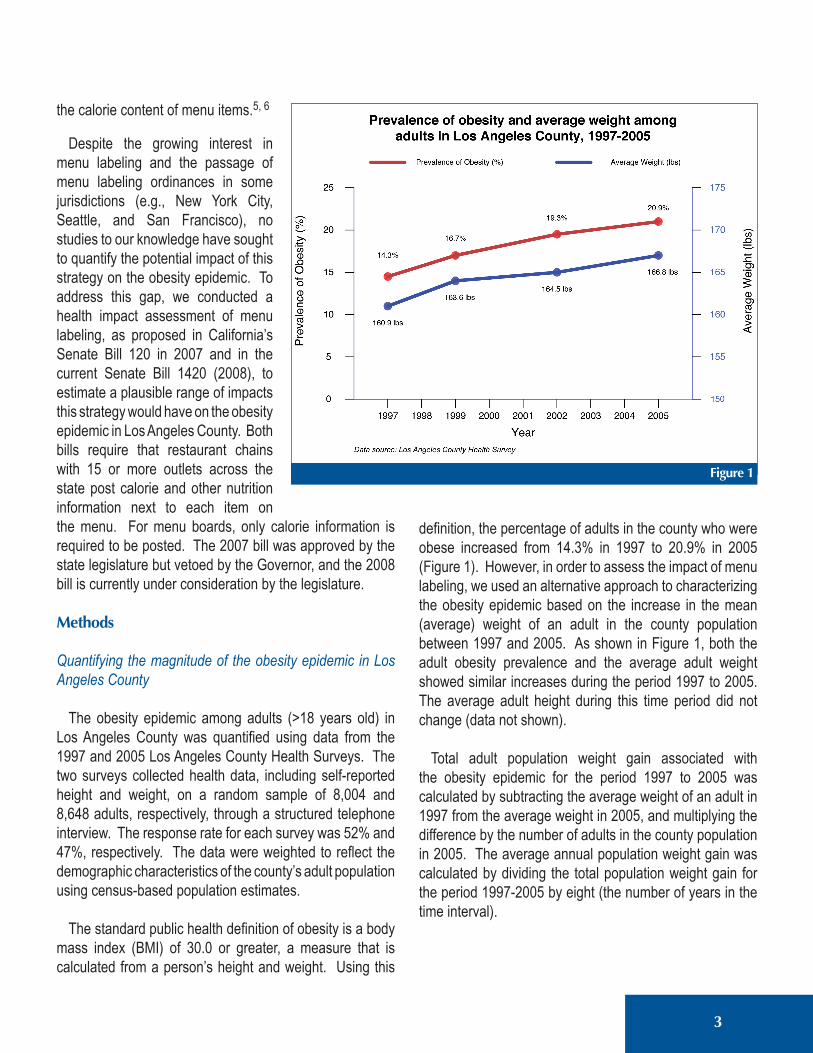
The standard public health definition of obesity is a body mass index (BMI) of 30.0 or greater, a measure that is calculated from a person’s height and weight. Using this
definition, the percentage of adults in the county who were obese increased from 14.3% in 1997 to 20.9% in 2005 (Figure 1). However, in order to assess the impact of menu labeling, we used an alternative approach to characterizing the obesity epidemic based on the increase in the mean (average) weight of an adult in the county population between 1997 and 2005. As shown in Figure 1, both the adult obesity prevalence and the average adult weight showed similar increases during the period 1997 to 2005. The average adult height during this time period did not change (data not shown).
Total adult population weight gain associated with the obesity epidemic for the period 1997 to 2005 was calculated by subtracting the average weight of an adult in 1997 from the average weight in 2005, and multiplying the difference by the number of adults in the county population in 2005. The average annual population weight gain was calculated by dividing the total population weight gain for the period 1997-2005 by eight (the number of years in the time interval).
3
Menu Labeling: Health Impact Assessment
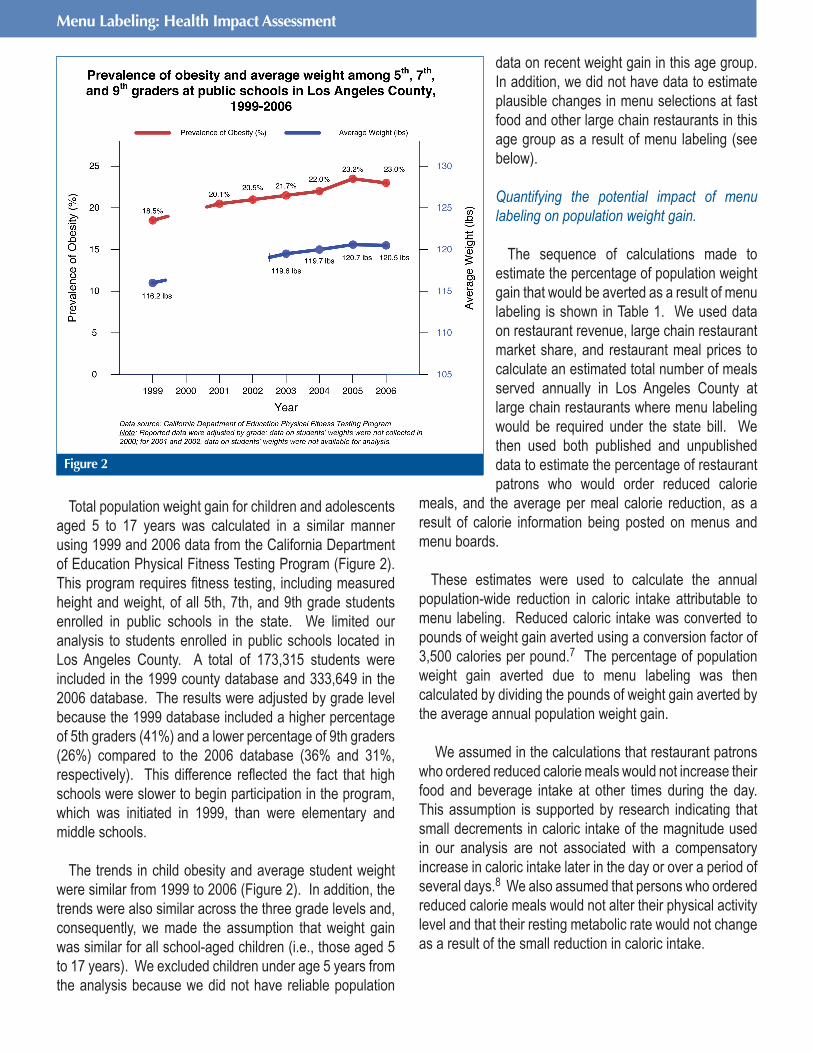
Total population weight gain for children and adolescents aged 5 to 17 years was calculated in a similar manner using 1999 and 2006 data from the California Department of Education Physical Fitness Testing Program (Figure 2). This program requires fitness testing, including measured height and weight, of all 5th, 7th, and 9th grade students enrolled in public schools in the state. We limited our analysis to students enrolled in public schools located in Los Angeles County. A total of 173,315 students were included in the 1999 county database and 333,649 in the 2006 database. The results were adjusted by grade level because the 1999 database included a higher percentage of 5th graders (41%) and a lower percentage of 9th graders (26%) compared to the 2006 database (36% and 31%, respectively). This difference reflected the fact that high schools were slower to begin participation in the program, which was initiated in 1999, than were elementary and middle schools.
The trends in child obesity and average student weight were similar from 1999 to 2006 (Figure 2). In addition, the trends were also similar across the three grade levels and, consequently, we made the assumption that weight gain was similar for all school-aged children (i.e., those aged 5 to 17 years). We excluded children under age 5 years from the analysis because we did not have reliable population
data on recent weight gain in this age group. In addition, we did not have data to estimate plausible changes in menu selections at fast food and other large chain restaurants in this age group as a result of menu labeling (see below).
Quantifying the potential impact of menu labeling on population weight gain.
The sequence of calculations made to estimate the percentage of population weight gain that would be averted as a result of menu labeling is shown in Table 1. We used data on restaurant revenue, large chain restaurant market share, and restaurant meal prices to calculate an estimated total number of meals served annually in Los Angeles County at large chain restaurants where menu labeling would be required under the state bill. We then used both published and unpublished data to estimate the percentage of restaurant patrons who would order reduced calorie
meals, and the average per meal calorie reduction, as a result of calorie information being posted on menus and menu boards.
These estimates were used to calculate the annual population-wide reduction in caloric intake attributable to menu labeling. Reduced caloric intake was converted to pounds of weight gain averted using a conversion factor of 3,500 calories per pound.7 The percentage of population weight gain averted due to menu labeling was then calculated by dividing the pounds of weight gain averted by the average annual population weight gain.
We assumed in the calculations that restaurant patrons who ordered reduced calorie meals would not increase their food and beverage intake at other times during the day. This assumption is supported by research indicating that small decrements in caloric intake of the magnitude used in our analysis are not associated with a compensatory increase in caloric intake later in the day or over a period of several days.8 We also assumed that persons who ordered reduced calorie meals would not alter their physical activity level and that their resting metabolic rate would not change as a result of the small reduction in caloric intake.
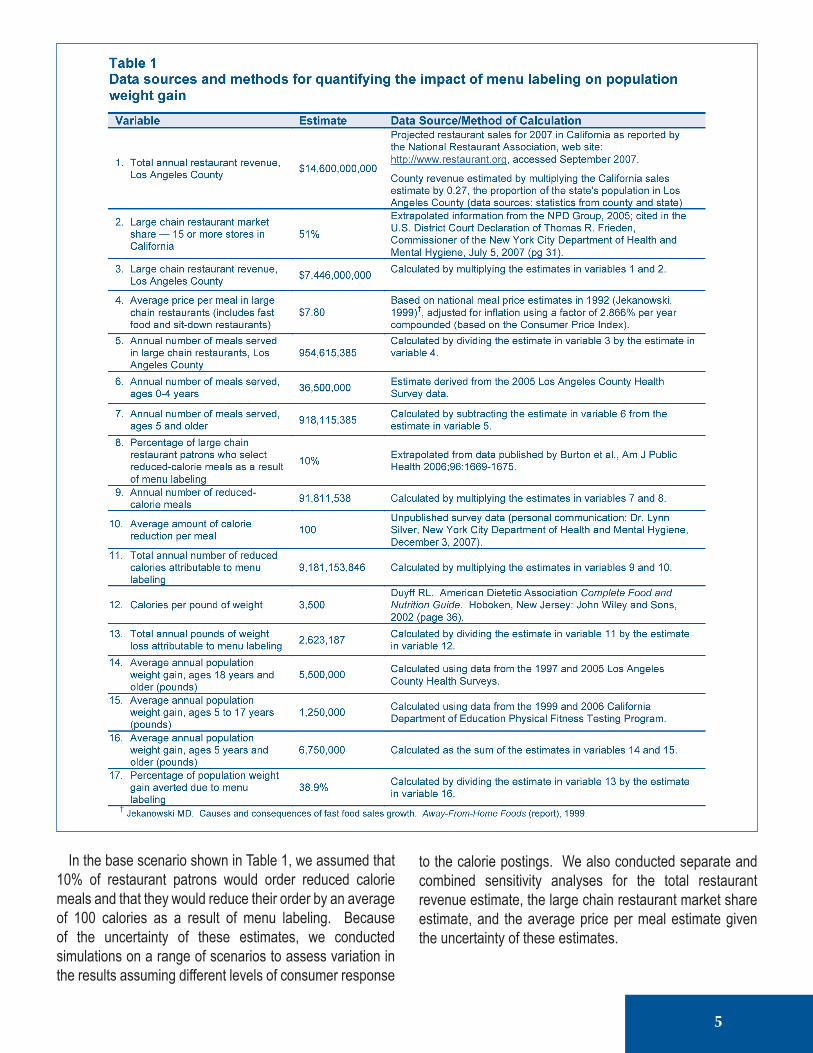
In the base scenario shown in Table 1, we assumed that 10% of restaurant patrons would order reduced calorie meals and that they would reduce their order by an average of 100 calories as a result of menu labeling. Because of the uncertainty of these estimates, we conducted simulations on a range of scenarios to assess variation in the results assuming different levels of consumer response
to the calorie postings. We also conducted separate and combined sensitivity analyses for the total restaurant revenue estimate, the large chain restaurant market share estimate, and the average price per meal estimate given the uncertainty of these estimates.
5
Menu Labeling: Health Impact Assessment
Results
Among those 5 years of age and older, the average annual population weight gain associated with the recent obesity epidemic in the county was 6.75 million pounds (Table 1). This estimate was based on an average annual population weight gain of 5.50 million pounds among adults 18 years and older during the period 1997-2005, and an average annual population weight gain of 1.25 million pounds among children aged 5-17 years during the period 1999-2006.
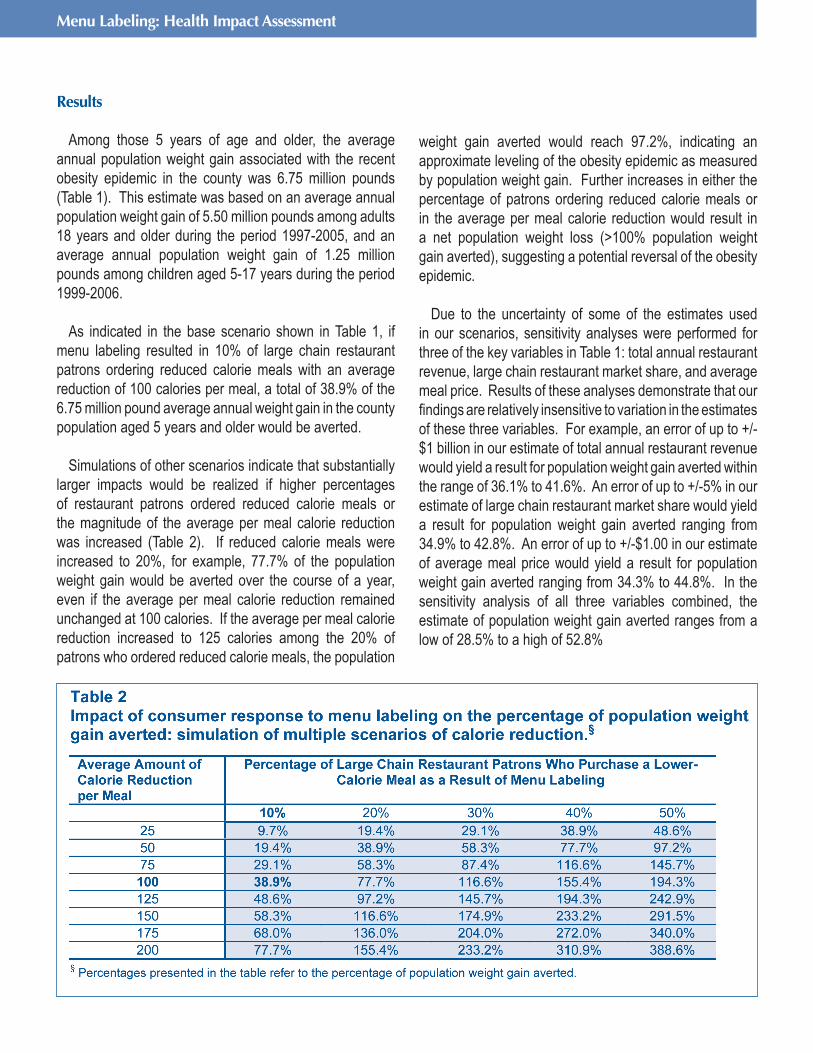
As indicated in the base scenario shown in Table 1, if menu labeling resulted in 10% of large chain restaurant patrons ordering reduced calorie meals with an average reduction of 100 calories per meal, a total of 38.9% of the 6.75 million pound average annual weight gain in the county population aged 5 years and older would be averted.
Simulations of other scenarios indicate that substantially
larger impacts would be realized if higher percentages of restaurant patrons ordered reduced calorie meals or the magnitude of the average per meal calorie reduction was increased (Table 2). If reduced calorie meals were increased to 20%, for example, 77.7% of the population weight gain would be averted over the course of a year, even if the average per meal calorie reduction remained unchanged at 100 calories. If the average per meal calorie reduction increased to 125 calories among the 20% of patrons who ordered reduced calorie meals, the population
weight gain averted would reach 97.2%, indicating an approximate leveling of the obesity epidemic as measured by population weight gain. Further increases in either the percentage of patrons ordering reduced calorie meals or in the average per meal calorie reduction would result in a net population weight loss (>100% population weight gain averted), suggesting a potential reversal of the obesity epidemic.
Due to the uncertainty of some of the estimates used in our scenarios, sensitivity analyses were performed for three of the key variables in Table 1: total annual restaurant revenue, large chain restaurant market share, and average meal price. Results of these analyses demonstrate that our findings are relatively insensitive to variation in the estimates of these three variables. For example, an error of up to +/-$1 billion in our estimate of total annual restaurant revenue would yield a result for population weight gain averted within the range of 36.1% to 41.6%. An error of up to +/-5% in our estimate of large chain restaurant market share would yield a result for population weight gain averted ranging from 34.9% to 42.8%. An error of up to +/-$1.00 in our estimate of average meal price would yield a result for population weight gain averted ranging from 34.3% to 44.8%. In the sensitivity analysis of all three variables combined, the estimate of population weight gain averted ranges from a low of 28.5% to a high of 52.8%
7
Discussion
The results suggest that mandated menu labeling at fast food and other large chain restaurants could reduce population weight gain, even with only modest changes in consumer behavior. In addition, simulations of a range of scenarios suggest that the impact on population weight gain could be greatly enhanced if community education efforts, pricing incentives or other strategies were undertaken to increase the degree to which restaurant patrons use the posted information to select reduced calorie meals.
A limitation of our analysis is that we were unable to assess the effect of menu labeling on the obesity epidemic directly (i.e., its impact on the rising rate of obesity) but, rather, estimated its effect using population weight gain averted as an alternative measure. Although we showed that the recent trends in the obesity rate and average body weight were similar, we cannot be sure that the impact of menu labeling would be identical across the two measures. For example, if obese restaurant patrons were more likely than non-obese patrons to order reduced calorie meals, the impact of menu labeling on the obesity rate could be greater than what we reported for population weight gain averted. Alternatively, if non-obese restaurant patrons were more likely to order reduced calorie meals than obese patrons, the impact on the obesity rate could be less than what we reported. Further research is needed to assess the effects of menu labeling.
The analysis was further limited by the lack of county-specific data on restaurant revenues, large chain restaurant market share, and average meal price. However, the sensitivity analyses we conducted suggest that our results were relatively insensitive to these variables and, therefore, any small to modest error in the estimates we used are unlikely to have led to major error in our findings.
Finally, we had only limited data on the degree to which menu labeling would influence the menu item selections of restaurant patrons. For this reason, we provided a range of estimates, assuming varying levels of change in consumer behavior that could be very easily achieved. For example, based on a composite of calorie information from three fast-food restaurant chains, changing from a double meat patty
to a single meat patty hamburger would save 244 calories, from a large to a medium order of french fries would save 163 calories or from a large to medium soft drink would save 95 calories. Our findings suggest that, even with only modest changes like these, the impact of menu labeling on population weight gain could be substantial.
References
1. Thorpe KE, Florence CS, Howard DH, Joski P. The impact of obesity on rising medical spending. Health Affairs 2004: W480-W486 (published online 20 October 2004; 10.1377/hlthaff.W.480).
2. Sugarman SB, et al. The Economic Costs of Physical Inactivity, Obesity, and Overweight in California Adults: Health Care, Workers’ Compensation, and Lost Productivity. California Department of Health Services, April, 2005.
3. Nielsen SJ, Siega-Riz AM, Popkin BM. Trends in energy intake in U.S. between 1977 and 1996: similar shifts seen across age groups. Obesity Res 2002;10:370-378.
4. St-Onge MP, Keller KL, Heymsfield SB. Changes in childhood food consumption patterns: a cause for concern in light of increasing body weights. Am J Clin Nutr 2003;78:1068-1073.
5. Burton S, Creyer EH, Kees J, Huggins. Attacking the obesity epidemic: the potential health benefits of providing nutrition information in restaurants. Am J Public Health 2006;96:1669-1675.
6. Backstrand J, Wootan MG, Young LR, Hurley J. Fat Chance. Washington, DC: Center for Science in the Public Interest, 1997.
7. Duyff RL. American Dietetic Association Complete Food and Nutrition Guide. Hoboken, New Jersey: John Wiley and Sons, 2002 (page 36).
8. Levitsky DA. The non-regulation of food intake in humans: hope for reversing the epidemic of obesity. Physiology and Behav 2005;86:623-632.

Author InformationPaul Simon, MD, MPHDirector
Division of Chronic Disease and Injury Prevention
Christopher J. Jarosz, PhD, MSCS Research Analyst, Physical Activity
and Senior Health Programs
Tony Kuo, MD, MSHS Director, Office of Senior Health
Jonathan E. Fielding, MD, MPH, MBADirector and Health Officer
Los Angeles County Department of Public Health
AcknowledgementsThe authors appreciate the valuable contributions of Public Health Department staff and reviewers: D. Mike Jackson, Rose Anne Rodriguez, Rachel Tyree, Jean Tremaine, Elan Shultz, Doreen Keough,Amy Lightstone, and Margaret Shih.
Suggested CitationSimon P, Jarosz CJ, Kuo T, Fielding JE. Menu Labeling as a Potential Strategy for Combating the Obesity Epidemic: A Health Impact Assessment. Los Angeles County Department of Public Health, 2008.
Contact InformationPaul Simon, MD, MPHDirectorDivision of Chronic Disease and Injury Prevention
Los Angeles County Department of Public Health
3530 Wilshire Blvd, 8th FloorLos Angeles, California 90010(213) [email protected]