may 2019 investors presentation
TRANSCRIPT

Investors PresentationMay 2019

2
Forward Looking StatementsCautionary Statement Regarding
his presentation includes statements that constitute forward-lookingstatements within the meaning of safe harbor provisions of the PrivateSecurities Litigation Reform Act of 1995 relating to future events or our
future performance, such as statements regarding, but are not limited to,anticipated growth opportunities and projections about our business and itsfuture revenues, expenses and profitability. Forward-looking statementsinvolve known and unknown risks, uncertainties and other factors that maycause our actual results, levels of activity, performance or achievements to bematerially different from any future results, levels of activity, performance orachievements expressed or implied in those forward- looking statements. Youshould not place undue reliance on forward-looking statements since theyinvolve known and unknown risks, uncertainties and other factors which are insome cases beyond our control. Factors that may affect our results,performance, circumstances or achievements include, but are not limited tothe following: our dependency on three product lines; our dependency on asmall number of large customers and small number of suppliers; the highlycyclical and competitive nature of the markets we target and we operate in;our inability to reduce spending during a slowdown in the semiconductorindustry; our ability to respond effectively on a timely basis to rapidtechnological changes;; our dependency on PEMs; risks related to exclusivityobligations and non-limited liability that may be included in our commercialagreements and arrangements; our ability to retain our competitive positiondespite the ongoing consolidation in our industry; risks related to ourdependence on our manufacturing facilities; risks related to changes in ourorder backlog; risks related to efforts to complete and integrate current and/orfuture acquisitions; risks related to the worldwide financial instabilities; risksrelated to our intellectual property; new product offerings from ourcompetitors; unanticipated manufacturing or supply problems; risks related to
government programs we participate in; risks related to taxation; changes incustomer demand for our products; risks related to currency fluctuations; risksrelated to technology security threats and changes in privacy laws; risksrelated to acquisitions we may pursue and risks related to our operations inIsrael. We cannot guarantee future results, levels of activity, performance orachievements. The matters discussed in this presentation also involve risksand uncertainties summarized under the heading “Risk Factors” in Nova’smost recent Annual Report on Form 20-F for the year ended December 31,2018 filed with the Securities and Exchange Commission on February 28,2019. These factors are updated from time to time through the filing ofreports and registration statements with the Securities and ExchangeCommission. Any forward-looking statements contained in this presentationare made as of the presentation date and Nova Measuring Instruments Ltd. isunder no obligation to revise or update these forward-looking statements.This following presentation includes financial measures that are not calculatedin accordance with generally accepted accounting principles (GAAP). Thepresentation of this non-GAAP financial information is not intended to beconsidered in isolation or as a substitute for the financial information preparedand presented in accordance with GAAP. Nova's earning release, including apresentation of the most directly comparable financial measures calculatedand presented in accordance with GAAP and a reconciliation of each GAAP tonon-GAAP financial measure discussed in the presentation is available at theInvestors section of the company’s website.Certain of the information contained herein concerning economic trends andperformance is based upon or derived from information provided by thirdparty consultants and other industry sources. We have not independentlyverified and cannot assure the accuracy of any data obtained by or from thesesources.

KEYFactsLeading
Metrology
Innovator for
Advanced
Process Insight
DUAL-LISTED
EMPLOYEES
GLOBAL PRESENCE
TECHNOLOGIES
METROLOGY
R&D SITES
PROFITABLE GROWTH
NASDAQ / TASE
660
World wide offices
Optical & X-Ray
Dimensions & Materials
USA & Israel
Revenue Growth5Y CAGR – 18%
Operating Income Growth5Y CAGR – 37%
Cash Reserves~$190M
• Non-GAAP Financials
3

Success Tied to
Customers’ partnershipDiversified Portfolio
Disruptive technologies Solid financial model
X-ray & Optical
Dimensions & Materials
Coupling SW & HW
Emerging Metrology needs
Operational efficiency
Growth by investment
Development to Manufacturing
Joint development programs
Revenue
Operatingexpenses
Operatingincome
$112
$149
$251
2013 2015 2018
$45
$59
$79
2013 2015 2018
$14$22
$68
2013 2015 2018
In Million $
In Million $
In Million $
• Non-GAAP Financials4

$121
$149$164
$222
$251
2014 2015 2016 2017 2018
Record High
18% CAGR 5 Years
Q1 2019 Highlights
In Million $
• Non-GAAP Financials5
Revenues of $57M
Gross Margin 57%
Elevated R&D Investment
towards new products
introduction
Operating Margin 20%
Balanced Market Exposure
50% Foundry, 50% Memory

Innovative
Optical / X-Ray Semiconductor Segments
Dimensions / MaterialsParameters
10umPad
5nmPitch
0.5ÅPrecision
300mmWafer
6

Unique Complementary
SoftwarePhysical &Mathematical Models
Fleet Management
Hybrid Ecosystem
DimensionalIntegrated & Standalone
Optical CD
Film Thickness
MaterialsStandalone
Materials Metrology
ServicesInstall Base
Features and Upgrades
7

InterlacingHW & SWsolutions
CMP
Deposition ETCH
Lithography
FLEET MANAGEMENT
Hybrid Metrology
Physical Models
NOVA MARSComplementary Models
NOVA Fit
Inline
Monitor
Train & Retrain
Open Eco System
8

DigitalSemi Market
Wafer Capacity
2000 2010 2020 2025Internet Mobile Internet Connected World Data Economy
Connectivity Mobility Productivity Veracity
2017
60B GB 40% Human
9

Multi Catalysts for Semiconductors Demand
SmartCities
25%CAGR
SmartSensors
30%CAGR
AI
50%CAGR
Cryptonomy
30%CAGR
SmartIndustry
1 PBPer day
AutonomousVehicle
4 TBPer Car
Per Day
AR / VR
70%CAGR
10

GROWING Demand for Data Management & Computing Power
Data Management
Network Infrastructure
Beyond Capacity
Connected Sensors
SemiGrowth
Smart Sensors
Smart Industry
Smart City
Automotive
AIAR / VR
5GCloud
Cryptonomy Smartphones
Wearables RobotsContinuous demand for improvementPerformance Density Scaling Cost
Mobile Devices
11

Requirement Variety
Density
Scaling
storage (capacity)
Energy efficiency
Access speed
Powerful processing (speed)
10,000
100
1
0,01
0,0001
1,000
100
1
0,01
0,000
0,0001 0,01 1 100 10,000
PO
WER
(W
att
)
DA
TA S
TOR
AG
E (G
iga
by
te)
DATA RATE (Giga operations/sec)
HIGH PREFORMANCE
MOBILITY
IoT SENSORS
12

Growth Beyond DemandM
etr
olo
gy In
ten
sity
Complexity
Planar FinFet Nano-Wires
Planar NAND VNAND Gen-1 VNAND Gen-x
DRAM Gen-1 DRAM Gen-X DRAM Gen-Y
METROLOGY INTENSITY
Scaled Devices
3D Profiles
Multiple Parameters
Thinner Films
13

Composition
Stress
Strain
Doping
Chemical State
Unique Differentiation
Parameters Variety
Expanded TAM
Reduce Leakage & Increase performance
Beyond Architectural Changes
48 Elements
26 Elements
13 Elements
14

Enabled by Materials
CHALLENGES
TECHNOLOGYFuture NVM
MRAM
Xpoint
RRAM
FeRAM
Floating Gate
BEYOND TRADITIONAL DIMENSIONAL SCALING15
EnduranceHigh Program VMLC
Cross talkCharge stabilityTLC
Charge densityBit densityTLC
Bit DensityTLC
Bit DensityChannel resistanceQLC
Planar Floating
Gate NAND
High K Blocking Oxide
Doped Floating Gate
Tunnel oxides
Charge Trap layers
ALD gate
Staircase etch
Tunnel Oxides
Charge Trap Layers
ALD gate
Carbon Hard Masks
Tunnel Oxides
Charge Trap Layers
ALD gate
Barrier metal
Next-gen hard mask
METROLOGY
Needs

Low Voltages Fast clock cycles
Multiple Low VTOff state leakage Low drive currentElectro migration fails
Low VT StabilityShort channel failsOff state leakage
Drive CurrentSD resistance
Poly SiON Gate Stack
Strained Silicon
High K Metal Gate
Strained Silicon
B doping
Cobalt EM capping
FinFets
Replacement HKMG
Annealed HK
Gate dopants
Cobalt Contacts
Advanced ALD
Future Designs
Gate All Around
3D Transistors
CFETS
Enabled by Materials
Metrology
Needs
CHALLENGES
TECHNOLOGY
BEYOND TRADITIONAL DIMENSIONAL SCALING16

FromNova200 to
300Reaching revenues
of $300M organically
ShareGains
TAM Expansion
Disruptive Innovation
M&A
Dimensional
Metrology
Services M&AMaterials
Metrology
$300M
$200M
$100M
Inorganic
Process Control > $50M
Organic
$300M
2012 2017 Target
17

Customers
Segments
Mix Nodes
Technology
Geography
Increasing Market Share while Expanding TAM
Diversification
Why do we CONTINUE GROWING?
18

Diversification -Product Revenues Customer Mix
Target Model
5 Large Customers
Additional Memory
Customers
IDM Penetration
TSMC
40%
GLOBAL
FOUNDRIES
25% Other
35%
2014
Foundry Exposure2 major customers
TSMC
15%
SAMSUNG
15%
HYNIX
20%
HUALI
10%
Other
30%
Micron
10%
2018
Memory Growth5 major customers
19

Diversification -
2014 2018
Segment Mix
Memory versus foundry / Logic
Target Model
Segments Balance
Memory Growth
Foundry leadership
• Non-GAAP Financials
20
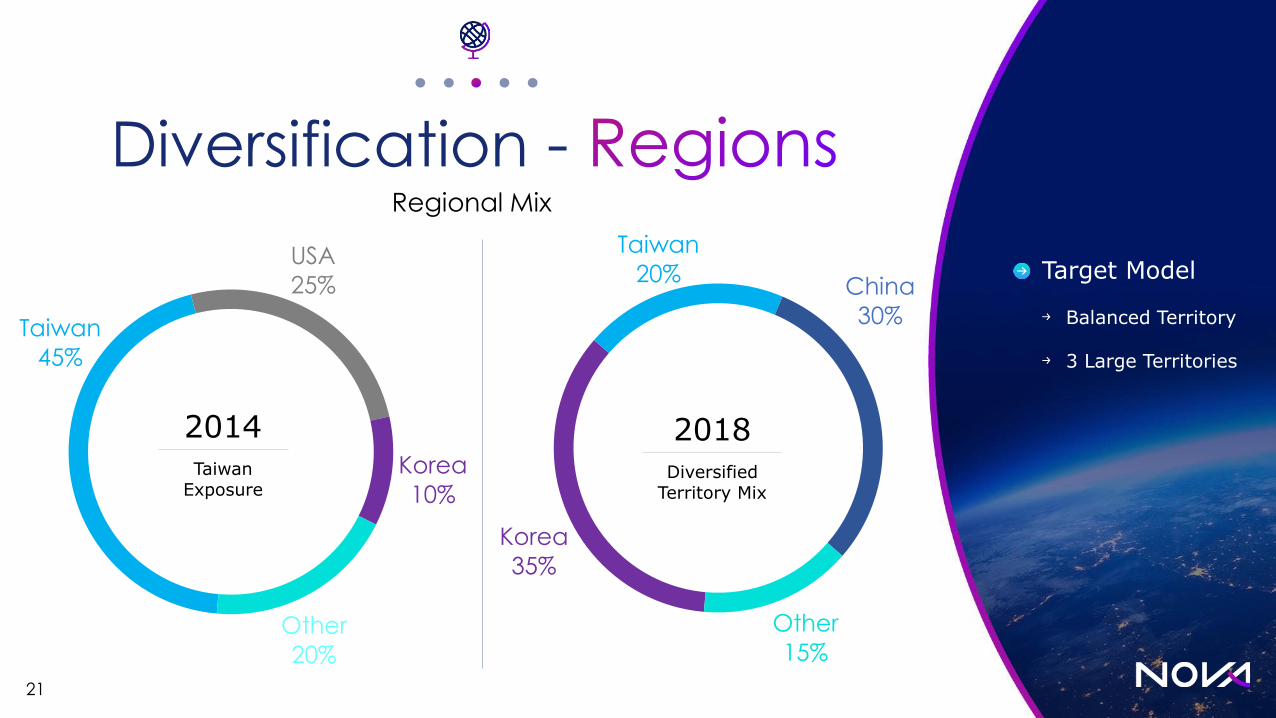
Diversification -
Target Model
Balanced Territory
3 Large Territories
Regional Mix
Taiwan
45%
USA
25%
Korea
10%
Other
20%
2014
TaiwanExposure
Korea
35%
Taiwan
20%China
30%
Other
15%
2018
DiversifiedTerritory Mix
21

Diversification -
18%
28% 27%
2016 2017 2018
$34$38
$44
2016 2017 2018
R&D Investment(in Million $)
Operating Margin
From single tool to Fleet approach -infrastructure
Invest in Sustainingand Disruptiveinnovation
Compete with unique Coupled HW & SW solutions
lead the Emerging Metrology markets
X-RAY OPTICAL CONVOLUTION
ADVANCED SW CAPABILITIES
LAB TO FAB TECHNOLOGIES
MTROLOGY ECOSYSTEM
MATERIALS ENGINEERING
22
• Non-GAAP Financials

Advanced Nodes - 56%
Nova Performance by Tech-Node$M
2014 2018
MIX nodesTrailing & Advanced
Diversification –
23

Share in Growing Markets
Unique Value
Displacing OtherTechnologies
Emerging Applications
Disruptive Innovation
Addressable Market(In Million $)
Market Share
Expanding TAM Gaining Market Share
$1,200
2014 2017 $300M
model
25%
2014 2017 $300M
model
>
24

2014 2016 2018
Revenue($M)
Operating Profit($M)
Earnings PerShare ($)
2014 2016 2018 2014 2016 2018
25
• Non-GAAP Financials

5 Years CAGR (2013-2018)
• Non-GAAP Financials
5 Years Growth
Achieved 3X CAGR
over Process Control
Grew operating
income at 2X
Revenue CAGR
Generated ~$150M
in Free Cash Flow
Process Control Nova Revenue Nova Op Inc
26

& Operating Margins
2014 2018
Gross Margin (%) Operating Margin(%)
Nova 300 Model Nova300 Model
2014 2018
27• Non-GAAP Financials

Solid Track RecordRevenue Growth $M
Revenue Doubled
Every 5 Years
Expanded technology
base driving TAM increase
Diversified revenue
stream driving wider
market exposure
Solid operational model to
support investment
$20
$58
$96
$222
2002 2007 2012 2017
28
