may. 2020. vol. 16, no.1 issn 2311-2484 international
TRANSCRIPT

May. 2020. Vol. 16, No.1 ISSN 2311-2484
International Journal of Research In Earth & Environmental Sciences © 2013-2020 IJREES & K.A.J. All rights reserved www.ijsk.org/ijrees
1
Flood Vulnerability, Land Use Relationship and Topographic Information
Assessment in Ibadan Metropolis, Oyo State, Southwest Nigeria 1Adewuyi Gbola Kehinde*, 2Adejumo Saheed Adesanjo, 3Ajibade Oludare S
1 & 3 Department of Surveying and Geoinformatics, Faculty of Environmental Studies 2 Department of Geology, Faculty of Science
The Polytechnic Ibadan, Oyo State, Nigeria
*E-mail: [email protected]
ABSTRACT
This study assesses the flood vulnerability, land use relationship and topographic information of the Ibadan
metropolis consisting of eleven local Government areas namely; Ibadan North, Ibadan North East, Ibadan North
West, Ibadan South East, Ibadan South West, Akinyele, Egbeda, Ido, Lagelu, Ona-Ara, Oluyole of Oyo State,
Nigeria using geospatial analysis with the objectives of analysing the areas vulnerable to flood, land use/land cover,
determine the topography of water flow and identifying the watershed of Ibadan. Topographic map sheet at a scale
of 1:50,000 used to extract the attribute such as place names; drainage network and other cultural features, Quick
bird satellite image used to extract the building footprints and the road network. Shuttle Radar Topographic mission
(SRTM) with one image scene consisting of 4,100 x 4,200 lines with a spatial resolution of 30m over a swath width
of 60 x 60 kilometres acquired in 2017 and referenced to the WGS84/EGM96 Geoids was used for the delineation of
floodplains. Geology Map was used in determining areas whose surfaces will be likely to retain surface runoff and
hence cause secondary flooding. Land Use Map of Ibadan was derived from the reclassification of a 2018 medium
resolution landsat satellite image of Nigeria. The results showed that 82.75% are vulnerable to flood. Only the
highly developed and commercialized area shows presence of pavements and impervious surfaces. It also showed
that land use has a direct relationship with flood vulnerability. Oluseyi, Oremeji Agugu, Olorunsogo, Cocacola,
International Institute of Tropical Agriculture (IITA), Ojoo, Shasa, Sagbe, Agbowo, Yemetu, Obasa, Elewure, part
of Old Ife road and Iwo Road among others are highly vulnerable to flooding. On the other hand, Akinyemi, Ring
road, Ojaba-Mapo Hall, New Garage, Lekan Salami stadium, Eleyele, Bere, Challenge and Ring Road among
others are moderately vulnerable to flooding.
Keywords: Flood Vulnerability (FV), Geospatial Analysis (GA), Satellite Imagery (SI), Shuttle Radar Topographic
Mission (SRTM), Delineation of Floodplains (DF)
1. INTRODUCTION
Over forty years ago, financial loss and damage
surfer due to natural hazards such as, floods
disasters have increased in many times which also
resulted majorly on loss of human lives and
livelihoods, causing so much damages to economic
and social infrastructure, and as well causes
environmental damages (Munich, 2002). The most
common natural disasters in the world today is
flood. One of natural hazards that may result from
the potential for extreme geographical events which
create sudden threat to human life and property is
Floods (Smith, 1996). With several occurrence of
flood in areas occupied by humans, it can lead to
natural disasters involving loss of human life and
property coupled with serious disturbance to the
continuous activities of wide urban and rural
communities (Smith and Ward, 1998). Moreover,
despite the negative impact of flood such as
damage to properties, loss of life, loss of jobs or
income, discontinuous of the network of social
contact as expected, and effect on constant access
to education, adequate health and food services, and
there can still be series of positive flood impacts,
for example, increased fertility of agricultural land
(Parker et al., 1987). Vulnerability, is a critical
measure of extent of poverty, though closely
associated with poverty, but refers to quality of
being weak and unable to protect oneself from
attack and lack of security (Idowu, 2011). With
every day increase in number of people living in
urban area worldwide, the number of people that
will be vulnerable or be at risk to flood hazards is
likely to increase. With an increase in disasters be it
small or large will endanger developmental gains
and make the implementation of the Millennium
Development Goals difficult (UN-ISDR, 2008).
Flood is said to be the most sufficiently great effect
of climate change on the poor people (Idowu,

May. 2020. Vol. 16, No.1 ISSN 2311-2484
International Journal of Research In Earth & Environmental Sciences © 2013-2020 IJREES & K.A.J. All rights reserved www.ijsk.org/ijrees
2
2011). It occurred as a result of increased in
precipitation thereby damaging infrastructures such
as roads, drainage systems, culverts, houses and
water supply that may resulted in cumulative
effects on many parts of the study area. Charveriat
(2000) stated it that in Asia, natural disasters
affected about 3.76 billion people between the year
1970 and 1999 and as well as the countries in the
regions of Caribbean and Latin America were
affected by earthquakes, droughts and floods,
windstorms, however, floods had the highest
increasing cost. According to the World Bank
(2001), the potential impacts of climate change on
human health would increase vulnerability and
climate change and will have both direct and
indirect adverse effects on human health. With
climate change, weather is less predictable, heavy
storm rainfalls is more likely to occur as rains more
uncertain. Unpredictable rainfall is shown both by
observations, like the large inconstant in the levels
of Lake Victoria in Africa since 1980, and by the
experiences of prolong urban overcrowded
residents, who give account greatly of constant
storms producing floods since 1990 (Action Aid
International, 2006).
Floods and wind storms from long term
data on natural disasters suggest that flooding are
the most common causes of natural disaster
globally over the past 10 decades (Few et al, 2004).
According to the International Federation of Red
Cross and Red Crescent Societies, in a decade from
1993 to 2002 flood disasters “affected more people
worldwide (140 million per year on average) than
every other natural or technological disasters put
together” (IFRC, 2003). As the world urban areas
keep increasing, flood disasters are reportedly keep
increasing and having negative impacts on poor
people (Alam et al., 2008) and the development of
an urban area in general. Moreever, the urban flood
risk research was strongly influenced by the
concept of floods within the natural, rural
environment (Zevenbergen, 2007). Vulnerability is
a term that can be used in various ways, especially
in describing a condition of susceptibility shaped by
exposure, sensitivity and resilience (Kasperson et
al., 1995). As stated by many researchers, the
effects of flood are not all that negative, but also
have its positive impact on the environment.
Although flooding, generally, is a bane of most of
the people, but can be beneficial. In a real sense,
nature benefits more from natural floods than not
having them at all (Abowei and Sikoki, 2005).
The advantageous effect of flood is at the
time river overflows, and the overflows water
subsided and return back to its normal flow, then
the deposited materials will make the land more
fertile and richer in nutrient. Therefore, the organic
materials and deposited minerals by the river water
keep the soil fertile and productive for agricultural
purposes (Abowei and Sikoki, 2005). However, in
Ibadan metropolis the cause of floods is mainly as a
result prolonged rainfall and poor urban drainage
systems which is similar to most third world
countries around the world. In most of these
vulnerable countries, disaster management is
usually centralized on disaster response and relief,
and rehabilitation activities. Several studies suggest
that a paradigm shift is needed from disaster
response and relief to disaster risk and reduction in
vulnerability (Birkmann, 2006; Yodmani, 2001).
Therefore, the city of Ibadan in southwest Nigeria
has a history of flood disasters with the most recent
occurred on the 26th of August 2011. This occurred
after Ona-Ara River, when its flood plains and that
of Eleyele Lake over flooded after 14 hours of non-
stop rainfall. As a result of this disaster, there was
destruction of over five thousand households, about
2,500 hectares of farmlands, roads and about 10,
bridges which was affected (Ikhuoria et al, 2012).
According to Ashiru (2015) stated that the highest
height ever for a flood point in Ibadan was recorded
at Moniya. This study, therefore, this study
examined the flood vulnerability, its relationship
with land use and topographic information
assessment in Ibadan metropolis, Oyo State,
Nigeria
2. STUDY AREA
Ibadan is one of the oldest and largest cities in
Africa, the capital of Oyo State, Nigeria. It consists
of eleven local government areas (LGAs) generally
called Ibadan metropolis. In 1856, the population
was estimated at 60,000, 200,000 in 1890, over
238,000 in 1921, and more than 386,000 in 1931
(Mabogunje 1962). Ibadan consists of the densely
populated (urban core) and its less-populated (Peri-
Urban areas). The Urban core (inner part) consists
of Ibadan North, Ibadan North East, Ibadan North
West, Ibadan South East and Ibadan South West.
The Peri-Urban areas (outer part) consist of
Akinyele, Egbeda, Ido, Lagelu, Ona-Ara, Oluyole.
The Peri-urban areas are zones of transition from
rural to urban land uses located between the outer
limits of urban and regional centers and the rural
environment. The typical West African monsoon
climate which consists of the rainy (March-
September) and dry (October-February) seasons

May. 2020. Vol. 16, No.1 ISSN 2311-2484
International Journal of Research In Earth & Environmental Sciences © 2013-2020 IJREES & K.A.J. All rights reserved www.ijsk.org/ijrees
3
occurred in the study area and drained by Ogunpa
and Ona-Ara rivers and their tributaries.
The floods in the city over the years occurred as a
result of long term rainfall leading to inundation of
river channels and streams. Dense networks of
streams and rivers in the urban and peri-urban
neighbourhoods of the metropolis sustained the
floods. Figure 1 describes the study area. Table 1, 2
and 3 showed the Demographic Features,
geographic locations coordinates and ranking
scheme for raster layers of Local Government
Areas in Ibadan.
Figure 1. Digitized Map of Ibadan metropolis
Table 1. Demographic Features of Local Government Area’s in Ibadan
S/No. Local Government Area Population (2006
census)
Area in km2 Population Density
Person/km2 (2006
census)
1 Ibadan North 306,795 145.58 2,107
2 Ibadan North East 330,399 81.45 4,057
3 Ibadan North West 152,834 31.38 4,870
4 Ibadan South East 266,046 80.45 3,307
5 Ibadan South West 282,585 124.55 2,269
Sub-Total (urban core) 1,338,659 463.33 2,889
6 Akinyele 140,116 427.26 495
7 Egbeda 129,461 136.83 2,058
8 Ido 53,584 865.49 119
9 Lagelu 68,901 283.92 521
10 Ona-Ara 123,048 369.37 549
11 Oluyole 91,527 577.1 459
Sub-Total (Peri urban core) 1,211,934 2,659.97 456
Grand Total 2,550,593 3,123.30 816.63
Source: Provisional Figure released by the National Population Commission (2007)
Table 2. Geographical Location coordinates of Local Government Areas in Ibadan S/No LGA Area(in Sqkm) Geographic
Longitude
Geographic Latitude Height above MSL
(metres)
1 Ibadan N 306,795 3.911° 7.412° 209
2 Ibadan NE 330,399 3.931° 7.374° 216
3 Ibadan NW 152,834 3.878° 7.401° 216
4 Ibadan SE 266,046 3.905° 7.335° 179
5 Ibadan SW 282,585 3.864° 7.354° 173
6 Akinyele 140,116 3.916° 7.561° 258
7 Egbeda 129,461 4.059° 7.391° 212
8 Ido 53,584 3.712° 7.507° 210
9 Lagelu 68,901 4.047° 7.495° 221
10 Oluyole 91,527 3.877° 7.184° 159
11 Ona-Ara 123,048 4.040° 7.251° 154
Source: authors compiled from the Google earth updated 2019

May. 2020. Vol. 16, No.1 ISSN 2311-2484
International Journal of Research In Earth & Environmental Sciences © 2013-2020 IJREES & K.A.J. All rights reserved www.ijsk.org/ijrees
4
Table 3. Presentation of ranking scheme for raster
layers
S/N Class Rank
1 The least vulnerable areas 1
2 Areas of low vulnerability 2
3 Moderately vulnerable areas 3
4 Highly vulnerable areas 4
5 Areas of the highest vulnerability 5
Source: Authors compiled (2019)
3. DATA AND METHODS
3.2 Method
The topographic map at a scale of 1:50,000
prepared by Ibadan Urban Flooding Management
Project which weas obtained from the Surveyor
General office of Oyo State (OSGOY) Secretariat
Ibadan and was used to assess the flood
vulnerability in the study area. From the
topographic map, attribute such as names of places,
drainage network, roads and other cultural features
of the study area was extracted.
Shuttle Radar Topographic mission (SRTM)
obtained from National Aeronautics and Space
Administration (NASA) website consisting one
image scene of 4,100 x 4,200 lines with a 30m
spatial resolution over a 60 x 60 kilometres swath
width which was obtained in 2017 and referenced
to the WGS84/EGM96 Geoid was used for the
delineation of floodplains in the study area.
This image was used for the delineation of
floodplains in the study area. Land Use Map was
derived from the reclassification of a 2018 medium
resolution landsat satellite image of Nigeria from
the Regional Centre for Training in Aerospace
Surveys (RECTAS) consisting of seven (7) spectral
bands in which land use map of Ibadan was derived
with the use of ArcGIS 10.2.1 software.
Geology Map acquired from geological surveys
department which was modified at a small scale to
define the geomorphology of the study area, was
used in determining areas whose surfaces will be
likely to retain surface runoff and hence cause
secondary flooding. Building footprints and the
road network was extracted from the Quick bird
satellite imagery obtained from archives of
Regional Centre for Training in Aerospace Surveys
(RECTAS).
It consists of three (3) spectral bands and a ground
resolution of 0.6m. Land sat ETM image was
acquired from the GLCF website with a ground
resolution of 30m. All the bands contain the visible,
near infrared (NIR), middle infrared and far
infrared spectral regions of electromagnetic
spectrum (EMS).
i. Band 2 (0.59-0.65µm) is the red wavelength
band. With band 2, chlorophyll absorption region
is sensed thereby aiding in plant species
differentiation. It is also useful for cultural feature
identification.
ii. Band 3 (0.72-0.86µm) is the near infrared
wavelength (NIR) which is useful in the
determination of vegetation types, vigour and
biomass content. With band 3, water bodies’ can
be delineats and can also aid soil moisture
discrimination.
iii. Band 4 (1.51-1.74µm) is the first of the two
bands in the middle infrared wavelength.
It is indicative of vegetation moisture content and
soil moisture. In the temperate region, with band 4,
it is easy to differentiate snow from clouds. The
three bands were composite together to single band
which was used for drainage mapping and
determination of the dominant land use land cover
types. Geology Map was acquired from geological
surveys department and was modified at a small
scale to define the geomorphology of the study
area, this was usefully in determining areas whose
surfaces will be likely to retain surface runoff and
hence cause secondary flooding. Figure 2 showed
the topographic map sheet and the overlaid
Quickbird satellite imagery of the study area.
Figure 2a. Topographic map sheet of the study area

May. 2020. Vol. 16, No.1 ISSN 2311-2484
International Journal of Research In Earth & Environmental Sciences © 2013-2020 IJREES & K.A.J. All rights reserved www.ijsk.org/ijrees
5
Figure 2b. Overlaid Quickbird Satellite image
4. RESULTS AND DISCUSSIONS
The results below presents the analysis derived from
various method of data acquisition from different
source. Figure 3-13 presents the analysis carried out.
Figure 3a. Map showing Landuse map of Ibadan
Figure 3b. Map showing reclassed land-use
Figure 3 (a & b) above described the major Urban
areas as the most vulnerable to floods because they
have the highest percentage of impervious surfaces
and they also have the highest human and housing
population. Vulnerability in this regard decreases
away from the urban centre with the lowest
vulnerability being in thickly forested areas where
the soil is still held together by the natural
vegetation. Areas where agriculture is being
practiced are given a moderate value because even
though such areas are not at great risk such as the
urban areas but the soil in this areas have been
tampered with and they are not as firm as they
should be. They can easily be eroded and deposited
thus facilitating flooding. Land use was classified
into five classes and is as follows;
Plantations and forest were classified as areas with
the least vulnerability to flood. Grasslands were
classified as low vulnerability area to flood. Areas
were rain-fed agriculture is practiced was classified
as areas with moderate vulnerability to flood.
Minor urban areas and places away from the city
centre were classified as high vulnerability area to
flood. Major urban areas and water bodies were
classified as areas with the highest vulnerability to
flood.

May. 2020. Vol. 16, No.1 ISSN 2311-2484
International Journal of Research In Earth & Environmental Sciences © 2013-2020 IJREES & K.A.J. All rights reserved www.ijsk.org/ijrees
6
Figure 4a. Geology map of Ibadan
Figure 4b. Map of re-classed geology
Figure 5. Map showing an overlay of geology
and land-use datasets
The re-classed datasets of geology, land use, slope
and drainage buffer were overlaid on each other.
Percentage influences were ascribed to each of the
datasets in the following manner; Geology dataset
was ascribed a percentage influence of 10%, Land
use dataset was ascribed a percentage influence of
20%, Slope dataset was ascribed a percentage
influence of 30%, Drainage dataset was ascribed a
percentage influence of 40%, thus making a total of
100%. Three sets of overlay operation were carried
out so as to make the procedures more explicit and
the result more visual. The first was the overlay of
the geology and land use. This was done using a
ratio of 33:67 respectively that corresponds to the
intended percentage influence of 10% and 20%
respectively
Figure 6a. Digital Elevation Model of study area
Figure 6b. Aspect/flow direction of the DEM

May. 2020. Vol. 16, No.1 ISSN 2311-2484
International Journal of Research In Earth & Environmental Sciences © 2013-2020 IJREES & K.A.J. All rights reserved www.ijsk.org/ijrees
7
The digital elevation model of Ibadan was derived
from the Shuttle Radar Topography Mission
(SRTM) satellite image. The highest point within the
study area was identified to be 428metres and the
lowest point was 54metres above sea level as
represented in Figure 6 (a & b)
Figure 7. contour map derived from the DEM
From the DEM in figure 7 above, a contour map
with 50m interval was derived which showed places
of equal height/elevation. The result from the
contour showed that Ona-Ara, Oluyole and part of
Ido have lower equal terrain which ranges from 100-
150m. 200m elevation exists in all local government
areas. While larger percentage in Akinyele, part of
Lagelu and Ibadan North terrain has equal height of
250m. Part of Akinyele and Ido has elevation of
300m and above. It is possible for a low land (low
terrain) area to experience flood more than in high
land (high terrain) areas.
Figure 8a. Map of Ibadan showing slope
Figure 8b. Map of Ibadan showing re-classed slope
The result from (figure 8a) showed an area with
slope values. Slope values that are ranges from 0 to
4.4 were classified as least area vulnerable to flood,
values ranges from 4.4 to 8.0 was classified as low
area vulnerable to flood, values range from 8.1 to
14.0 was classified as moderate area vulnerable to
flood, values range from 14.1 to 20.0 was classified
as high areas vulnerable to flood and values range
from 20.01 and above was classified as the highest
areas vulnerable to flood.
Figure 9. Vulnerability map of Ibadan showing an
overlay of Geology, Land-use and slope datasets
May. 2020. Vol. 16, No.1 ISSN 2311-2484
International Journal of Research In Earth & Environmental Sciences © 2013-2020 IJREES & K.A.J. All rights reserved www.ijsk.org/ijrees
8
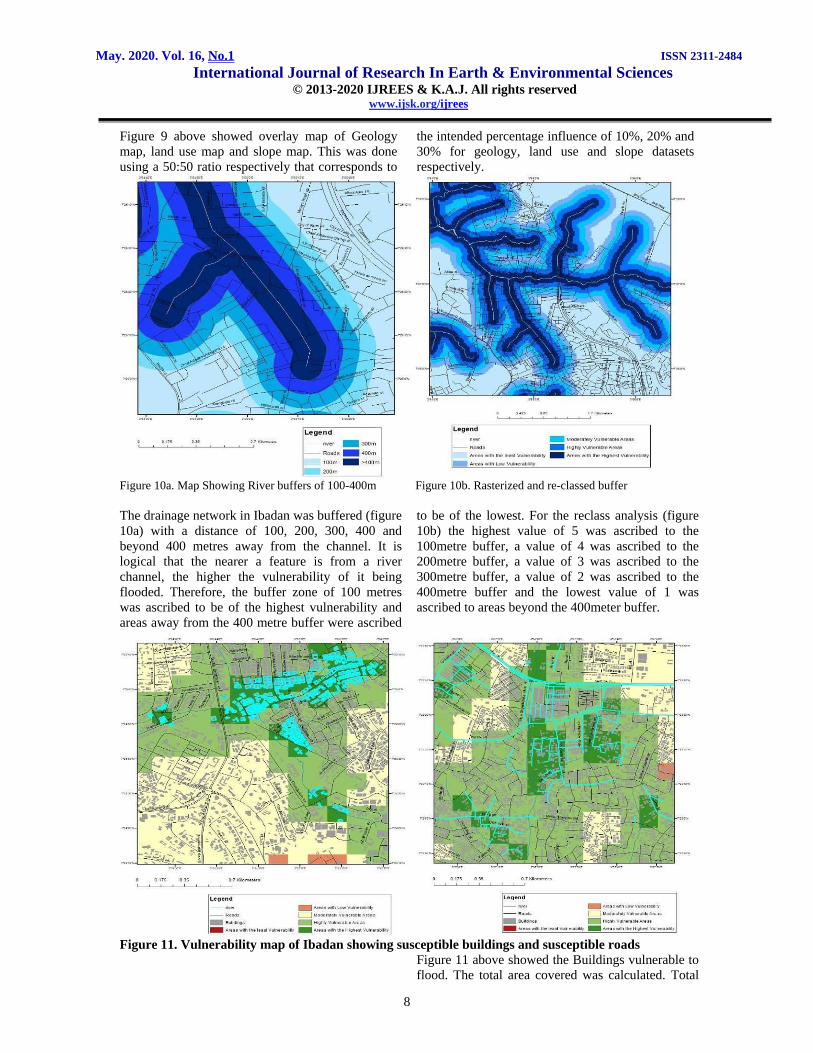
Figure 9 above showed overlay map of Geology
map, land use map and slope map. This was done
using a 50:50 ratio respectively that corresponds to
the intended percentage influence of 10%, 20% and
30% for geology, land use and slope datasets
respectively.
Figure 10a. Map Showing River buffers of 100-400m Figure 10b. Rasterized and re-classed buffer
The drainage network in Ibadan was buffered (figure
10a) with a distance of 100, 200, 300, 400 and
beyond 400 metres away from the channel. It is
logical that the nearer a feature is from a river
channel, the higher the vulnerability of it being
flooded. Therefore, the buffer zone of 100 metres
was ascribed to be of the highest vulnerability and
areas away from the 400 metre buffer were ascribed
to be of the lowest. For the reclass analysis (figure
10b) the highest value of 5 was ascribed to the
100metre buffer, a value of 4 was ascribed to the
200metre buffer, a value of 3 was ascribed to the
300metre buffer, a value of 2 was ascribed to the
400metre buffer and the lowest value of 1 was
ascribed to areas beyond the 400meter buffer.
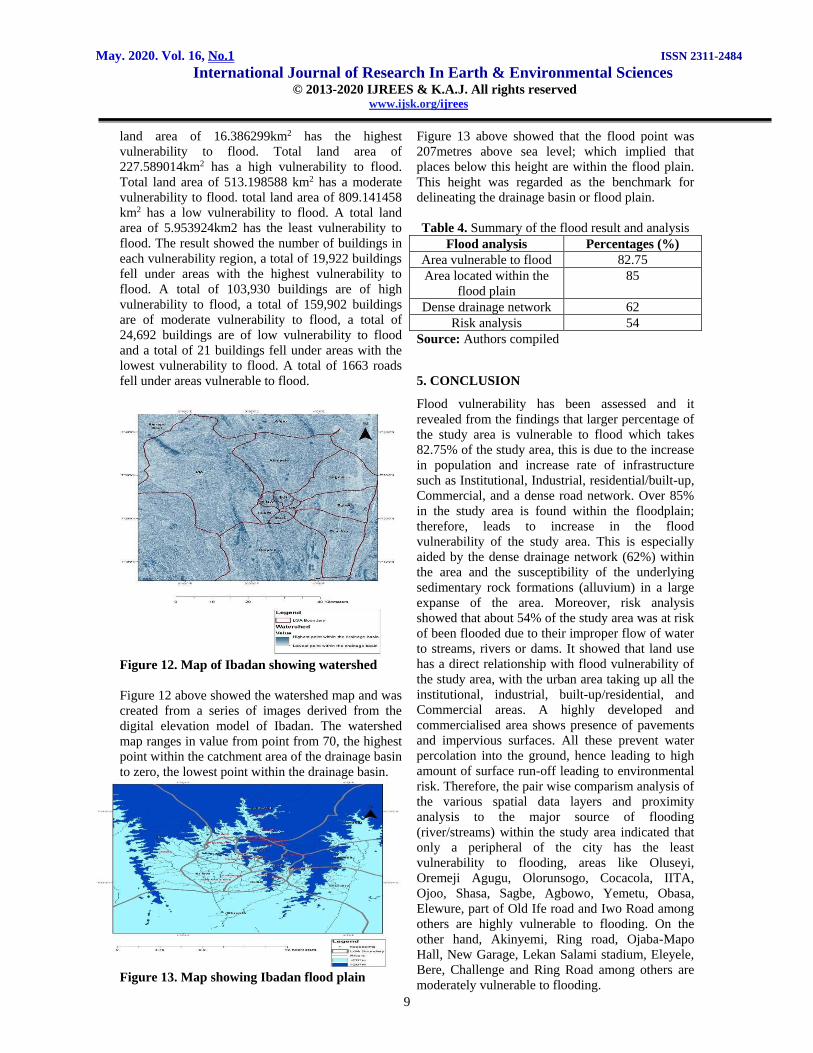
Figure 11. Vulnerability map of Ibadan showing susceptible buildings and susceptible roads
Figure 11 above showed the Buildings vulnerable to
flood. The total area covered was calculated. Total
May. 2020. Vol. 16, No.1 ISSN 2311-2484
International Journal of Research In Earth & Environmental Sciences © 2013-2020 IJREES & K.A.J. All rights reserved www.ijsk.org/ijrees
9
land area of 16.386299km2 has the highest
vulnerability to flood. Total land area of
227.589014km2 has a high vulnerability to flood.
Total land area of 513.198588 km2 has a moderate
vulnerability to flood. total land area of 809.141458
km2 has a low vulnerability to flood. A total land
area of 5.953924km2 has the least vulnerability to
flood. The result showed the number of buildings in
each vulnerability region, a total of 19,922 buildings
fell under areas with the highest vulnerability to
flood. A total of 103,930 buildings are of high
vulnerability to flood, a total of 159,902 buildings
are of moderate vulnerability to flood, a total of
24,692 buildings are of low vulnerability to flood
and a total of 21 buildings fell under areas with the
lowest vulnerability to flood. A total of 1663 roads
fell under areas vulnerable to flood.
Figure 12. Map of Ibadan showing watershed
Figure 12 above showed the watershed map and was
created from a series of images derived from the
digital elevation model of Ibadan. The watershed
map ranges in value from point from 70, the highest
point within the catchment area of the drainage basin
to zero, the lowest point within the drainage basin.
Figure 13. Map showing Ibadan flood plain
Figure 13 above showed that the flood point was
207metres above sea level; which implied that
places below this height are within the flood plain.
This height was regarded as the benchmark for
delineating the drainage basin or flood plain.
Table 4. Summary of the flood result and analysis
Flood analysis Percentages (%)
Area vulnerable to flood 82.75
Area located within the
flood plain
85
Dense drainage network 62
Risk analysis 54
Source: Authors compiled
5. CONCLUSION
Flood vulnerability has been assessed and it
revealed from the findings that larger percentage of
the study area is vulnerable to flood which takes
82.75% of the study area, this is due to the increase
in population and increase rate of infrastructure
such as Institutional, Industrial, residential/built-up,
Commercial, and a dense road network. Over 85%
in the study area is found within the floodplain;
therefore, leads to increase in the flood
vulnerability of the study area. This is especially
aided by the dense drainage network (62%) within
the area and the susceptibility of the underlying
sedimentary rock formations (alluvium) in a large
expanse of the area. Moreover, risk analysis
showed that about 54% of the study area was at risk
of been flooded due to their improper flow of water
to streams, rivers or dams. It showed that land use
has a direct relationship with flood vulnerability of
the study area, with the urban area taking up all the
institutional, industrial, built-up/residential, and
Commercial areas. A highly developed and
commercialised area shows presence of pavements
and impervious surfaces. All these prevent water
percolation into the ground, hence leading to high
amount of surface run-off leading to environmental
risk. Therefore, the pair wise comparism analysis of
the various spatial data layers and proximity
analysis to the major source of flooding
(river/streams) within the study area indicated that
only a peripheral of the city has the least
vulnerability to flooding, areas like Oluseyi,
Oremeji Agugu, Olorunsogo, Cocacola, IITA,
Ojoo, Shasa, Sagbe, Agbowo, Yemetu, Obasa,
Elewure, part of Old Ife road and Iwo Road among
others are highly vulnerable to flooding. On the
other hand, Akinyemi, Ring road, Ojaba-Mapo
Hall, New Garage, Lekan Salami stadium, Eleyele,
Bere, Challenge and Ring Road among others are
moderately vulnerable to flooding.

May. 2020. Vol. 16, No.1 ISSN 2311-2484
International Journal of Research In Earth & Environmental Sciences © 2013-2020 IJREES & K.A.J. All rights reserved www.ijsk.org/ijrees
10
RECOMMENDATIONS
The findings of this study could be integrated
within a spatial enabled decision support system,
especially as disaster risk reduction is concerned.
This is especially critical for Ibadan city which
seems to have a history of flooding for over 50
years. This will serve as a basis for advising
residents in locating basic infrastructure within the
high risk zones. Also, the response mechanism
could be efficient, through the adoption of the
findings of this study; especially for best route,
relief sites (higher ground) etc in the event of future
flood occurrence. Consequently, all stakeholders in
the disaster management cycle should be
acquainted with this methodology and results in
order to mitigate the impact of floods in the future.
REFERENCES
1. J. Abowei, and F. Sikoki, “Water Pollution
Management and Control”. Double Trust
Publications Co., Port Harcourt, 2005. pp 236
2. Action Aid International (AAI), “Climate
change, urban flooding and the rights of the urban
poor in Africa: Key findings from six African
cities”. (Available on
http://www.actionaid.org/docs/urban%20flooding
%20africa%20report.pdf Accessed 12/03/2008),
2006.
3. K. Alam, M. Herson, and I. O‟Donnel, “Flood
Disasters: Learning from Previous Relief and
Recovery Operations”. Prevention Consortium and
ALNAP, 2008.
4. A. Ashiru, “Spatial variation in the resillence to
flooding”. Thesis submitted to the department of
Geography, University of Ibadan. Ibadan, Nigeria,
2015)
5. J. Birkmann, “Measuring vulnerability to
promote disaster-resilient societies: Conceptual
frameworks and definitions. In: Measuring
Vulnerability to Natural hazards-Towards Disaster
Resilient Societies”, edited by: Birkmann, J.,New
York, United Nations University, 2006, pp. 9–54.
6. C. Charvériat, “Natural Disasters in Latin
America and the Caribbean: An Overview of Risk”.
Inter-American Development Bank. Working Paper
434. 2000.
7. R. Few, M. Ahern, F. Matthies, and S. Kovats,
“Floods, health and climate change: A strategic
review” Tyndall Centre Working Paper No. 63.
8. Google earth satellite imagery (2018). updated
Google earth Pro, 2004.
9. E. O. Idowu, “Effect of Climate Change (Flood)
On Housing for The Urban Poor in Ilaje Somolu
Local Government”, Unpublished B.Sc.
Dissertation, Department of Urban and Regional
Planning, University of Lagos, 2011.
10. IFRC, “World Disaster Report 2003 (Geneva:
IFRCRCS); at: www.ifrc.org, 2003, Pp 11.
11. Kasperson et al. “Research and Assessment
Systems for Sustainability: Framework for
Vulnerability”, The George Perkins Marsh Institute
at Clark University and The Stockholm
Environment Institute, 2001.
12. A. L. Mabogunje, “The Residential Districts of
Ibadan, Nigeria. Geographical Review, Vol. 52, No.
1, January 1962, 2007.
13. Munich Re Topics, “Natural catastrophes in
2002”. Review, 2002.
14. National Population Commission, “National
Population Census of Nigeria”, National Bureau of
Statistics, Abuja, 2007.
15. G. M. H. Parker, Y. Garcia, Fukushima, and W.
Yu, “Experiments on turbidity currents over an
erodible bed”. Journal of Hydraulic Research,
25(1), 1987, 123-147.
16. Smith, K. (1996). Environmental Hazards.
Assessing Risk and Reducing Disaster. London,
Routledge.
17. K., Smith, and R. Ward, “Floods Physical
Processes and Human Impact”, Published by John
& Wiley and son Ltd. Conneil, Bangkok, Thailand,
1998.
18. UN-International Strategy for Disaster
Reduction (UN-ISDR), “Disaster Risk Reduction
Strategies and Risk Management Practices: Critical
Elements for Adaptation to Climate Change”
Submission to the UNFCCC Adhoc Working Group
on Long Term Cooperative Action. 2008, Available
at: www.unisdr.org/.../risk-
reduction/climatechange/.../ IASC-
ISDR_paper_cc_and_DDR.pdf
19. World Bank, “World Bank Development
Indicators”. Washington DC, World Bank, 2001.
20. S. Yodmani, “Disaster Risk Management and
Vulnerability Reduction: Protecting the Poor”,
2001.
21. C. Zevenbergen, “Adapting to Change:
Towards Flood Resilient Cities”. Inaugral Address
by Chris Zevenbergen in Delft, The Netherlands,
December 14, 2007. UNESCO-IHE (Institute for
Water Education), 2007.