mayor jeff fusco service director john o. moore deputy service
TRANSCRIPT
Mayor Jeff Fusco
Service Director John O. Moore
Deputy Service Director Phillip J. Montgomery

JOHN 0. MOORE Service Director
August 7, 2015
Susan Hedman Administrator USEP A Region 5 77 West Jackson Boulevard Chicago, IL 60604-3590
JEFF FUSCO Mayor
DEPARTMENT OF PUBLIC SERVICE 166 S. High St., Room 201
Akron, OH 44308-1657
PHILLIP J. MONTGOMERY Deputy Director
Subject: Akron CSO Program, Akron Waterways Renewed!, Integrated Plan
Dear Ms. Hedman,
The City of Akron is pleased to submit the attached City of Akron Integrated Plan dated July 31, 2015 and Financial Capability Assessment dated August 7, 2015. Combined, both plans serve as the basis for future improvements to Akron's current Consent Decree and Long Time Control Plan.
Akron has developed its Integrated Plan in accordance with the USEP A guidelines and presents the key findings of Akron's integrated planning efforts with a goal of developing an "equal or better environmental plan at a more affordable cost". This plan was developed in concert with our City Council, IP Stakeholders, and environmental partners.
We appreciate your review and look forward to an opportunity to provide an overview in person to USEP A, the State of Ohio EPA, and the Department of Justice.
Respectfully,
Service Director City of Akron
Attachments: Akron Integrated Plan and Financial Capabilities Analysis Update

City of Akron
Integrated Plan
July 31, 2015
Mayor Jeff Fusco
Service Director John O. Moore
Deputy Service Director Phillip J. Montgomery


(Cuyahoga River Community Planning)
1299 Superior Ave E • Cleveland, OH 44114 • 216.241.2414 x610 • [email protected]
June 26, 2015
Susan Hedman Administrator US EPA Region 5 77 West Jackson Blvd. Chicago, IL 60604
RE: Akron CSO Integrated Plan
Dear Administrator Hedman,
I write today to express our organization’s support for the City of Akron’s request to revise their Combined Sewer Overflow consent decree to allow for an Integrated Plan that would expand the ways in which the city can address CSO reductions.
As the nonprofit facilitating organization of the Cuyahoga River Area of Concern, coordinator of actions designed to delist the AOC, and lead partner in the federally designated Cuyahoga American Heritage Initiative, it has been our mission and our work to bring the river back to health.
In order the Area of Concern to reach delisting targets, the issue of restrictions on recreational contact due to bacterial contamination must be addressed. This cannot happen until overflows from the Akron system are dealt with, as they affect not only the stretches of river in Akron but the entire lower fifty miles of the Cuyahoga River mainstem.
A strict reliance on structural remedies that are costly and will take years to implement will not solve the problems in an acceptable time frame, and will create a burden that no city could guarantee to bear over the long term.
Only a plan that is based on results, rather than on specific structures, and that includes a wide range of strategies including green infrastructure and site-specific stormwater measures large and small will provide the solutions we need.
We encourage you to support Akron’s Integrated Plan proposals and make it possible for the city to engage a broad range of solutions that would engage whole communities in this effort.
Thank you,
Jane Goodman Executive Director

City of Akron
Integrated Plan
July 31, 2015
Mayor Jeff Fusco
Service Director John O. Moore
Deputy Service Director Phillip J. Montgomery

City of Akron Integrated Plan
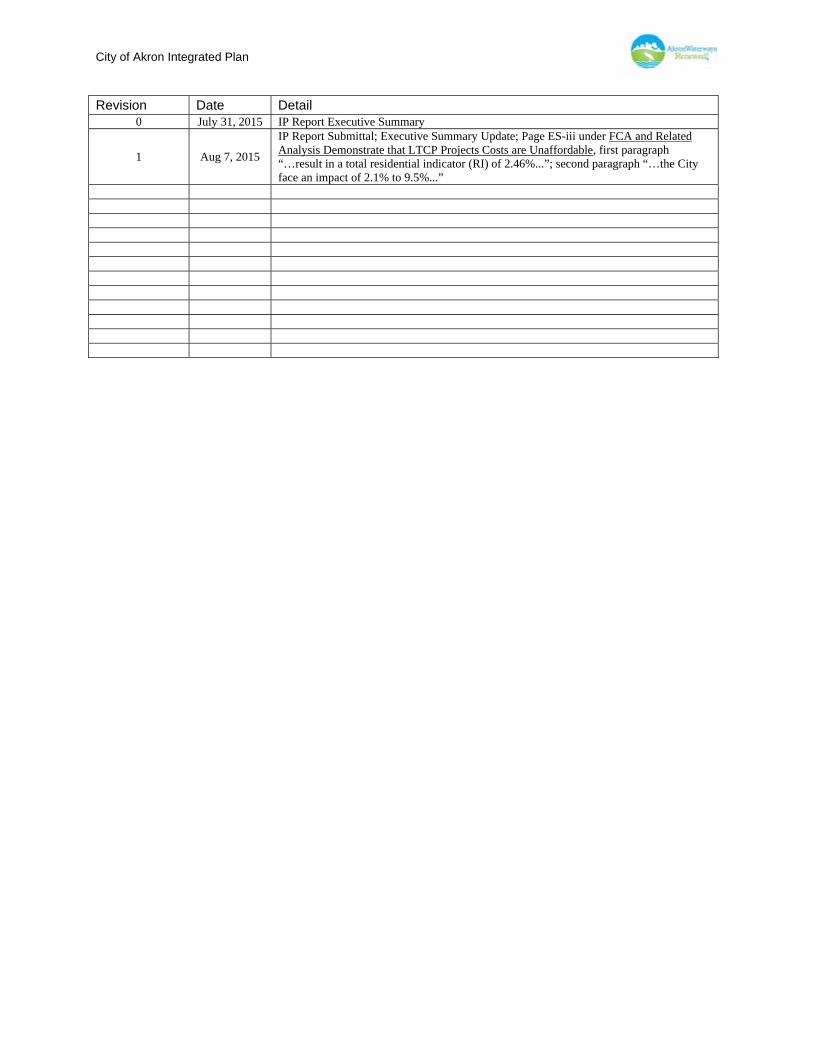
Revision Date Detail 0 July 31, 2015 IP Report Executive Summary
1 Aug 7, 2015
IP Report Submittal; Executive Summary Update; Page ES-iii under FCA and Related Analysis Demonstrate that LTCP Projects Costs are Unaffordable, first paragraph “…result in a total residential indicator (RI) of 2.46%...”; second paragraph “…the City face an impact of 2.1% to 9.5%...”

City of Akron Integrated Plan
ES-1
EXECUTIVE SUMMARY
Akron Needs an Integrated Plan to Address Unaffordable Costs
The City of Akron (the “City” or “Akron”) developed this Integrated Plan as a vehicle to prioritize and re-evaluate the extensive capital investments that the City needs to make to its wastewater and stormwater systems over the next several years. The largest costs are associated with a federal Consent Decree and the City’s Combined Sewer Overflow (CSO) Long-Term Control Plan (LTCP) that requires the City to implement substantial upgrades to the City’s combined sewer system and Water Pollution Control Station (WPCS).1, 2 The cost to implement the LTCP Projects is currently over $1.14 billion (2014 dollars). In addition to this staggering cost, the City also has ongoing operation and maintenance, capital investment, and debt service costs related to its wastewater and stormwater systems.
The City has taken aggressive steps to fund the LTCP Projects and other costs of the City’s wastewater and stormwater systems. In just the past ten years alone, the City has raised sewer rates over 269%. However, even with such aggressive rate increases, the City will still not be able to pay for the cost of the current LTCP Projects and the additional costs associated with the City’s wastewater and stormwater systems without integrating and prioritizing all of the wastewater and storm costs, and simultaneously developing and implementing sustainable and cost saving solutions, such as green infrastructure controls, in-line storage and increased conveyance.
HCF = hundred cubic feet
Figure ES-1. Annual Sewer Rate Increases
1 The federal Consent Decree includes the projects in the LTCP along with additional requirements. For ease of review, all of the federal Consent Decree requirements, including the projects in the LTCP are referred to in this Integrated Plan as “LTCP Projects.” 2 The name of the WPCS was changed to the Water Reclamation Facility. However, since the LTCP uses the term WPCS, that term is also used in this Integrated Plan for consistency purposes.

City of Akron Integrated Plan
ES-2
USEPA’s Integrated Planning Framework
This Integrated Plan was prepared in accordance with USEPA’s Integrated Municipal Stormwater and Wastewater Planning Approach Framework, which was published by USEPA on June 5, 2012 (IPF). As stated by USEPA within the IPF:
Integrated Planning will assist municipalities on their critical paths to achieving the human health and water quality objectives of the Clean Water Act by identifying efficiencies and implementing requirements that arise from district wastewater and stormwater programs, including how to best prioritize capital investments. Integrated planning can also facilitate the use of sustainable and comprehensive solutions, including green infrastructure, that protect human health, improve water quality, manage storm waters as a resource, and support other economic benefits and quality of life attributes that enhance the vitality of communities.
Since publishing the IPF in June 2012, USEPA has issued additional IPF guidance. On July 15, 2013 USEPA issued its guidance, Frequently Asked Questions on Integrated Municipal Stormwater and Wastewater Planning, which made it clear that a municipality that is already subject to an existing federal Consent Decree, like Akron, may re-examine its remedy and the affordability of the remedy under the IPF. In addition, on November 24, 2014, USEPA issued a guidance on Financial Capability Assessment Framework for Municipal Clean Water Act Requirements. In this 2014 guidance, USEPA reaffirmed that under the IPF, the financial capability assessment can include the following costs: stormwater and wastewater ongoing asset management or system rehabilitation programs; CWA related capital improvement programs; collection systems and treatment facilities; and other CWA obligations required by state or other regulators.
The IPF includes the six elements shown to the right. Each element is thoroughly addressed in this Integrated Plan. In addition, the City maintained the following goals as part of the development of this Integrated Plan:
Reduce the amount of unaffordability.
Use of an enhanced Triple Bottom Line to measure benefits and evaluate projects.
Achieve equal or better environmental benefits at a more affordable cost.
To the extent feasible and when cost effective, use green solutions.

City of Akron Integrated Plan
ES-3
General Grouping of All Integrated Plan Projects
As part of prioritizing and evaluating the overall cost of the wastewater and stormwater systems, the Integrated Plan considered three different groups of projects:
LTCP Projects – These are all of the projects required by the current LTCP and the Consent Decree. As discussed in detail within the IP, the City first evaluated all of the Original projects (Original LTCP Projects), and then through the IPF, developed a set of alternative projects (Alt LTCP Projects), including green infrastructure projects, that provide for an equal or better environmental benefit at a more affordable cost.
Non-LTCP Projects – These are projects that are included in the City’s Capital Improvement Plan (CIP) that are needed to meet CWA-related obligations, but not included within the LTCP Projects, such as the WPCS headworks improvements and sanitary sewer lining projects.
Annual Projects – These are the re-occurring projects, such as asset management rehabilitation and replacement projects that are needed to maintain existing, or meet future, wastewater conveyance and treatment infrastructure needs, as well as stormwater infrastructure needs.
FCA and Related Analysis Demonstrate that LTCP Projects Costs are Unaffordable
As part of the development of the Integrated Plan, the City updated its Financial Capability Assessment (FCA) under USEPA’s 1997 Combined Sewer Overflow Guidance for Financial Capability Assessment and Schedule Development. The updated FCA demonstrates that the Original LTCP Projects, coupled with the Non-LTCP Projects and Annual Projects under the current deadline of 2027, result in a total residential indicator (RI) of 2.46% of median household income (MHI) for the Akron service area. Importantly, this amount is well above USEPA’s “high financial impact” threshold of 2% of MHI. However, the RI is only part of the total FCA. The remaining analysis under the FCA further demonstrates that the City falls under the High Burden category.
USEPA’s 1997 FCA Guidance also encourages municipalities “to submit any additional documentation that would create a more accurate and complete picture of their financial capability. . .” As a result, the City’s FCA also includes a Weighted Average Residential index (WARi™) analysis. Following the WARi™ analysis, in which census tracks within the City of Akron are analyzed. This analysis determined that households in several sections of the City face an impact of 2.1% to 9.5% of their MHI. Poverty rates in the City have been relatively high in recent years. The U.S. Census Bureau defined the poverty threshold for a family of four at $23,834 in 2013.3 In 2013, 27.8% of the population in the City was reported below the poverty level, including 41.3% of children under the age of 18 years old.4 This is obviously an unacceptable burden under any measure.
Based on the capital availability funding constraints, a software package (the Expert Choice Comparion™) was utilized to develop a financial model of various project scenarios using the 2027 compliance schedule for the LTCP Projects. The financial model indicated that the
3 U.S. Census Bureau. Social Economic and Housing Statistics Division, Poverty Thresholds for 2013. 4 U.S. Census Bureau. 2011-2013 ACS 3-Year Estimates, Table S1701, Akron City, OH.

City of Akron Integrated Plan
ES-4
projects could not be funded in this timeframe without significant additional rate increases (48%) over a relatively short period.
The cost for the total wastewater and stormwater systems, with a 2027 deadline for the LTCP projects, is clearly unaffordable. Since the total costs are unaffordable, an extension to the 2027 deadline for the LTCP projects, in addition to the reprioritization and optimization of projects, is necessary.
As a result of the need for a longer schedule, the City evaluated the costs based upon a 13 year extension to the deadline for the LTCP Projects. Expert Choice Comparion model runs were conducted for this extended 2040 planning period. However, the results of these additional model runs demonstrate that the Original LTCP projects with a new deadline of 2040, along with the Non-LTCP projects and Annual projects, still could not be funded without significant rate increases (80%) over this extended period, which would result in an even higher RI of 2.64% (2.91% for Akron only). Thus, even if the LTCP project deadline is extended by an additional 13 years to 2040, the total wastewater and stormwater costs are still unaffordable. The recommended Integrated Plan anticipates a more gradual annual increase over the life of the program which is equivalent to a 49% cumulative increase through 2040.
Integrated Plan Development and Results
As set forth above, simply extending the schedule for the Original LTCP projects will not make the wastewater and stormwater system costs affordable. Therefore, in order to make LTCP costs less unaffordable, the City performed a detailed evaluation of alternatives for each of the projects. This evaluation is based upon a 2040 compliance schedule, and all comparisons to the Original LTCP projects are evaluated on that basis.
It is important to note that the City took the following actions to support the evaluation of project alternatives:
Before the development of the Integrated Plan, Akron made a significant investment to better understand the surrounding watersheds, flows, and system capacity/performance. Over the course of the last 18 months, the City has installed 95 new flow monitors at a cost of over $500,000. Additionally, the City has invested over $2.4 million on the collection system model upgrades and recalibration. With this new information, the City refined its collection system model which has allowed us to better predict flows and system performance for our sewer system. This provided the “science” and engineering basis to allow the City to develop alternative projects (e.g., green infrastructure, in-line storage, real time controls, and flow optimization.
Re-prioritized projects to meet the City’s CWA requirements, including increased stormwater and long-term infrastructure repair and replacement needs.
Measured increases in environmental benefits and achievement of improved environmental protection earlier in the program by re-sequencing projects.
Provided flexibility where the City could find a more affordable way to meet its CWA obligations and to assist where there are conflicting regulatory requirements, including reopening clause for the Consent Decrees and permits.

City of Akron Integrated Plan
ES-5
Took advantage of the successes that other wastewater utilities are having by implementing new, innovative, and more sustainable "green infrastructure" solutions (e.g., constructed wetlands, bump outs, and green streets) as alternatives to traditional LTCP engineering approaches.
During development of the Integrated Plan, the City developed projects based on LTCP optimization evaluations, hydraulic model refinements, green infrastructure component analyses, CWA stormwater obligations, and asset management focused rehabilitation and repair (R&R) annual allowances for future CIP needs. The LTCP project list is detailed in Section 5, Evaluating and Selecting Alternatives.
The additions to the Original LTCP project list include:
Non-LTCP projects such as restoration of eroded streambanks, Water Pollution Control Station (WPCS) headworks improvements, specific pump station rehabilitation and replacements, sanitary sewer rehabilitation and reconstruction projects.
Wastewater R&R annual project allowances to account for future asset management-focused CIP project needs.
Stormwater project and R&R annual project allowances to address future complaints and needs associated with localized flooding, erosion control, and snow/ice buildup.
Support of the removal of the Gorge Dam (including in-kind service), resulting in major environmental benefit to the Cuyahoga River system.
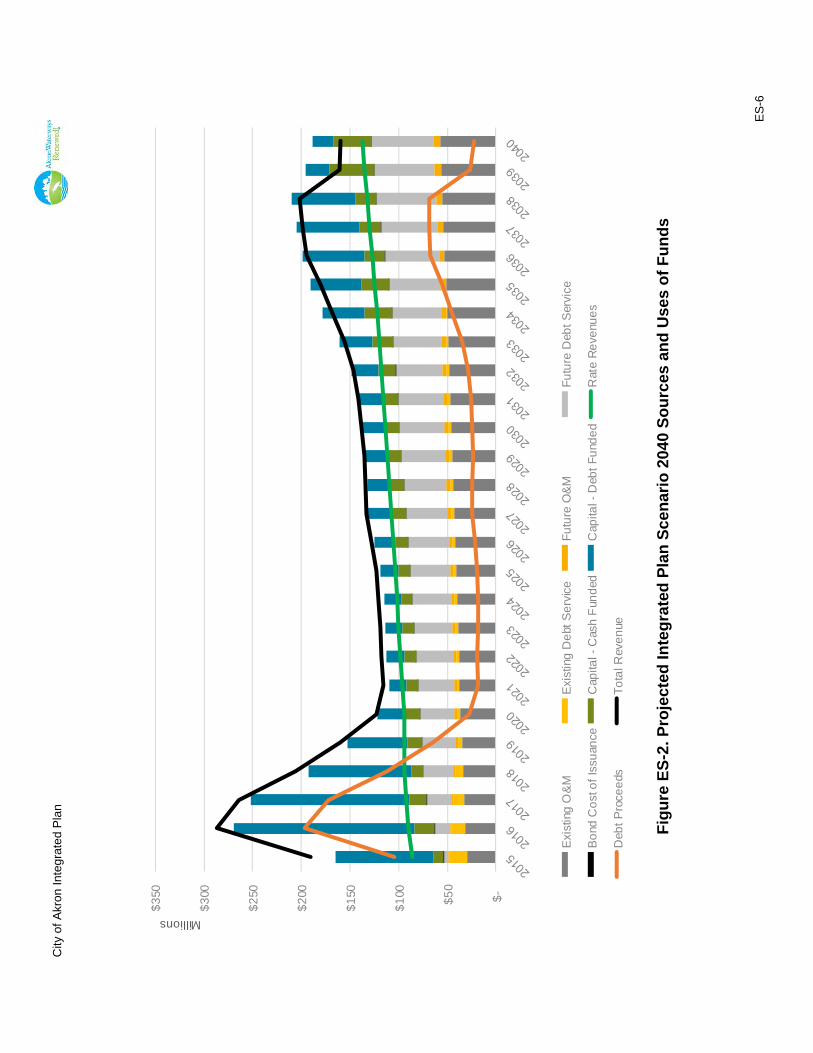
Figure ES-2 depicts the projected Integrated Plan implemented through 2040 along with sources and uses of funds.
The City developed triple bottom line (TBL) benefit criteria based on economic, environmental, and social benefit categories to measure benefits and to prioritize projects. Based on the various benefit criterion described in Section 5, Evaluating and Selecting Alternatives, the resulting projected total weighted benefit score for each project was used to priority rank the project list that schedules the highest priority projects that will fit under the City’s financial capability constraints. The benefits are further defined later in this Executive Summary.
City
of A
kro
n In
tegr
ate
d P
lan
ES
-6
$-
$5
0
$1
00
$1
50
$2
00
$2
50
$3
00
$3
50
Millions
Exi
stin
g O
&M
Exi
stin
g D
ebt
Se
rvic
eF
utu
re O
&M
Fu
ture
Deb
t S
ervi
ce
Bo
nd C
ost
of
Issu
ance
Cap
ital -
Cas
h F
und
edC
apita
l - D
ebt
Fu
nde
dR
ate
Re
venu
es
Deb
t P
roce
eds
To
tal R
eve
nue
Fig
ure
ES
-2.
Pro
ject
ed I
nte
gra
ted
Pla
n S
cen
ario
204
0 S
ou
rces
an
d U
ses
of
Fu
nd
s

City of Akron Integrated Plan
ES-7
As shown in Figure ES-3 and Appendix E, the Original LTCP Projects, or the Alternative LTCP Projects as applicable, will be completed by FY 2040. Figure ES-3 is a schematic illustration of the various CSO Rack and alternative green infrastructure-related projects being recommended in the collection system. As depicted in the legend of Figure ES-3, the CSO Rack project recommendations are illustrated with a less than full pipe for sewer separation, a partially full pipe for in-line storage, a tank for storage, a plant and Great Blue Heron for wetlands, a leaf for stormwater Best Management Practices (BMPs), a smart gate and pump are shown at the CSSF, and projects where optimized conveyance from the existing rack to the interceptor is identified with “Optimized Conveyance” and a red arrow. The full pipe capacity of the interceptor is noted, from 80 million gallons per day (MGD) upstream to 280 MGD in the downstream segments flowing to the WPCS. The performance criteria of each rack is shown in terms of overflows in the typical year.
Akron’s Integrated Plan Scenario eliminates overflows where sewer separation is proposed, achieves zero overflows at each proposed rack project, and proposes a level of control of three overflows at OCIT to eliminate the need for an enhanced high rate treatment (EHRT) facility. With the addition of controls at the Cuyahoga Street Storage Facility (CSSF), the remaining flows are reduced from the current LTCP. Even with this change in level of control, Akron’s study of water quality indicated there would be no negative impact.
Proposed Implementation Plan and Schedule for Integrated Plan Projects
The sequencing and scheduling of the Integrated Plan projects is included in a detailed Gantt chart that shows each of the Integrated Plan project’s start and completion dates. This Gantt chart is in Appendix E. The project start dates in the Gantt charts indicate when the City initiates or finalizes project spending on a particular project, opposed to a construction start date, bidding date, or Achieve Full Operation (AFO) date of a project. The project cash flows are based on a generic “S” spend curve (cost forecast is annualized normal “bell curve” distribution) unless an individualized project spend has been forecasted for a particular project. Capital costs are escalated at a 3% per year rate throughout the 2040 planning period (consistent with industry best practices).

City
of A
kro
n In
tegr
ate
d P
lan
ES
-8
ES
-3. S
chem
atic
of
the
Rec
om
men
ded
CS
O R
ack
and
Alt
ern
ativ
e G
reen
In
fras
tru
ctu
re-R
elat
ed P
roje
cts

City of Akron Integrated Plan
ES-9
Akron Integrated Plan Benefits
The benefit of extending the LTCP projects compliance dates allows the City to fund needed projects that achieve a greater environmental benefit, some sooner in the program. Benefits under the proposed Integrated Plan Scenario 2040 are measured in terms of the benefit scores assigned to each CIP project. The benefit curves for the Integrated Plan Scenario 2040 start equal to the Baseline Scenario 2040 benefit curves, but quickly exceed the Baseline Scenario 2040 benefit curves and results in greater total and environmental only benefits.
In addition to the TBL measured benefits, there are several important additional benefits for the Integrated Plan Scenario 2040, including:
Earlier reduction of CSO volume.
Reduction in secondary treatment bypass volume at the Akron WPCS sooner as compared to the current LTCP.
Improved water quality, predicted improvements in habitat and fish index scores, and more uniform dissolved oxygen (DO) concentrations associated with the Gorge Dam removal.
Improved Total Suspended Solids (TSS) and bacteria removal from stormwater flows that discharge to green infrastructure facilities and downstream BMP installation on new green infrastructure facilities.
Extending the LTCP projects compliance dates allows the City to fund needed projects that achieve a greater environmental benefit, some sooner in the program. This is provided for in both the 1997 FCA and the IPF. Benefits were measured both for total TBL benefits and environmental only benefits as shown in Figures ES-4 and ES-6, with benefits accruing to a project the year that project ends and with annual project accruing benefits each year. Both graphs start with the measured benefits approximately the same because few alternative LTCP projects are scheduled in the early years. Both curves gradually begin to diverge with the difference increasing over the planning period.

City of Akron Integrated Plan
ES-10
Figure ES-4. Akron Total TBL Benefit Curve Comparison
In the graph above, it is difficult to discern the difference between the two lines due to graphing limitations, so the following graph was produced that shows ONLY the difference between the two lines above. This clearly shows that the Integrated Plan 2040 scenario results in greater TBL benefits in every year during the planning period.
Figure ES-5. Difference in TBL Benefit Scores between Scenarios
Alternative projects in the Integrated
Plan meet the goal of greater total
benefits.

City of Akron Integrated Plan
ES-11
Figure ES-6. Akron Environmental Only TBL Benefit Curve Comparison
Similar to the previous comparison, it is difficult to discern the difference between the two lines due to graphing limitations, so the following graph was produced that shows ONLY the difference between the two lines above. This clearly shows that the Integrated Plan 2040 scenario results in greater environmental benefits in every year during the planning period.
Figure ES-7. Difference in Environmental Benefit Scores between Scenarios
Alternative projects in the Integrated Plan Scenario 2040 meet the goal of equal or
greater environmental benefits.

City of Akron Integrated Plan
ES-12
Adaptive Management
The City proposes to implement the Integrated Plan using an adaptive management approach to continuously improve the City’s decision-making process. As new or additional data is acquired through such things as expanded flow monitoring, water quality monitoring, asset management analyses, and advanced and/or innovative technology evaluation, this information will be used to refine future project planning, design, and implementation steps. Adaptive management is a key element in implementing better projects, especially for new or innovative green infrastructure projects where program results are needed to refine subsequent project designs. On a system-wide level, adaptive management will allow the City to demonstrate that it is achieving the greatest and earliest project benefits at an affordable cost.
Conclusion
The results of this IPF process, as presented in Section 6, Integrated Planning Results, include a recommended alternative LTCP projects, re-sequencing of other LTCP projects, incorporation of wastewater and stormwater repair and rehabilitation annual projects, and some additional recommendations that result in equal or better environmental benefits at a more affordable cost for Akron ratepayers. The City of Akron Integrated Plan has the following benefits:
1. Achieves equal or better environmental protection compared to the Original LTCP projects based upon the same compliance schedule, and provides a scenario that results in equal compliance with water quality standards in receiving streams.
2. Includes a financial plan that provides funding for completion of the Integrated Plan’s projects with gradual sewer rate increases through the year 2040.
3. Includes a repair and replace asset management budget to adequately support the maintenance and operation of Akron’s sewer system into the future.
In addition the proposed City of Akron Integrated Plan provides a significant opportunity for the City to:
Implement a plan that, although still unaffordable, reduces the Residential Indicator for the service area from 2.64% to 2.34% and for Akron only from 2.91% to 2.49%.
Reduce the cost of the LTCP by approximately $300 million.
Include priority stormwater projects that provide public health protection through the introduction of new environmental benefits.
Include a sustainable rehabilitation and replacement asset management budget to adequately support the maintenance and operation of Akron’s sewer system into the future.
Implement the requirements of the City's LTCP over an extended time period while still enabling the City to make needed investments to its wastewater and stormwater systems in a more financially sustainable manner.
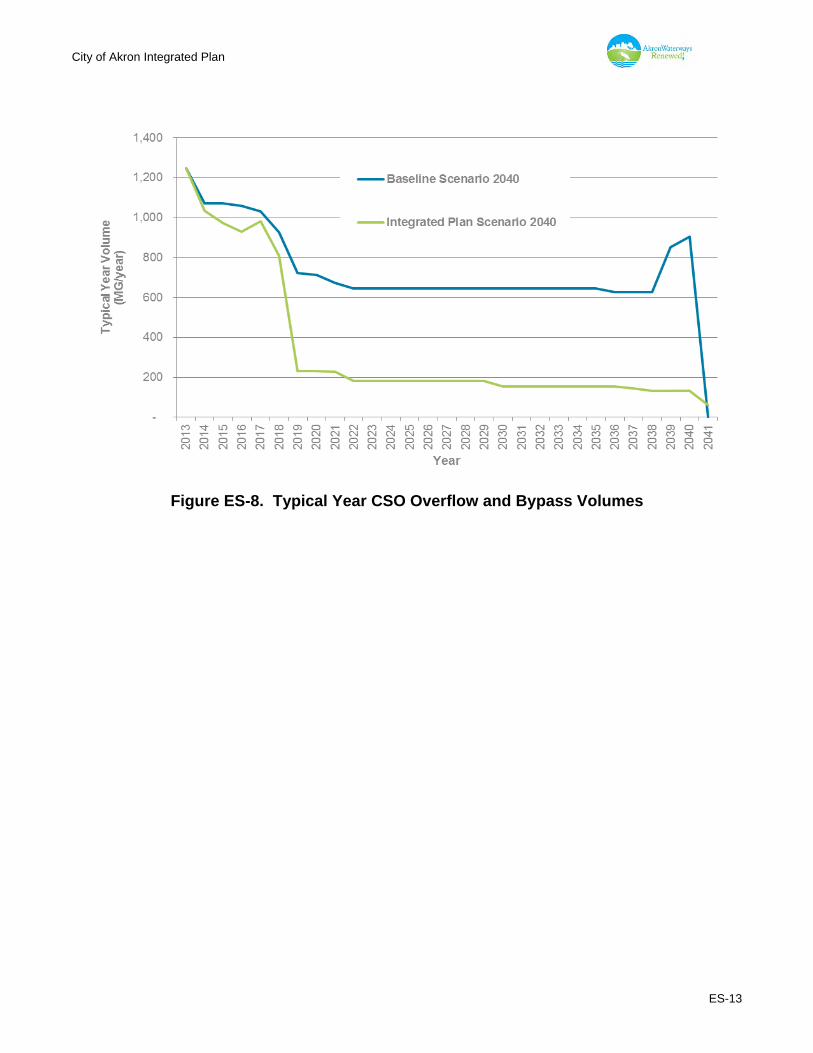
Most importantly, implements better environmental benefits that meet the water quality criteria for the receiving streams by removing 11 billion gallons (BG) of CSOs and secondary treatment bypasses earlier, as shown in Figure ES-8.
City of Akron Integrated Plan
ES-13
Figure ES-8. Typical Year CSO Overflow and Bypass Volumes
City of Akron Integrated Plan
i
TABLE OF CONTENTS
ACRONYMS AND ABBREVIATIONS…………………………………………………………………v
1.0 INTRODUCTION TO AKRON’S INTEGRATED PLAN .................................................. 1-1 1.1 Akron Integrated Plan Need ................................................................................. 1-2
1.1.1 Economic Situation ................................................................................... 1-2 1.1.2 Rate Payer Impacts .................................................................................. 1-3
1.2 Integrated Plan Development ............................................................................... 1-4 1.3 Akron's Guiding Principles for Integrated Planning ............................................... 1-6 1.4 Elements of the Integrated Plan ............................................................................ 1-7
2.0 WATER QUALITY, PUBLIC HEALTH, AND REGULATORY ISSUES ......................... 2-1 2.1 Cuyahoga and Tuscarawas River Watersheds Water Quality Issues .................... 2-1
2.1.1 Integrated Report and Total Maximum Daily Loads (TMDLs) .................... 2-4 2.1.2 Aquatic Life Use Impairments ................................................................... 2-5 2.1.3 Recreational Use Impairments ................................................................ 2-10 2.1.4 Existing E. coli Data from 2007 to 2014 .................................................. 2-13 2.1.5 Akron Waterways Renewed Sampling Data (2014) ................................. 2-18 2.1.6 Water Quality Model Development and Calibration ................................. 2-21 2.1.7 Bacteria Sources to the Cuyahoga River ................................................. 2-28 2.1.8 Bacteria Sources in the Upper Cuyahoga River Watershed .................... 2-29 2.1.9 Bacteria Sources in the Middle Cuyahoga River Watershed ................... 2-30 2.1.10 Bacteria Sources in the Little Cuyahoga River Watershed ...................... 2-30 2.1.11 Bacteria Sources in the Lower Cuyahoga Watershed ............................. 2-31
2.2 Challenges in Meeting Current and Future CWA Requirements ......................... 2-33 2.2.1 National Pollutant Discharge Elimination System Permit (NPDES) ......... 2-33 2.2.2 Consent Decree ...................................................................................... 2-33 2.2.3 CSO Control Policy ................................................................................. 2-33 2.2.4 Nutrient Control and Phosphorus Reduction ........................................... 2-34
2.3 Stormwater Regulations ..................................................................................... 2-35 2.4 Public Health Threats ......................................................................................... 2-36
2.4.1 Sensitive Areas ....................................................................................... 2-37 2.4.2 Metrics for Evaluating and Meeting Public Health and Water Quality
Objectives ............................................................................................... 2-37
3.0 EXISTING SYSTEMS & PERFORMANCE .................................................................... 3-1 3.1 Wastewater System .............................................................................................. 3-1
3.1.1 Wastewater Service Area .......................................................................... 3-1 3.1.2 Wastewater Infrastructure ......................................................................... 3-2 3.1.3 Wastewater Treatment Plant Performance .............................................. 3-10 3.1.4 Combined and Separate Sanitary Sewer System Performance .............. 3-11 3.1.5 Five-Year Cleaning and Inspection Cycle and Findings .......................... 3-14
3.2 Stormwater Conveyance System ........................................................................ 3-17 3.2.1 Inspections .............................................................................................. 3-17 3.2.2 Construction Program ............................................................................. 3-18
4.0 STAKEHOLDER INVOLVEMENT ................................................................................. 4-1 4.1 Communications Plan ........................................................................................... 4-1 4.2 USEPA Communication Guidelines ...................................................................... 4-1
4.2.1 Akron Waterways Renewed! Public Outreach ........................................... 4-5
City of Akron Integrated Plan
ii
4.2.2 Integrated Plan Stakeholder Group ........................................................... 4-6 4.3 Integrated Plan Stakeholder Involvement ............................................................. 4-8
4.3.1 Meetings ................................................................................................... 4-8 4.3.2 Correspondence ....................................................................................... 4-8 4.3.3 Stakeholder SharePoint Site ..................................................................... 4-9 4.3.4 Green Infrastructure Evaluation Assistance ............................................ 4-10
4.4 Future Integrated Plan Stakeholder Involvement ................................................ 4-11
5.0 EVALUATING AND SELECTING ALTERNATIVES...................................................... 5-1 5.1 Capital and Alternative Project Development ........................................................ 5-1 5.2 Development of Integrated Plan Scenarios ......................................................... 5-13 5.3 Benefit Measurements for Project Prioritization .................................................. 5-17 5.4 Financial Constraints .......................................................................................... 5-19 5.5 Project Prioritization and Scheduling .................................................................. 5-23 5.6 Affordability Analysis .......................................................................................... 5-23
6.0 INTEGRATED PLANNING RESULTS .......................................................................... 6-1 6.1 Improved Financial Affordability ............................................................................ 6-1 6.2 Enhanced Triple Bottom Line Measured Benefits ................................................. 6-6 6.3 Equal or Greater Environmental Benefit ............................................................... 6-7
6.3.1 Environmental Triple Bottom Line Benefit ................................................. 6-8 6.3.2 Overflow and Bypass Volume Reduction Over Time ................................. 6-9 6.3.3 Receiving Water Quality Scenario Evaluation ......................................... 6-11
6.4 Integrated Plan Scenario 2040 ........................................................................... 6-19
7.0 MEASURING SUCCESS ............................................................................................... 7-1 7.1 Consent Decree Post-Construction Monitoring Requirements .............................. 7-1 7.2 Proposed Post-Construction Monitoring Requirements ........................................ 7-1
7.2.1 CSO Control ............................................................................................. 7-2 7.2.2 Green Infrastructure .................................................................................. 7-2 7.2.3 Ambient Stream Sampling ........................................................................ 7-4
8.0 IMPROVING THE PLAN ............................................................................................... 8-1 8.1 Adaptive Management Approach .......................................................................... 8-1 8.2 Moving Forward .................................................................................................... 8-2
Figures Figure 1-1. Annual Sewer Rate Increases ................................................................................................ 1-3 Figure 2-1. Cuyahoga River and Tuscarawas River Watershed Location Map........................................ 2-2 Figure 2-2. Upper, Middle, and Lower Cuyahoga River Subbasins and Watersheds .............................. 2-3 Figure 2-3. Locations of Dams in the Cuyahoga River Watershed .......................................................... 2-7 Figure 2-4. Cuyahoga River IBI Scores Downstream of Tinkers Creek (RM 16), 1984 – 2008 .............. 2-9 Figure 2-5. Cuyahoga River MIwb Scores Downstream of Tinkers Creek (RM 16), 1984 - 2008 ........... 2-9 Figure 2-6. Recreational Water Quality Use Designations in Akron and CSO Rack Locations ............ 2-12 Figure 2-7. Non-Attainment of Recreational Uses in the Cuyahoga River Watershed .......................... 2-13 Figure 2-8. Sampling Locations and Recreation Season E. coli Existing Data ...................................... 2-14 Figure 2-9. Legend for “Box and Whisker” Graphs ................................................................................. 2-15 Figure 2-10. Existing Data for the Cuyahoga River, Little Cuyahoga River, and Ohio Canal (2008 to 2014)
.............................................................................................................................................. 2-17 Figure 2-11. AWR Sampling Locations for 2014 ...................................................................................... 2-18

City of Akron Integrated Plan
iii
Figure 2-12. Recreation Season E. coli Data from the AWR Sampling (2014) ........................................ 2-19 Figure 2-13. Modeling Framework ............................................................................................................ 2-21 Figure 2-14. Receiving Water Quality Modeling Domain .......................................................................... 2-23 Figure 2-15. Time Series Plot of Predicted and Measured Water Surface Elevation at USGS Gauge on
Cuyahoga River at Old Portage OH (04206000) (August through October 2014) .............. 2-24 Figure 2-16. Locations Used in Receiving Water Quality Model Calibration ............................................ 2-25 Figure 2-17. Predicted and Measured Bacteria Densities at Station 901 on the Cuyahoga River just
downstream of WPCS (August through October 2014) ....................................................... 2-26 Figure 2-18. Predicted and Measured Bacteria Densities at Station 805 on the Ohio Canal just upstream
of the Little Cuyahoga River (August through October 2014) ............................................. 2-26 Figure 2-19. Predicted and Measured Bacteria Densities at Station IP4 on the Little Cuyahoga River just
before Confluence with the Ohio Canal (August through October 2014) ............................. 2-27 Figure 2-20. Predicted and Measured Bacteria at Station IP3 on Camp Brook Located just before
Confluence with the Little Cuyahoga River (August through October 2014) ...................... 2-27 Figure 2-21. Potential Bacteria Sources in the Upper Cuyahoga River Watershed ................................. 2-29 Figure 2-22. Potential Bacteria Sources in the Middle Cuyahoga River Watershed ................................ 2-31 Figure 2-23. Potential Bacteria Sources in the Lower Cuyahoga River Watersheds ............................... 2-32 Figure 3-1. Akron’s Wastewater Service Area .......................................................................................... 3-2 Figure 3-2. Akron’s Wastewater Collection System .................................................................................. 3-3 Figure 3-3. Combined System Flows ........................................................................................................ 3-5 Figure 3-4. Akron WPCS Facility Site Map ............................................................................................... 3-7 Figure 3-5. Akron WPCS Process Flow .................................................................................................... 3-9 Figure 3-6. SSOs, CSS Releases, and Property Backups Due to Mainline Blockages (2005 – June 30,
2015) ..................................................................................................................................... 3-13 Figure 3-7. I/I Conditions of Small Diameter Gravity Sewers ................................................................. 3-16 Figure 3-8. I/I Conditions of Large Diameter Gravity Sewers ................................................................. 3-16 Figure 3-9. Overall Condition of Akron’s Manholes ................................................................................ 3-16 Figure 3-10. I/I Observations in Akron’s Manholes ................................................................................... 3-16 Figure 4-1. Generic Time Line Illustrating Stakeholder Involvement ........................................................ 4-3 Figure 4-2. Akron Waterways Renewed! Public Website ......................................................................... 4-4 Figure 4-3. Integrated Plan Stakeholders Group and Subcommittees ..................................................... 4-6 Figure 4-4. Stakeholders SharePoint Site............................................................................................... 4-10 Figure 5-1. Akron Integrated Planning Process Schematic ...................................................................... 5-1 Figure 5-2. Project Types for the LTCP Update 2011 .............................................................................. 5-5 Figure 5-3. Project Types for the Integrated Plan 2040 ............................................................................ 5-6 Figure 5-4. Final Integrated Plan Scenario 2040 Schematic .................................................................. 5-15 Figure 5-5. Akron TBL Criterion Importance Weights ............................................................................. 5-18 Figure 5-6. Cumulative Rate Increases Required to Fund Scenarios .................................................... 5-21 Figure 5-7. Funding Availability for Capital Costs ................................................................................... 5-22 Figure 6-1. Projected Baseline Scenario 2040 Sources and Uses of Funds ............................................ 6-3 Figure 6-2. Projected Integrated Plan Scenario 2040 Sources and Uses of Funds ................................. 6-4 Figure 6-3. Integrated Plan Scenario 2040 Annual Capital Expenditures by Project Type ...................... 6-5 Figure 6-4. Akron Total TBL Benefit Curve Comparison .......................................................................... 6-6 Figure 6-5. Difference in TBL Benefit Scores between Scenarios ........................................................... 6-7 Figure 6-6. Akron Environmental Only TBL Benefit Curve Comparison ................................................... 6-8 Figure 6-7. Difference in Environmental Benefit Scores between Scenarios ........................................... 6-9 Figure 6-8. Akron WPCS Enhanced LTCP Configuration Flow Schematic ............................................ 6-10 Figure 6-9. Predicted CSO Typical Year Reduction Achieved Over Time ............................................. 6-11 Figure 6-10. Water Quality Model Output Locations ................................................................................. 6-12 Figure 6-11. Predicted Percent of Days Bacteria is Greater Than 298 cfu/100 mL in Cuyahoga River... 6-13 Figure 6-12. Predicted Percent of Days Bacteria is Greater Than 523 cfu/100 mL in Little Cuyahoga River
.............................................................................................................................................. 6-14 Figure 6-13. Predicted Percent of Days Bacteria is Greater Than 523 cfu/100 mL in Ohio Canal .......... 6-14 Figure 6-14. Predicted Percent of Days Bacteria is Greater Than 523 cfu/100 mL in Camp Brook ........ 6-15

City of Akron Integrated Plan
iv
Figure 6-15. Predicted E. coli Contributions of Only CSOs in Cuyahoga River (Distilled Water Test)..... 6-17 Figure 6-16. Predicted E. coli Contributions of Only CSOs in Little Cuyahoga River (Distilled Water Test) 6-
17 Figure 6-17. Predicted E. coli Contributions of Only CSOs in Ohio Canal (Distilled Water Test) ........... 6-18 Figure 6-18. Predicted E. coli Contributions of Only CSOs in Camp Brook (Distilled Water Test) .......... 6-18 Figure 8-1. Akron’s Adaptive Management Approach .............................................................................. 8-2
Tables Table 1-1. USEPA IPF Element and Akron’s Integrated Plan Crosswalk ............................................... 1-8 Table 2-1. Total Maximum Daily Loads for the Cuyahoga River and Tuscarawas River Watersheds.... 2-5 Table 2-2. Recommended Implementation Actions for the Cuyahoga River and Tuscarawas River
Watersheds............................................................................................................................. 2-6 Table 2-3. Ohio’s E. coli Standards Related to Recreational Use ......................................................... 2-11 Table 2-4. Existing Data for the Cuyahoga River from 2008 to 2014 .................................................... 2-15 Table 2-5. Existing Data for the Little Cuyahoga River from 2010 to 2014 ........................................... 2-16 Table 2-6. Existing Data for the Ohio Canal from 2010 to 2015 ............................................................ 2-16 Table 2-7. Recreation Season E. coli Data from the AWR Sampling (2014) for the Cuyahoga River . 2-20 Table 2-8. Recreation Season E. coli Data from the AWR Sampling (2014) for the Little Cuyahoga River
.............................................................................................................................................. 2-20 Table 2-9. Recreation Season E. coli Data from the AWR Sampling (2014) for the Ohio Canal ......... 2-20 Table 2-10. Recreation Season E. coli Data from the AWR Sampling (2014) for Camp Brook ............. 2-20 Table 2-11. Instream Public Health and Water Quality Objective Metrics ............................................... 2-37 Table 3-1. Master Meter Communities in the Akron Service Area .......................................................... 3-1 Table 3-2. Akron’s Pump Stations ........................................................................................................... 3-4 Table 3-3. Akron’s NACWA and OWEA Performance Awards ............................................................. 3-10 Table 3-4. Akron’s CSO Racks .............................................................................................................. 3-11 Table 3-5. Cleaning and Inspection Progress During First Cycle (2010-2014) ..................................... 3-14 Table 3-6. Gravity Sewer Structural Grade Condition Summary ........................................................... 3-15 Table 3-7. Summary of Acute Defect Repairs Performed ..................................................................... 3-15 Table 4-1. Stakeholder Involvement Program Components.................................................................... 4-2 Table 4-2. 2015 Akron Waterways Renewed! Public Outreach Events .................................................. 4-5 Table 4-3. Integrated Plan Stakeholder Groups and Subcommittees ..................................................... 4-7 Table 4-4. Integrated Plan Stakeholder Meetings ................................................................................... 4-9 Table 5-1. LTCP Project and LTCP Alternative Project Listing ............................................................... 5-7 Table 5-2. Summary of FCA Residential Indicators .............................................................................. 5-14 Table 5-3. Financial Model Inputs and Outputs ..................................................................................... 5-20 Table 5-4. Capital Improvement Collection and Treatment Expenditures, 2008 to 2014 ..................... 5-20 Table 7-1. Metrics for Evaluating and Meeting Public Health and Water Quality Objectives ................. 7-4
Appendices Appendix A - Integrated Plan Prioritized Project List Appendix B - Akron Integrated Plan Triple Bottom Line Scoring Definitions Appendix C - Integrated Plan Project Descriptions Appendix D - Schedule Constraints Appendix E - Integrated Plan Scenario 2040 Gantt Chart Appendix F - Baseline Scenario 2040 Gantt Chart
City of Akron Integrated Plan
v
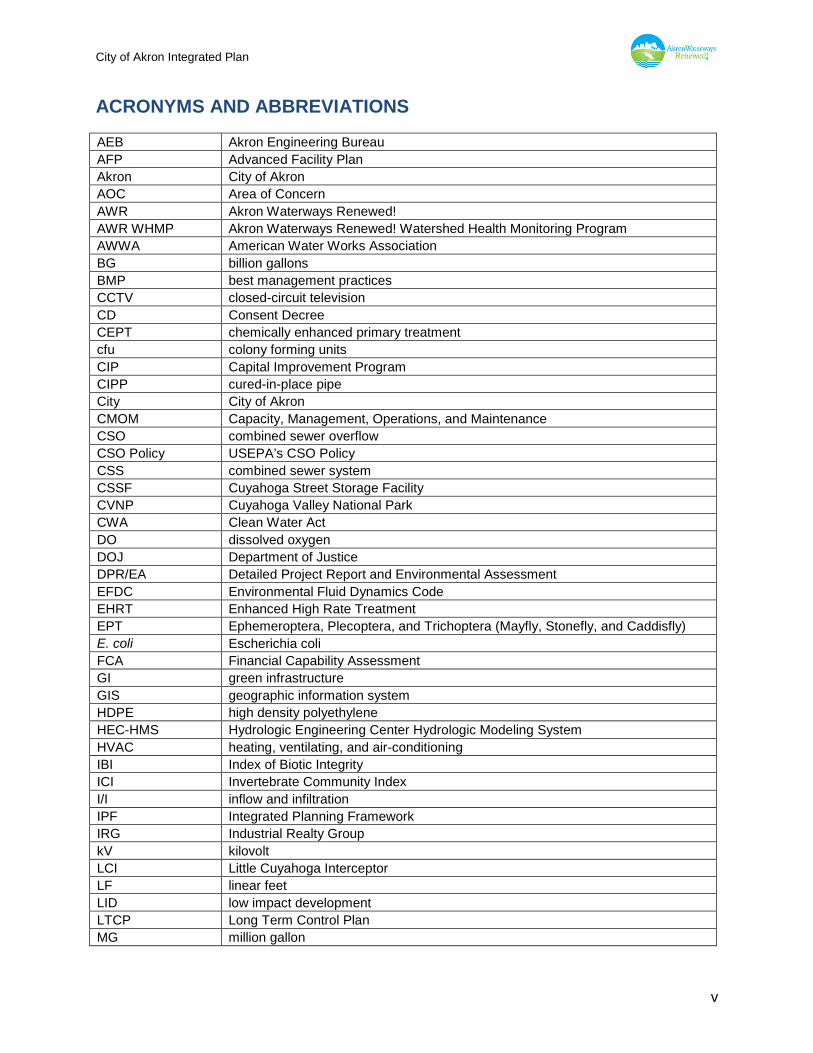
ACRONYMS AND ABBREVIATIONS
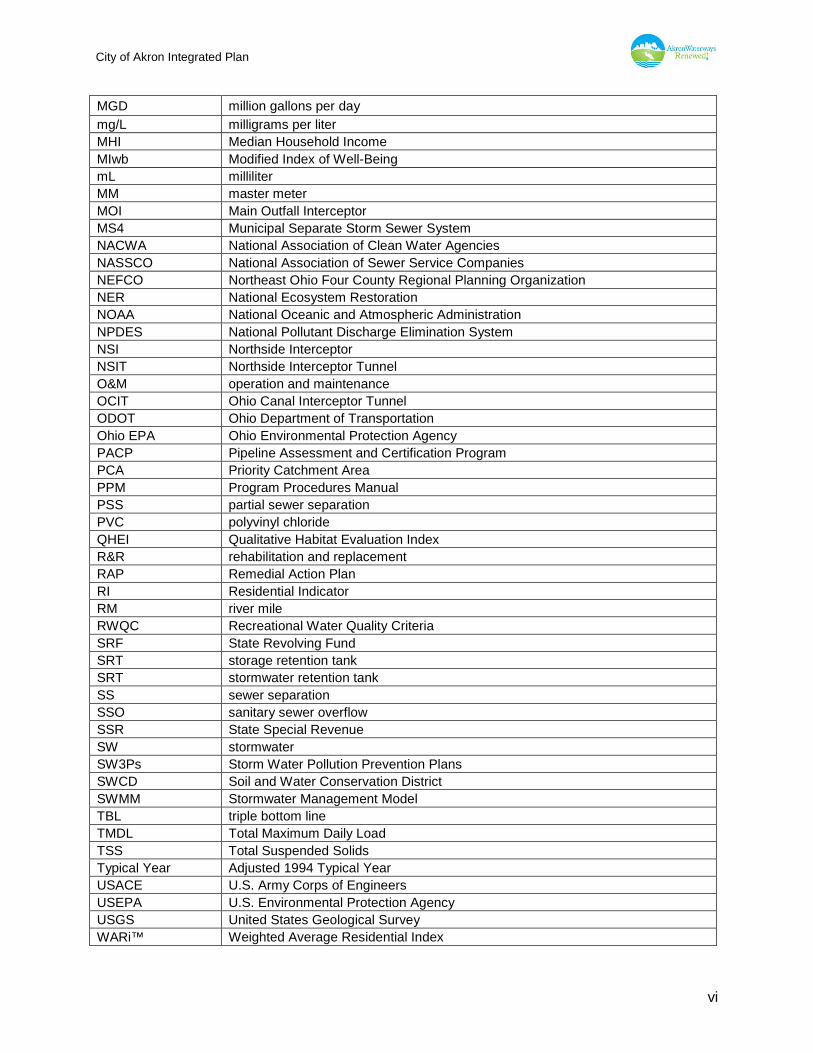
AEB Akron Engineering Bureau AFP Advanced Facility Plan Akron City of Akron AOC Area of Concern AWR Akron Waterways Renewed! AWR WHMP Akron Waterways Renewed! Watershed Health Monitoring Program AWWA American Water Works Association BG billion gallons BMP best management practices CCTV closed-circuit television CD Consent Decree CEPT chemically enhanced primary treatment cfu colony forming units CIP Capital Improvement Program CIPP cured-in-place pipe City City of Akron CMOM Capacity, Management, Operations, and Maintenance CSO combined sewer overflow CSO Policy USEPA’s CSO Policy CSS combined sewer system CSSF Cuyahoga Street Storage Facility CVNP Cuyahoga Valley National Park CWA Clean Water Act DO dissolved oxygen DOJ Department of Justice DPR/EA Detailed Project Report and Environmental Assessment EFDC Environmental Fluid Dynamics Code EHRT Enhanced High Rate Treatment EPT Ephemeroptera, Plecoptera, and Trichoptera (Mayfly, Stonefly, and Caddisfly) E. coli Escherichia coli FCA Financial Capability Assessment GI green infrastructure GIS geographic information system HDPE high density polyethylene HEC-HMS Hydrologic Engineering Center Hydrologic Modeling System HVAC heating, ventilating, and air-conditioning IBI Index of Biotic Integrity ICI Invertebrate Community Index I/I inflow and infiltration IPF Integrated Planning Framework IRG Industrial Realty Group kV kilovolt LCI Little Cuyahoga Interceptor LF linear feet LID low impact development LTCP Long Term Control Plan MG million gallon
City of Akron Integrated Plan
vi
MGD million gallons per day
mg/L milligrams per liter MHI Median Household Income MIwb Modified Index of Well-Being mL milliliter MM master meter MOI Main Outfall Interceptor MS4 Municipal Separate Storm Sewer System NACWA National Association of Clean Water Agencies NASSCO National Association of Sewer Service Companies NEFCO Northeast Ohio Four County Regional Planning Organization NER National Ecosystem Restoration NOAA National Oceanic and Atmospheric Administration NPDES National Pollutant Discharge Elimination System NSI Northside Interceptor NSIT Northside Interceptor Tunnel O&M operation and maintenance OCIT Ohio Canal Interceptor Tunnel ODOT Ohio Department of Transportation Ohio EPA Ohio Environmental Protection Agency PACP Pipeline Assessment and Certification Program PCA Priority Catchment Area PPM Program Procedures Manual PSS partial sewer separation PVC polyvinyl chloride QHEI Qualitative Habitat Evaluation Index R&R rehabilitation and replacement RAP Remedial Action Plan RI Residential Indicator RM river mile RWQC Recreational Water Quality Criteria SRF State Revolving Fund SRT storage retention tank SRT stormwater retention tank SS sewer separation SSO sanitary sewer overflow SSR State Special Revenue SW stormwater SW3Ps Storm Water Pollution Prevention Plans SWCD Soil and Water Conservation District SWMM Stormwater Management Model TBL triple bottom line TMDL Total Maximum Daily Load TSS Total Suspended Solids Typical Year Adjusted 1994 Typical Year USACE U.S. Army Corps of Engineers USEPA U.S. Environmental Protection Agency USGS United States Geological Survey WARi™ Weighted Average Residential Index
City of Akron Integrated Plan
vii
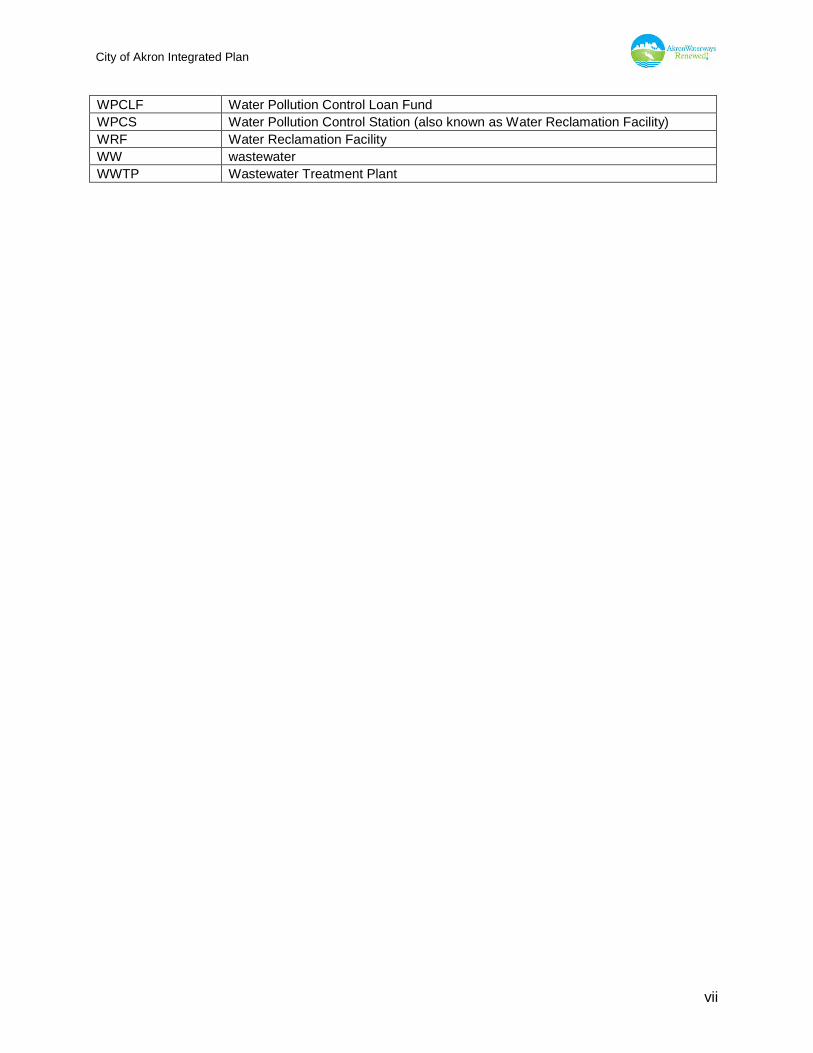
WPCLF Water Pollution Control Loan Fund WPCS Water Pollution Control Station (also known as Water Reclamation Facility) WRF Water Reclamation Facility WW wastewater WWTP Wastewater Treatment Plant

City of Akron Integrated Plan
1-1
1.0 INTRODUCTION TO AKRON’S INTEGRATED PLAN
With municipalities facing financial constraints and multiple regulatory requirements, the U.S. Environmental Protection Agency (USEPA) created an Integrated Planning Framework (IPF) to provide flexibility to communities in their efforts to meet the public health and water quality objectives of the Clean Water Act (CWA). The guidance document for the IPF was issued June 2012.1
This Integrated Plan was prepared in accordance with USEPA’s Integrated Municipal Stormwater and Wastewater Planning Approach Framework, which was published by USEPA on June 5, 2012 (IPF). As stated by USEPA within the IPF:
Integrated Planning will assist municipalities on their critical paths to achieving the human health and water quality objectives of the Clean Water Act by identifying efficiencies and implementing requirements that arise from district wastewater and stormwater programs, including how to best prioritize capital investments. Integrated planning can also facilitate the use of sustainable and comprehensive solutions, including green infrastructure, that protect human health, improve water quality, manage storm waters as a resource, and support other economic benefits and quality of life attributes that enhance the vitality of communities.
Since publishing the IPF in June 2012, USEPA has issued additional IPF guidance. On July 15, 2013 USEPA issued its guidance, Frequently Asked Questions on Integrated Municipal Stormwater and Wastewater Planning, which made it clear that a municipality that is already subject to an existing federal Consent Decree, like Akron, may re-examine its remedy and the affordability of the remedy under the IPF. In addition, on November 24, 2014, USEPA issued a guidance on Financial Capability Assessment Framework for Municipal Clean Water Act Requirements. In this 2014 guidance, USEPA reaffirmed that under the IPF, the financial capability assessment can include the following costs: stormwater and wastewater ongoing asset management or system rehabilitation programs; CWA related capital improvement programs; collection systems and treatment facilities; and other CWA obligations required by state or other regulators.
The IPF allows for the identification of efficiencies within the sometimes overlapping and competing requirements that arise from distinct wastewater and stormwater programs. Additionally, USEPA’s IPF guidance document encourages the use of sustainable green infrastructure to protect public health, improve water quality, manage stormwater, and support economic and quality of life benefits that enhance community vitality.
1 USEPA. May 2012 (issued June 5, 2012). Integrated Municipal Stormwater and Wastewater Planning Approach Framework.

City of Akron Integrated Plan
1-2
For the City of Akron (referred to as “City” or “Akron” in this report), Consent Decree (CD) requirements and associated Long Term Control Plan (LTCP) projects became more unaffordable according to the affordability criteria under the National Combined Sewer Overflow (CSO) Policy, which necessitated the development of an Integrated Plan.2 This IPF process is an effort to better assess the financial and other impacts of the LTCP in the context of other wastewater and stormwater capital asset and operational requirements the City is facing over the CD planning period. The results of this IPF process, as presented in Section 6, Integrated Planning Results, include a recommended alternative set of LTCP projects, re-sequencing of LTCP projects, incorporation of wastewater and stormwater repair and rehabilitation annual projects, and additional recommendations that result in equal or better environmental benefits at a less unaffordable cost for Akron ratepayers.
1.1 Akron Integrated Plan Need The City faces a major financial burden to comply with the CWA under the terms of its CD requiring implementation of various LTCP projects to improve wastewater collection and treatment and CSOs.3 The cost to implement the LTCP Projects is currently over $1.14 billion (2014 dollars). In addition to this staggering cost, the City also has ongoing operation and maintenance, capital investment, and debt service costs related to its wastewater and stormwater systems. The financial impact of implementing CD and LTCP projects creates an unreasonable burden for the City’s ratepayers and limits the City’s ability to fund critical infrastructure renewal, stormwater management and control, and other projects to meet environmental needs.
1.1.1 Economic Situation
By any reasonable measure, the economic setting in the City is financially constrained. This is evidenced by:
A declining population.4, 5
An unemployment rate that is higher than the national average.6
A poverty rate that is significantly higher than the Ohio and national levels.7, 8
A Median Household Income (MHI) that is lower than the Ohio and national levels.9
An income distribution that is unevenly weighted towards lower levels (a higher percentage in lower income groups and a lower percentage in higher income groups) when compared to national statistics.10, 11
2 For purposes of this report, “LTCP” or “LTCP Projects” are used to refer to projects required by the CD and the LTCP Update 2011 3 United States of America v. The City of Akron, Ohio, and the State of Ohio. Civil Action No. 5:09-cv-00272-JRA. Filed November 13, 2009, Consent Decree entered January 17, 2014. 4 U.S. Census Bureau. 2013 Population Estimates, City and Town Totals: Vintage 2013. Akron City OH. 5 L. Ledebur and J. Taylor. 2008 .A Restoring Prosperity Case Study: Akron, Ohio. Brookings Institution Press. 6 Bureau of Labor Statistics. 2013. Local Area Unemployment Statistics. Akron City OH. 7 U.S. Census Bureau. 2010-2012. ACS 3-Year Estimates, Table S1701, Akron City OH. 8 U.S. Census Bureau. 2012. Social Economic and Housing Statistics Division. 9 U.S. Census Bureau. 2010-2012. ACS 3-Year Estimates. Table DP03. Akron City OH.

City of Akron Integrated Plan
1-3
The City has taken aggressive steps to fund the LTCP Projects and other costs of the City’s wastewater and stormwater systems. In just the past ten years alone, the City has raised sewer rates over 269% as shown in Figure 1-1. However, even with such aggressive rate increases, the City will still not be able to pay for the cost of the current LTCP Projects and the additional costs associated with the City’s wastewater and stormwater systems without integrating and prioritizing all of the wastewater and storm costs, and simultaneously developing and implementing sustainable and cost saving solutions, such as green infrastructure controls, in-line storage and increased conveyance.
HCF = hundred cubic feet
Figure 1-1. Annual Sewer Rate Increases
1.1.2 Rate Payer Impacts
Compounding the City’s stressed economic conditions, the projected costs associated with a number of the CD- and LTCP-mandated projects have escalated as documented in the City’s Financial Capability Assessment (FCA).12 The purpose of the FCA is to document the aggregate and household unit costs, calculate cost per household as a percentage of service area MHI, and evaluate the financial capability of the community in terms of capacity to pay for these required capital improvements. Various interim drafts of the FCA were submitted to USEPA on July 16, 2014 and September 11, 2014. The latest FCA incorporates Master Meter
10 U.S. Census Bureau. 2010-2012. ACS 3-Year Estimates. Table B19001. Akron City OH. 11 U.S. Census Bureau. 2010-2012. ACS 3-Year Estimates. Table B19080. Akron City OH. 12 City of Akron. August 2015. Financial Capability Assessment.
City of Akron Integrated Plan
1-4
(MM) customer information in the affordability calculations as requested by USEPA and is being prepared for submittal following this report.
The updated FCA demonstrates that the Original LTCP Projects, coupled with the Non-LTCP Projects and Annual Projects under the current deadline of 2027, result in a total residential indicator (RI) of 2.46% of MHI for the Akron service area. Importantly, this amount is well above USEPA’s “high financial impact” threshold of 2% of MHI. However, the RI is only part of the total FCA. The remaining analysis under the FCA further demonstrates that the City falls under the High Burden category.
USEPA’s 1997 FCA Guidance also encourages municipalities “to submit any additional documentation that would create a more accurate and complete picture of their financial capability. . .” As a result, the City’s FCA also includes a Weighted Average Residential index (WARi™) analysis, in which census tracks within the City of Akron are analyzed. This analysis determined that households in several sections of the City face an impact of 2.1% to 9.5% of their MHI. Poverty rates in the City have been relatively high in recent years. The U.S. Census Bureau defined the poverty threshold for a family of four at $23,834 in 2013.13 In 2013, 27.8% of the population in the City was reported below the poverty level, including 41.3% of children under the age of 18 years old.14 This is obviously an unacceptable burden under any measure.
This recent analysis shows that the City’s CD program is even more unaffordable for Akron ratepayers, which is one key reason that the City is developing this Integrated Plan. Specifically, the Integrated Plan is intended to identify affordable alternatives that achieve the same or better environmental benefits.
1.2 Integrated Plan Development Through ongoing discussions with USEPA, U.S. Department of Justice (DOJ), and Ohio Environmental Protection Agency (Ohio EPA) representatives regarding the economic conditions, the escalating costs, and the alternative LTCP project identifications, the City determined that development of an Integrated Plan was appropriate to properly prioritize and schedule needed projects in recognition of the City’s financial constraints.
It is important to recognize that the original list of LTCP projects was developed prior to the 2012 publication of USEPA’s IPF guidelines. As part of Akron’s integrated planning efforts, the City reevaluated the LTCP projects by applying the broader flexibility, the improved engineering data, and the green infrastructure solutions that are included in USEPA’s IPF guidelines. This report presents the resulting Akron Integrated Plan.
The purpose of this report is to clearly identify and explain the following:
Additional CWA obligations, such as National Pollutant Discharge Elimination System (NPDES) permit and Municipal Separate Storm Sewer System (MS4) permit-required projects that Akron must meet in addition to the CD- and LTCP-mandated projects and the on-going asset management and renewal and replacement activities of the utility. In short, the additional CWA obligations must be integrated into Akron’s overall financial planning.
13 U.S. Census Bureau. Social Economic and Housing Statistics Division, Poverty Thresholds for 2013. 14 U.S. Census Bureau. 2011-2013 ACS 3-Year Estimates, Table S1701, Akron City, OH.
City of Akron Integrated Plan
1-5
The methodology used in the development of the Akron Integrated Plan and the resulting prioritized project list and project sequencing recommendations.
The methodology used to measure projected triple bottom line (TBL) benefits demonstrating greater and/or earlier benefits to the public and the environment.
A description of the proposed changes to the existing LTCP projects and how they will provide greater and/or earlier benefits to public health and water quality.
In undertaking this integrated planning effort, Akron developed a financial model and various project scenarios using the 2027 compliance schedule for the LTCP Projects. The financial model indicated that the projects could not be funded in this timeframe without significant additional rate increases (48%) over a relatively short period. The cost for the total wastewater and stormwater systems, with a 2027 deadline for the LTCP projects, is clearly unaffordable.
As a result of the need for a longer schedule, the City evaluated the costs based upon a 13 year extension to the deadline for the LTCP Projects. The City’s analysis showed that the Original LTCP projects with a new deadline of 2040, along with the Non-LTCP projects and Annual projects, still could not be funded without significant rate increases (80%) over this extended period. Thus, even if the LTCP project deadline is extended by an additional 13 years to 2040, the total wastewater and stormwater costs are still unaffordable.
The updated FCA demonstrates that the Original LTCP Projects, coupled with the Non-LTCP Projects and Annual Projects under the extended deadline of 2040, result in a total RI of 2.64% of the MHI for the Akron service area. In addition to the updated FCA analyses, the City is refining and updating CD and LTCP projects based on the collection system’s hydraulic performance after completion of the first cleaning and inspection cycle of the CD-required Capacity, Management, Operations, and Maintenance (CMOM) program. Section 3, Existing Systems & Performance, will show that Akron’s system performance in terms of sewer overflows caused by mainline blockages is at top quartile performance levels according to recent QualServe benchmarking results.
The progress on the cleaning and inspection project allowed the City to collect and update critical geographic information system (GIS) data. The City’s collection system hydraulic model was correspondingly updated. As part of the hydraulic model update, the City used additional flow monitoring data to refine and recalibrate the model to more accurately represent collection system hydraulics. The refinement of the hydraulic model and 2014 receiving water sampling results allowed the City to conduct water quality modeling of CSO receiving waters. These refinements and water quality modeling provided better engineering data for reviewing and reevaluating alternative scenarios to the LTCP projects that would still comply with the intent and performance requirements of the CD. Results of these efforts are presented later in this report.
The remainder of this document shows the results of Akron’s integrated planning efforts, culminating in the recommended projects and project sequencing highlighted in Section 6, Integrated Planning Results. Akron’s recommended Integrated Plan results in equal or better environmental benefits, achieved earlier, at a less unaffordable cost for the ratepayers of Akron. For purposes of this report, “LTCP Projects” include all projects required by the CD and the LTCP Update 2011. Throughout the remainder of this document, these projects will be referred to as LTCP.

City of Akron Integrated Plan
1-6
1.3 Akron's Guiding Principles for Integrated Planning The City and USEPA have both developed guiding principles for undertaking the integrated planning process. Similarities in these principles further support the City’s suitability for integrated planning. USEPA’s IPF guidance document includes the following overarching and guiding principles:
Maintain compliance with existing regulatory standards and requirements that protect public health and safety.
Maximize the effectiveness of funds through a process of alternatives analysis, selection, and sequencing to address public health and water quality challenges.
Evaluate and incorporate effective sustainable technologies, approaches, and practices, including green infrastructure.
Evaluate and address community impacts.
Ensure the financial strategy can be implemented and an appropriate fee structure is in place.
Provide appropriate opportunities for meaningful stakeholder input throughout the planning process.
Akron's guiding principles are embedded in the mission and vision statements associated with its CSO program. Akron’s overall CSO program is now referred to as Akron Waterways Renewed! (AWR). The City reconstituted its Integrated Plan Stakeholder Group and undertook the effort to "re-brand" the CSO program to more effectively communicate its purpose and anticipated benefits. The emphasis for AWR has been about environmental protection and improvement of water quality in the area’s receiving waters. The Akron Waterways Renewed! name and logo are used consistently for nearly all communications related to the CSO program, from technical documents to stakeholder events to community meetings.
Our Mission: To invest in Akron’s environmental future by building infrastructure for the next century that will protect public health and maintain water of the highest quality in the most cost-effective manner while providing local jobs.
Our Vision: Akron, Ohio will be recognized as a community that has used the Integrated Planning approach in re-building its infrastructure to meet all of its needs with less unaffordable benefits that are achieved earlier. Akron can provide effective and efficient wastewater and stormwater management services while protecting the environment for this and future generations.
The City’s implementation of USEPA’s specific IPF guiding principles is outlined below. It is important to note that while this Integrated Plan is under development, the City is continuing to meet all existing CD project commitments.

City of Akron Integrated Plan
1-7
1.4 Elements of the Integrated Plan The process undertaken to develop the Akron Integrated Plan, as detailed in subsequent sections of this report, was designed to be consistent with the AWR Mission and Vision statements, as well as with USEPA’s IPF approach.
The IPF includes the six elements shown to the right. Each element is thoroughly addressed in this Integrated Plan. In addition, the City maintained the following goals as part of the development of this Integrated Plan:
Reduce the amount of unaffordability.
Use of an enhanced Triple Bottom Line to measure benefits and evaluate projects.
Achieve equal or better environmental benefits at a less unaffordable cost.
To the extent feasible and when cost effective, use green solutions.
Each of the six USEPA IPF elements and the sections of the City of Akron Integrated Plan in which they are addressed are summarized in Table 1-1.

City of Akron Integrated Plan
1-8
Table 1-1. USEPA IPF Element and Akron’s Integrated Plan Crosswalk
USEPA IPF Elements City of Akron
Integrated Plan Section
Remarks
Executive Summary
The Executive Summary provides a synopsis of key findings and recommendations from the overall report.
1. Introduction This section provides context as to why Akron undertook an integrated planning effort.
Element 1: Water Quality, Public Health, and Regulatory Issues
2. Water Quality, Public Health, and Regulatory Issues
This section describes local water quality, public health, and regulatory issues (including additional CWA obligations) that are addressed in the plan.
Element 2: Existing Systems and Performance
3. Existing Systems and Performance
This section describes the City’s wastewater and stormwater infrastructure facilities. A brief summary of the performance of each system is also in this section. (Detailed descriptions of existing systems can be found in the Akron Facilities Plan (1998) and Facilities Plan Update (2010).)
Element 3: Stakeholder Involvement
4. Stakeholder Involvement
This section outlines the stakeholder identification and communications plans to incorporate meaningful stakeholder involvement in the integrated planning process.
Element 4: Evaluating and Selecting Alternatives
5. Evaluating and Selecting Alternatives
This section describes the process used to identify, evaluate and select alternatives, and to propose implementation schedules based on optimized groupings of projects into various scenarios.
6. Integrated Planning Results
This section describes proposed changes to projects identified in the City’s current LTCP based on affordable, prioritized project scenarios, and defines measurable benefits associated with the recommended Integrated Plan Scenario 2040, including benefits to public health and water quality.
Element 5: Measuring Success
7. Measuring Success This section outlines the process for evaluating the performance of projects identified in the Integrated Plan Scenario 2040.
Element 6: Improving the Plan
8. Improving the Plan This section outlines the implementation of an adaptive management-based continual program evaluation and improvement cycle.
City of Akron Integrated Plan
2-1
2.0 WATER QUALITY, PUBLIC HEALTH, AND REGULATORY ISSUES
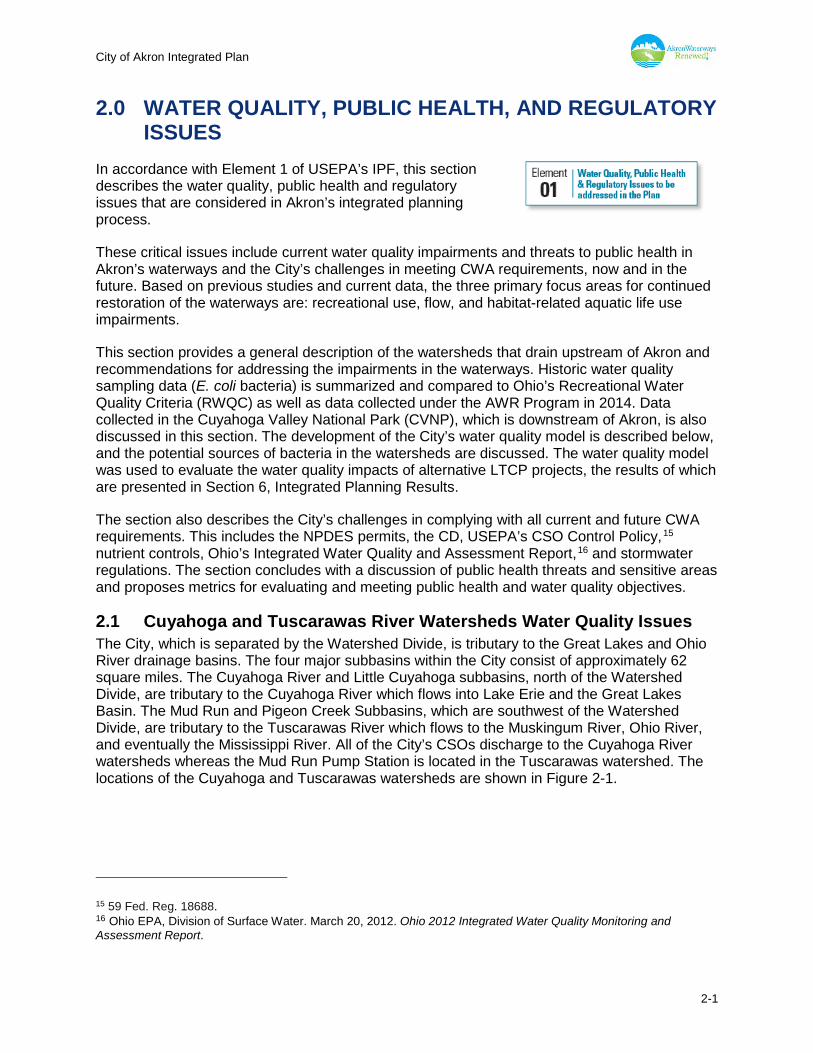
In accordance with Element 1 of USEPA’s IPF, this section describes the water quality, public health and regulatory issues that are considered in Akron’s integrated planning process.
These critical issues include current water quality impairments and threats to public health in Akron’s waterways and the City’s challenges in meeting CWA requirements, now and in the future. Based on previous studies and current data, the three primary focus areas for continued restoration of the waterways are: recreational use, flow, and habitat-related aquatic life use impairments.
This section provides a general description of the watersheds that drain upstream of Akron and recommendations for addressing the impairments in the waterways. Historic water quality sampling data (E. coli bacteria) is summarized and compared to Ohio’s Recreational Water Quality Criteria (RWQC) as well as data collected under the AWR Program in 2014. Data collected in the Cuyahoga Valley National Park (CVNP), which is downstream of Akron, is also discussed in this section. The development of the City’s water quality model is described below, and the potential sources of bacteria in the watersheds are discussed. The water quality model was used to evaluate the water quality impacts of alternative LTCP projects, the results of which are presented in Section 6, Integrated Planning Results.
The section also describes the City’s challenges in complying with all current and future CWA requirements. This includes the NPDES permits, the CD, USEPA’s CSO Control Policy,15 nutrient controls, Ohio’s Integrated Water Quality and Assessment Report,16 and stormwater regulations. The section concludes with a discussion of public health threats and sensitive areas and proposes metrics for evaluating and meeting public health and water quality objectives.
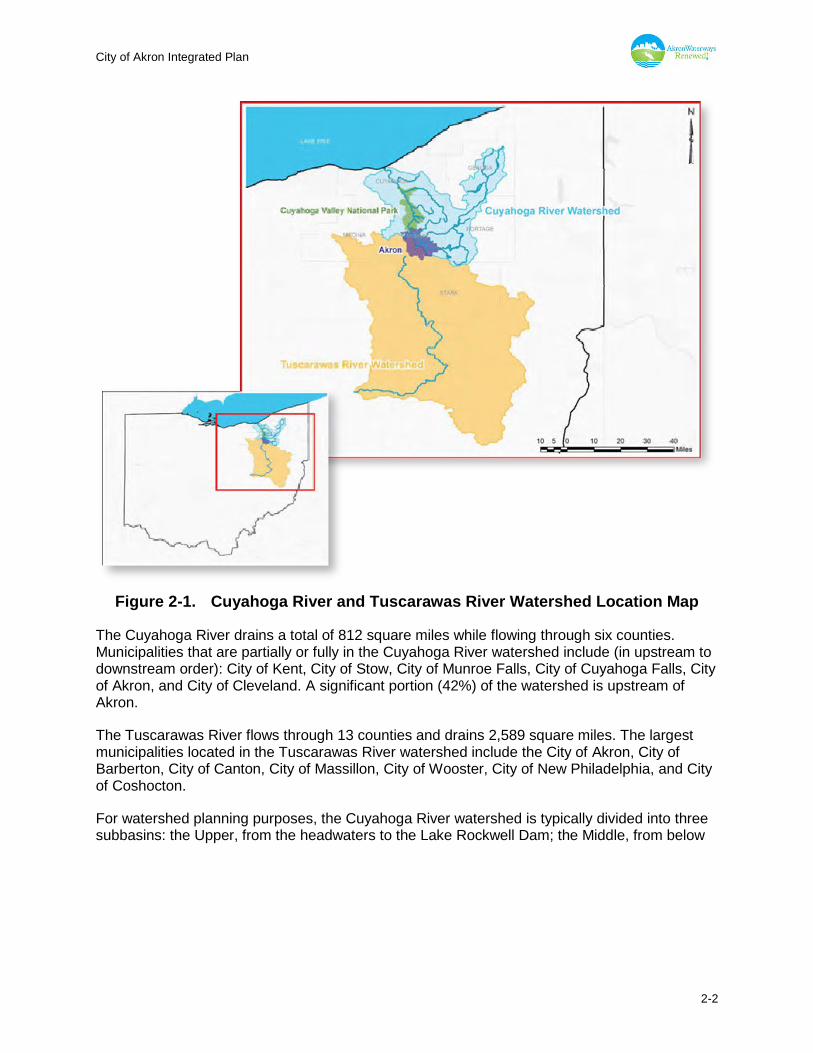
2.1 Cuyahoga and Tuscarawas River Watersheds Water Quality Issues The City, which is separated by the Watershed Divide, is tributary to the Great Lakes and Ohio River drainage basins. The four major subbasins within the City consist of approximately 62 square miles. The Cuyahoga River and Little Cuyahoga subbasins, north of the Watershed Divide, are tributary to the Cuyahoga River which flows into Lake Erie and the Great Lakes Basin. The Mud Run and Pigeon Creek Subbasins, which are southwest of the Watershed Divide, are tributary to the Tuscarawas River which flows to the Muskingum River, Ohio River, and eventually the Mississippi River. All of the City’s CSOs discharge to the Cuyahoga River watersheds whereas the Mud Run Pump Station is located in the Tuscarawas watershed. The locations of the Cuyahoga and Tuscarawas watersheds are shown in Figure 2-1.
15 59 Fed. Reg. 18688. 16 Ohio EPA, Division of Surface Water. March 20, 2012. Ohio 2012 Integrated Water Quality Monitoring and Assessment Report.
City of Akron Integrated Plan
2-2
Figure 2-1. Cuyahoga River and Tuscarawas River Watershed Location Map
The Cuyahoga River drains a total of 812 square miles while flowing through six counties. Municipalities that are partially or fully in the Cuyahoga River watershed include (in upstream to downstream order): City of Kent, City of Stow, City of Munroe Falls, City of Cuyahoga Falls, City of Akron, and City of Cleveland. A significant portion (42%) of the watershed is upstream of Akron.
The Tuscarawas River flows through 13 counties and drains 2,589 square miles. The largest municipalities located in the Tuscarawas River watershed include the City of Akron, City of Barberton, City of Canton, City of Massillon, City of Wooster, City of New Philadelphia, and City of Coshocton.
For watershed planning purposes, the Cuyahoga River watershed is typically divided into three subbasins: the Upper, from the headwaters to the Lake Rockwell Dam; the Middle, from below

City of Akron Integrated Plan
2-3
the Lake Rockwell Dam to Waterworks Park17 (the location of the former Munroe Falls Dam); and the Lower, from below the Waterworks Park to the mouth at Cleveland and Lake Erie.18
Each of the Cuyahoga River subbasins is made up of smaller subbasins as shown in Figure 2-2. The portion of the Cuyahoga River in Akron and the Little Cuyahoga River are within the Lower Cuyahoga River subbasin. Twenty-two miles of the Cuyahoga River flows through the CVNP downstream of Akron.
Figure 2-2. Upper, Middle, and Lower Cuyahoga River Subbasins and Watersheds
17 In some instances, the boundary of the Middle Cuyahoga has been defined as the Gorge Dam (historically referenced as “the Ohio Edison Dam”) instead of Waterworks Park. 18 Peck, M. December 2012. Middle Cuyahoga River Watershed Action Plan. Akron, Ohio: NEFCO.
City of Akron Integrated Plan
2-4
According to a historical timeline developed by the Friends of the Crooked River, a stewardship group of the Cuyahoga River, the watershed has a long history of being used for agriculture, industrial and urban land use, canals, and transport. Numerous dams have also been constructed in the watershed. As such, the watershed’s impairments are numerous and widespread. These impairments are attributable not only to discrete and diffuse sources of pollutants, but also significant flow and habitat alterations.
The watershed’s water quality impairments impact aquatic life (fish and macroinvertebrates or bugs) and recreational uses (e.g., swimming, kayaking, and canoeing). This section describes those impairments and the steps that Ohio EPA, the City, and others have taken to link the sources of pollutants and flow alterations with the impairments and identify remedies. In this Integrated Plan, emphasis is placed on the recreational use impairments (the focus of the LTCP) to put the impact of the CSOs in perspective with other sources of bacteria in the watershed. The CSO impacts are also evaluated further in Section 6.3.3, Receiving Water Quality Scenario Evaluation, using the City’s Water Quality Model.
2.1.1 Integrated Report and Total Maximum Daily Loads (TMDLs) The Ohio 2012 Integrated Water Quality Monitoring and Assessment Report (Integrated Report) prepared by Ohio EPA indicates the general condition of Ohio’s waters and identifies waters that are not meeting water quality goals.19
The Ohio EPA’s Integrated Report satisfies the requirements for both CWA Section 305(b) for biennial reports on the condition of the State’s waters and CWA Section 303(d) for a prioritized list of impaired waters. From the approved 2012 Integrated Report, the Cuyahoga River meets the aquatic life standards in 77% of the river, partially meets standards in 13% of the river, and does not meet standards in 10% of the river. In the 2002 Monitoring and Assessment Report, which is Ohio’s first integrated monitoring and assessment report, the Cuyahoga River met the aquatic life standards in 22% of the river, partially met standards in 49% of the river, and did not meet standards in 29% of the river.20
For each area of impaired water, Ohio EPA typically prepares a TMDL analysis, including additional stream surveys and water quality modeling, to recommend implementation actions to mitigate the impairments. Ohio EPA has prepared three TMDL reports for the Cuyahoga River watershed; one each for the Upper, Middle, and Lower portions of the watershed.21, 22, 23
The Middle Cuyahoga River TMDL report was Ohio’s first TMDL report to be approved by USEPA. Table 2-1 provides a summary of the Cuyahoga River TMDLs. The table shows the major causes of aquatic life use impairment, major sources of pollutants, and where TMDL targets have been for the Upper, Middle, and Lower portions of the Cuyahoga River. Given that
19 Ohio EPA, Division of Surface Water. March 20, 2012. Ohio 2012 Integrated Water Quality Monitoring and Assessment Report. 20 Ohio EPA, Division of Surface Water. October 1, 2002. Ohio 2002 Integrated Water Quality Monitoring and Assessment Report. 21 Ohio EPA, Division of Surface Water. September 2004. Total Maximum Daily Loads for the Upper Cuyahoga River. 22 Ohio EPA, Division of Surface Water. March 2000. Total Maximum Daily Loads for the Middle Cuyahoga River. 23 Ohio EPA, Division of Surface Water. September 2003. Total Maximum Daily Loads for the Lower Cuyahoga River.
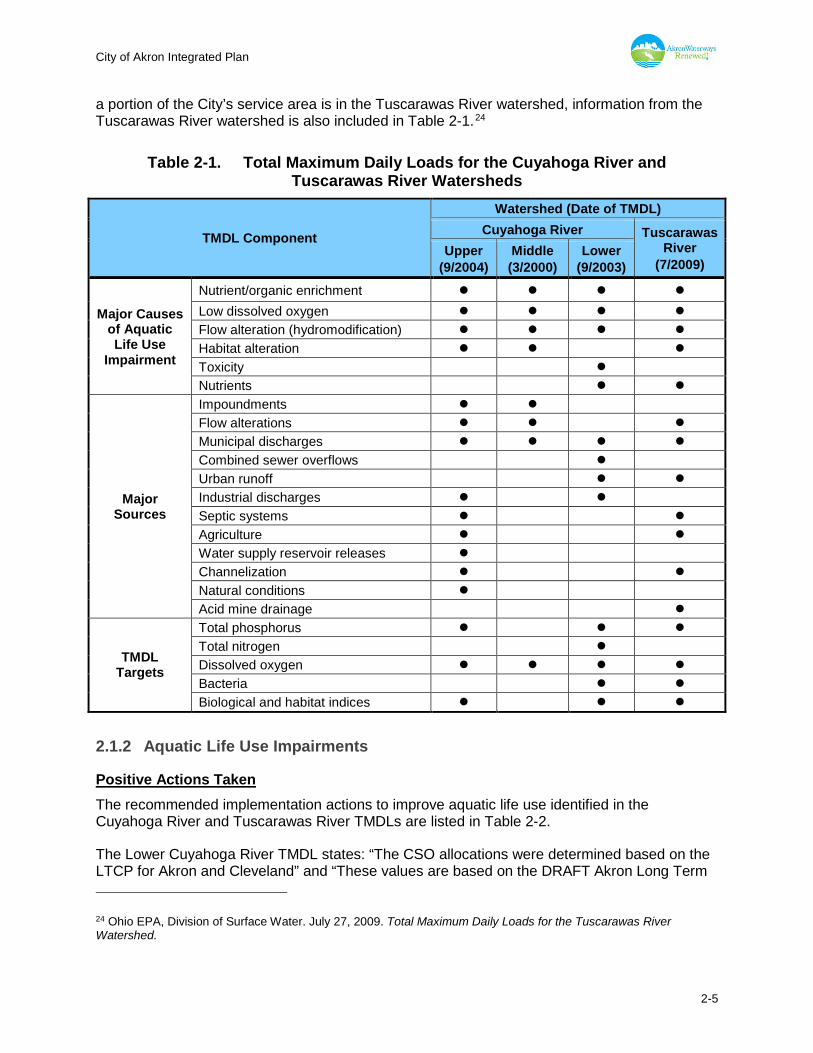
City of Akron Integrated Plan
2-5
a portion of the City’s service area is in the Tuscarawas River watershed, information from the Tuscarawas River watershed is also included in Table 2-1.24
Table 2-1. Total Maximum Daily Loads for the Cuyahoga River and Tuscarawas River Watersheds
TMDL Component
Watershed (Date of TMDL)
Cuyahoga River Tuscarawas River
(7/2009) Upper
(9/2004) Middle (3/2000)
Lower (9/2003)
Major Causes of Aquatic Life Use
Impairment
Nutrient/organic enrichment
Low dissolved oxygen
Flow alteration (hydromodification)
Habitat alteration
Toxicity
Nutrients
Major Sources
Impoundments
Flow alterations
Municipal discharges
Combined sewer overflows
Urban runoff
Industrial discharges
Septic systems
Agriculture
Water supply reservoir releases
Channelization
Natural conditions
Acid mine drainage
TMDL Targets
Total phosphorus
Total nitrogen
Dissolved oxygen
Bacteria
Biological and habitat indices
2.1.2 Aquatic Life Use Impairments
Positive Actions Taken
The recommended implementation actions to improve aquatic life use identified in the Cuyahoga River and Tuscarawas River TMDLs are listed in Table 2-2.
The Lower Cuyahoga River TMDL states: “The CSO allocations were determined based on the LTCP for Akron and Cleveland” and “These values are based on the DRAFT Akron Long Term
24 Ohio EPA, Division of Surface Water. July 27, 2009. Total Maximum Daily Loads for the Tuscarawas River Watershed.
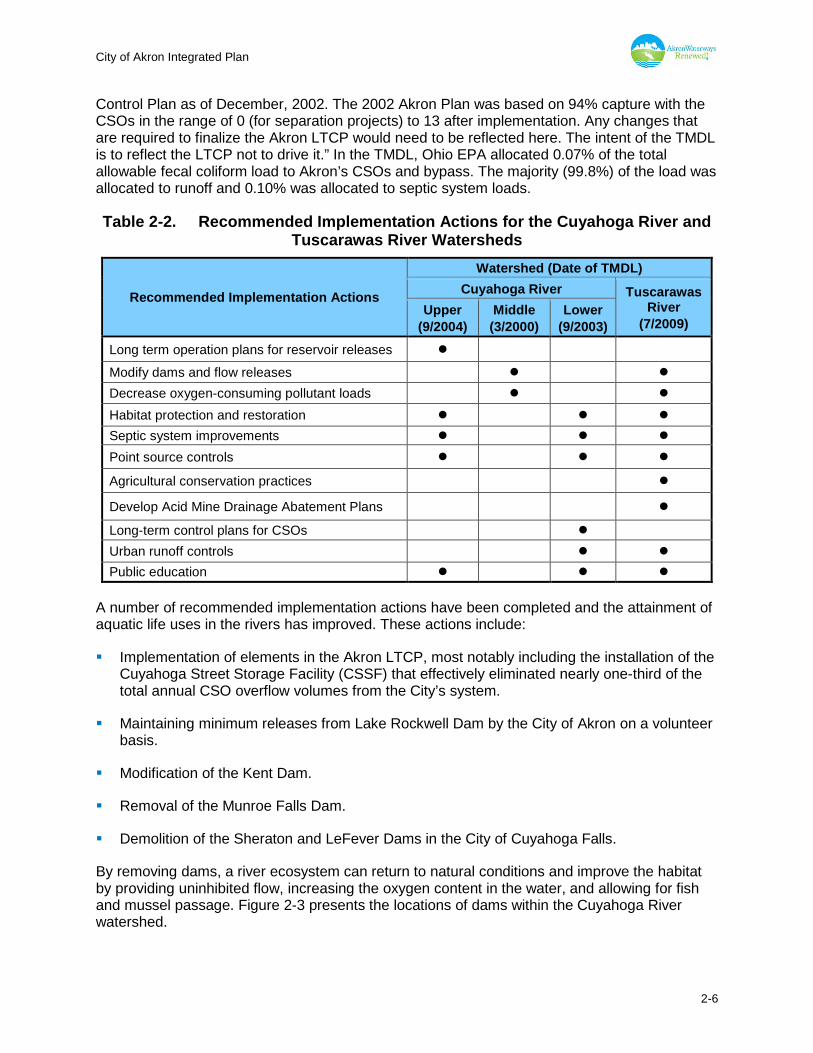
City of Akron Integrated Plan
2-6
Control Plan as of December, 2002. The 2002 Akron Plan was based on 94% capture with the CSOs in the range of 0 (for separation projects) to 13 after implementation. Any changes that are required to finalize the Akron LTCP would need to be reflected here. The intent of the TMDL is to reflect the LTCP not to drive it.” In the TMDL, Ohio EPA allocated 0.07% of the total allowable fecal coliform load to Akron’s CSOs and bypass. The majority (99.8%) of the load was allocated to runoff and 0.10% was allocated to septic system loads.
Table 2-2. Recommended Implementation Actions for the Cuyahoga River and Tuscarawas River Watersheds
Recommended Implementation Actions
Watershed (Date of TMDL)
Cuyahoga River Tuscarawas River
(7/2009) Upper
(9/2004) Middle (3/2000)
Lower (9/2003)
Long term operation plans for reservoir releases
Modify dams and flow releases
Decrease oxygen-consuming pollutant loads
Habitat protection and restoration
Septic system improvements
Point source controls
Agricultural conservation practices
Develop Acid Mine Drainage Abatement Plans
Long-term control plans for CSOs
Urban runoff controls
Public education
A number of recommended implementation actions have been completed and the attainment of aquatic life uses in the rivers has improved. These actions include:
Implementation of elements in the Akron LTCP, most notably including the installation of the Cuyahoga Street Storage Facility (CSSF) that effectively eliminated nearly one-third of the total annual CSO overflow volumes from the City’s system.
Maintaining minimum releases from Lake Rockwell Dam by the City of Akron on a volunteer basis.
Modification of the Kent Dam.
Removal of the Munroe Falls Dam.
Demolition of the Sheraton and LeFever Dams in the City of Cuyahoga Falls.
By removing dams, a river ecosystem can return to natural conditions and improve the habitat by providing uninhibited flow, increasing the oxygen content in the water, and allowing for fish and mussel passage. Figure 2-3 presents the locations of dams within the Cuyahoga River watershed.
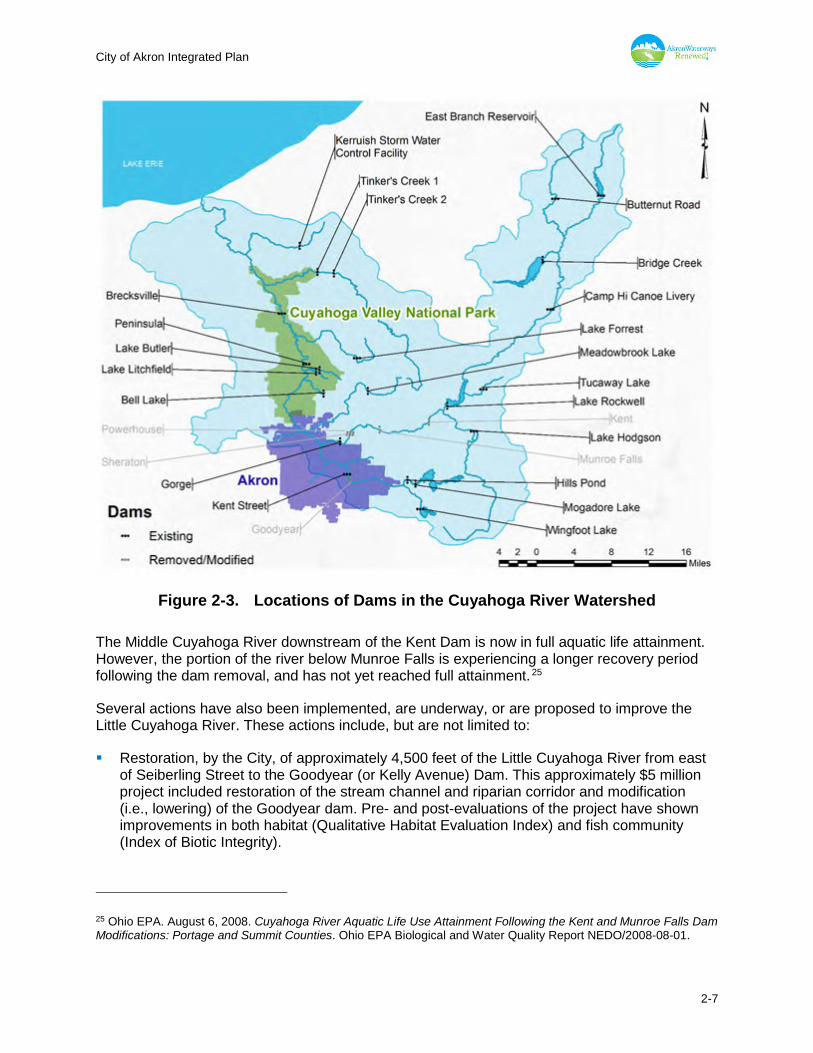
City of Akron Integrated Plan
2-7
Figure 2-3. Locations of Dams in the Cuyahoga River Watershed
The Middle Cuyahoga River downstream of the Kent Dam is now in full aquatic life attainment. However, the portion of the river below Munroe Falls is experiencing a longer recovery period following the dam removal, and has not yet reached full attainment. .
25
Several actions have also been implemented, are underway, or are proposed to improve the Little Cuyahoga River. These actions include, but are not limited to:
Restoration, by the City, of approximately 4,500 feet of the Little Cuyahoga River from east of Seiberling Street to the Goodyear (or Kelly Avenue) Dam. This approximately $5 million project included restoration of the stream channel and riparian corridor and modification (i.e., lowering) of the Goodyear dam. Pre- and post-evaluations of the project have shown improvements in both habitat (Qualitative Habitat Evaluation Index) and fish community (Index of Biotic Integrity).
25 Ohio EPA. August 6, 2008. Cuyahoga River Aquatic Life Use Attainment Following the Kent and Munroe Falls Dam Modifications: Portage and Summit Counties. Ohio EPA Biological and Water Quality Report NEDO/2008-08-01.
City of Akron Integrated Plan
2-8
Restoration of Haley’s Run, a tributary to the Little Cuyahoga River that discharges 0.8 miles upstream of Akron’s water quality model domain. This project, which was funded by the Lockheed Martin Corporation, included the restoration of approximately 2,000 feet of stream channel, one acre of wetlands, 1.6 acres of floodplain, and 3.4 acres of upland areas.26 Pre- and post-construction evaluations of this project have also indicated improvements of aquatic habitat.27
On-going development of the Little Cuyahoga River Balanced Growth Plan. The City, along with other regional communities is participating in this effort to develop a comprehensive plan to address water quality issues at a watershed scale. The effort is being led by the Northeast Ohio Four County Regional Planning and Development Organization (NEFCO).
Planned restoration of the Little Cuyahoga River at the outfall of the proposed Ohio Canal Interceptor Tunnel (OCIT). This restoration effort will include the removal of a utility crossing that is currently acting as a low-head dam.
Restoration of approximately 407 linear feet of Camp Brook using natural channel design techniques as part of the Camp Brook Storage Basin (CSO Rack 12) project.
Planned removal of an existing utility crossing causing damming in the Little Cuyahoga River as part of the proposed Uhler Optimized Conveyance Alternative. In its place, the City will construct an aerial crossing to convey the flow to the Little Cuyahoga Interceptor.
Collaboration with the United States Army Corps of Engineers (USACE) to conduct a study of the Little Cuyahoga River to identify potential riparian and aquatic ecosystem restoration alternatives. The Detailed Project Report and Environmental Assessment (DPR/EA) measures and documents alternatives in detail and, through coordination between the USACE, the non-Federal Local Sponsor (City of Akron), and participating agencies, develops a recommended National Ecosystem Restoration plan for the proposed study site. The limits for this study are south of East North Street (river mile (RM) 3.49) to East Market Street (RM 5.44). The study is currently 75% complete. In 2014, the City was granted Clean Ohio funds for land acquisition to accomplish a portion of the work outlined in the DPR/EA. The land that is acquired will be set aside for future restoration of the river in the project area.
In addition, the mainstem of the Cuyahoga River has seen significant improvements in ecological condition in recent years. In the early 1970s, the biological community of the Cuyahoga River had been severely impacted by pollution and consisted mostly of pollution tolerant fish and macroinvertebrate species. In 1973 and 1974 there were only 30 species present near the City of Independence and only 10% of the species between Akron and Independence were not pollution tolerant.
Biological monitoring in recent years has indicated that the fish and macroinvertebrate communities in many segments of the river are attaining or partially attaining the biocriteria associated with the Warm Water Habitat aquatic life use designation assigned by the Ohio EPA. In 2008, the Index of Biotic Integrity (IBI) score at RM 16 (downstream of Tinkers Creek in the CVNP) was in the Very Good range (Figure 2-4) and the Modified Index of Wellbeing (MIwb)
26 EnviroScience, Inc. December 31, 2011. Haley’s Run Restoration Report. 27 Ibid.
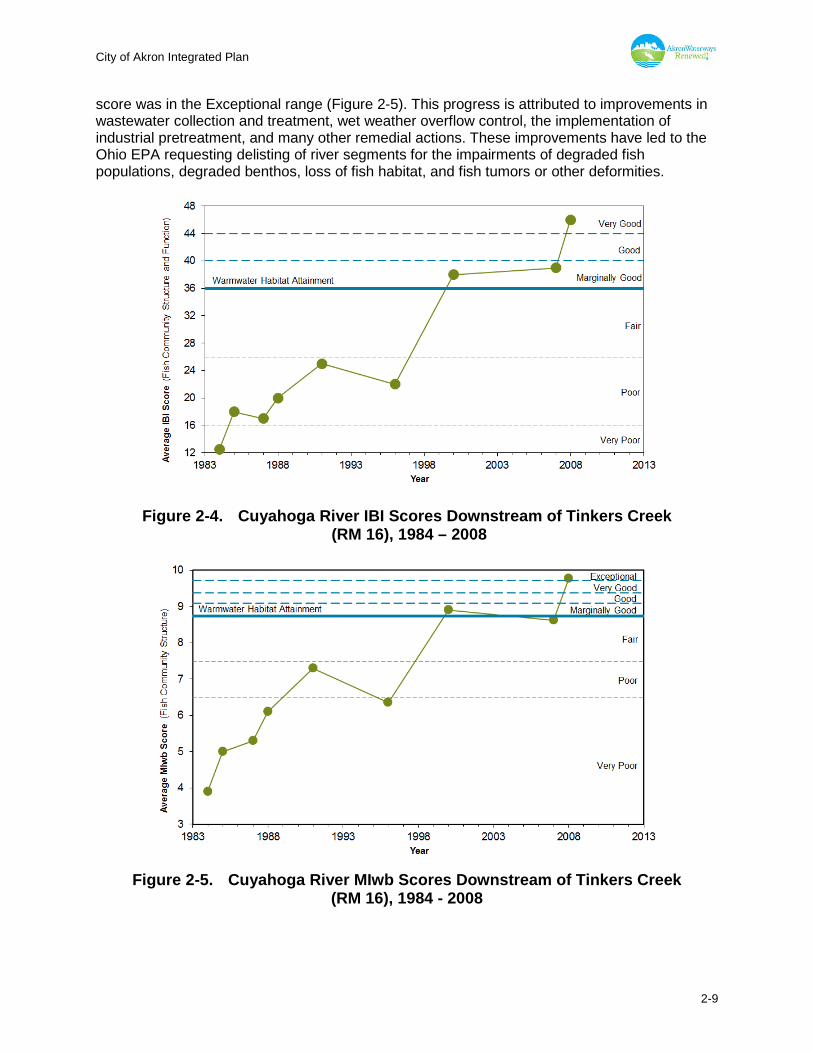
City of Akron Integrated Plan
2-9
score was in the Exceptional range (Figure 2-5). This progress is attributed to improvements in wastewater collection and treatment, wet weather overflow control, the implementation of industrial pretreatment, and many other remedial actions. These improvements have led to the Ohio EPA requesting delisting of river segments for the impairments of degraded fish populations, degraded benthos, loss of fish habitat, and fish tumors or other deformities.
Figure 2-4. Cuyahoga River IBI Scores Downstream of Tinkers Creek
(RM 16), 1984 – 2008
Figure 2-5. Cuyahoga River MIwb Scores Downstream of Tinkers Creek
(RM 16), 1984 - 2008
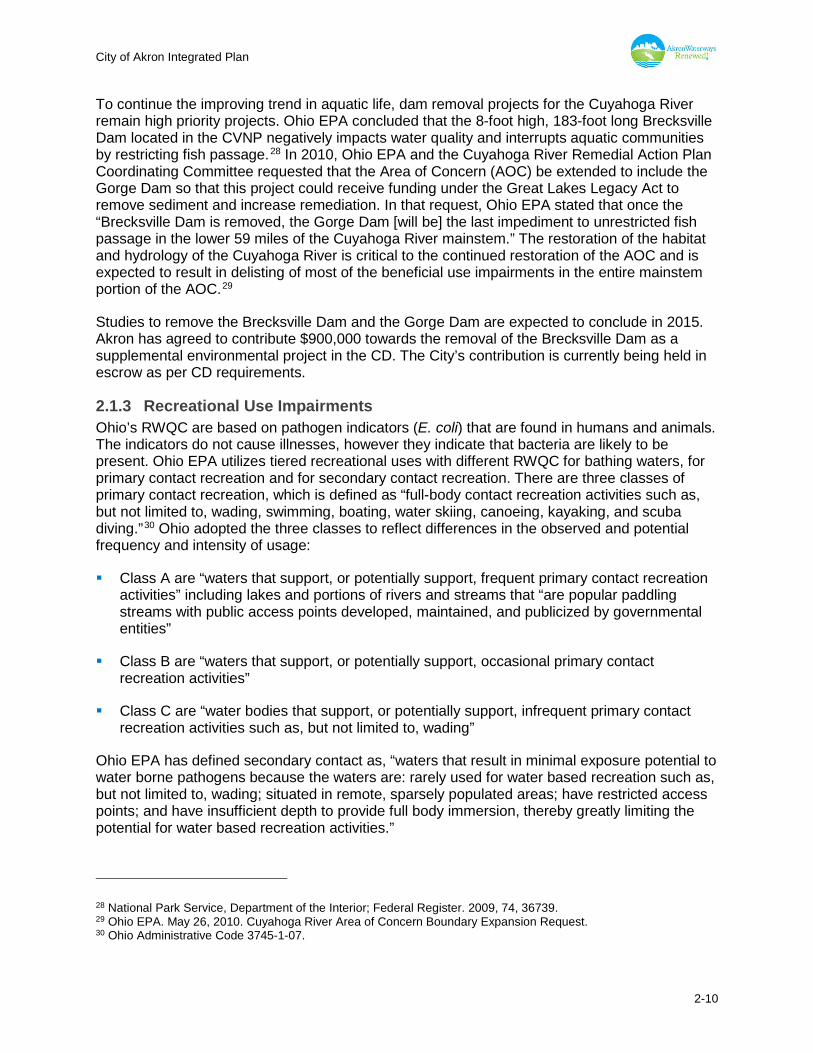
City of Akron Integrated Plan
2-10
To continue the improving trend in aquatic life, dam removal projects for the Cuyahoga River remain high priority projects. Ohio EPA concluded that the 8-foot high, 183-foot long Brecksville Dam located in the CVNP negatively impacts water quality and interrupts aquatic communities by restricting fish passage.28 In 2010, Ohio EPA and the Cuyahoga River Remedial Action Plan Coordinating Committee requested that the Area of Concern (AOC) be extended to include the Gorge Dam so that this project could receive funding under the Great Lakes Legacy Act to remove sediment and increase remediation. In that request, Ohio EPA stated that once the “Brecksville Dam is removed, the Gorge Dam [will be] the last impediment to unrestricted fish passage in the lower 59 miles of the Cuyahoga River mainstem.” The restoration of the habitat and hydrology of the Cuyahoga River is critical to the continued restoration of the AOC and is expected to result in delisting of most of the beneficial use impairments in the entire mainstem portion of the AOC.29
Studies to remove the Brecksville Dam and the Gorge Dam are expected to conclude in 2015. Akron has agreed to contribute $900,000 towards the removal of the Brecksville Dam as a supplemental environmental project in the CD. The City’s contribution is currently being held in escrow as per CD requirements.
2.1.3 Recreational Use Impairments Ohio’s RWQC are based on pathogen indicators (E. coli) that are found in humans and animals. The indicators do not cause illnesses, however they indicate that bacteria are likely to be present. Ohio EPA utilizes tiered recreational uses with different RWQC for bathing waters, for primary contact recreation and for secondary contact recreation. There are three classes of primary contact recreation, which is defined as “full-body contact recreation activities such as, but not limited to, wading, swimming, boating, water skiing, canoeing, kayaking, and scuba diving.”30 Ohio adopted the three classes to reflect differences in the observed and potential frequency and intensity of usage:
Class A are “waters that support, or potentially support, frequent primary contact recreation activities” including lakes and portions of rivers and streams that “are popular paddling streams with public access points developed, maintained, and publicized by governmental entities”
Class B are “waters that support, or potentially support, occasional primary contact recreation activities”
Class C are “water bodies that support, or potentially support, infrequent primary contact recreation activities such as, but not limited to, wading”
Ohio EPA has defined secondary contact as, “waters that result in minimal exposure potential to water borne pathogens because the waters are: rarely used for water based recreation such as, but not limited to, wading; situated in remote, sparsely populated areas; have restricted access points; and have insufficient depth to provide full body immersion, thereby greatly limiting the potential for water based recreation activities.”
28 National Park Service, Department of the Interior; Federal Register. 2009, 74, 36739. 29 Ohio EPA. May 26, 2010. Cuyahoga River Area of Concern Boundary Expansion Request. 30 Ohio Administrative Code 3745-1-07.

City of Akron Integrated Plan
2-11
Table 2-3 lists Ohio’s E. coli standards related to recreational use. The primary impact of Akron’s CSOs is potential contributions to exceedances of E. coli.
Table 2-3. Ohio’s E. coli Standards Related to Recreational Use
Recreational Use1 E. coli (colony forming units per 100 milliliters)
Seasonal Geometric Mean Maximum Exceedance2
Primary Contact Recreation Class A (Cuyahoga River)
126 298
Primary Contact Recreation Class B (Little Cuyahoga River, Camp Brook, and sampled portions of the Ohio Canal)
161 523
Secondary Contact (applies to portion of the Ohio Canal which was not sampled)
1,030 1,030
1 Recreation season is defined as May 1 to October 31. 2 Not to be exceeded in more than 10% of samples during a 30-day period.
Ohio EPA is currently seeking public input on proposed revisions to the RWQC. .,
31
Figure 2-6 on the following page shows the recreational use designations for the rivers and streams within the vicinity of Akron, and the locations of Akron’s CSO Racks.
31 Ohio EPA, Division of Surface Water. July 2015. Proposed Rules – Recreational Water Criteria: Water Quality Standards (OAC Chapter 3745-1).