mba 8452 systems and operations management
DESCRIPTION
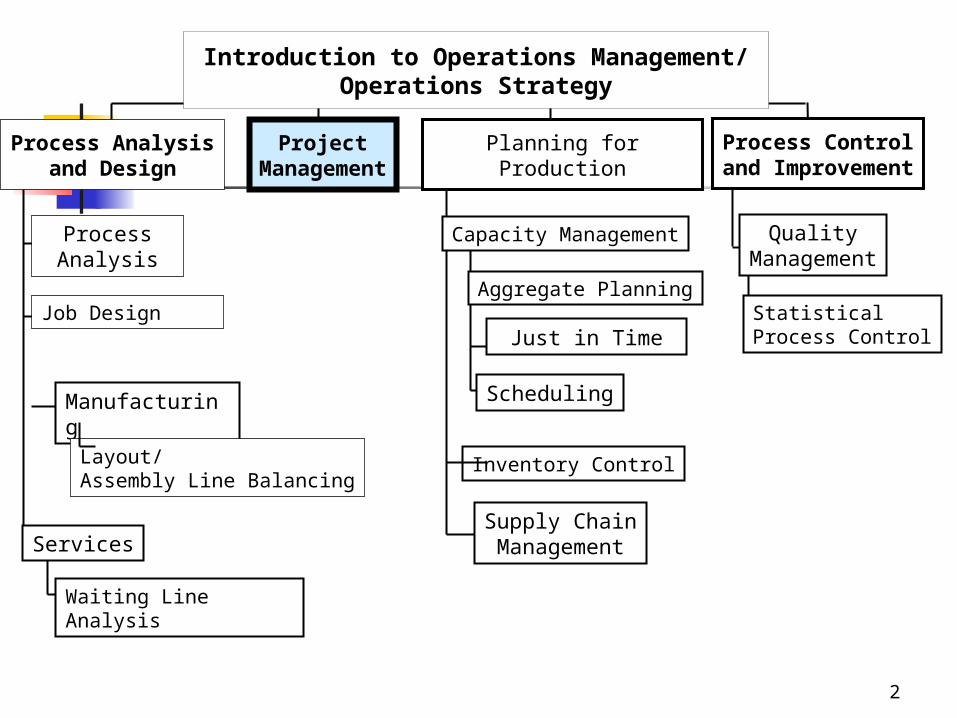
MBA 8452 Systems and Operations Management. PROJECT MANAGEMENT. Introduction to Operations Management/ Operations Strategy. Process Control and Improvement. Process Analysis and Design. Project Management. Planning for Production. Quality Management. Process Analysis. - PowerPoint PPT PresentationTRANSCRIPT

MBA 8452 Systems and Operations ManagementMBA 8452 Systems and Operations Management
PROJECT PROJECT MANAGEMENTMANAGEMENT
2
QualityManagement
StatisticalProcess Control
Inventory Control
Just in Time
Introduction to Operations Management/ Operations Strategy
ProjectManagement
Planning for ProductionProcess Analysisand Design
Process Controland Improvement
Waiting Line Analysis
Services
Manufacturing
Process Analysis
Job DesignAggregate Planning
Capacity Management
Supply ChainManagement
Layout/ Assembly Line Balancing
Scheduling
3
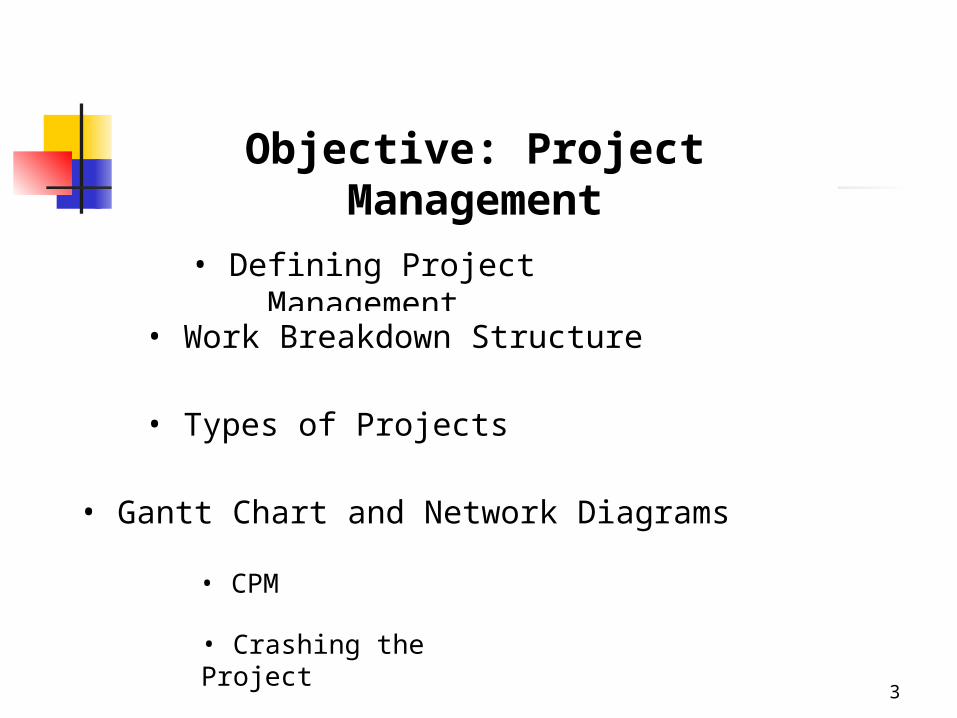
Objective: Project Management
• Crashing the Project
• CPM
• Types of Projects
• Defining Project Management
• Work Breakdown Structure
• Gantt Chart and Network Diagrams
4
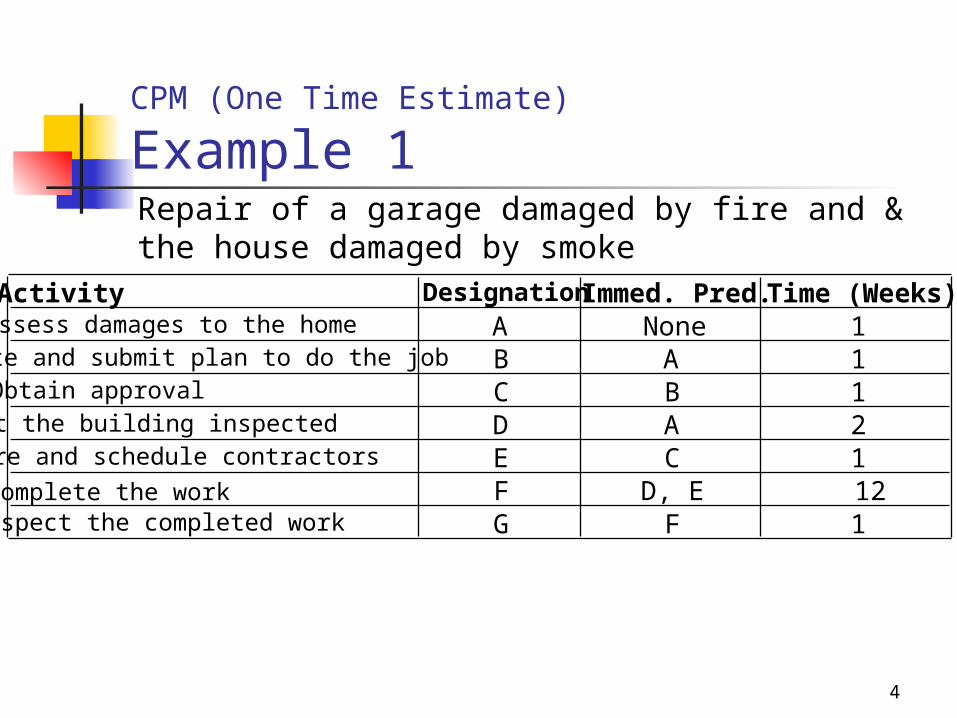
CPM (One Time Estimate)
Example 1Repair of a garage damaged by fire and & the house damaged by smoke
Activity Designation Immed. Pred. Time (Weeks)Assess damages to the home A None 1Write and submit plan to do the job B A 1Obtain approval C B 1Get the building inspected D A 2Hire and schedule contractors E C 1Complete the work F D, E 12Inspect the completed work G F 1

5
Project A set of activities (tasks) that are
interrelated with a common aim to produce a valuable output
Characteristics Large-scale, one of a kind, time
consuming Precedence relationship among activities Time and budget limits
6
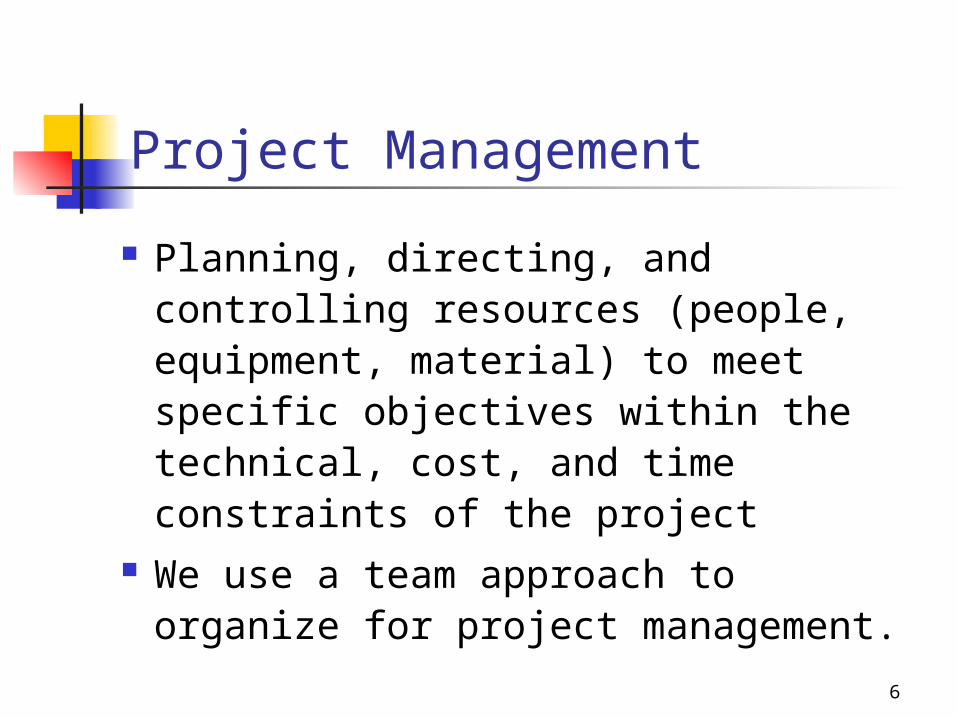
Project Management
Planning, directing, and controlling resources (people, equipment, material) to meet specific objectives within the technical, cost, and time constraints of the project
We use a team approach to organize for project management.

7
Project Organizational Structures
Pure Project performed by a self-contained team works
full time on the project
Functional Project each component is performed by people
within a functional area
Matrix Project A combination of pure and functional
projects
8
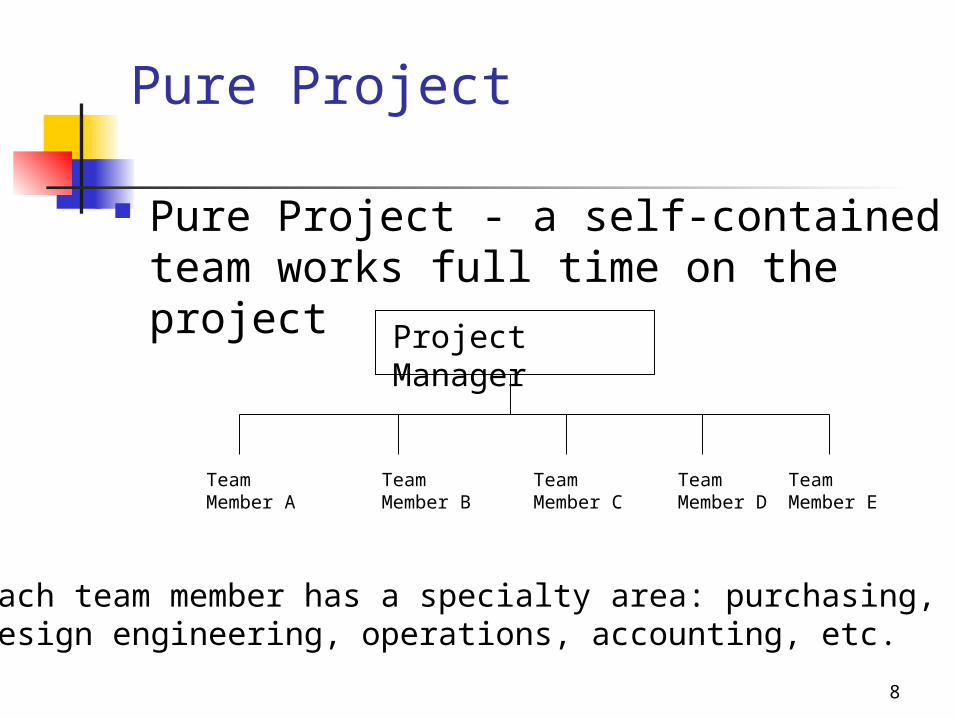
Pure Project
Pure Project - a self-contained team works full time on the project
Project Manager
Team Member A
Team Member E
Team Member C
Team Member B
Team Member D
Each team member has a specialty area: purchasing, design engineering, operations, accounting, etc.
9
Pure Project:Advantages
Full authority of project manager
One boss to report
Shortened communication lines
High team pride, motivation, and commitment
10
Pure Project: Disadvantages
Duplication of resources
Lack of organizational goals and policies
Lack of technology transfer
No functional area "home” for team members

11
Functional Project
President
Research andDevelopment
Engineering Manufacturing
ProjectA
ProjectB
ProjectC
ProjectA
ProjectB
ProjectC
ProjectA
ProjectB
ProjectC
12
Functional Project:Advantages
Shared manpower and resources
Maintained technical expertise within the functional area
Nature “home” in the functional area for team members
Critical mass of specialized knowledge

13
Functional Project:Disadvantages
Compromised non-functional-related activities
Weak motivation of team
members
Slow response to clients’ needs

14
Matrix Project
President
Research andDevelopment
Engineering Manufacturing Marketing
ManagerProject A
ManagerProject B
ManagerProject C

15
Matrix Project:Advantages
Enhanced interfunctional communications
Pinpointed responsibility
Minimized duplication of resources
Functional home for team members
16
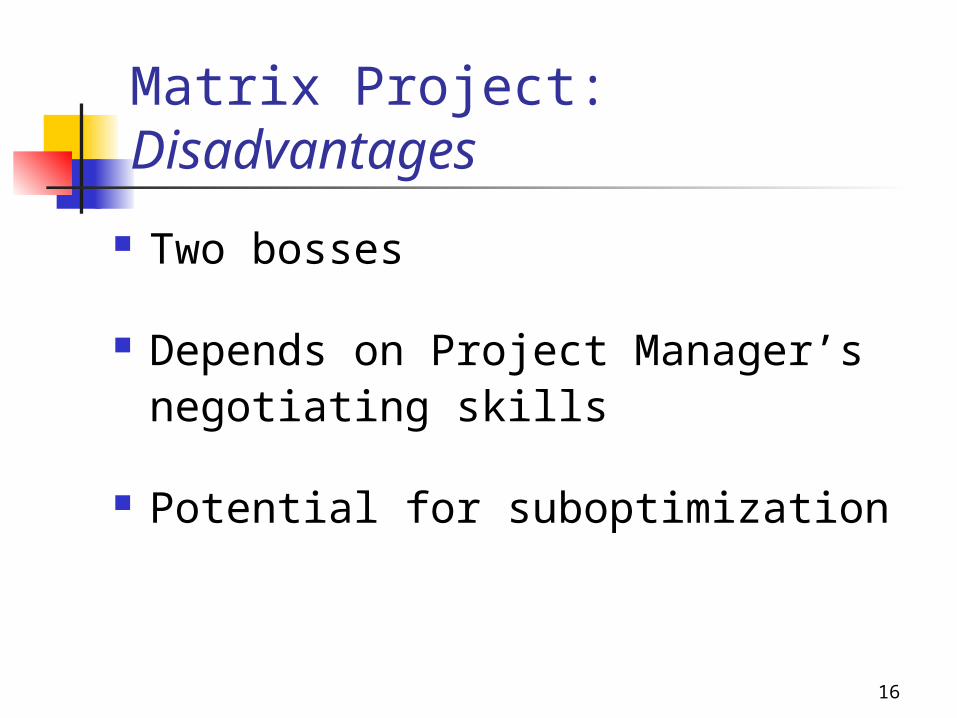
Matrix Project:Disadvantages
Two bosses
Depends on Project Manager’s negotiating skills
Potential for suboptimization
17
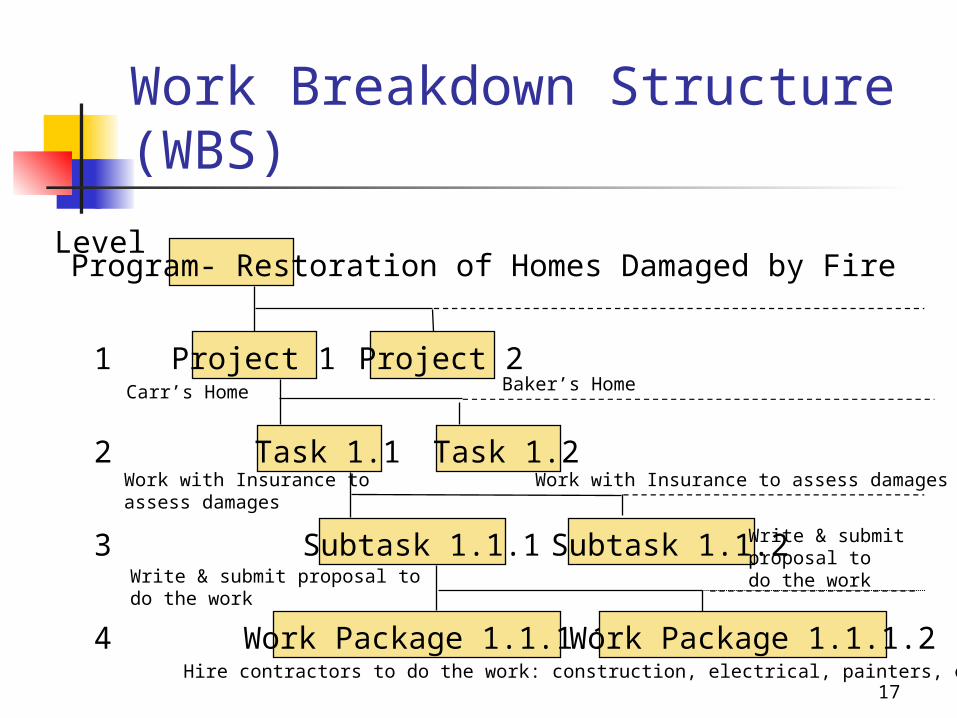
Work Breakdown Structure (WBS)
Program- Restoration of Homes Damaged by Fire
Project 1 Project 2
Task 1.1
Subtask 1.1.1
Work Package 1.1.1.1
Level
1
2
3
4
Task 1.2
Subtask 1.1.2
Work Package 1.1.1.2
Carr’s Home Baker’s Home
Work with Insurance to assess damages
Work with Insurance to assess damages
Write & submit proposal to do the work
Write & submit proposal to do the work
Hire contractors to do the work: construction, electrical, painters, etc.

18
Work Breakdown Structure
Program: New Plant Construction and Start-up
Project 1: Analytical StudyTask 1: Marketing/Production StudyTask 2: Cost Effectiveness Analysis
Project 2: Design and LayoutTask 1: Product Processing SketchesTask 2: Product Processing
Blueprints
Project 3: InstallationTask 1: FabricationTask 2: SetupTask 3: Testing and Run

19
Representing Projects: Gantt Chart
Time
Act
ivit
ies
A
B
C
D
E
20
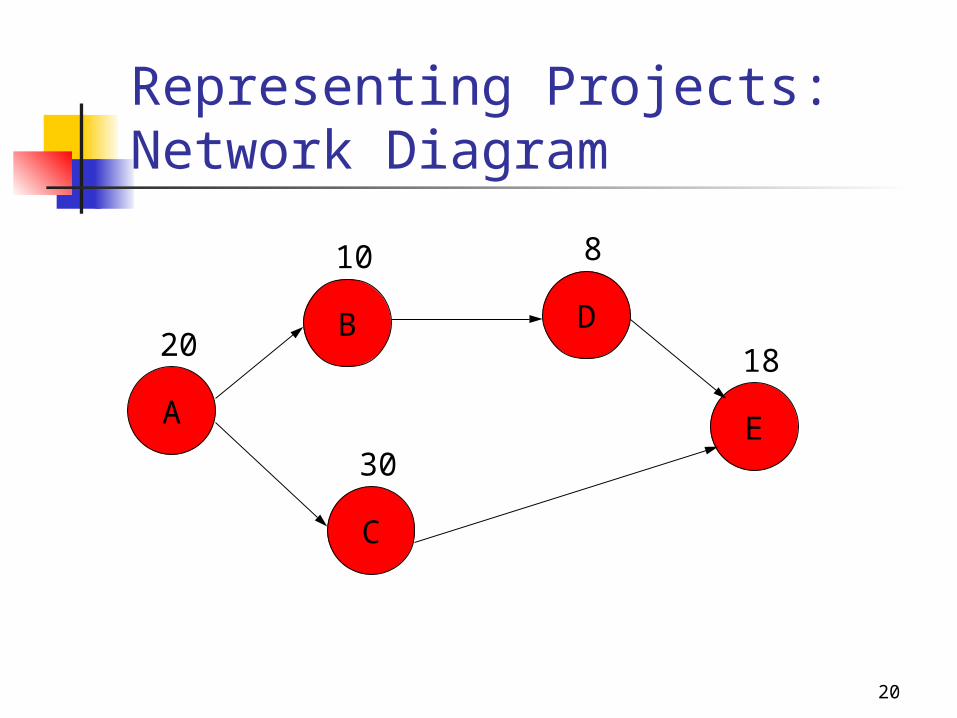
Representing Projects: Network Diagram
A
B
C
D
E
20
10
30
8
18

21
Critical Path Scheduling:CPM and PERT
CPM (Critical Path Method) J. E. Kelly of Remington-Rand and M. R.
Walker of Du Pont (1957) Scheduling maintenance shutdowns of
chemical processing plants PERT (Program Evaluation and Review
Technique) U.S. Navy Special Projects Office (1958) Polaris missile project

22
CPM (One Time Estimate)
Example 1
Consider the following consulting project:Activity Designation Immed. Pred. Time (Weeks)Assess customer's needs A None 2Write and submit proposal B A 1Obtain approval C B 1Develop service vision and goals D C 2Train employees E C 5Quality improvement pilot groups F D, E 5Write assessment report G F 1
Develop a critical path diagram and determine theduration of the critical path and slack times for allactivities
Example1 23
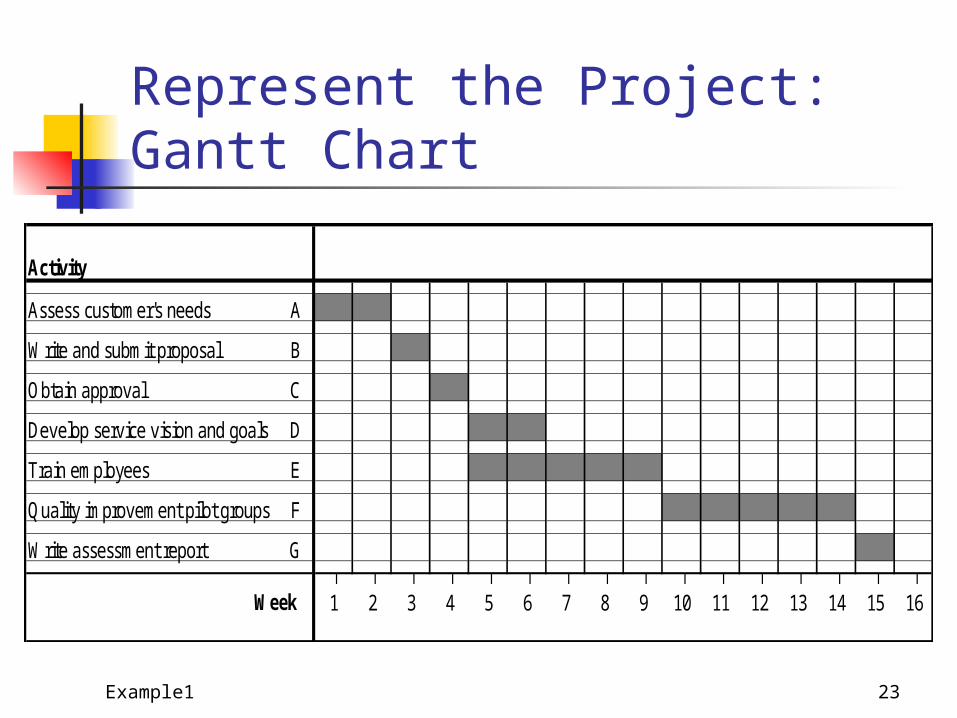
Represent the Project:Gantt Chart
Activity
Assess customer's needs A
Write and submit proposal B
Obtain approval C
Develop service vision and goals D
Train employees E
Quality improvement pilot groups F
Write assessment report G| | | | | | | | | | | | | | | |1 2 3 4 5 6 7 8 9 10 11 12 13 14 15 16Week

Example 1 24
Network Diagram
A, 2 B, 1 C, 1
D, 2
E, 5
F, 5 G, 1
Example 1 25
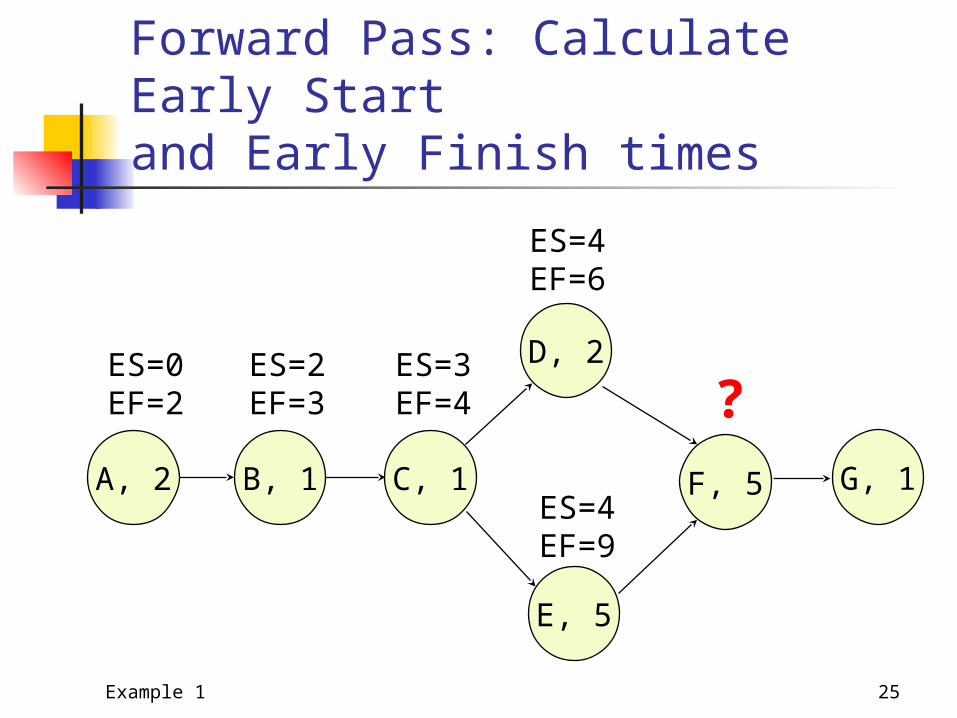
Forward Pass: Calculate Early Start and Early Finish times
ES=0EF=2
ES=2EF=3
ES=3EF=4
ES=4EF=9
?A, 2 B, 1 C, 1
D, 2
E, 5
F, 5 G, 1
ES=4EF=6
Example 1 26
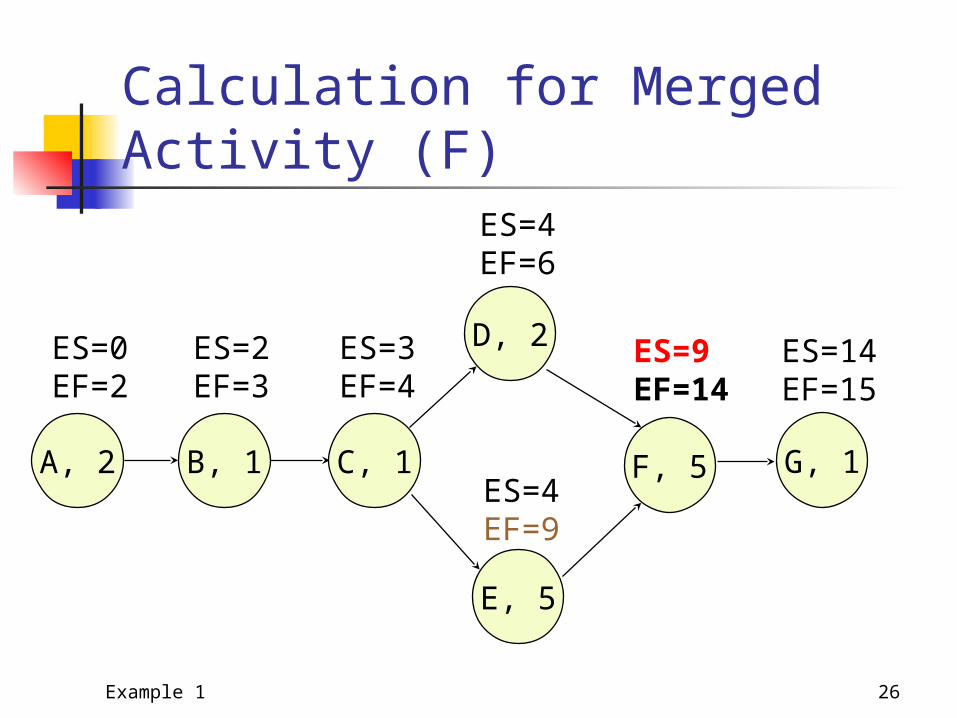
Calculation for Merged Activity (F)
ES=9EF=14
ES=14EF=15
ES=0EF=2
ES=2EF=3
ES=3EF=4
ES=4EF=9
ES=4EF=6
A, 2 B, 1 C, 1
D, 2
E, 5
F, 5 G, 1

Example 1 27
Backward Pass: Calculate Late Finish and Late Start times
ES=9EF=14
ES=14EF=15
ES=0EF=2
ES=2EF=3
ES=3EF=4
ES=4EF=9
ES=4EF=6
A, 2 B, 1 C, 1
D, 2
E, 5
F, 5 G, 1
LS=14LF=15
LS=9LF=14
LS=4LF=9
LS=7LF=9
?
Example 1 28
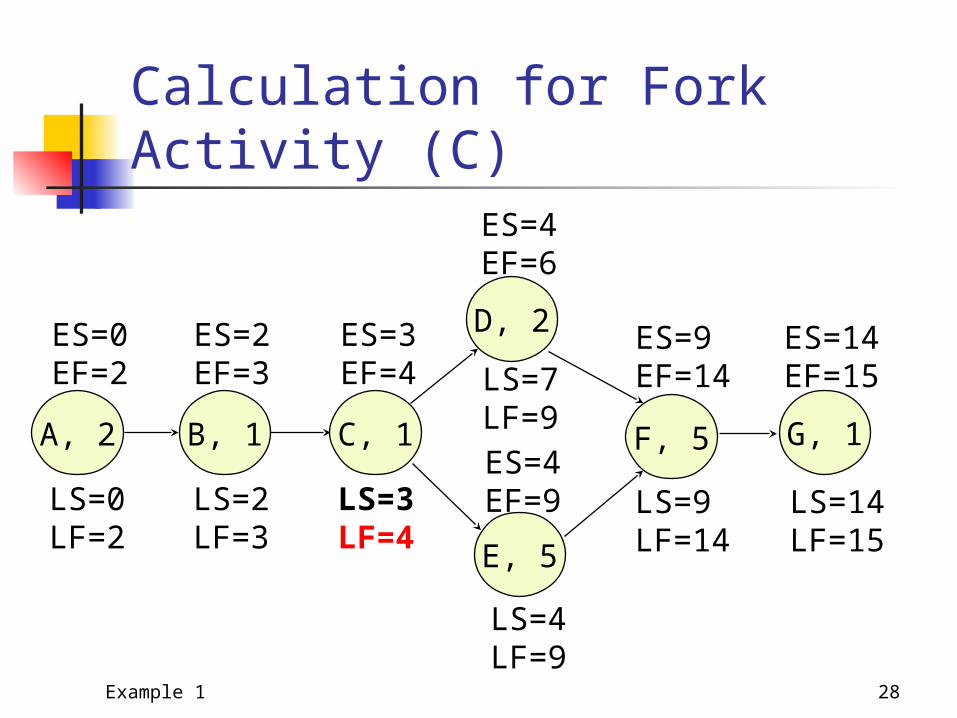
Calculation for Fork Activity (C)
ES=9EF=14
ES=14EF=15
ES=0EF=2
ES=2EF=3
ES=3EF=4
ES=4EF=9
ES=4EF=6
A, 2 B, 1 C, 1
D, 2
E, 5
F, 5 G, 1
LS=14LF=15
LS=9LF=14
LS=4LF=9
LS=7LF=9
LS=3LF=4
LS=2LF=3
LS=0LF=2
Example 1 29
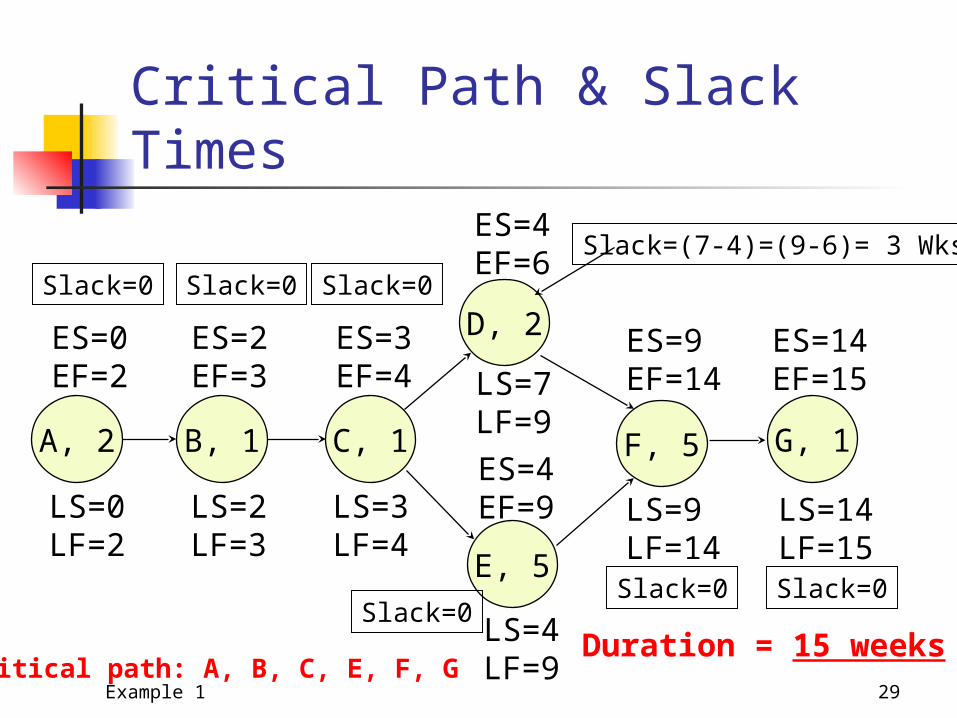
Critical Path & Slack Times
ES=9EF=14
ES=14EF=15
ES=0EF=2
ES=2EF=3
ES=3EF=4
ES=4EF=9
ES=4EF=6
A, 2 B, 1 C, 1
D, 2
E, 5
F, 5 G, 1
LS=14LF=15
LS=9LF=14
LS=4LF=9
LS=7LF=9
LS=3LF=4
LS=2LF=3
LS=0LF=2
Duration = 15 weeks
Slack=(7-4)=(9-6)= 3 Wks
Slack=0 Slack=0 Slack=0
Slack=0Slack=0 Slack=0
Critical path: A, B, C, E, F, G

Example 1 30
Summary
Q: What is the minimum time to finish the projectA: 15 weeks
Q: Which activities are critical for whole project?A: Activities A, B, C, E, F, G
Q: Which activities can be delayed, by how much?A: D, 3 weeks

31
Questions Addressed by CPM/PERT
When will the project be completed? Which tasks are most critical to ensure
timely completion of the project Which tasks can be delayed if necessary
without delaying the whole project? When there is uncertainty how likely can
the project be completed by due date?

32
Critical Path Scheduling with Three Time Estimates
Three estimates of the completion time for each activity (task)a = optimistic timem = most-likely timeb = pessimistic time

33
Solution Procedure Calculate the mean of each task time Calculate the variance of each task time Determine the critical path using the estimated time Calculate variance and the standard deviation of the critical path
Calculate probability of the time to complete the project by a certain date
34
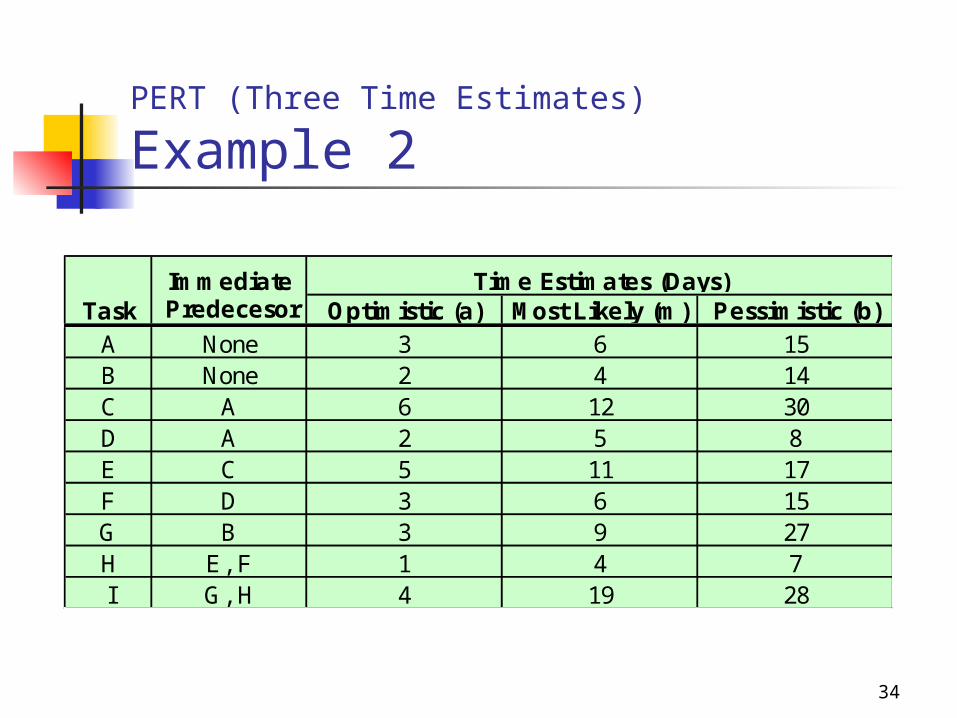
PERT (Three Time Estimates)
Example 2
ImmediateTask Predecesor Optimistic (a) Most Likely (m) Pessimistic (b)
A None 3 6 15B None 2 4 14C A 6 12 30D A 2 5 8E C 5 11 17F D 3 6 15G B 3 9 27H E, F 1 4 7I G, H 4 19 28
Time Estimates (Days)
Example 2 35
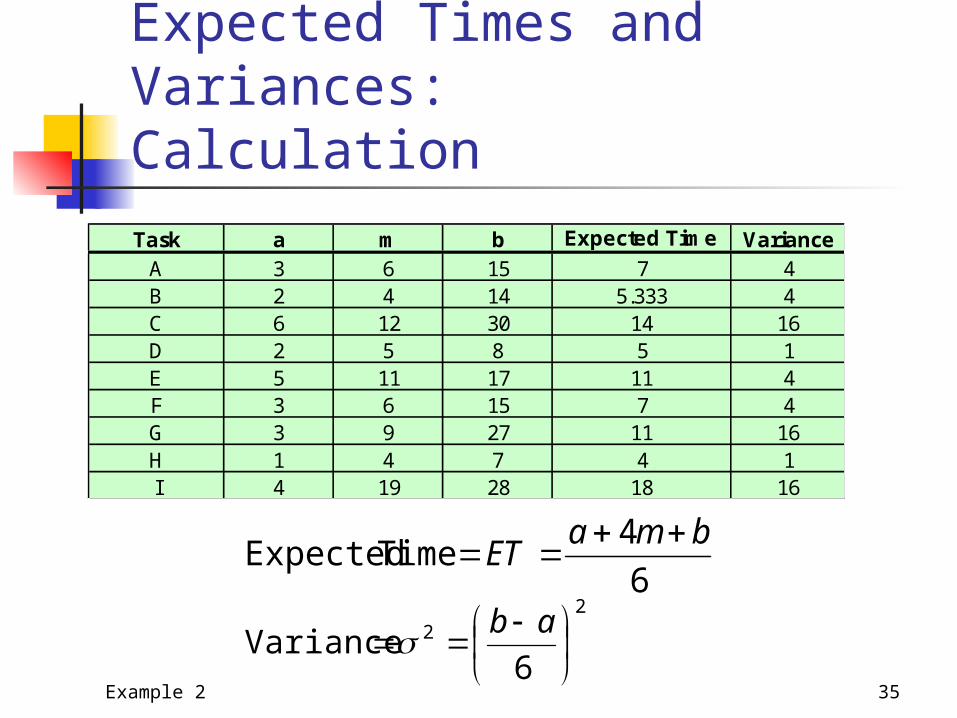
Expected Times and Variances:CalculationTask a m b Expected Time Variance
A 3 6 15 7 4B 2 4 14 5.333 4C 6 12 30 14 16D 2 5 8 5 1E 5 11 17 11 4F 3 6 15 7 4G 3 9 27 11 16H 1 4 7 4 1I 4 19 28 18 16
6
4Time Expected
bmaET
22
6Variance
ab
Example 2 36
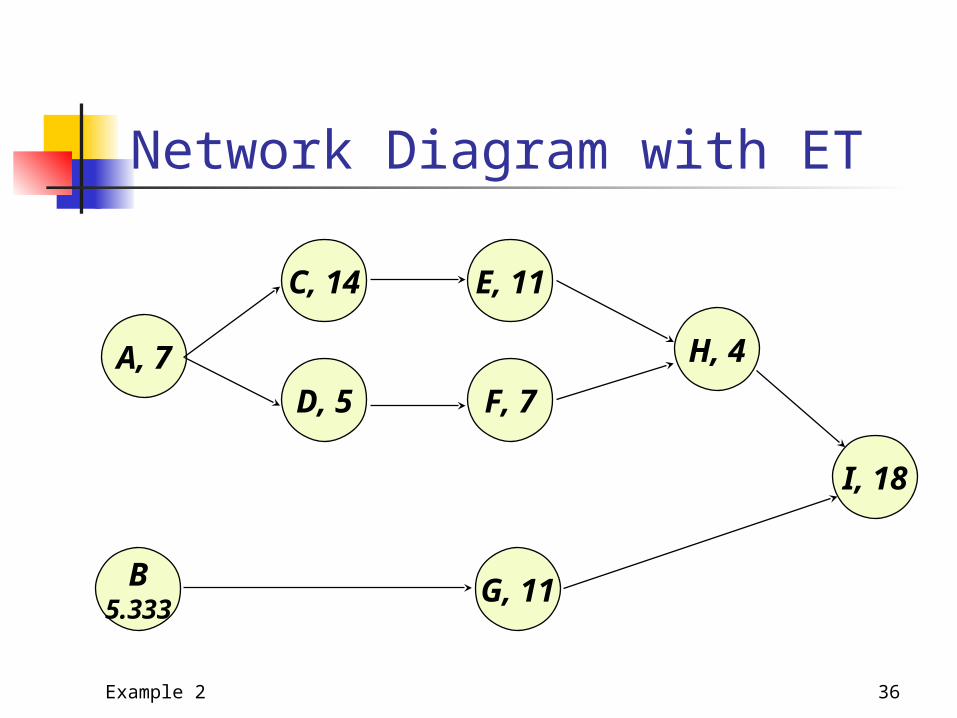
Network Diagram with ET
A, 7
B5.333
C, 14
D, 5
E, 11
F, 7
H, 4
G, 11
I, 18
Example 2 37
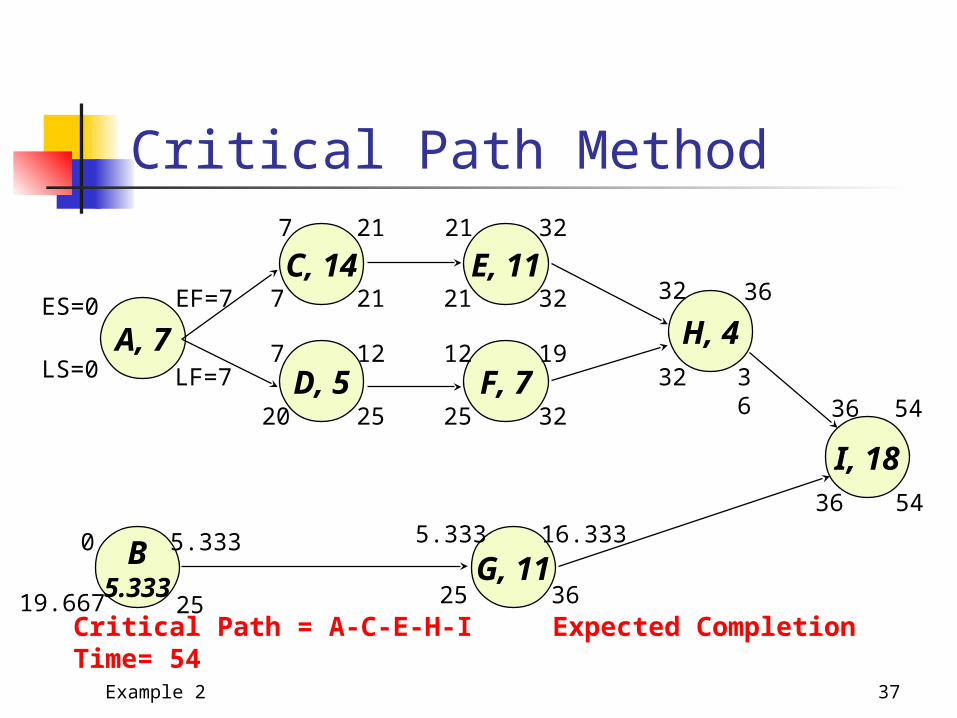
Critical Path Method
A, 7
B5.333
C, 14
D, 5
E, 11
F, 7
H, 4
G, 11
I, 18
ES=0
LS=0
EF=7
LF=7
0
19.667
5.333
25
7 21
7 21
7 12
20 25
21 32
21 32
12 19
25 32
32 36
32
36
5.333 16.333
36
36 54
36 54
25Critical Path = A-C-E-H-I Expected Completion Time= 54

38
Formulas
Calculate standard deviation of the critical path
Calculate probability of the time to complete the project (T) base on the statistic: 2
cp
2cp
ETDZ
D = Due date
TE = Expected project completion
time
2cp
= variance of a task on critical path
Example 2 39
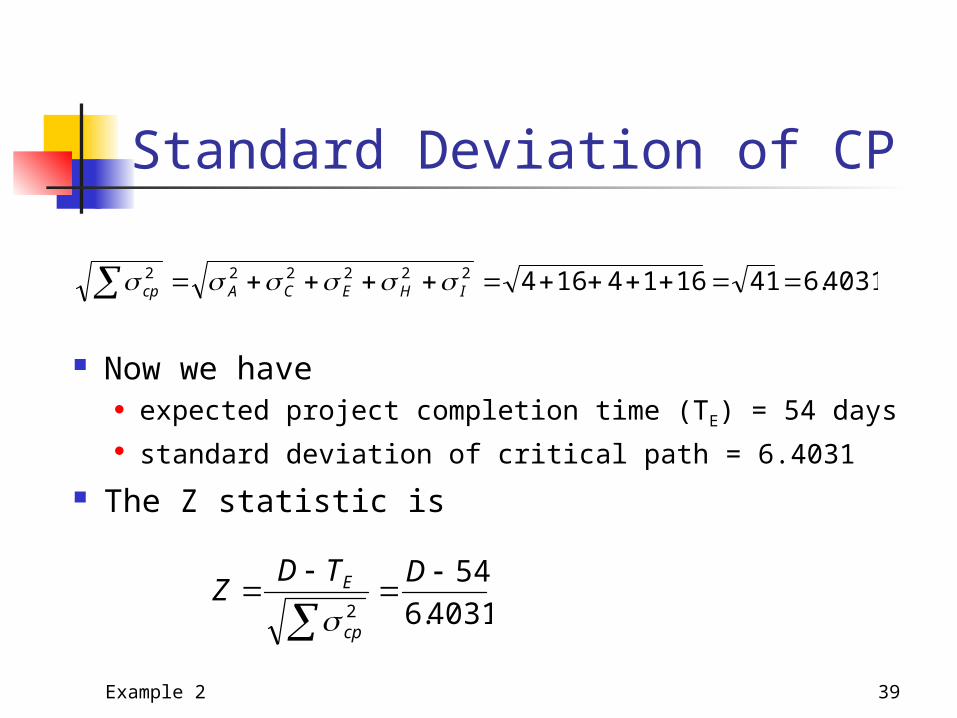
Standard Deviation of CP
4031.6411614164222222 IHECAcp
Now we have expected project completion time (TE) = 54 days standard deviation of critical path = 6.4031
The Z statistic is
4031.6
542
DTD
Zcp
E

Example 2 40
Calculate Probabilities of Completion
What is the probability of finishing this project in less than 53 days?
Solution: Since D = 53,
P(T < D) = P(Z < -0.1562) .5 - .0636 = .436, or 43.6 %
(See Appendix D)
TTE = 54
P(T < D)
1562.04031.6
5453
4031.6
54
D
Z
53

Example 2 41
Calculate Probabilities of Completion
What is the probability that the project duration will exceed 56 weeks?
Solution: Since D = 56,
P(T > D) = P(Z > 0.3123) .5 - .1217 = .377, or 37.7 %
(See Appendix D)
TTE = 54
3123.04031.6
5456
4031.6
54
D
Z
P(T > D)
56

42
Expediting A Project
Time-Cost Model Motivations to accelerate a project
Avoid late penalties Get incentive payments for early completion Free resources for other uses
Basic Assumption: some activities can be expedited, at a cost
Time-Cost Tradeoff Problem What is the optimum project schedule based
on time-cost tradeoffs?
43
Time-Cost Relationships Activity Direct Costs—direct labor
expenses, materials, per-diem expenses—increase as the project duration is shortened
Project Indirect Costs—overhead, facilities, resource opportunity cost—increase as project completion time increases
44
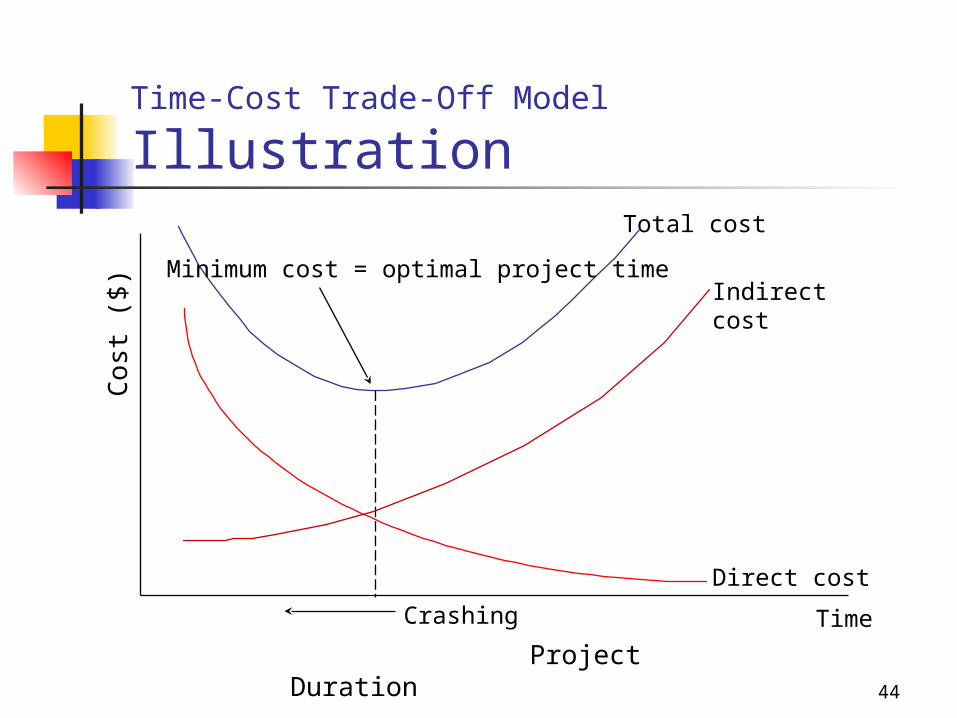
Time-Cost Trade-Off Model
IllustrationC
ost
($
)
Project Duration
Crashing
Total cost
Indirect cost
Direct cost
Minimum cost = optimal project time
Time
45
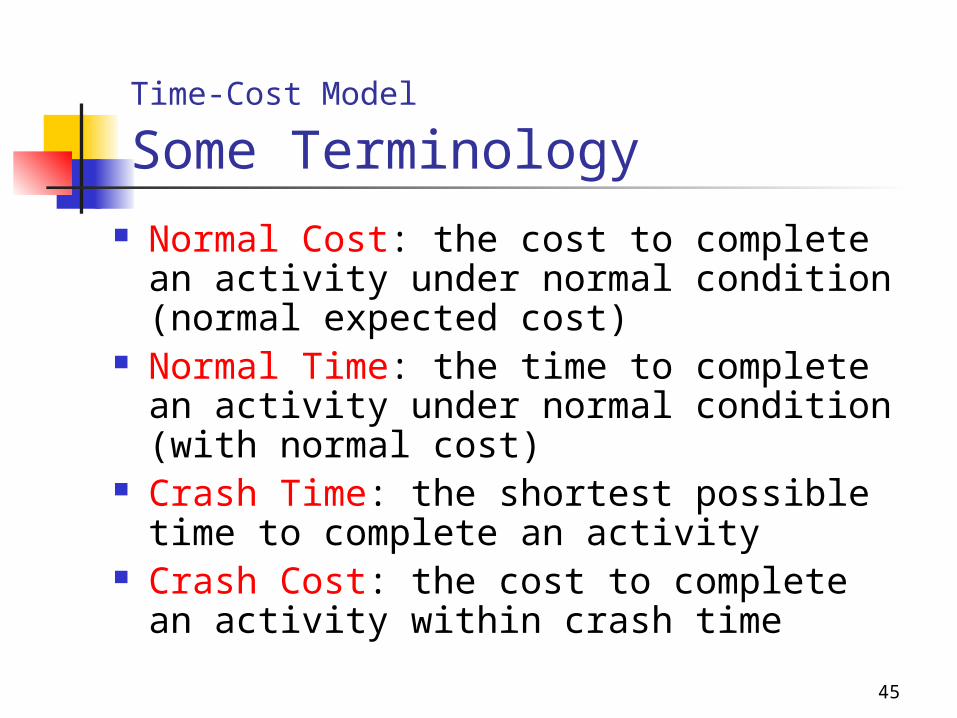
Time-Cost Model Some Terminology
Normal Cost: the cost to complete an activity under normal condition (normal expected cost)
Normal Time: the time to complete an activity under normal condition (with normal cost)
Crash Time: the shortest possible time to complete an activity
Crash Cost: the cost to complete an activity within crash time
46
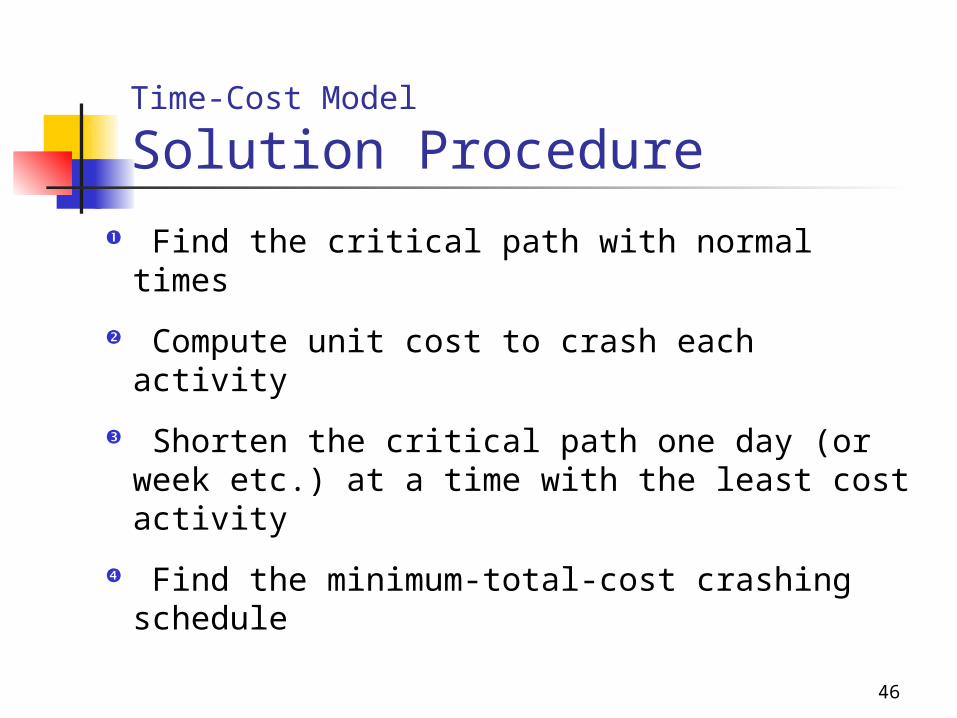
Time-Cost Model
Solution Procedure
Find the critical path with normal times
Compute unit cost to crash each activity
Shorten the critical path one day (or week etc.) at a time with the least cost activity
Find the minimum-total-cost crashing schedule
47
Time-Cost Model
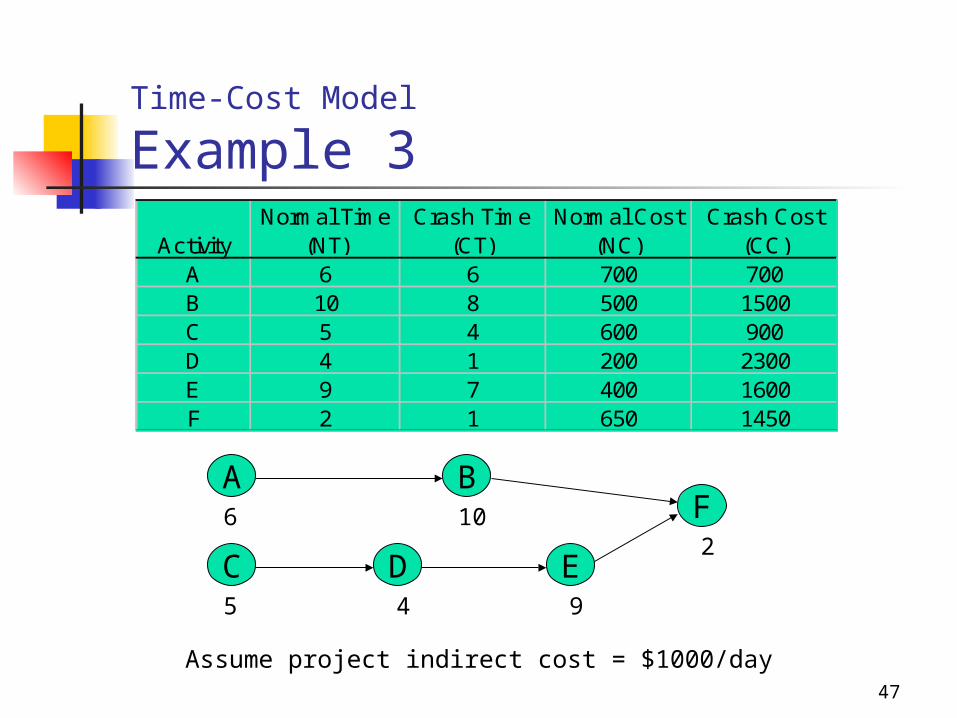
Example 3
ActivityNormal Time
(NT)Crash Time
(CT)Normal Cost
(NC)Crash Cost
(CC)A 6 6 700 700B 10 8 500 1500C 5 4 600 900D 4 1 200 2300E 9 7 400 1600F 2 1 650 1450
A BF
C D E
6 10
5 4
2
9
Assume project indirect cost = $1000/day

Example 3 48
Critical Path and Unit Crash Cost Determine normal critical path
A-B-F: Duration = 18 C-D-E-F: Duration = 20 (critical path)
Calculate cost per day to crash
Activity NT CT NC CCCost per day to crash
(CC-NC)/(NT-CT)Available days to crash
(NT-CT)A 6 6 700 700 - -B 10 8 500 1500 500 2C* 5 4 600 900 300 1D* 4 1 200 2300 700 3E* 9 7 400 1600 600 2F* 2 1 650 1450 800 1
Example 3 49
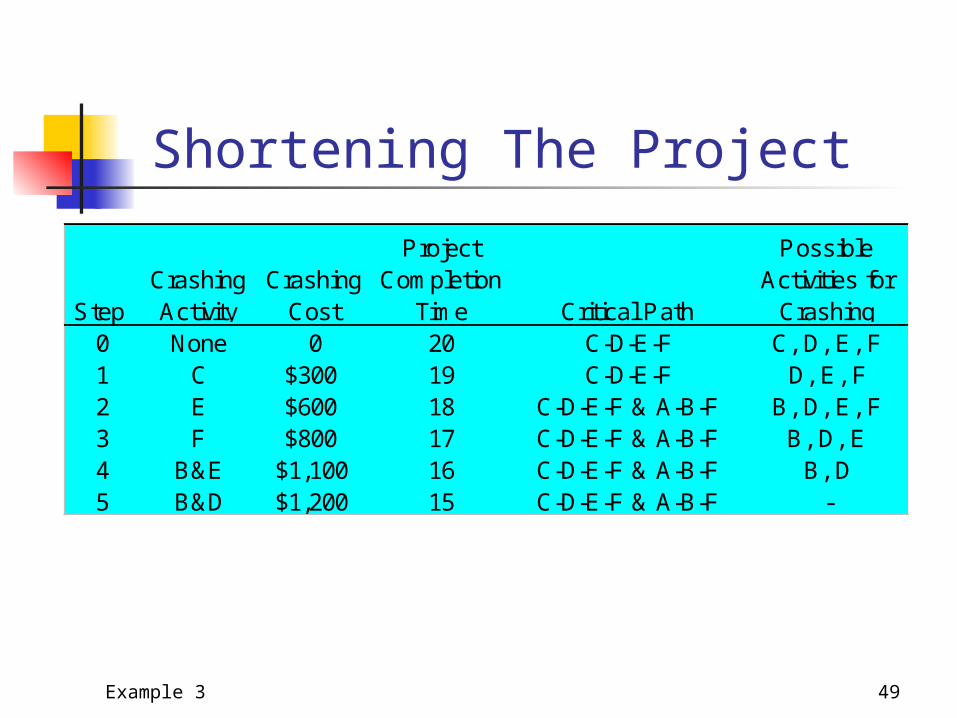
Shortening The Project
Step Crashing Activity
Crashing Cost
Project Completion
Time Critical Path
Possible Activities for
Crashing 0 None 0 20 C-D-E-F C, D, E, F1 C $300 19 C-D-E-F D, E, F2 E $600 18 C-D-E-F & A-B-F B, D, E, F3 F $800 17 C-D-E-F & A-B-F B, D, E4 B&E $1,100 16 C-D-E-F & A-B-F B, D5 B&D $1,200 15 C-D-E-F & A-B-F -

Example 3 50
What Is the Best Schedule?Project
DurationCumulative Crashing
Costs Indirect Costs Total Cost20 0 20($1000)=$20000 $20,00019 $300 19($1000)=$19000 $19,30018 $300+$600=$900 18($1000)=$18000 $18,90017 $900+$800=$1700 17($1000)=$17000 $18,70016 $1700+$1100=$2800 16($1000)=$16000 $18,80015 $2800+$1200=$4000 15($1000)=$15000 $19,000
$18,000
$19,000
$20,000
$21,000
14 15 16 17 18 19 20 21
Project duration
To
tal c
os
t
51
Caveat on the Following CPM/PERT Assumptions Project activities can be identified as
entities with a clear beginning and ending point for each activity
Project activity sequence relationships can be specified and networked
Project control should focus on the critical path
The expected activity times and variances in PERT are based on beta distribution