mcc water, sanitation and hygiene (wash) project mongolia · methodology. participants in the...
TRANSCRIPT

Background
As described in World Bank’s 2015 report in 2012, Improving Sanitation in the Ger Areas of Ulaanbaatar (conference version), Ulaanbaatar had a population of 1.2 million living in nine districts.1 An estimated 768,000 people including most of the low-income households, currently live in the Ger areas.
Less than 1% of Ger area residents are connected to a piped water supply. More than 96% buy water at kiosks (there are around 600) and transport it to their homes. While the UN (2013) suggests that individuals have access to 20 to 50 liters of water daily for drinking, cooking, and cleaning purposes, the average consumption of Ger residents was reported very low at 10 liters / person / day (World Bank, 2010).
Factors accounting for low consumption of water in Ger areas are reported to include: distance of water kiosks from households, short period of daily water distribution at the kiosks, consumption differences between the winter and summer months, low frequency of bathing and use of public baths irregular clothes washing, and reuse of water without treatment.
Rapid Assessment
Between August and October 2016, University Research Co., LLC (URC), in collaboration with Mongolia Marketing Consulting Group (MMCG), conducted a rapid assessment to assess and analyze water consumption, access, supply and demand and detail the potential causes for extremely low levels of water use among residents of Ger districts in Ulaanbaatar, Mongolia.
The majority of Ulaanbaatar’s residents live in Ger areas yet studies about the current access to water and its consumption by
residents insufficiently represent the complete picture of the residents’ water management. Therefore, this rapid assessment was conducted to (i) assess and analyze water consumption, access, supply and demand among Ger area residents and (ii) detail the potential drivers of what appears in previous studies to be low water use. To accomplish these objectives the team developed and applied data collection tools to determine a) actual time spent by households in activities related to water; b) water consumption amounts for households including family-focused activities and businesses and c) management of water supply kiosks and bathhouses.
The assessment will be a guiding document that will assist the Millennium Challenge Corporation (MCC) and its Second Compact Development team to better develop a proposal on Ger area water supply improvements.
In addition, the assessment has triggered the need for further thorough studies on water-related businesses as well as wastewater management/sanitation issues in Ger areas.
FACT SHEET
MCC Water, Sanitation and Hygiene (WASH) Project—Mongolia
20181World Bank (2015) Improving Sanitation in the Ger Areas of Ulaanbaatar, Conference Version.
Ger area Tier Actual Number of House-
holds %, Actual Sample size %, Sample
Khan-Uul Fringe 28,364 14.2 150 18.5
Bayanzurkh Middle 32,560 16.3 110 13.6
Fringe 15,507 7.8 60 7.4
Bayangol Middle 11,670 5.8 70 8.6
Sukhbaatar Middle 8,080 4.0 10 1.2
Fringe 9,782 4.9 60 7.4
Chingeltei Middle 16,890 8.4 110 13.6
Fringe 13,352 6.7 30 3.7
Songino Khairkhan Middle 16,693 8.3 60 7.4
Fringe 47,183 23.6 150 18.5
Grand Total 200,081 100.0 810 100.0
Table 1: Sample weighting from actual household numbers in selected Ger areas
Millennium Challenge Corporation (MCC) WASH Project Globally, MCC is putting an increasing institutional focus on related policy and institutional reform and on integrating be-havior change and community development into WASH pro-jects to enhance intended health benefits. As part of this broader focus, URC is supporting the MCC Human and Com-munity Development (HCD) Practice Group to consolidate sec-tor and economic impact literature and best practice to justify and support optimal design of WASH projects in Sierra Leone, Liberia, Indonesia, and Mongolia.

Methodology
Participants in the household portion of this Assessment represented their households and were those identified as responsible for the water management of their households. We did not select those who collect the water, and we did not make any effort to interview the head of household as is conventionally done.
The Assessment team prioritized and selected six areas from the total of nine Ger areas: Khan-Uul, Bayangol, Sukhbaatar, Chingeltei and Songino Khairkhan. A sample size of 810 households was determined as the basis of the Assessment. This 810 household sample size weighted against a total of 200,081 households in the six areas, was reasonably distributed across the various geographical locations, and showed balance across middle and fringe tiers (Table 1).
The Rapid Assessment team designed three tools for use in the Rapid Assessment: (i) Household data collection tool, (ii) Kiosk Manager data collection tool, and (iii) Bathhouse Manager data collection tool. The Household tool was pretested and used to train enumerators before its application in the field. The Kiosk Manager tool and the Bathhouse Manager tool were used in the field by MMCG staff exclusively, so neither pretesting nor training was required.
Data collection started with 15 enumerators and 3 supervisors on August 18, 2016. Enumerators worked in pairs in assigned areas. During the entire data collecting and validation period, supervisors controlled and monitored enumerators in the field and at the operation office of MMCG. The tablet-based SurveyToGo program for data collection was used to facilitate digital data management.
Data quality control included the following methods:
1. Checking GPS coordinates with target kheseg maps and Google maps
2. Checking uploaded audio voice recordings fully for the first three days completely reviewing 311 household interviews
3. Connecting with sampled respondents by phone and asking confirmation questions
53.8% of interviews were checked through these methods. The MMCG team provided URC and MCC weekly reports on data collection progress, including numbers of households and kiosks interviewed and brief updates on the data collection process and quality control.
Assessment Findings
The survey confirmed low water usage among households compared to international guidelines. But, also showed a high level of satisfaction by households with the adequacy of their water consumption. 93.3% of households responded that their current water supply was adequate to meet all household needs. However, this might indicate that people have adapted well to low water consumption or lack knowledge about alternative benefits of greater consumption.
Key issues identified include:
Supply
Water is supplied to Ger area residents through multiple channels. These include trucks, local wells, and central
distribution. The Rapid Assessment team interviewed a small selection of kiosk managers, 15 in total, to gather preliminary information about kiosk operations, manager demographics, and challenges.
Limited income opportunities for female-headed households 80.0% of kiosk managers were women, and one-third of the female managers are heads of their households. Their monthly salaries and bonus generate, on average, just about half of their household incomes. If kiosk supplies were expanded to meet consumption targets and consumer priorities (as expressed in willingness to pay for improved service), then more kiosk management positions could be made available, or water tariffs were increased to generate more income for managers.
Constraints to growing household businesses Of households operating businesses in their kiosks, less than half (44.7%) use water. The extent to which this represents a lost opportunity for business development in water-reliant activities (food and textile processing) is unknown. But, based on Rapid Assessment data, one can presume that business opportunities are lost, as more water intensive activities are not widely occurring.
Poor reservoir hygiene and water quality risk 38.5% of kiosk managers interviewed were not aware of standards or regulations governing the activities and conditions around kiosks. 66.7% of respondent kiosk managers reported that the methods and frequency of cleaning water reservoirs is enough to ensure water safety. However, 71.4% of the kiosk managers reported unhygienic cleaning without special cleaning agents.
Access
Ger area residents access water to meet household needs from multiple locations. These include commercial kiosks (both
Water Collection at a Public Kiosk

privately and publicly managed), natural sources for which no tariff is paid, external locations including apartment’s of others and business offices, bottled water, municipal connections to households, and external commercial operations such as bathhouses. Rapid Assessment data clearly show that over 90% of households use water obtained from kiosks to meet most household needs. One significant exception is showering by adults. In this exception, over 2/3 of households regularly pay for showering at bathhouses. These findings are consistent throughout the year – in both warm and cold months. Key issues identified include:
Trips for water collection are time consuming Travel to and wait time at kiosks to collect water takes, on average, 28 minutes. Twenty-eight minutes for water fetching is very close to 30 minutes, the time at which global research demonstrates that families will begin to lower their consumption of water so as to limit their fetching burden.
Cold weather safety risks Households clearly prioritized their low satisfaction with the safety of the environment around the kiosks in the cold months. Cold weather safety is decreased primarily through icy conditions resulting from minor but regular spillage at and around the kiosk water collection point.
Demand
93.3% of households reported that the volume of water they collect from all sources provides enough water to meet all of their needs. Therefore, limited water supply does not appear to be a problem faced by residents from their perspective establishing a likely obstacle to increasing demand and therefore consumption. However, there appears to be considerable latent demand for improved water supply service as all respondents expressed a willingness to pay almost double the current tariff for specific improvements in service including extended hours and days of operation, proximity of kiosks to households, and ensuring minimal wait times.
Latent but no overt demand Willingness to pay analyses and the consistent record of increases in water consumption with improvements in service (e.g., using private kiosks,
initiative smart card use) indicate that residents will consume more water when the environment is conducive for them to do so.
Consumption
The hypothesis underlying this Rapid Assessment was that water consumption was extremely low in Ger areas and a detriment to prosperity. The data presented in Table 2, calculated for a “typical” household, confirm low water usage among households compared to international guidelines. A “typical” household for application to tabulated consumption estimates was taken as 2 adults, 1 child between the ages of 5 and 16, and 1 child under the age of 5 years.
Low, acceptable, but open to change Consumption across all demographics is low compared to global standards, but the Rapid Assessment found it to be higher then previous published estimates of 10 liters / person / day.
Potential Interventions
Potential interventions for further due diligence and action identified through the Rapid Assessment include:
Improve operation and maintenance for customer-friendly kiosks, emphasizing smart card kiosks. 100% of smart card devices are sometimes or always broken or damaged, 40% of smart card facilities make no effort to reduce mud at the kiosk in warm months, 73.3% of kiosks were found to sometimes suffer from damage or breakdowns, and reported average repair times vary from 4.7 hours in fringe areas to 2.3 hours in middle areas. These issues create uncertainty among customers and revenue loss for managers.
Apply principles of human centered design to improve kiosk environments Residents most often use manual water carts for water fetching, particularly women who collect water and those who collect water for female-headed households. Negative environmental factors compound already poor physical access. Further, most kiosks are located close to main roads or other streets, thus when people arrive to take water from the kiosk, it causes traffic jams. The most common difficulty for both kiosk mangers and customers is that the people who use cars to collect water stop too closely to the kiosks, creating safety hazards for
Typical (median) household water consump-tion
Water source
Family of four*
Liters / person / day
Warm months Cold months
Water fetching Kiosk 17.9 12.0
Bathing Non-kiosk 6.8 5.1
TOTAL TYPICAL HOUSEHOLD CONSUMPTION (liters/person/day) 24.7 17.1
Selected households only
Car washing (44.2% of households) Kiosk 0.6 0.0
Gardening (22.7% of households) Kiosk 14.7 0.0
Business activities (0.3% of households) Kiosk 7.2 7.2
Car washing (44.2% of households) Non-kiosk 0.4 0.0
Gardening (22.7% of households) Natural sources 7.4 0.0
*As of 2012, the Ulaanbaatar Statistic Department reported that the average number of members of a family was 3.9
Table 2: Typical household consumption of a family of four.
other customers and occupying the most level portions of the landscape.
Improve options for wastewater management Over 90% of households and all bathhouses dispose of wastewater to latrines and/or sink pits in both the warm and cold seasons. These are either allowed to seep into the ground potentially contaminating groundwater sources tapped by wells, or they must be pumped by truck. On average, a bathhouse that disposes of large volumes of shower and laundry water requires pit emptying five times per month. Limited anecdotal interview data collected outside of this Rapid Assessment demonstrated that it is relatively common for households in some areas to throw water in the streets in the winter, when the cold freezes sink pits and latrines causing them to fill fast and overflow. These findings indicate that there may be an opportunity to improve the management of sink pits and/or pit latrines in order to reduce al fresco disposal and associated cold season risks.
Support the Water Supply and Sewerage Authority (USUG) in creating and adopting a gender and equity strategy This Assessment reveals that men and women, and female-headed and male-headed households have different water use practices and access constraints. It would be helpful for USUG to do a gender and equity audit of their operations and customers.
Support expanded application of participatory planning Greater effort at participatory planning might assist USUG in determining a means of easing the constraints on kiosk access and use. Opportunities include encouraging use of participatory methodologies for community engagement in planning and delivery of water management services, building upon community consultation forums to ensure their engagement in local infrastructure prioritization and budgeting, and ensuring reach to those communities for which community organizations are less active.
Facilitate innovative water delivery systems to households Investigate solutions of low-cost water delivery for those families for whom physical restraints make collection exceedingly burdensome.
Pilot and build capacity for private sector service delivery options
There are numerous private sector opportunities that might be exploited in Ger areas that are currently under-developed. These include:
Latrine pumping (with potential recycling for fertilizer)
Sink pit pumping (with potential greywater recycling)
Well development (multi-family)
Formalization and regulation of WASH-related private services
Create water service clusters by extending piped connections to businesses/service adjacent to kiosks with central connections. Examine the market for business opportunities that require water, and that are amenable to the environment of Ger areas.
Launch a competition/call for creative ideas for localized and innovative solutions to address Ger are consumption and wastewater needs
Investigate opportunities for multi-khashaa centralized, safe 40-80m wells with home piped connections that could withstand low temperatures Ice accumulation at a typical kiosk Travel and waiting time are constraints to any effort to expand water consumption. Creative infrastructure options should be explored to decentralize water provision and support the transformation of USUG from a direct service provider to a supervisor of an expanded network of service providers.
Explore tariff options 83.0% of households reported that the water price in kiosks is affordable23, and an additional 5.5% describe the water price as cheap or very cheap. These findings combined with the expressed willingness to pay by households of roughly twice the current tariff24 for specific improvements in service indicate an opportunity for simultaneously improving service and revenue to support the improvements.
Support safe consumption in Ger areas in line with international guidelines Assessment data show that improved service is likely to generate increases in consumption – and that there is room for tariff increases to support improved services. While the data indicate a high level of satisfaction with current consumption, other findings demonstrate willingness for residents to adopt higher levels of service and consumption. International consumption standards should be used as a service level target and infrastructure improvements and advocacy efforts coordinated to move consumption toward them.
Behavior change communication on hygiene and safe consumption Kiosks, because they are frequently visited, centrally located, and operated by long-acknowledged active community members could serve as an ideal focal point for community-wide behavior change communication. Though not analyzed specifically in this Rapid Assessment, common topics including boiling of drinking water, handwashing, issues of prestige and cleanliness, al fresco wastewater disposal, and safe transportation and storage of drinking should be expected to be core topics for behavior change communication involving conventional IEC approaches as well as more innovative social marketing and/or hygiene promotion methodologies.
7200 Wisconsin Avenue, Suite 600 Bethesda, Maryland 20814 USA
+1-301-654-8338 www.urc-chs.com
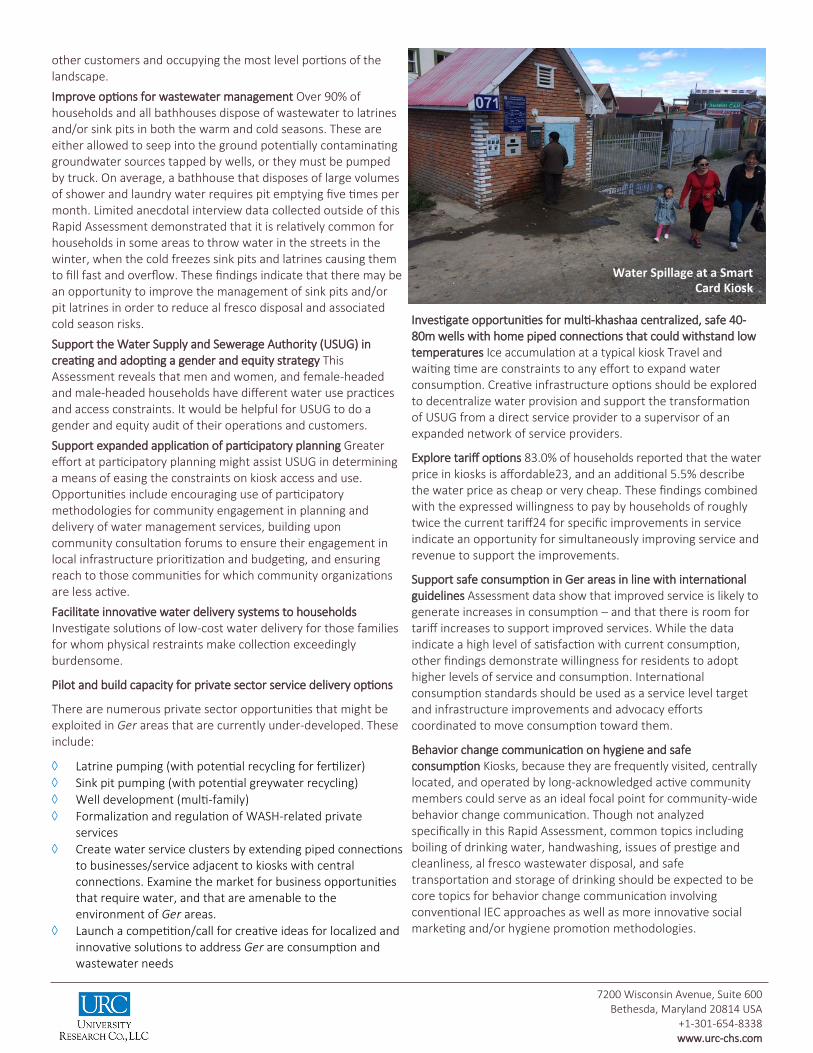
Water Spillage at a Smart Card Kiosk