mcgill university report of the finance committee · report of the finance committee page 1...
TRANSCRIPT

Report of the Finance Committee Page 1
Secretariat 845 Sherbrooke St. West, room 313 Montreal, QC, H3A 0G4 Tel: (514) 398-3948 | Fax: (514) 398-4758
The following items arise from the Finance Committee meeting of February 8, 2018. They are presented to the Board of Governors for its information.
I. FOR THE INFORMATION OF THE BOARD OF GOVERNORS
1. Update on Financing Plan for Deferred Maintenance and IT Initiatives [F17-11]
Further to the Board’s approval of a $400 million financing plan to support investment in the University’s accumulated deferred maintenance and information technology needs, the Finance Committee was informed that as at December 31, 2017, $121.2M had been committed to approved capital projects, out of $300M allocated to meet the University’s most pressing deferred maintenance needs. The Finance Committee was also informed that as at December 31, 2017, $84M had been committed to approved IT-related projects, out of $100M allocated to meet the University’s most pressing information technology needs.
2. Evolution of Operating Net Assets: Quebec Universities [F17-12]
The Finance Committee received a report on how McGill compares to other Quebecuniversities in terms of GAAP deficit and other indicators in the budget. The Committeewas presented with the Operating Net Assets on a GAAP basis and adjusted for purposesof calculating the subvention conditionnelle by the government. The presentation includedthe forecasted results for the year ending April 30, 2018.
3. Financial Instruments: Derivatives for Covering Interest Rate Risk [F17-13] from the $400 Million Borrowing Information
The Committee received an update on the implementation and operation of derivativeinstruments used for hedging the unwanted risks associated with the borrowing plan forthe deferred maintenance and information technology initiative. The Committee wasinformed of the potential usage of provincial bond forward to lock the Quebec spread inaddition to federal bond rates.
MCGILL UNIVERSITY BOARD OF GOVERNORS
Report of the Finance Committee GD17-40 Board of Governors Meeting of February 15, 2018
Report of the Finance Committee Page 2
4. Financial Scenarios in Support of Royal Victoria Hospital Initiative [F17-14]
The Committee was presented with various financial scenarios in support of the RoyalVictoria Hospital project, further to the strategic working sessions held with the Building andProperty Committee (BPC) to consider this initiative. In approving a list of conditions to formpart of the negotiation mandate with the government, the Executive Committee requested thatit be subject to a financing plan in support of the initiative. The Committee will considerfinancial plans in a special meeting, on February 23, 2018.
5. Budget Implementation 2017-18 Year-to-Date [F17-15] Report on Quarterly Financial Results for Fiscal Period Ended October 31, 2017
The Committee received a quarterly report on the financial results for the period ended onOctober 31, 2017, including financial variance reports.
6. Budget Planning 2018-19 Report II [F17-16]
The Committee received the second of three presentations concerning the FY2019University budget. The Presentation in support of the budget planning exercise is attachedas Appendix A
7. Annual Report on External Borrowing [F17-10]
The Committee received a report on outstanding capital borrowings for the year endingJanuary 31, 2018. The maximum amount borrowed during the 12-month period endedJanuary 31, 2018 was $144 million in June 2017. There were no borrowings during January2018, a first occurrence of such in the past five years.
END February 2018

Budget Planning II
FY2018 Forecastand Outlook for FY2019-FY2023
Presentation to Board of Governors on February 15, 2018 DRAFT | CONFIDENTIAL
Prof. Christopher Manfredi, Provost and Vice‐Principal (Academic)
GD17-40 Appendix A

Budget Planning II: FY2018 Forecast and Outlook for FY2019‐FY2023 | DRAFT | CONFIDENTIAL
This presentation represents the status of our revenue and expense modeling as of January 30, 2018.
At this early point, the revenue and expense estimates are becoming more precise.
Safe Harbour Statement
2

Budget Planning II: FY2018 Forecast and Outlook for FY2019‐FY2023 | DRAFT | CONFIDENTIAL
McGill has reached a watershed moment in its budgeting
We are on the cusp of major change in how the province finances universities.
We are on the verge of undertaking an unprecedented capital renewal of our campus.
McGill has had to file a Plan de redressement with the government and has to demonstrate a return to balanced budget over the next few years.
Meeting these challenges presents major challenges to our operating budget
Looking ahead FY2019-FY2023
3

Budget Planning II: FY2018 Forecast and Outlook for FY2019‐FY2023 | DRAFT | CONFIDENTIAL
Initial forecast for FY2018 ($M)
Anticipated major operating budget variances for FY2018 ($M)
Annual financed operating deficit FY2018 Nov. budget update
Higher than anticipated tuition
Higher than anticipated sales of goods and services
Higher than anticipated Federal grants
Higher than anticipated building & occupancy costs
Higher than anticipated support staff salaries & payments
Higher than anticipated contract services
Higher than anticipated professional fees
Net variations in all other revenue and expense categories
Annual financed operating deficit FY2018 forecast
($9.9M)
$13.2M
$10.2M
$2.7M
($15.4M)
($10.3M)
($6.0M)
($4.6M)
$5.9M
($14.2M)
4

Budget Planning II: FY2018 Forecast and Outlook for FY2019‐FY2023 | DRAFT | CONFIDENTIAL
To forecast for the current year, we started by looking at actual expenses and commitmentsfor each of 38 revenue and expense categories.
We plotted the activity in each revenue and expense category monthly for the 12 months ineach of FY2015, FY2016, and FY2017, as well as the first nine months of FY2018.
We then used the three prior year results, and current year activities to date, to forecast the anticipated activity for February, March, and April 2018 in each one of the 38 revenue and expense categories.
Forecasting Method
5

Budget Planning II: FY2018 Forecast and Outlook for FY2019‐FY2023 | DRAFT | CONFIDENTIAL
McGill is continuously refining its revenue estimate for its largest revenue category. The amount that we receive from the ministry on a monthly basis is based on historical expectations, and does not match the amount being generated by our current student cohort. Our forecast reflects the latter, even though these corrections will only appear in the government grant two years from now.
McGill will need to change the way it looks at spending in order to meet strategic challenges.
Are our budget rules maximizing our ability as an institution to meet our challenges?
Are we effectively using our revenues in such a way that allows us to meet our challenges?
Are we taking advantage of changes in personnel or structures to re‐examine the way we do things? To find better ways?
Is incremental revenue being shared in as efficient a way as possible with our academic units?
Looking ahead FY2019-FY2023: Revenues
6

Timeline for FY2018 Revenue (FTE-driven) Projections
Budget Planning II: FY2018 Forecast and Outlook for FY2019‐FY2023 | DRAFT | CONFIDENTIAL
FY2018 Revenue Model Inputs
McGill‐controlled Ministry‐controlled
Bachelors Enrolment
Deregulated Enrolment
Graduate New Registrations
QC (basic) Tuition Rate
ROC and Int'l Supplement
Rate
Support Grant
($ per FTE)
Teaching Grant
($ per WFTE)
Nov/Dec 2016 Enrolment plans for BY18 prepared following ES/Dean GPS meetings with Deans targets targets targets assumption assumption assumption assumption
Jan 31, 2017 (FY17 Q3) FY17 tuition collection estimates stabilize (Required input for FY18 tuition projections) targets targets targets assumption assumption assumption assumption
Apr 6, 2017 VRAAF: Taux de croissance du revenu disponible par habitant updated targets targets targets preliminary assumption assumption assumption
FY2018 Budget Finalized
May 8, 2017
Indexation des droits de scolarité des étudiants étrangers et canadiens non‐résidents du Québec pour l'année universitaire 2017‐2018
targets targets targets confirmed confirmed assumption assumption
May 19, 2017 Orientations Budgétaires targets targets targets confirmed confirmed confirmed confirmed
Oct 15, 2017 Fall census enrolment date Enrolment actuals(FTEs estimated)
Enrolment actuals(FTEs estimated)
New registration actuals
(winter new registrations & FTEs estimated)
confirmed confirmed confirmed confirmed
Oct 31, 2017 (FY18 Q2) FY18 tuition collection estimates (high‐level)
Jan 31, 2018 (FY18 Q3) FY18 tuition collection estimates stabilize; preliminary FY18 FTE data available Preliminary FTEs available confirmed confirmed confirmed confirmed
Apr 30, 2018 (FY18 Q4) FY18 tuition collection actuals; FY18 FTE data stabilizes
FTEs stabilize (Ministry submissions for winter 2018 not yet final) confirmed confirmed confirmed confirmed
7
= Inputs which may change (preliminary, estimates, etc.) = Inputs which are confirmed and unlikely to change
Budget Planning II: FY2018 Forecast and Outlook for FY2019‐FY2023 | DRAFT | CONFIDENTIAL
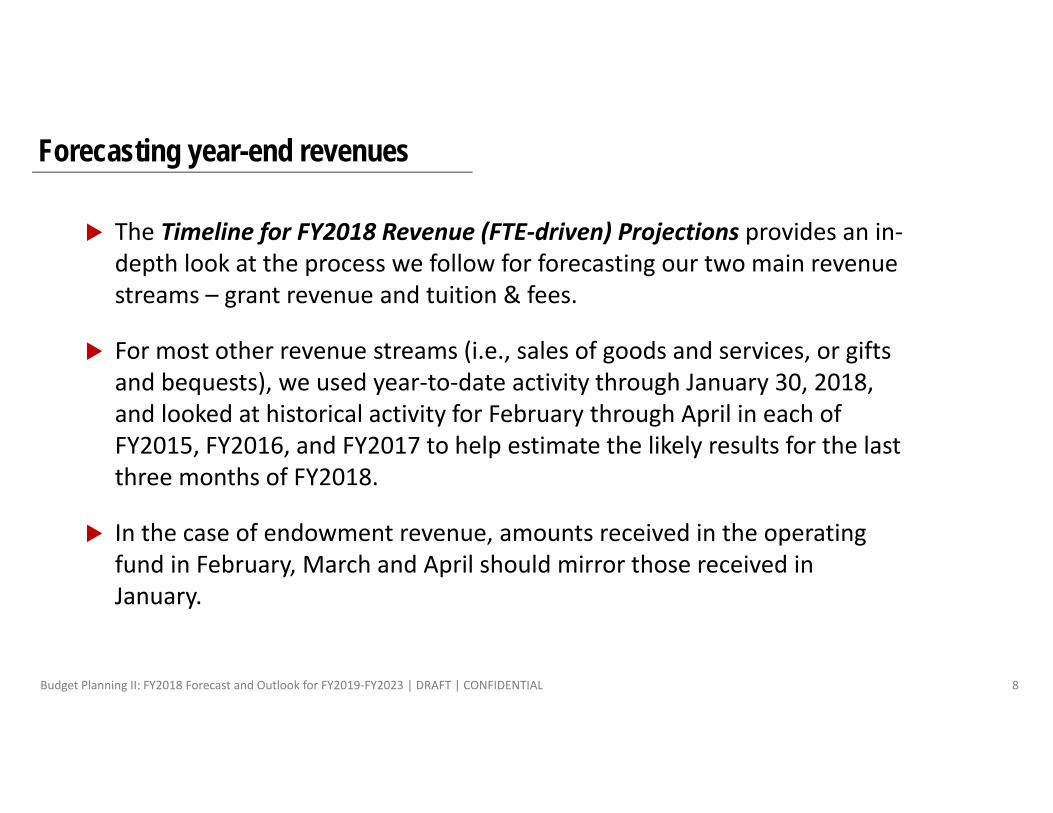
The Timeline for FY2018 Revenue (FTE‐driven) Projections provides an in‐depth look at the process we follow for forecasting our two main revenue streams – grant revenue and tuition & fees.
For most other revenue streams (i.e., sales of goods and services, or gifts and bequests), we used year‐to‐date activity through January 30, 2018, and looked at historical activity for February through April in each of FY2015, FY2016, and FY2017 to help estimate the likely results for the last three months of FY2018.
In the case of endowment revenue, amounts received in the operating fund in February, March and April should mirror those received in January.
Forecasting year-end revenues
8

Timeline for FY2018 Revenue (non-FTE-driven) and Expense Forecast
Budget Planning II: FY2018 Forecast and Outlook for FY2019‐FY2023 | DRAFT | CONFIDENTIAL
FY2018 Forecast Model Inputs
Finance Banner (APB)
FBM/BPX(Units)
Self service on‐demand Variance reports with prorated budgets
Jan, 2018
Initial forecast: examine year‐to‐date revenues and expenses, and use historical patterns and updated
assumptions to prepare annual forecastJan 30, 2018 Budget Presentation II to P7Jan 31, 2018 (Q3 end, available Feb 8, 2018) Populate FBM/BPX templates
Feb 2, 2018 Budget Presentation II to Finance Committee
Feb 19, 2018 FBM/BPX validation begins (unit forecasts)
Mar 12, 2018 FBM/BPX validation ends
Mar 16, 2018 FBM/BPX lockdown (Comparison of Unit Forecasts with Initial Forecast)
Mar 29, 2018 Budget Presentation III to P7
Apr 4, 2018 Budget Presentation III to Finance Committee (Final Forecast)
9
APB = Analysis, Planning and Budget; FBM = Financial Budget Model; BPX = Budget Planning Exercise

Budget Planning II: FY2018 Forecast and Outlook for FY2019‐FY2023 | DRAFT | CONFIDENTIAL
Invest in top priorities
Principal’s priorities
Provost’s strategic academic plan elements
Recommendations from Provost’s Task Force on Indigenous Studies and Indigenous Education
Review all other potential investments, including academic hiring
Consider salary mass control options for administrative and support staff
Review overhead rates
Review carry‐forward rules
Looking ahead FY2019-FY2023: Expenses
10

Budget Planning II: FY2018 Forecast and Outlook for FY2019‐FY2023 | DRAFT | CONFIDENTIAL
Some expense line items are relatively easy for forecast from one year to the next. For example, we forecast Tenure Track Salaries using the actual expenses as of the current date, and the commitments to the end of April, and we then factor in a slight adjustment based on historical patterns. The forecast is easier to pinpoint because few tenure track faculty arrive and depart mid‐year.
Support Staff Salaries and Payments are also relatively predictable, although the overall cost increases consistently throughout the year due to the use of casual employees and overtime. As with the revenue streams, we used year‐to‐date activity through January 30, 2018, and looked at historical activity for February through April in each of FY2015, FY2016, and FY2017 to help estimate the likely results for the last three months of FY2018.
Forecasting year-end expenses
11
Budget Planning II: FY2018 Forecast and Outlook for FY2019‐FY2023 | DRAFT | CONFIDENTIAL
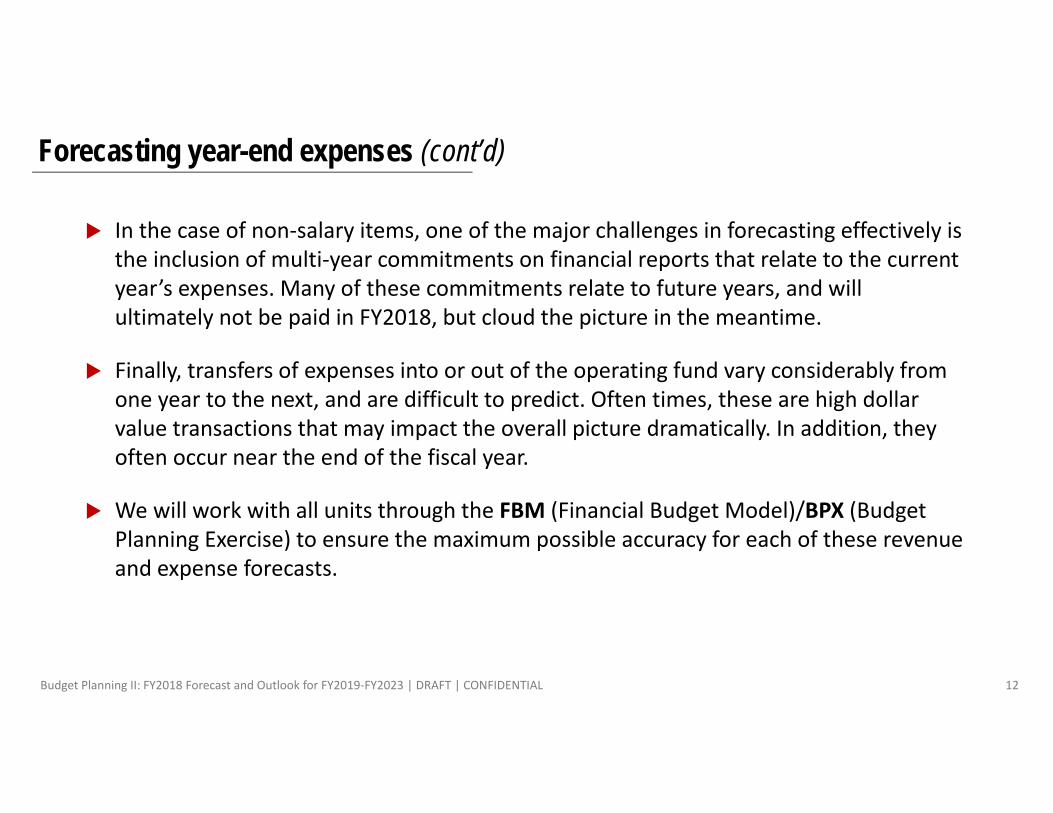
In the case of non‐salary items, one of the major challenges in forecasting effectively is the inclusion of multi‐year commitments on financial reports that relate to the current year’s expenses. Many of these commitments relate to future years, and will ultimately not be paid in FY2018, but cloud the picture in the meantime.
Finally, transfers of expenses into or out of the operating fund vary considerably from one year to the next, and are difficult to predict. Often times, these are high dollar value transactions that may impact the overall picture dramatically. In addition, they often occur near the end of the fiscal year.
We will work with all units through the FBM (Financial Budget Model)/BPX (Budget Planning Exercise) to ensure the maximum possible accuracy for each of these revenue and expense forecasts.
Forecasting year-end expenses (cont’d)
12

Budget Planning II: FY2018 Forecast and Outlook for FY2019‐FY2023 | DRAFT | CONFIDENTIAL
Operating Budget: Past, present and future outlook (Preliminary - $000s)
5‐year outlook FY2018(b)(from budget book)
FY2018(f) FY2019(o) FY2020(o) FY2021(o) FY2022(o) FY2023(o)
Total revenues 815,031 836,765 844,389 865,478 885,300 904,369 919,288
Total expenses (1) (824,960) (850,972) (854,389) (872,978) (890,300) (906,869) (919,288)
Annual financed surplus (deficit) (9,929) (14,207) (10,000) (7,500) (5,000) (2,500) 0
Financed accumulated deficit (118,007)(2) (128,007) (135,507) (140,507) (143,007) (143,007)
Financed accumulated deficit/Revenues (%) 14.10% 15.16% 15.66% 15.87% 15.81% 15.56%
(1) Excluding year‐end actuarial adjustments and related accruals(2) FY2017 ending financed accumulated deficit = $103,800
b = budget; f = forecast; o = outlook
13
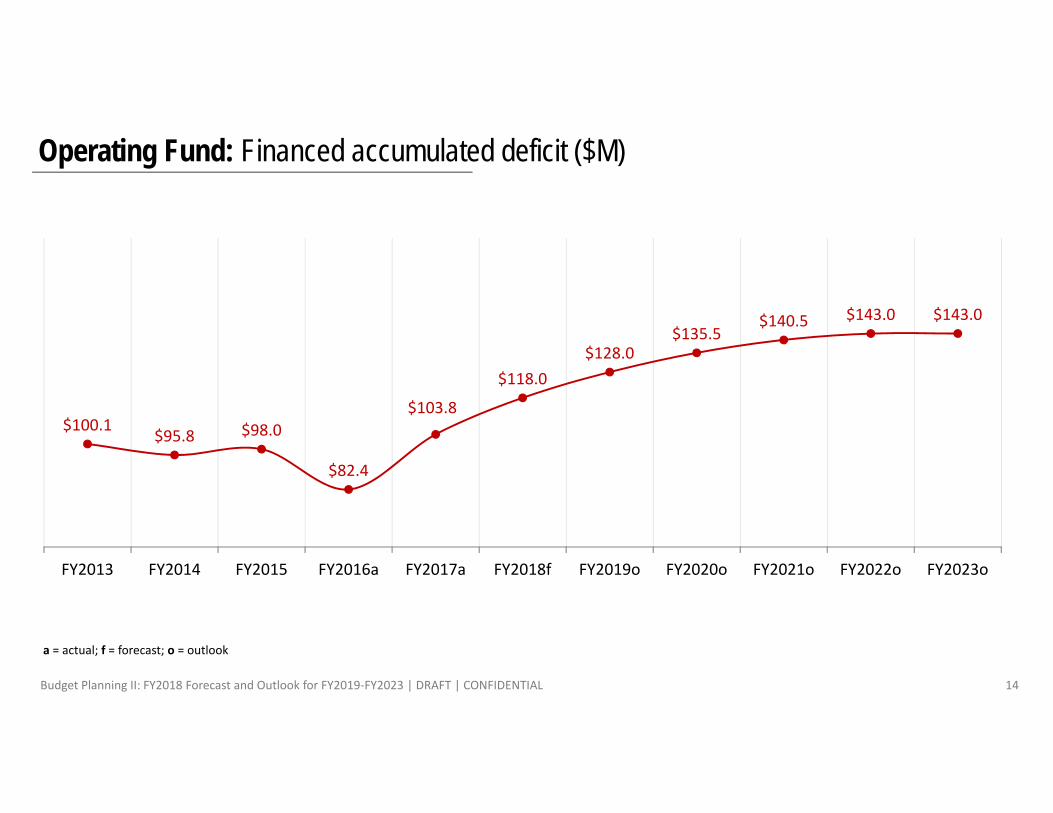
Operating Fund: Financed accumulated deficit ($M)
Budget Planning II: FY2018 Forecast and Outlook for FY2019‐FY2023 | DRAFT | CONFIDENTIAL
$100.1$95.8 $98.0
$82.4
$103.8
$118.0$128.0
$135.5$140.5 $143.0 $143.0
FY2013 FY2014 FY2015 FY2016a FY2017a FY2018f FY2019o FY2020o FY2021o FY2022o FY2023o
a = actual; f = forecast; o = outlook
14

Projected McGill capital allocations from the capital budget FY2018 ($M)
Budget Planning II: FY2018 Forecast and Outlook for FY2019‐FY2023 | DRAFT | CONFIDENTIAL
Institutional Priorities (includes Faculty base allocations, Start‐ups, administrative unit allocations) (1),
$9.5 (21%)
Campus Facility Maintenance (2), $3.0 (7%)
IT Projects (including Libraries) (3), $1.9 (4%)
Classroom and teaching lab renovations and universal access projects, managed by working
groups (4), $4.4 (10%)
Deferred Maintenance to address the backlog (2),
$25.3 (56%)
Contingencies, $1.0 (2%)
(1) Portfolio: Institutional Priorities(2) Portfolio: Physical Infrastructure(3) Portfolio: IT Infrastructure(4) Portfolio: Student Life and Learning
FY2018 Total:$45.1
15

Budget Planning II: FY2018 Forecast and Outlook for FY2019‐FY2023 | DRAFT | CONFIDENTIAL 16
Master Plan – Operating costs analysis
McGill Current gsm (gross square meters) – All campuses
Dry Wet Lease Other Total
Recognized 10,569 116,829 907 484,695 613,000
Not recognized 26,093 210,907(1) 237,000
Inventory 10,569 116,829 27,000 695,602 850,000 (1) Residences, Athletics, indoor parking, etc.
Current Operating Costs ($M)
MEES GrantsTeaching space $38.3Research space $19.6
Lease grant $0.4
McGillTeaching & Research space $26.1
$36.5(2)Leases $10.4
Total Operating Costs $94.8
Costs per gsm ($/gsm or $/sq.ft.)
$94.8M = $115.5/gsm(or $10.73/sq.ft)850,000
gsm
(2) McGill assumes 38.5% of the total costs

Budget Planning II: FY2018 Forecast and Outlook for FY2019‐FY2023 | DRAFT | CONFIDENTIAL
[A] Capital Payment ‐ ‐ ($0.72) ($8.61) ($8.61) ($8.61)
[B] Interest payment ‐ ‐ ($10.78) ($14.39) ($14.39) ($14.39)
[D] Rate lock (M to M) ($1.20) ‐ ‐ ‐ ‐ ‐
[E] Interest earned $1.43 $0.51 $0.97 $4.68 $6.65 $6.07
[F] Expenses ‐ ($0.67) ($0.57) ‐ ‐ ‐
‐ ‐($11.50)
($23.00) ($23.00) ($23.00)
FY2018 FY2019 FY2020 FY2021 FY2022 FY2023
[C=A+B] Net cash flow for McGill Operating Fund
Assumptions: 1. Assume realistic scenario2. Assume the sell of residences in 2021 for $175M3. Assume investment return of 2.5% reinvested in the amortization fund4. Assume payment of interest in 2018 and 2019 from bond proceeds5. McGill injection used to pay interest + finance the amortization Fund
Impact of Capital Investments on University Funds ($M)
17

Discussion
Questions
Comments
Concerns
Suggestions